Embed Size (px)
Citation preview

Atmos. Chem. Phys., 16, 1937–1953, 2016
www.atmos-chem-phys.net/16/1937/2016/
doi:10.5194/acp-16-1937-2016
© Author(s) 2016. CC Attribution 3.0 License.
Ammonia in the summertime Arctic marine boundary layer:
sources, sinks, and implications
Gregory R. Wentworth1, Jennifer G. Murphy1, Betty Croft2, Randall V. Martin2, Jeffrey R. Pierce3,2,
Jean-Sébastien Côté4, Isabelle Courchesne4, Jean-Éric Tremblay4, Jonathan Gagnon4, Jennie L. Thomas5,
Sangeeta Sharma6, Desiree Toom-Sauntry6, Alina Chivulescu6, Maurice Levasseur4, and Jonathan P. D. Abbatt1
1Department of Chemistry, University of Toronto, 80 St. George Street, M5S 3H6, Toronto, Canada2Department of Physics and Atmospheric Science, Dalhousie University, 6310 Coburg Road, B3H 4R2, Halifax, Canada3Department of Atmospheric Science, Colorado State University, 3915 W. Laporte Ave., 80523, Fort Collins, USA4Department of Biology, Université Laval, 1045 avenue de la Médicine, G1V 0A6, Québec City, Canada5Sorbonne Universités, UPMC Univ. Paris 06, Université Versailles St-Quentin, CNRS/INSU, LATMOS-IPSL,
Paris, France6Science and Technology Branch, Environment Canada, 4905 Dufferin Street, M3H 5T4, Toronto, Canada
Correspondence to: Jennifer G. Murphy ([email protected])
Received: 24 September 2015 – Published in Atmos. Chem. Phys. Discuss.: 2 November 2015
Revised: 4 February 2016 – Accepted: 5 February 2016 – Published: 22 February 2016
Abstract. Continuous hourly measurements of gas-phase
ammonia (NH3(g))were taken from 13 July to 7 August 2014
on a research cruise throughout Baffin Bay and the eastern
Canadian Arctic Archipelago. Concentrations ranged from
30 to 650 ng m−3 (40–870 pptv) with the highest values
recorded in Lancaster Sound (74◦13′ N, 84◦00′W). Simul-
taneous measurements of total ammonium ([NHx]), pH and
temperature in the ocean and in melt ponds were used to
compute the compensation point (χ), which is the ambient
NH3(g) concentration at which surface–air fluxes change di-
rection. Ambient NH3(g) was usually several orders of mag-
nitude larger than both χocean and χMP (< 0.4–10 ng m3) in-
dicating these surface pools are net sinks of NH3. Flux cal-
culations estimate average net downward fluxes of 1.4 and
1.1 ng m−2 s−1 for the open ocean and melt ponds, respec-
tively. Sufficient NH3(g) was present to neutralize non-sea-
salt sulfate (nss-SO2−4 ) in the boundary layer during most
of the study. This finding was corroborated with a histor-
ical data set of PM2.5 composition from Alert, Nunavut
(82◦30′ N, 62◦20′W) wherein the median ratio of NH+4 /nss-
SO2−4 equivalents was greater than 0.75 in June, July and Au-
gust. The GEOS-Chem chemical transport model was em-
ployed to examine the impact of NH3(g) emissions from
seabird guano on boundary-layer composition and nss-SO2−4
neutralization. A GEOS-Chem simulation without seabird
emissions underestimated boundary layer NH3(g) by several
orders of magnitude and yielded highly acidic aerosol. A
simulation that included seabird NH3 emissions was in bet-
ter agreement with observations for both NH3(g) concentra-
tions and nss-SO2−4 neutralization. This is strong evidence
that seabird colonies are significant sources of NH3 in the
summertime Arctic, and are ubiquitous enough to impact
atmospheric composition across the entire Baffin Bay re-
gion. Large wildfires in the Northwest Territories were likely
an important source of NH3, but their influence was prob-
ably limited to the Central Canadian Arctic. Implications
of seabird-derived N-deposition to terrestrial and aquatic
ecosystems are also discussed.
1 Introduction
Ammonia (NH3(g)) is the dominant alkaline gas in the at-
mosphere and is an important component of the global ni-
trogen cycle. Its transport and deposition can have harmful
effects for N-sensitive ecosystems such as eutrophication,
loss of biodiversity and soil acidification (Krupa, 2003). The
presence of NH3(g) can impact climate by increasing rates
of new particle formation via stabilization of sulfuric acid
clusters (Kirkby et al., 2011). Gas-phase NH3 is also able
Published by Copernicus Publications on behalf of the European Geosciences Union.

1938 G. R. Wentworth et al.: Ammonia in the summertime Arctic marine boundary layer
to partition to acidic fine particulate matter (PM2.5) to form
particulate-phase ammonium (NH+4(p)), which alters various
aerosol properties, such as scattering efficiency (Martin et al.,
2004), hygroscopicity (Petters and Kreidenweis, 2007), ice
nucleating ability (Abbatt et al., 2006), and heterogeneous
chemistry occurring on surfaces (Fickert et al., 1999).
As a result, the accurate quantification of the magni-
tude and location of NH3(g) sources is important for chem-
ical transport models (CTMs). The major anthropogenic
source is agriculture (fertilization and animal husbandry)
with biomass burning, transport, and industry being minor
contributors (Reis et al., 2009). Natural sources include soils,
vegetation, oceans and animal excreta (Sutton et al., 2013).
Estimates for the annual global emissions of NH3(g) range
from 35 to 54 Tg N yr−1; however, large uncertainties ex-
ist for these values due to the area-wide nature (emissions
spread over a large spatial extent) and poor characterization
of many sources. In remote marine environments, the ocean
is thought to be the dominant source of NH3(g) to the ma-
rine boundary layer and delivers an estimated 6–8 Tg N yr−1
to the atmosphere globally (Sutton et al., 2013). The domi-
nant sources of oceanic NHx (≡NH3+NH+4 ) include rem-
ineralization of organic matter by bacteria and phytoplank-
ton excretion (Carpenter et al., 2012). However, NHx is an
extremely labile nutrient for microbes such that assimilation
by phytoplankton and bacteria prevents significant accumu-
lation in surface waters. Nonetheless, there exists a pool of
dissolved ammonia (NH3(sw)) available for exchange with
the atmosphere.
In order to compute sea–air NH3 fluxes, simultaneous
measurements of both atmospheric NH3(g) and oceanic NHxare required. These measurements are extremely challenging
due to low ambient concentrations and complications arising
from making ship-based measurements (e.g. proximity to hu-
man activity can cause artefacts). As a result, to our knowl-
edge only six previous studies have simultaneously quanti-
fied both [NH3(g)] and oceanic [NHx], leading to extremely
large uncertainties for both the direction and magnitude of
global sea–air NH3 fluxes (Asman et al., 1994; Geernaert et
al., 1998; Gibb et al., 1999; Johnson et al., 2008; Quinn et
al., 1988, 1990). Johnson et al. (2008) provided the most re-
cent data set and summarized the previous studies to show
that the open ocean can be both a net source and a net sink
of NH3(g), with sea surface temperature (SST) being a key
determinant for the direction of flux. Colder SST reduces the
emission potential due to increased solubility of NH3 (be-
cause of both reduced NH3(aq) volatility and increased parti-
tioning of NH3(aq) to NH+4(aq)); hence, at higher latitudes the
open ocean is more likely to act as a net sink (Johnson et al.,
2008). Of the six previous studies, only Johnson et al. (2008)
quantified NH3 fluxes above the Arctic Circle (66◦33′ N) dur-
ing a summer time study in the Norwegian Sea. Therefore
additional measurements of sea–air NH3 fluxes in the High
Arctic are invaluable for improving constraints on oceanic
NH3 emissions.
During the summertime, freshwater melt ponds are a ubiq-
uitous feature on top of melting Arctic sea ice and can com-
prise up to 80 % of the sea ice surface (Lüthje et al., 2006).
These melt ponds form from melting sea ice and are any-
where from a few cm to over 1 m deep. They are chemically
distinct from the bulk ocean owing to their low salinity and
physical separation from the ocean mixed layer by sea ice or
stratification. To our knowledge, no studies to date have at-
tempted to quantify melt-pond–air NH3(g) fluxes despite the
abundant presence of melt ponds in the summertime Arctic.
Quantifying sea–air and melt-pond–air NH3 exchange in
the Arctic will help elucidate the role these processes play as
either sources or sinks in the Arctic nitrogen cycle. Many ter-
restrial Arctic ecosystems are N-limited and highly sensitive
to perturbations in N-input (Shaver and Chapin III, 1980);
thus Arctic soils and vegetation are unlikely to represent im-
portant sources of atmospheric ammonia. Major sources at
lower latitudes include agriculture, vegetation, transport, and
industry (Reis et al., 2009; Sutton et al., 2013) but these are
expected to contribute minimally north of the Arctic Circle.
Since the lifetime of NH3(g) is typically less than 24 h, long-
range transport from lower latitudes is likely not important
(Lefer et al., 1999). Substantial NH3 emissions have been
measured from both seabird guano (Blackall et al., 2007)
and seal excreta (Theobald et al., 2006) so large colonies
may be relevant point sources throughout the Arctic region.
Biomass burning can also inject significant quantities of NH3
into the free troposphere and/or boundary layer (Bouwman et
al., 1997). Although vegetation in the High Arctic is sparse,
there can be large wildfires in boreal regions, and emissions
may be transported poleward. The potential for the ocean and
melt ponds to act as sources to the atmosphere will depend
on the relative importance of sources and sinks within the
atmosphere and the aqueous systems.
NH3 emission to the atmosphere can affect the extent of
non-sea-salt sulfate (nss-SO2−4 ) neutralization, which has im-
plications for N-transport (Lefer et al., 1999). Therefore, it is
important to also consider the relative abundances of atmo-
spheric NHx and nss-SO2−4 . The dominant source of the lat-
ter in the summertime Arctic is oxidation of dimethylsulfide
(DMS) emitted from the Arctic Ocean (Leaitch et al., 2013;
Sharma et al., 1999, 2012). Measurements of PM2.5 com-
position in the summertime Arctic marine boundary layer
are rare (e.g. Chang et al., 2011; Leck et al., 2001). Previ-
ous chemical transport model (CTM) studies with GEOS-
Chem predict highly acidic aerosol (i.e. nss-SO2−4 �NHx)
with negligible amounts of NH3(g) throughout the summer-
time Arctic boundary layer (Breider et al., 2014).
The region for this study is the eastern Canadian Arctic
Archipelago where ship-based atmospheric (NH3(g), NH+4(p),
SO2−4(p)) and oceanic ([NHx], pH, SST) measurements were
taken over a 4-week period in July and August 2014. To
our knowledge, this study presents the first measurements of
NH3(g) in the Canadian Arctic. Motivated by a lack of atmo-
Atmos. Chem. Phys., 16, 1937–1953, 2016 www.atmos-chem-phys.net/16/1937/2016/

G. R. Wentworth et al.: Ammonia in the summertime Arctic marine boundary layer 1939
spheric and oceanic measurements in the region, as well as
substantial uncertainties in sea–air and melt-pond–air NH3
fluxes, the specific goals of this study were the following:
1. to simultaneously quantify NH3(g) and oceanic/melt
pond [NHx] to infer surface–air NH3 fluxes
2. to assess the relative abundances of NH3(g), NH+4(p) and
SO2−4(p) to determine the extent of SO2−
4(p) neutralization
3. to elucidate the major sources and sinks of atmospheric
NH3 throughout the summertime Arctic marine bound-
ary layer
4. and to evaluate whether atmospheric NHx deposition
could be an important N-input to aquatic and terrestrial
Arctic ecosystems.
2 Materials and methods
2.1 2014 CCGS Amundsen cruise
Measurements were taken aboard the Canadian Coast Guard
Ship Amundsen between 13 July and 7 August 2014 as part of
the Network on Climate and Aerosols: Addressing Key Un-
certainties in Remote Canadian Environments (NETCARE).
The CCGS Amundsen departed from Québec City, Québec
on 8 July 2014 and sailed throughout the eastern Cana-
dian Archipelago heading as far north as 81.47◦ N eventually
reaching Kugluktuk, Nunavut on 13 August 2014. A detailed
map of the ship’s route for this leg is shown in Fig. 1 along
with the ship’s position at the start of selected days. All times
are given in coordinated universal time (UTC).
2.2 Atmospheric measurements
Ambient levels of water-soluble ions in PM2.5 (NH+4 , SO2−4 ,
and NO−3 ) and their precursor gases (NH3, SO2, and HNO3)
were measured using the Ambient Ion Monitor-Ion Chro-
matograph (AIM-IC) system (Model 9000D, URG Corp.,
Chapel Hill, NC). The AIM-IC is a continuous online system
which provides simultaneous gas-phase and particle-phase
measurements with hourly time resolution. The system has
been adapted to locate the gas and particle separation and
collection hardware as close as possible to the inlet sam-
pling point (Markovic et al., 2012). Ambient air is pulled
through a PM2.5 impactor to remove coarse (> 2.5 µm in di-
ameter) particles at a flow of 3 L min−1. Air then enters a
parallel-plate wet denuder where water-soluble gases are dis-
solved in a 2 mM H2O2 solution (to enhance the solubility of
SO2)which is continuously flowing across the denuder mem-
branes. The remaining PM2.5 particles have sufficient inertia
to pass through the denuder into a supersaturation chamber
where they are collected as an aqueous solution via hygro-
scopic growth. These components were contained within an
aluminum inlet box that was mounted to the hull near the bow
Figure 1. CCGS Amundsen ship track coloured by gas-phase NH3
concentrations measured by the AIM-IC. Invalid measurements
(e.g. instrument troubleshooting, influenced by ship) are purple
along the ship track. Units of ng m−3 were chosen as a conve-
nience for flux calculations. At STP, 100 ng m−3≈ 130 pptv. Rel-
evant landmarks are also labelled. Dates and arrows indicate the
position of the ship at 00:00 UTC on that day.
of the ship (about 4 m back of the bow). The height of the in-
let was 1 m above the deck. Influence from ship-generated
sea spray was likely minimal due to the benign nature of the
summertime Arctic Ocean, in addition to the PM2.5 impactor
designed to remove coarse particles. The aqueous solutions
collected in the inlet box were pulled down a 22 m sample
line through a conduit leading to the IC systems which were
housed in a laboratory below deck. Half of each ∼ 10 mL
aqueous aliquot (representing 1 h of sampling) was then sep-
arately injected onto both a cation IC and anion IC for quan-
tification of water-soluble ions.
The IC systems (ICS-2000, Dionex Inc., Sunnyvale, CA)
were operated using CS17/AS11-HC analytical columns,
CG17/AG11-HC guard columns and TCC-ULP1/TAC-
ULP1 concentrator columns for improved detection limits.
Reagent-free gradient elution schemes and suppressed con-
ductivity were also employed. Aqueous standards of known
concentration were prepared via serial dilution of commer-
cially available mixed standards (Dionex Corp., Sunnyvale,
CA) containing six cations (P/N 040187) and seven anions
(P/N 056933). Manual injection of these standards yielded
reasonable (R2 > 0.99) six-point calibration curves.
During the campaign, three zero-air overflow experiments
were performed to quantify the background signal of each
analyte measured during AIM-IC ambient sampling. For
each experiment, the inlet was flooded with high-purity zero
air (AI 0.0 UZ-T, PraxAir, Toronto, ON) at 4.5 L min−1 for
18 h. The average peak area during the final 8 h of each ex-
www.atmos-chem-phys.net/16/1937/2016/ Atmos. Chem. Phys., 16, 1937–1953, 2016

1940 G. R. Wentworth et al.: Ammonia in the summertime Arctic marine boundary layer
periment was used as a background and subtracted from each
ambient measurement. Detection limits were calculated by
taking 3 times the standard deviation of each analyte peak
area during the final 8 h of each zero air overflow. This value
was then converted to either a mixing ratio or mass load-
ing assuming standard temperature and pressure (STP). De-
tection limits for species of interest during the cruise were
29 ng m−3 (NH3), 17 pptv (SO2), 8 pptv (HNO3), 12 ng m−3
(NH+4 ), 36 ng m−3 (SO2−4 ), and 64 ng m−3 (NO−3 ). For the
convenience of flux calculations, NH3 values are reported
in ng m−3 (at STP 100 ng m−3 NH3 ≈ 130 pptv).
Standard meteorological parameters were measured using
a Vaisala HMP45C212 sensor for temperature, an RM Young
model 61205V transducer for pressure, and an RM Young
Model 05103 wind monitor for wind speed and direction lo-
cated at the bow ship of the ship at a height of 8.2–9.4 m
above the deck. Data were averaged to 1 h to match the time
resolution of the AIM-IC. In order to remove any influence
from activities aboard the ship, gas-phase measurements are
only reported if the following conditions were met: (1) av-
erage hourly ship speed > 4 knots (∼ 7.4 km h−1), (2) aver-
age hourly apparent wind direction ±90◦ of the bow, and
(3) standard deviation of apparent wind direction < 36◦. Sim-
ilar cut-offs for speed and wind direction have been used in
previous studies of NH3 in the marine boundary layer (e.g.
Johnson et al., 2008; Norman and Leck, 2005).
2.3 Surface measurements
A total of 37 surface ocean and 9 melt pond samples were
collected throughout the study. Melt pond samples were col-
lected directly into a cooler jug using an electrical pump fixed
on a telescopic arm. The water was sampled as far from the
side of the melt pond as possible, between 1 and 2 m de-
pending on the size of the melt pond. Temperature was mea-
sured in situ with a VWR high-precision thermometer, and
total aqueous [NHx] was determined within 10 h of sam-
pling using a fluorometric technique that has been optimized
for low concentrations and complex matrices (Holmes et al.,
1999). The method detection limit was 20 nM. Surface ocean
samples were obtained with a Rosette sampler equipped
with GO-FLOW bottles and a CTD (Seabird Electronics
SBE911+) recording temperature. Total aqueous [NHx] was
determined as above within 1 h of sampling. Surface water
temperature along the ship’s track was continuously mea-
sured by a thermosalinograph (Seabird Electronics SBE 45)
connected to the seawater inlet. For the purposes of flux cal-
culations, the ocean pH and salinity were assumed to be 8.1
and 35 g kg−1, respectively, which are representative for the
region of interest (Takahashi et al., 2014). These assump-
tions have been made previously and were not found to be
a major source of uncertainty when calculating sea–air NH3
fluxes (Johnson et al., 2008). The melt pond pHs were mea-
sured using a pH-meter within 4 h of sampling. A three-point
calibration of the pH probe (Orion™ Model 91–72, Thermo
Scientific) was performed using commercially available pH
4.01, 7.00 and 10.00 buffers. Salinity of the melt ponds were
determined with a WTW Cond 330i handheld conductivity
meter.
2.4 Flux calculations
The direction of sea–air NH3 fluxes can be assessed by com-
paring ambient measurements of NH3(g) to the atmospheric
mixing ratio predicted from Henry’s Law equilibrium calcu-
lations using seawater [NHx] and surface temperature mea-
surements (e.g. Asman et al., 1994; Johnson et al., 2008;
Quinn et al., 1988, 1996). This equilibrium NH3 concentra-
tion signifies the ambient value at which the net flux changes
direction, and is known as the compensation point (denoted
χ). In other words, one expects a net downwards flux if am-
bient NH3(g) exceeds χ and a net upward flux if it is be-
low χ . The magnitude of these fluxes are commonly com-
puted using the “two-phase” model first developed by Liss
and Slater (1974), which describes the sea–air transfer of
gases as being controlled by molecular diffusion on either
side of the interface. The transfer of NH3 across this inter-
face is predominantly dictated by the air-side transfer veloc-
ity, given the relatively high water solubility of NH3 (Liss,
1983). Hence, the equation to calculate sea–air NH3 fluxes is
as follows:
FNH3= kg · (χ −NH3(g)) · 17.03, (1)
where FNH3is the sea–air flux of NH3 (ng m−2 s−1), kg is
the air-side transfer velocity (m s−1), NH3(g) is the mea-
sured ammonia concentration (nmol m−3), χ is the com-
pensation point (nmol m−3), and the molecular weight of
17.03 g mol−1 is to convert nmol to ng. Numerous parame-
terizations exist for kg with varying degrees of complexity
(Johnson, 2010). Here we adopt the approach established by
Duce et al. (1991):
kg =u
770+ 45 ·MW1/3, (2)
where u is the wind speed (m s−1) and MW is the molecu-
lar weight of the gas of interest (17.03 for NH3). Although
simple, this parameterization has been used previously to es-
timate sea–air NH3 fluxes (e.g. Johnson et al., 2008) and
has been shown to be in good agreement (within 20 %) with
a more complex scheme, particularly at lower wind speeds
(Johnson, 2010). The following equation is used to calculate
χ :
χ =KH · [NH3(sw)], (3)
where KH is the Henry’s law constant (dimensionless) and
[NH3(sw)] is the concentration of dissolved ammonia in the
surface pool (nmol m−3). The temperature-dependent equa-
tion for KH is (McKee, 2001):
KH =1
17.93 · T273.15
· e(4092/T )−9.70, (4)
Atmos. Chem. Phys., 16, 1937–1953, 2016 www.atmos-chem-phys.net/16/1937/2016/

G. R. Wentworth et al.: Ammonia in the summertime Arctic marine boundary layer 1941
where T is the surface temperature (in K). The following
equation is used to relate the NH3(sw) to the concentration of
total dissolved NHx ([NHx(sw)]), which is the value actually
measured by the procedure outlined in Sect. 2.3:
[NH3(sw)] =[NHx(sw)] ·Ka
10−pH+Ka
, (5)
where Ka is the acid dissociation constant of NH+4 . The pKa
(≡−logKa) is calculated according to Bell et al. (2008),
which provides an empirical correction for salinity (S, di-
mensionless) at a given temperature (T , in ◦C):
pKa = 10.0423+ 0.003071 · S− 0.031556 · T . (6)
Equations (2) and (4) closely follow that of Johnson et
al. (2008) but are sufficiently similar to analogous ap-
proaches for calculatingKH and kg used in other sea–air NH3
exchange studies (e.g. Asman et al., 1994; Gibb et al., 1999;
Quinn et al., 1992). Johnson (2004) reported that fluxes cal-
culated with these various schemes usually agree within 2 %.
Melt-pond–air exchange was also examined using Eqs. (1)
to (6).
2.5 GEOS-Chem
The GEOS-Chem chemical transport model
(www.geos-chem.org) is used to aid in the interpreta-
tion of the atmospheric measurements. We use GEOS-Chem
version 9-02 at 2◦× 2.5◦ resolution globally, and with
47 vertical layers between the surface and 0.01 hPa. The
assimilated meteorology is taken from the NASA Global
Modelling and Assimilation Office (GMAO) Goddard Earth
Observing System version 5.11.0 (GEOS-FP) assimilated
meteorology product. Boundary layer mixing uses the
non-local scheme implemented by Lin and McElroy (2010).
Our simulations use 2014 meteorology and allow a 2-month
spin-up prior to the simulation.
The GEOS-Chem model includes a detailed oxidant-
aerosol tropospheric chemistry mechanism as originally de-
scribed by Bey et al. (2001). Simulated aerosol species in-
clude sulfate–nitrate–ammonium (Park et al., 2004, 2006),
carbonaceous aerosols (Park et al., 2003; Liao et al., 2007),
dust (Fairlie et al., 2007, 2010) and sea salt (Alexan-
der et al., 2005). The sulfate–nitrate–ammonium chemistry
uses the ISORROPIA II thermodynamic model (Fountoukis
and Nenes, 2007), which partitions ammonia and nitric
acid between the gas and aerosol phases. For our simu-
lations, the natural NH3 emissions are from Bouwman et
al. (1997) and biomass burning emissions are from the
Quick Fire Emissions Dataset (QFED2) (Darmenov and
da Silva, 2013), which provides daily open fire emissions
at 0.1◦× 0.1◦resolution. Anthropogenic NH3 emissions are
from Bouwman et al. (1997). The model includes natural
and anthropogenic sources of SO2 (van Donkelaar et al.,
2008; Fisher et al., 2011) and DMS emissions based on the
Nightingale (2000) formulation and oceanic DMS concen-
trations from Lana et al. (2011). Oxidation of SO2 occurs in
clouds by reaction with H2O2 and O3 and in the gas phase
with OH (Alexander et al., 2009) and DMS oxidation occurs
by reaction with OH and NO3.
GEOS-Chem simulates both wet and dry removal of
aerosols and gases. Dry deposition follows a standard resis-
tance in series scheme (Wesley, 1989) with an aerosol dry de-
position velocity of 0.03 cm s−1 over snow and ice (Fisher et
al., 2011). Wet removal in GEOS-Chem takes place in large-
scale clouds and convective updrafts (Liu et al., 2001). In-
cloud scavenging of hydrophilic species takes place at tem-
peratures warmer than 258 K, and hydrophobic black carbon
and dust are also removed at temperatures colder than 258 K
(Wang et al., 2011).
2.6 FLEXPART-WRF
FLEXPART-WRF (Brioude et al., 2013, website: http://
flexpart.eu/wiki/FpLimitedareaWrf) is a Lagrangian particle
dispersion model based on FLEXPART (Stohl et al., 2005)
that is driven by meteorology from the Weather Research and
Forecasting (WRF) Model (Skamarock et al., 2005). Here
we use FLEXPART-WRF run in backward mode to study
the emission-source regions and transport pathways influenc-
ing ship-based ammonia measurements. A WRF simulation
for the summer 2014 NETCARE campaign was performed
using WRF 3.5.1 with initial and boundary conditions pro-
vided by the operational analysis (0.25◦× 0.25◦ resolution)
from European Centre for Medium-Range Weather Forecasts
(ECMWF). Parameterizations and options for the WRF sim-
ulations are given in Table 1. The WRF model was run from
1 July to 13 August 2014 and nudged to ECMWF winds,
temperature, and humidity every 6 h above the atmospheric
boundary layer. The WRF run was evaluated using meteoro-
logical measurements made onboard the Amundsen and from
the Polar-6 aircraft flights during this period. FLEXPART-
WRF was run in backward mode to produce retroplume out-
put that is proportional to the residence time of the particles
in a given volume of air. Runs were performed using the loca-
tion of the ship, with one model run performed every 15 min
while the ship was in the model domain (13 July–13 Au-
gust 2014). For each run, 100 000 particles were released at
the ship location (100 m extent horizontally and vertically)
and the FLEXPART-WRF was run backwards for 7 days
prior to release. The output provides retroplume information
(the residence time of air prior to sampling) which is used to
calculate the potential emission sensitivities (PES) integrated
over the 7 days prior to sampling by instruments aboard the
Amundsen.
www.atmos-chem-phys.net/16/1937/2016/ Atmos. Chem. Phys., 16, 1937–1953, 2016

1942 G. R. Wentworth et al.: Ammonia in the summertime Arctic marine boundary layer
Table 1. Parameterizations and options used for the NETCARE WRF simulations.
Atmospheric process WRF option
Planetary boundary layer Mellor–Yamada–Janjic Scheme (MYJ) (Janjic, 1994)
Surface layer Monin-Obukhov Janjic Eta similarity scheme (Monin and Obukhov, 1954; Janjic, 1994, 1996, 2002)
Land surface Unified Noah Land Surface Model (Tewari et al., 2004)∗
Microphysics WRF Single-Moment 5-class scheme (Hong et al., 2004)
SW radiation Goddard Shortwave Scheme (Chou and Suarez, 1994)
LW radiation RRTMG (Iacono et al., 2008)
Cumulus parameterization Kain–Fritsch Scheme (Kain, 2004)
∗ with corrected calculation of skin temperature over sea ice when snow melting is occurring, see http://www2.mmm.ucar.edu/wrf/users/wrfv3.7/updates-3.7.1.html.
3 Results and discussion
3.1 Surface–atmosphere NH3 fluxes
Figure 1 shows the ambient NH3(g) concentrations measured
by the AIM-IC throughout the cruise. Measured values of
NH3(g) range between 30–650 ng m−3 with the highest val-
ues occurring in Lancaster Sound as the ship was steam-
ing eastward into Baffin Bay. Only two measurements of
NH3 were below the detection limit (29 ng m−3) through-
out the entire cruise. NH3 consistently exceeded 100 ng m−3
during later parts of the cruise along the eastern shores of
Ellesmere Island and western shores of Greenland. Lower
values (< 100 ng m−3) were observed at the beginning of the
campaign along the eastern shores of Baffin Island. Mea-
surements of NH3(g) in the marine boundary layer at north-
ern latitudes (> 50◦ N) are sparse; however, the concentra-
tions measured in this study are within the few previously
reported ranges for the regions above 50◦ N. Johnson et
al. (2008) reported NH3(g) between 20–300 ng m−3 in the
Norwegian Sea during spring and summer, but a lower range
(20–90 ng m−3) in the northern North Sea in winter. In the
southern North Sea, Asman et al. (1994) measured higher
values (30–1500 ng m−3) in a study lasting from February to
October.
The relevant measurements needed to calculate χ for both
the open ocean and melt ponds are listed in Tables S1 and
S2 in the Supplement, respectively. Only four unique co-
ordinates are listed for the nine melt pond samples because
multiple melt ponds were sampled at each location. Roughly
half of the surface ocean samples had [NHx] below the de-
tection limit (20 nM) and in general values were significantly
lower than in the melt ponds. Open ocean samples ranged
from < 20 to 380 nM whereas seven of the nine melt pond
samples were between 640 to 1260 nM (with the other two
below detection limit). These concentrations and their spatial
variability are typical for the region during summer (Martin
et al., 2010).
Parameters listed in Tables S1 and S2 were input into
Eqs. (3) to (6) to calculate χ for both the surface ocean and
melt pond samples. For samples with [NHx] below the de-
tection limit, a value of 10 nM (half of the detection limit)
was assumed. A comparison of the calculated compensation
points for the ocean (χocean) and melt ponds (χMP) are shown
in Fig. 2. Also shown is the range for the nearest valid mea-
surement (see Sect. 2.2) of ambient NH3(g). The NH3(g) con-
centration taken during the hour of surface sampling could
not be used since the ship remained stationary for up to 12 h
while melt pond or ocean work was being conducted. Hence,
the NH3(g) measurement from several hours prior (as the ship
approached the surface sampling site) had to be used. This
approach should not significantly impact the analysis given
that the ambient levels of NH3(g) were observed to be fairly
uniform from 1 h to the next (i.e. no rapid spikes of NH3(g)
were measured). Shown in lighter yellow are the ranges of
NH3(g) observed over the entire study (∼ 30–650 ng m−3).
Figure 2 clearly shows that the ambient concentrations of
NH3(g) exceed both χocean and χMP by several orders of
magnitude throughout the entire region. This conclusively
demonstrates that during the summertime, the ocean and melt
ponds are net sinks of atmospheric NH3(g). This finding is
consistent with Johnson et al. (2008) who found a tendency
for downward net fluxes at higher latitudes, primarily as a re-
sult of colder sea surface temperatures. Assuming an upper
limit for the ocean pH of 8.2 would increase χocean by less
than 20 %.
Figure 3 shows the magnitude of the sea–air and melt-
pond–air flux of NH3. Average net downward fluxes of 1.4
and 1.1 ng m−2 s−1 were calculated for the open ocean and
melt ponds, respectively, using Eqs. (1) and (2). Net fluxes
were exclusively downwards (net deposition into the ocean
and melt ponds) due to the relative abundances of NH3(g) and
NH+4(aq) in these surface pools as well as cold surface tem-
peratures as suggested by Johnson et al. (2008). It is unlikely
that this represents a significant input of NH+4 into the open
ocean except in cases of extremely low [NHx]. A simple cal-
culation assuming a mixed layer depth of 25 m results in an
increase of only ∼ 0.3 nM d−1 to the ocean (assuming com-
plete mixing and no loss pathways). However, for the much
shallower melt ponds (assumed depth of 0.25 m) the same
calculation yields an input of∼ 22 nM d−1. Furthermore, this
does not account for atmospheric inputs from either wet de-
position or dry deposition of particulate NH+4 , and these melt
Atmos. Chem. Phys., 16, 1937–1953, 2016 www.atmos-chem-phys.net/16/1937/2016/

G. R. Wentworth et al.: Ammonia in the summertime Arctic marine boundary layer 1943
Figure 2. Box-and-whisker plot showing the observed ranges of χ
(on a log scale) for both the ocean surface (dark blue) and melt
ponds (light blue). The range of NH3(g) measured by the AIM-IC
near the time of surface sampling is shown in darker yellow whereas
NH3(g) over the entire campaign is shown in lighter yellow. The box
represents 25th to 75th percentile while the line within the box de-
notes the median. Whiskers extend to the 10th and 90th percentile.
Figure 3. Box-and-whisker plot of the estimated fluxes into the
open ocean and melt ponds. The percentiles are represented in the
same fashion as Fig. 2.
ponds are cut-off from the upwelling currents in the ocean,
which deliver reactive N to the surface. Rates of nitrification,
mineralization and N2-fixation in the open ocean and melt
ponds would help put this atmospheric input into perspec-
tive and give insight as to whether or not it is an important
process in the nitrogen cycle in these environments.
3.2 Sulfate neutralization
The extent of neutralization of PM2.5 influences aerosol
properties as discussed previously. Figure 4 depicts the rel-
ative abundances (in neq m−3) of gas-phase ammonia and
particulate-phase ammonium and sulfate. It is important to
note that the value for sulfate is total PM2.5 sulfate as op-
posed to non-sea-salt sulfate (nss-SO2−4 ), which is com-
monly reported for marine boundary layer studies. High and
variable backgrounds of Na+ from the AIM-IC prevented
the calculation of nss-SO2−4 ; hence this data set provides
an upper limit for nss-SO2−4 . Given the low wind speeds
(< 5 m s−1) that dominated the campaign, it is likely the nss-
SO2−4 ≈SO2−
4 since the contribution from sea salt to PM2.5
was likely small. It should also be noted that measurements
of SO2, HNO3 and NO−3 were almost always below their re-
spective detection limits.
Particle loadings of NH+4 and SO2−4 were extremely low
(typically < 5 neq m−3) throughout the duration of the cruise.
During the first third of the cruise (before 18 July), gas-
phase NH3 was also low and neutralization (i.e. the ratio
NH+4 :SO2−4 in units of equivalents) was ambiguous due to
numerous values near or below detection limit. On the other
hand, after 25 July the nanoequivalents of NH3(g) were sub-
stantially higher than either NH+4 or SO2−4 (i.e. NHx ≈NH3),
which implies a nearly neutralized sulfate aerosol. It is im-
portant to note that a nearly neutralized aerosol does not
equate to an aerosol with a pH of 7 since aerosol pH is
highly sensitive to liquid water content as well as the precise
NH+4 :SO2−4 ratio. An aerosol with NH+4 :SO2−
4 approach-
ing 1 can still have an acidic pH. For example, a deliquesced
ammonium sulfate particle containing 20 neq m−3 of SO2−4
and 19.98 neq m−3 NH+4 at 85 % RH will have a pH of ∼ 3.1
under equilibrium conditions despite having an NH+4 :SO2−4
equivalents ratio of 0.999.
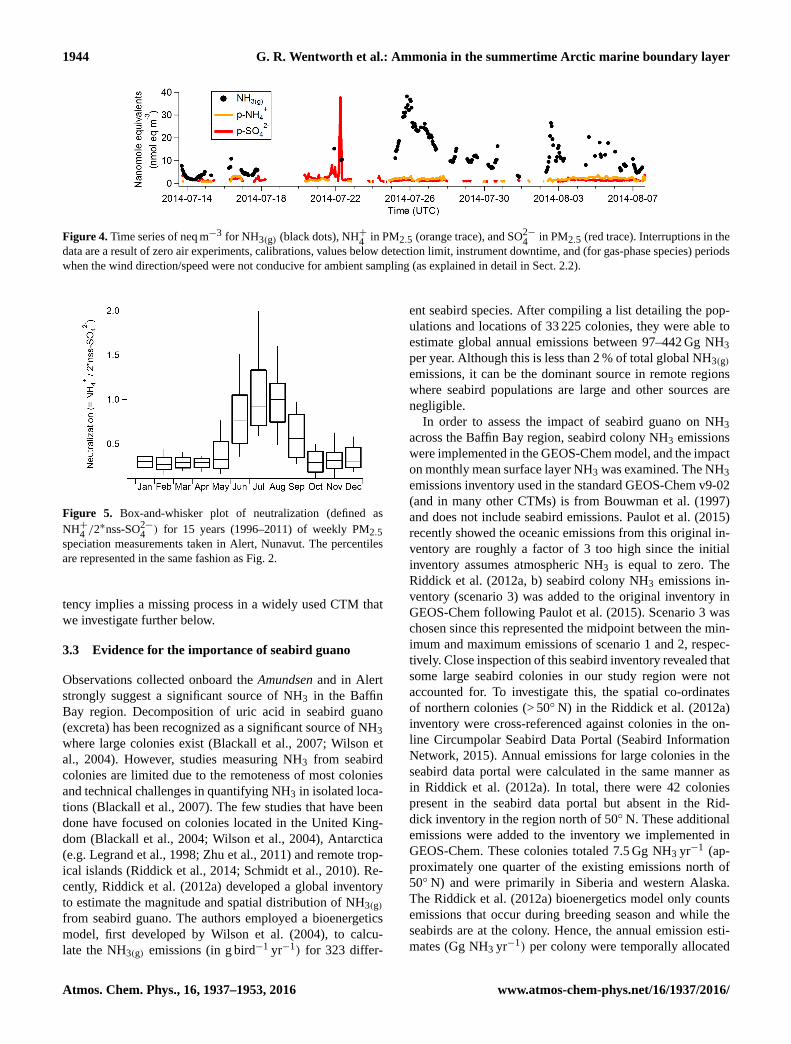
Figure 5 shows the distribution of the NH+4 : nss-SO2−4 ra-
tio (on a per equivalent basis) measured in Alert, Nunavut
(82.50◦ N, 62.33◦W) as a function of month from 1996–
2011. Weekly averaged PM2.5 speciation measurements in
Alert are made by Environment Canada and are available
online (Environment Canada, 2014). The contribution from
NO−3 is minor and has not been included in this analysis.
In warm environments, volatilization of NH4NO3 off of fil-
ters can cause an underestimation of NH+4 , but this is not
expected to be an issue in Alert due to cold weather and
low loadings of NH4NO3. During July and August the nss-
SO2−4 is, on average, completely neutralized by the NH+4 in
PM2.5 as shown by a median neutralization ratio approach-
ing 1 during these months. This implies there is sufficient
NH3(g) throughout the region to neutralize nss-SO2−4 pro-
duced from DMS oxidation which is consistent with the mea-
surements shown in Fig. 4. However, there is no denuder
upstream of the Hi-Vol filters to remove NH3, so the ob-
served NH+4 :SO2−4 ratio (Fig. 5) may be higher than for
ambient PM2.5. This effect is difficult to characterize, but
if it is important then it is still evidence for the abundance
of NH3 in the summertime Arctic boundary layer. Lastly,
Johnson and Bell (2008) show that a sufficiently neutralized
sulfate aerosol will tend to “push” gas-phase NH3 into the
ocean in the aerosol-gas-ocean system, also consistent with
Fig. 3. The AIM-IC and Alert measurements are both in-
consistent with a previous study that used GEOS-Chem to
predict a highly acidic aerosol and insignificant gas-phase
ammonia (NHx ≈NH+4 ) throughout the summertime Arctic
marine boundary layer (Breider et al., 2014). This inconsis-
www.atmos-chem-phys.net/16/1937/2016/ Atmos. Chem. Phys., 16, 1937–1953, 2016
1944 G. R. Wentworth et al.: Ammonia in the summertime Arctic marine boundary layer
Figure 4. Time series of neq m−3 for NH3(g) (black dots), NH+4
in PM2.5 (orange trace), and SO2−4
in PM2.5 (red trace). Interruptions in the
data are a result of zero air experiments, calibrations, values below detection limit, instrument downtime, and (for gas-phase species) periods
when the wind direction/speed were not conducive for ambient sampling (as explained in detail in Sect. 2.2).
Figure 5. Box-and-whisker plot of neutralization (defined as
NH+4/2∗nss-SO2−
4) for 15 years (1996–2011) of weekly PM2.5
speciation measurements taken in Alert, Nunavut. The percentiles
are represented in the same fashion as Fig. 2.
tency implies a missing process in a widely used CTM that
we investigate further below.
3.3 Evidence for the importance of seabird guano
Observations collected onboard the Amundsen and in Alert
strongly suggest a significant source of NH3 in the Baffin
Bay region. Decomposition of uric acid in seabird guano
(excreta) has been recognized as a significant source of NH3
where large colonies exist (Blackall et al., 2007; Wilson et
al., 2004). However, studies measuring NH3 from seabird
colonies are limited due to the remoteness of most colonies
and technical challenges in quantifying NH3 in isolated loca-
tions (Blackall et al., 2007). The few studies that have been
done have focused on colonies located in the United King-
dom (Blackall et al., 2004; Wilson et al., 2004), Antarctica
(e.g. Legrand et al., 1998; Zhu et al., 2011) and remote trop-
ical islands (Riddick et al., 2014; Schmidt et al., 2010). Re-
cently, Riddick et al. (2012a) developed a global inventory
to estimate the magnitude and spatial distribution of NH3(g)
from seabird guano. The authors employed a bioenergetics
model, first developed by Wilson et al. (2004), to calcu-
late the NH3(g) emissions (in g bird−1 yr−1) for 323 differ-
ent seabird species. After compiling a list detailing the pop-
ulations and locations of 33 225 colonies, they were able to
estimate global annual emissions between 97–442 Gg NH3
per year. Although this is less than 2 % of total global NH3(g)
emissions, it can be the dominant source in remote regions
where seabird populations are large and other sources are
negligible.
In order to assess the impact of seabird guano on NH3
across the Baffin Bay region, seabird colony NH3 emissions
were implemented in the GEOS-Chem model, and the impact
on monthly mean surface layer NH3 was examined. The NH3
emissions inventory used in the standard GEOS-Chem v9-02
(and in many other CTMs) is from Bouwman et al. (1997)
and does not include seabird emissions. Paulot et al. (2015)
recently showed the oceanic emissions from this original in-
ventory are roughly a factor of 3 too high since the initial
inventory assumes atmospheric NH3 is equal to zero. The
Riddick et al. (2012a, b) seabird colony NH3 emissions in-
ventory (scenario 3) was added to the original inventory in
GEOS-Chem following Paulot et al. (2015). Scenario 3 was
chosen since this represented the midpoint between the min-
imum and maximum emissions of scenario 1 and 2, respec-
tively. Close inspection of this seabird inventory revealed that
some large seabird colonies in our study region were not
accounted for. To investigate this, the spatial co-ordinates
of northern colonies (> 50◦ N) in the Riddick et al. (2012a)
inventory were cross-referenced against colonies in the on-
line Circumpolar Seabird Data Portal (Seabird Information
Network, 2015). Annual emissions for large colonies in the
seabird data portal were calculated in the same manner as
in Riddick et al. (2012a). In total, there were 42 colonies
present in the seabird data portal but absent in the Rid-
dick inventory in the region north of 50◦ N. These additional
emissions were added to the inventory we implemented in
GEOS-Chem. These colonies totaled 7.5 Gg NH3 yr−1 (ap-
proximately one quarter of the existing emissions north of
50◦ N) and were primarily in Siberia and western Alaska.
The Riddick et al. (2012a) bioenergetics model only counts
emissions that occur during breeding season and while the
seabirds are at the colony. Hence, the annual emission esti-
mates (Gg NH3 yr−1) per colony were temporally allocated
Atmos. Chem. Phys., 16, 1937–1953, 2016 www.atmos-chem-phys.net/16/1937/2016/

G. R. Wentworth et al.: Ammonia in the summertime Arctic marine boundary layer 1945
evenly between the 15 May to 15 September. This period is
when the majority of seabirds in the Baffin Bay region are
nesting (e.g. Gaston et al., 2005; Mallory and Forbes, 2007;
McLaren, 1982). One limitation to this approach is that it
does not account for additional temporal variations in NH3
emissions. For instance, moisture increases the rate of uric
acid degradation, and fluxes of NH3 from guano have been
observed to increase 10-fold for up to a day after rain events
(Riddick et al., 2014).
Figure 6 shows the July mean output for surface layer NH3
mixing ratio both without (Fig. 6a) and with (Fig. 6b) seabird
emissions, along with the NH3(g) measured by the AIM-IC
denoted by circles in Fig. 6a. Comparing the top two pan-
els reveals that seabird emissions make a substantial impact
on modelled NH3 levels in the boundary layer. Much better
model-measurement agreement is achieved with the inclu-
sion of the seabird colonies. Without the seabird emissions,
NH3 mixing ratios are underpredicted by several orders of
magnitude. Surface NH3 is still underpredicted in Fig. 6b
(with guano NH3 emissions) which could be the result of
modelled emissions being independent of rainfall, which can
substantially increase NH3 emissions. Episodic rainfall was
persistent throughout the latter half of the campaign. Other
contributing factors may include the following: challenges in
representing boundary layer mixing, uncertainties in depo-
sition rates, comparing monthly averages (GEOS-Chem) to
ambient hourly measurements, missing/underestimated bird
colonies, and/or excreta from other fauna (e.g. seals, cari-
bou, musk-ox) absent in the updated inventory. The bottom
two panels (Fig. 6c and d) show the influence of seabirds on
the ammonium to non-sea-salt sulfate ratio. Without seabirds
(Fig. 6c) the ratio is less than 0.3 throughout most of the
study region, which is inconsistent with the abundance of
NH3 relative to SO2−4 measured by the AIM-IC. Adding the
seabird emissions (Fig. 6d) increases the ratio to above 0.7 in
most grid cells along the ship track. Although the high ratio
(July average is ∼ 1) observed in Alert (denoted by the star
in Fig. 6c and d) is underestimated in the GEOS-Chem sim-
ulation, the bias is reduced by nearly a factor of 2 (from 0.32
to 0.57) when seabird emissions are included.
Wildfires are also a source of NH3 to the free troposphere
and/or boundary layer. Particularly strong wildfire events
were persistent in the Northwest Territories (NWT) during
the study period. Blue circles in Fig. 7 show the location and
average fire radiative power (representative of fire strength)
of wildfires across the Arctic from 20–26 July. It was con-
structed using data from NASA’s Fire Information Resource
Management System (FIRMS) database (NASA, 2015). We
used FLEXPART-WRF retro plumes to assess the impor-
tance of wildfire NH3 emissions, as well as to further cor-
roborate the influence of seabird guano.
The significant impact of seabird colonies on [NH3(g)] is
supported by the analysis of FLEXPART-WRF retro plumes
shown in Fig. 7. Periods of low [NH3(g)] (bottom panel in
Fig. 7) correspond to air masses that spent at least the last
48 h over the ocean and/or aloft above the MBL (∼ 500 m)
where NH3 sources are negligible. This is clearly shown in
Fig. 7a where the air mass sampled on 14 July 00:00 UTC
spent the previous 96 h in the MBL over Baffin Bay, consis-
tent with low [NH3(g)]. In contrast, on 26 July 00:00 UTC
(Fig. 7b) air had recently passed over seabird colonies (pur-
ple circles) surrounding Lancaster Sound as well as wildfires
in the Northwest Territories (NWT) on mainland Canada
(blue circles), coincident with the large increase in [NH3(g)].
A similar NH3(g) peak occurs on 3 August that can also be
examined by using a retro plume analysis. Low NH3(g) val-
ues observed on the morning of 2 August agree with Fig. 7c
showing the air originating from the MBL over Baffin Bay.
At 3 August 00:00 UTC (Fig. 7d) the air had spent the last
12 h in the boundary layer of western Greenland where large
seabird colonies exist. However, by 4 August 00:00 UTC
(Fig. 7e) the retro plume shifted such that air is now originat-
ing from primarily above the boundary layer (altitude plots
not shown) leading to a decrease in NH3(g). In addition, from
2 to 4 August the ship was north of 79◦ N and in the east-
ern Canadian Arctic; hence it is unlikely that this increase
in NH3 can be attributed to wildfires given how far removed
this region is from wildfires in the NWT. While Fig. 7 only
highlights five examples from the study period, retro plumes
throughout the entire campaign also support the hypothesis
that NH3(g) in the MBL originates primarily from seabird
colonies (for the eastern Canadian Arctic) with contributions
from wildfires in some regions (central Canadian Arctic). All
NH3(g) spikes in the time series can be attributed to air that
had recently passed over seabird colonies and/or wildfires,
whereas low values coincide with air masses from either the
open ocean or free troposphere not influenced by wildfires.
To further investigate the potential influence of wild-
fires on NH3 in the Arctic MBL, GEOS-Chem simula-
tions were performed using a wildfire emissions inven-
tory for 2014 (QFED2). Simulations with/without wildfires
and with/without seabirds revealed that in Lancaster Sound
(along 74◦ N) roughly 40 and 55 % of the boundary layer
NH3 can be attributed to seabirds and wildfires, respec-
tively. In other words, air sampled in Lancaster Sound (20
to 27 July) was likely influenced by wildfires in NWT in ad-
dition to seabird guano. On the other hand, north of Lan-
caster Sound, contributions from seabirds and wildfires to
surface layer NH3 were approximately 95 and 5 %, respec-
tively. Wildfires in the NWT are an important but episodic
source of summertime NH3 in the Canadian Arctic. This is
due to periodic transport events associated with this source
that is located remote to our study region. Whereas, seabird
colonies are a local, and persistent source of NH3 from May
to September. Given the observation of consistently neutral-
ized sulfate in Alert each summer, and the large interannual
variability and episodic wildfire influence, emissions from
migratory seabirds are likely to be a significant contributor
to NH3 abundance in the Arctic marine boundary layer.
www.atmos-chem-phys.net/16/1937/2016/ Atmos. Chem. Phys., 16, 1937–1953, 2016

1946 G. R. Wentworth et al.: Ammonia in the summertime Arctic marine boundary layer
Figure 6. GEOS-Chem simulation of NH3 mixing ratio (ppb) of the July monthly mean surface layer for (a) no seabird emissions and (b) with
seabird emissions. Circles in (a) represent the ship track coloured by NH3 measurements. Panels (c) and (d) show GEOS-Chem simulations
for the ammonium to non-sea-salt sulfate ratio during the same period for (c) no seabird emissions and (d) with seabird emissions. The star
indicates the average ratio observed in Alert during July.
3.4 Implications for N-deposition to ecosystems
Previous studies have highlighted the important role that
seabird-derived N can play in the nitrogen cycle of ecosys-
tems adjacent to bird colonies due to large deposition rates
of NH3 and NH+4 (e.g. Anderson and Polis, 1999; Linde-
boom, 1984). However, little attention has been paid to the
effects of seabird-derived N on deposition at the regional
scale. In this section, we consider the importance of seabird-
derived nitrogen as an input of reactive N to Arctic ecosys-
tems. These ecosystems tend to be N-limited during the sum-
mer and hence have a large sensitivity to N input (Shaver
and Chapin III, 1980). In terrestrial ecosystems, soil N avail-
ability is a key factor in determining both plant community
structure (McKane et al., 2002) and greenhouse gas emis-
sions from soil (Stewart et al., 2012).
Nitrogen (N2) fixation via microbes is thought to be the
primary N input to remote Arctic terrestrial ecosystems (e.g.
Cleveland et al., 1999; Hobara et al., 2006; Stewart et al.,
2014). Numerous field studies have been conducted to esti-
mate N2-fixation rates via the acetylene reduction technique
(Hardy et al., 1968). The N2-fixation rates for most terrestrial
Arctic sites fall within the range of 10 to 120 mg N m−2 yr−1
(Hobara et al., 2006). However, highly variable rates (due to
spatial heterogeneity of microbial populations) and assump-
tions in the acetylene reduction technique yield high degrees
of uncertainty for N2-fixation rates (Stewart et al., 2014).
Total atmospheric N-deposition (wet and dry) in the Arc-
tic is thought to be smaller than fixation, with typical ranges
from 8 to 56 mg N m−2 yr−1 (Van Cleve and Alexander,
1981). Only a few N2-fixation studies also quantify wet
deposition, with dry deposition being ignored altogether
(e.g. Hobara et al., 2006). Nonetheless, in certain Arctic
regions atmospheric deposition may exceed N2-fixation in
soils (DeLuca et al., 2008). These processes are coupled
since large inputs of NH+4 have been shown to inhibit N2-
fixation in certain microbial species and lichens (Chapin and
Bledsoe, 1992).
Figure 8 shows results from the GEOS-Chem simulation
of total NHx (≡NH3+NH+4 ) deposition (both wet and dry)
for the months May to September (inclusive) both without
(Fig. 8a) and with (Fig. 8b) seabird NH3 emissions. The
difference in total NHx deposition for birds and no birds
is shown in Fig. 8c (absolute difference) and Fig. 8d (per-
cent difference). Areas near large colonies are heavily influ-
enced by seabird guano with NHx deposition from seabirds
exceeding 10 mg N m−2 yr−1, particularly in western Green-
land and near the mouth of Lancaster Sound. The majority
of NHx deposition is caused by NH3 as opposed to NH+4 .
Most regions in Fig. 8b are on the lower end of the an-
Atmos. Chem. Phys., 16, 1937–1953, 2016 www.atmos-chem-phys.net/16/1937/2016/

G. R. Wentworth et al.: Ammonia in the summertime Arctic marine boundary layer 1947
Figure 7. PES plots of FLEXPART-WRF 7-day retroplumes from the ship’s location on (a) 14 July 00:00, (b) 26 July 00:00, (c) 2 Au-
gust 00:00, (d) 3 August 00:00 and (e) 4 August 00:00. The ship track is shown in black, and the ship location at the release time is indicated
in red. Colours show the air-mass residence time prior to arrival at the ship (PES) in seconds. The plume centroid locations at 1 and 2 days
(the approximate lifetime of NH3) before release are shown (numbers 1 and 2). Purple circles represent the location of bird colonies with
the size of each circle indicating the magnitude of estimated NH3 emissions (in Mg NH3 yr−1). Blue circles show the location of wildfires
from the NASA FIRMS measurements of fire radiative power from 20–26 July (in MW). The bottom panel is a time series of NH3(g) and
particle-phase NH+4
and SO2−4
measured by the AIM-IC with arrows indicating times of retroplume initiation in the upper panels. The NASA
FIRMS data set was provided by LANCE FIRMS operated by NASA/GSFC/ESDIS with funding from NASA/HQ.
nual N-deposition rate of 8 to 56 mg N m−2 yr−1 suggested
by Van Cleve and Alexander (1981). However, there are
two important distinctions: the latter is an estimate of to-
tal N-deposition and annual input. Estimates in Fig. 8 might
be more useful for comparing N-deposition to N2-fixation
since it captures deposition only during the growing sea-
son, and NHx is likely the dominant form of atmospheric
reactive N in the summertime Arctic boundary layer. Fur-
thermore, Fig. 8b provides information on regions where N-
deposition rates could be comparable to input from terres-
trial N2-fixation (> 10 mg N m−2 yr−1) which can help in-
form subsequent studies exploring N-cycling in the region.
According to Hobara et al. (2006), Arctic terrestrial N2-
fixation only occurs from May to September (inclusive) and
peaks in July, similar to migration patterns of Arctic seabirds.
Estimates of N2-fixation rates in the Arctic Ocean mixed
layer are even sparser than estimates for terrestrial ecosys-
tems. To our knowledge, only Blais et al. (2012) have mea-
sured oceanic N2-fixation in the summertime Arctic Ocean
mixed layer. The authors found that open ocean N2-fixation
www.atmos-chem-phys.net/16/1937/2016/ Atmos. Chem. Phys., 16, 1937–1953, 2016

1948 G. R. Wentworth et al.: Ammonia in the summertime Arctic marine boundary layer
Figure 8. GEOS-Chem simulation of total NHx deposition (in mg N m−2 season−1) for the months May to September (inclusive). Panel
(a) does not include seabird emissions, whereas the panel (b) does. The difference in total NHx deposition between the two emissions
scenarios (with birds minus without birds) is shown in panels (c) and (d) as an absolute amount and percentage increase, respectively.
rates averaged 0.12 nM d−1 in the upper 50 m of the water
column throughout the Beaufort Sea to Baffin Bay. For the
period of May to September (inclusive) this represents an in-
put of approximately 13 mg N m−2 which is comparable to
inputs we calculate from guano-derived NH3 in regions close
to seabird colonies as shown in Fig. 8b.
4 Conclusions
Simultaneous measurements of atmospheric and oceanic
composition in the eastern Canadian Arctic revealed that the
summertime Arctic Ocean and melt ponds were net sinks
of NH3(g). Concentrations of NH3(g) ranging from 30 to
650 ng m−3 were observed and represent the first reported
measurements of NH3(g) in the Canadian Arctic. An aver-
age downward flux of 1.4 ng m−2 s−1 into the Arctic Ocean
was calculated, consistent with previous studies showing
that higher latitude waters are a net NH3 sink (Johnson et
al., 2008). Melt ponds had a smaller net downward flux
(1.1 ng m−2 s−1) as well as a slightly higher χ as compared
to the open ocean (median 2 ng m−3 vs. 0.8 ng m−3). To our
knowledge, this is the first study to estimate melt-pond–air
NH3 exchange despite the ubiquitous presence of melt ponds
throughout the summertime Arctic.
On a nanoequivalent basis, NH3(g) values were signifi-
cantly greater (up to an order of magnitude more) than both
NH+4 and SO2−4 . This finding was consistent with a 15-
year historical data set of weekly PM2.5 composition from
Alert, NU which showed that nss-SO2−4 is, on average, com-
pletely neutralized by NH+4 during July and August. These
measurements imply strong regional source(s) of NH3(g) in
the eastern Canadian Arctic Archipelago that are sufficient
to neutralize nss-SO2−4 produced from DMS oxidation. Our
surface–air flux estimates show that the Arctic Ocean and
melt ponds are not responsible for NH3(g) in the marine
boundary layer.
It is also noteworthy that even though these melt ponds
have significantly higher [NHx] than the open ocean (average
of 670 nM vs. 55 nM), χMP is only marginally higher. More
acidic pHs and slightly lower temperatures mitigate the effect
of higher [NHx] on χ . Chemical transport models (CTMs)
that explicitly account for bi-directional NH3 exchange typi-
cally require χ as a predefined model input (e.g. Bash et al.,
2013; Wichink Kruit et al., 2012). Therefore, from a mod-
elling standpoint, similar values of χocean and χMP are con-
venient since they can be parameterized in a similar fash-
ion which would remove the need for CTMs to resolve the
spatial extent and temporal evolution of melt ponds to prop-
erly model surface–atmosphere NH3 exchange in the sum-
mertime Arctic.
To investigate the impact of NH3 emissions from seabird
guano, we examined GEOS-Chem simulations both with and
without seabird colony NH3 emissions. The seabird NH3
Atmos. Chem. Phys., 16, 1937–1953, 2016 www.atmos-chem-phys.net/16/1937/2016/

G. R. Wentworth et al.: Ammonia in the summertime Arctic marine boundary layer 1949
emission inventory developed by Riddick et al. (2012a) was
updated for this study to include northern colonies (> 50◦ N)
that had been overlooked in the original inventory. Without
the seabirds, GEOS-Chem underestimated NH3(g) by several
orders of magnitude and predicted highly acidic aerosol at
the surface in July, which is in direct contrast to our measure-
ments. The inclusion of seabird emissions provided much
better agreement with NH3(g) observations and yielded more
neutralized aerosol throughout most of the Baffin Bay region.
The importance of seabird NH3 emissions is also supported
by analysis of FLEXPART-WRF retro plumes throughout the
study period. Air masses enriched in NH3(g) had recently
passed through regions with seabird colonies whereas pe-
riods of low NH3(g) involved air masses originating from
the open ocean or above the boundary layer. Together, these
models provide strong evidence that seabird colonies are the
dominant and persistent local source of NH3(g) in the sum-
mertime Arctic. FLEXPART-WRF and GEOS-Chem were
also used to assess the influence of wildfires on NH3. Wild-
fires are an important but episodic source of NH3 to the Arc-
tic due to ongoing changes in transport patterns and fire in-
tensity. Further work should be done to examine the inter-
annual influence of NH3 emissions from wildfires in the
NWT on other regions in the Arctic.
Deposition estimates of NHx from GEOS-Chem dur-
ing the seabird nesting season (May to September) exceed
10 mg N m−2 season−1 in grid cells close to large seabird
colonies, which is on the lower end of microbial N2-fixation
in Arctic tundra (Hobara et al., 2006). Hence, in some regions
seabird-derived NHx could be a significant N-input to terres-
trial Arctic ecosystems, which are typically very N-sensitive.
Estimates of NH3 fluxes into the open ocean are unlikely to
be an important input of reactive-N except for waters close
to large seabird colonies; however, these fluxes may be im-
portant for the N-cycle in the much shallower melt ponds.
There is strong evidence that seabird colonies are likely
the dominant and persistent source of NH3(g) to the summer-
time Arctic boundary layer. Emissions appear to be signifi-
cant enough to at least partially neutralize nss-SO2−4 through-
out most of the study region, in contrast to previous model
simulations that did not consider seabird colony emissions.
Further research is required to better constrain the location,
population, and NH3 emissions of Arctic seabird colonies. It
is also important to quantify meteorological effects (e.g. rain-
fall, wind speed) on seabird emissions. The NH3 emissions
inventory in CTMs should be updated to include seabird
emissions with correct representation of the breeding season
so that emissions only occur when seabirds are nesting. Sum-
mertime measurements of atmospheric NHx elsewhere in the
Arctic are needed to assess whether the impacts of seabirds
observed in this study (substantial NH3(g), nss-SO2−4 neutral-
ization, and N-deposition) are relevant to the entire Arctic.
The Supplement related to this article is available online
at doi:10.5194/acp-16-1937-2016-supplement.
Acknowledgements. The authors are grateful for the hard work
and dedication of the CCGS Amundsen crew. The authors also
thank E. Mungall, A. Lee, V. Irish, H. Stark and J. J. B. Wentzell
for help during mobilization, demobilization and calibration of the
AIM-IC, as well as T. Papakyriakou and T. Burgers for providing
meteorological data. The GEOS5-FP data used in this study/project
have been provided by the Global Modeling and Assimilation
Office (GMAO) at NASA Goddard Space Flight Center. The hi-
volume sampler used for the Alert measurements was maintained
and calibrated by D. Veber, as well as numerous other technicians
and operators over the years. Acknowledgement is also extended
to the crew at CFS Alert for maintaining the base year round.
The fieldwork and model analysis was supported by NSERC’s
Climate Change and Atmospheric Research program, ArcticNet
and NSERC. The QFED2 code and emissions data were provided
by K. Travis and P. Kim. The NASA FIRMS data set was provided
by LANCE FIRMS operated by NASA/GSFC/ESDIS with funding
provided by NASA/HQ. G. R. Wentworth acknowledges funding
from the NSERC program Integrating Atmospheric Chemistry
from Earth to Space (IACPES). Lastly, the authors wish to thank
B. Christensen for providing logistical support throughout the
project.
Edited by: R. Krejci
References
Abbatt, J. P. D., Benz, S., Cziczo, D. J., Kanji, Z., Lohmann, U., and
Möhler, O.: Solid Ammonium Sulfate Aerosols as Ice Nuclei: A
Pathway for Cirrus Cloud Formation, Science, 313, 1770–1773,
2006.
Alexander, B., Park, R. J, Jacob, D. J., Li, Q. B., Yantosca, R. M.,
Savarino, J., Lee, C. C. W., and Thiemens, M. H.: Sulfate for-
mation in sea-salt aerosols: Constraints from oxygen isotopes, J.
Geophys. Res., 110, D10307, doi:10.1029/2004JD005659, 2005.
Alexander, B., Park, R. J., Jacob, D. J., and Gong, S.: Transition
metal-catalyzed oxidation of atmospheric sulfur: global impli-
cations for the sulfur budget. J. Geophys. Res. 114, D02309,
doi:10.1029/2008JD010486, 2009.
Anderson, W. B. and Polis, G. A.: Nutrient fuxes from water to
land?: seabirds affect plant nutrient status on Gulf of California
islands, Oecologia, 118, 324–332, doi:10.1007/s004420050733,
1999.
Asman, W. A. H., Harrison, R. M., and Ottley, C. J.: Estimation of
the net air-sea flux of ammonia over the southern bight of the
North Sea, Atmos. Environ., 28, 3647–3654, doi:10.1016/1352-
2310(94)00192-N, 1994.
Bash, J. O., Cooter, E. J., Dennis, R. L., Walker, J. T., and Pleim, J.
E.: Evaluation of a regional air-quality model with bidirectional
NH3 exchange coupled to an agroecosystem model, Biogeo-
sciences, 10, 1635–1645, doi:10.5194/bg-10-1635-2013, 2013.
www.atmos-chem-phys.net/16/1937/2016/ Atmos. Chem. Phys., 16, 1937–1953, 2016

1950 G. R. Wentworth et al.: Ammonia in the summertime Arctic marine boundary layer
Bell, T. G., Johnson, M. T., Jickells, T. D., and Liss, P. S.:
Ammonia/ammonium dissociation coefficient in seawater: A
significant numerical correction, Environ. Chem., 5, 183–186,
doi:10.1071/EN07032, 2008.
Bey, I., Jacob, D. J., Yantosca, R. M., Logan, J., Field, B. D., Fiore,
A. M., Li, Q., Liu, H. Y., Mickley, L. J., and Schultz, M. G.:
Global modeling of tropospheric chemistry with assimilated me-
teorology: Model description and evaluation, J. Geophys. Res.,
106, 23073, doi:10.1029/2001JD000807, 2001.
Blackall, T. D., Theobald, M. R., Milford, C., Hargreaves, K. J., Ne-
mitz, E., Wilson, L. J., Bull, J., Bacon, P. J., Hamer, K. C., Wan-
less, S., and Sutton, M. A.: Application of tracer ratio and inverse
dispersion methods with boat-based plume measurements to es-
timate ammonia emissions from seabird colonies, Water, Air,
Soil Pollut. Focus, 4, 279–285, doi:10.1007/s11267-004-3038-9,
2004.
Blackall, T. D., Wilson, L. J., Theobald, M. R., Milford, C., Ne-
mitz, E., Bull, J., Bacon, P. J., Hamer, K. C., Wanless, S., and
Sutton, M. A.: Ammonia emissions from seabird colonies, Geo-
phys. Res. Lett., 34, 1–5, doi:10.1029/2006GL028928, 2007.
Blais, M., Tremblay, J.-É., Jungblut, A. D., Gagnon, J., Martin, M.,
and Lovejoy, C.: Nitrogen flixation and identification of potential
diazotrophs in the Canadian Arctic, Global Biogeochem. Cy., 26,
GB3022, doi:10.1029/2011GB004096, 2012.
Bouwman, A. F., Lee, D. S., Asman, W. A. H., Dentener, F. J., Van
Der Hoek, K. W., Olivier, J. G. J., and Tg, N.: A global high-
resolution emission inventory for ammonia, Global Biogeochem.
Cy., 11, 561–587, 1997.
Breider, T. J., Mickley, L. J., Jacob, D. J., Wang, Q., Fisher, J. A.,
Chang, R. Y.-W., and Alexander, B.: Annual distributions and
sources of Arctic aerosol components, aerosol optical depth, and
aerosol absorption, J. Geophys. Res. Atmos., 119, 4107–4124,
doi:10.1002/2013JD020996, 2014.
Brioude, J., Arnold, D., Stohl, A., Cassiani, M., Morton, D.,
Seibert, P., Angevine, W., Evan, S., Dingwell, A., Fast, J. D.,
Easter, R. C., Pisso, I., Burkhart, J., and Wotawa, G.: The La-
grangian particle dispersion model FLEXPART-WRF version
3.1, Geosci. Model Dev., 6, 1889–1904, doi:10.5194/gmd-6-
1889-2013, 2013.
Carpenter, L. J., Archer, S. D., and Beale, R.: Ocean-atmosphere
trace gas exchange, Chem. Soc. Rev., 41, 6473–6506,
doi:10.1039/c2cs35121h, 2012.
Chang, R. Y.-W., Leck, C., Graus, M., Müller, M., Paatero, J.,
Burkhart, J. F., Stohl, A., Orr, L. H., Hayden, K., Li, S.-M.,
Hansel, A., Tjernström, M., Leaitch, W. R., and Abbatt, J.
P. D.: Aerosol composition and sources in the central Arctic
Ocean during ASCOS, Atmos. Chem. Phys., 11, 10619–10636,
doi:10.5194/acp-11-10619-2011, 2011.
Chapin, D. M. and Bledsoe, C.: Nitrogen fixation in arctic plant
communities, in Arctic Ecosystems in a Changing Climate: An
Ecophysiological Perspective, edited by: Chapin III, R. S., Jef-
fries, R. L., Reynolds, J. F., Shaver, G. R., and Svoboda, J., 301–
319, Academic Press, San Diego, 1992.
Chou, M.-D. and Suarez, M. J.: An efficient thermal infrared ra-
diation parameterization for use in general circulation models,
National Aeronautics and Space Administration, NASA Tech.
Memo, 84 pp., 1994.
Cleveland, C. C., Townsend, A. R., Schimel, D. S., Fisher, H.,
Hedin, L. O., Perakis, S., Latty, E. F., Fischer, C. Von, Elseroad,
A., and Wasson, M. F.: Global patterns of terrestrial biological ni-
trogen (N2) fixation in natural ecosystems, Global Biogeochem.
Cy., 13, 623–645, doi:10.1029/1999GB900014, 1999.
Darmenov, A. and da Silva, A.: The Quick Fire Emissions Dataset
(QFED) – Documentation of versions 2.1, 2.2 and 2.4, NASA
Technical Report Series on Global Modeling and Data Assim-
ilation, NASA TM-2013-104606, 32, 183 pp., Draft Document
(12939 kB), 2013.
DeLuca, T. H., Zackrisson, O., Gundale, M. J., and Nilsson, M.-
C.: Ecosystem feedbacks and nitrogen fixation in boreal forests,
Science, 320, 1181, doi:10.1126/science.1154836, 2008.
Duce, R. A., Liss, P. S., Merrill, J. T., Atlas, E. L., Buat-Menard, P.,
Hicks, B. B., Miller, J. M., Prospero, J. M., Arimoto, R., Church,
T. M., Ellis, W., Galloway, J. N., Hansen, L., Jickells, T. D.,
Knap, A. H., Reinhardt, K. H., Schneider, B., Soudine, A., Tokos,
J. J., Tsunogai, S., Wollast, R., and Zhou, M.: The atmospheric
input of trace species to the world ocean, Global Biogeochem.
Cy., 5, 193–259, doi:10.1029/91GB01778, 1991.
Environment Canada: Canadian Aerosol Baseline Measure-
ment (CABM) Data, available at: http://www.ec.gc.ca/
donneesnatchem-natchemdata/default.asp?lang=En&n=
22F5B2D4-1 (last access: 7 May 2015), 2014.
Fairlie, T. D., Jacob, D. J., and Park, R. J., The impact of transpacific
transport of mineral dust in the United States, Atmos. Environ.,
41, 1251–1266, 2007.
Fairlie, T. D., Jacob, D. J., Dibb, J. E., Alexander, B., Avery, M.
A., van Donkelaar, A., and Zhang, L.: Impact of mineral dust on
nitrate, sulfate, and ozone in transpacific Asian pollution plumes,
Atmos. Chem. Phys., 10, 3999–4012, doi:10.5194/acp-10-3999-
2010, 2010.
Fickert, S., Adams, J. W., and Crowley, J. N.: Activation of Br2 and
BrCl via uptake of HOBr onto aqueous salt solutions, J. Geophys.
Res., 104, 23719–23727, 1999.
Fisher, J. A., Jacob, D.J., Wang, Q., Bahreini, R., Carouge, C.
C., Cubison, M. J., Dibb, J. E., Diehl, T., Jimenez, J. L. ,
Leibensperger, E. M., Lu, Z., Meinders, M. B. J., Pye, H. O.
T., Quinn, P. K., Sharma, S., Streets, D. G., van Donkelaar, A.,
and Yantosca, R. M.: Sources, distribution, and acidity of sulfate-
ammonium aerosol in the Arctic in winter-spring, Atmos. Envi-
ron., 45, 7301–7318, doi:10.1016/j.atmosenv.2011.08.030, 2011.
Fountoukis, C. and Nenes, A.: ISORROPIA II: a computa-
tionally efficient thermodynamic equilibrium model for K+-
Ca2+-Mg2+-NH+4
-Na+-SO2−4
-NO−3
-Cl−-H2O aerosols, At-
mos. Chem. Phys., 7, 4639–4659, doi:10.5194/acp-7-4639-2007,
2007.
Gaston, A. J., Gilchrist, H. G., and Hipfner, J. M.: Climate change,
ice conditions and reproduction in an Arctic nesting marine bird:
Brunnich’s guillemot (Uria lomvia L.), J. Anim. Ecol., 74, 832–
841, doi:10.1111/j.1365-2656.2005.00982.x, 2005.
Geernaert, L. L. S., Geernaert, G. L., Granby, K., and Asman, W.
A. H.: Fluxes of soluble gases in the marine atmosphere surface
layer, Tellus, 50B, 111–127, 1998.
Gibb, S. W., Mantoura, R. F. C., and Liss, P. S.: Ocean-atmosphere
exchange and atmospheric speciation of ammonia and methy-
lamines in the region of the NW Arabian Sea, Global Bio-
geochem. Cy., 13, 161–178, doi:10.1029/98GB00743, 1999.
Hardy, R. W. F., Holsten, R. D., Jackson, E. K., and Burns, R. C.:
The Acetylene-Ethylene Assay for N2 Fixation: Laboratory and
Field Evaluation, Plant Physiol., 43, 1185–1207, 1968.
Atmos. Chem. Phys., 16, 1937–1953, 2016 www.atmos-chem-phys.net/16/1937/2016/

G. R. Wentworth et al.: Ammonia in the summertime Arctic marine boundary layer 1951
Hobara, S., McCalley, C., Koba, K., Giblin, A. E., Weiss, M. S.,
Gettel, G. M., and Shaver, G. R.: Nitrogen Fixation in Surface
Soils and Vegetation in an Arctic Tundra Watershed: A Key
Source of Atmospheric Nitrogen, Arctic, Antarct. Alp. Res., 38,
363–372, 2006.
Holmes, R. M., Aminot, A., Kérouel, R., Hooker, B. A and Peter-
son, B. J.: A simple and precise method for measuring ammo-
nium in marine and freshwater ecosystems, Can. J. Fish. Aquat.
Sci., 56, 1801–1808, doi:10.1139/f99-128, 1999.
Hong, S.-Y., Dudhia, J., and Chen, S.-H.: A revised approach to ice
microphysical processes for the bulk parameterization of clouds
and precipitation, Mon. Weather Rev., 132, 103–120, 2004.
Iacono, M. J., Delamere, J. S., Mlawer, E. J., Shephard, M.
W., Clough, S. A., and Collins, W. D.: Radiative forcing
by long-lived greenhouse gases: Calculations with the AER
radiative transfer models, J. Geophys. Res., 113, D13103,
doi:10.1029/2008JD009944, 2008.
Janjic, Z. I.: The Step-Mountain Eta Coordinate Model: Further de-
velopments of the convection, viscous sublayer, and turbulence
closure schemes, Mon. Weather Rev., 122, 927–945, 1994.
Janjic, Z. I.: The surface layer in the NCEP eta Model, in: Eleventh
conference on numerical weather prediction, Norfolk, VA, 19–
23 August 1996, 354–355, 1996.
Janjic, Z. I.: Nonsingular implementation of the Mellor-Yamada
Level 2.5 Scheme in the NCEP Meso model, National Centers
for Environmental Prediction, Office Note No. 437, 61 pp., 2002.
Johnson, M. T.: The air-sea flux of ammonia, PhD thesis, University
of East Anglia, 2004.
Johnson, M. T.: A numerical scheme to calculate temperature and
salinity dependent air-water transfer velocities for any gas, Ocean
Sci., 6, 913–932, doi:10.5194/os-6-913-2010, 2010.
Johnson, M. T. and Bell, T. G.: Coupling between dimethylsulphide
emissions and the ocean-atmosphere exchange of ammonia, En-
viron. Chem., 5, 259–267, doi:10.1071/EN08030, 2008.
Johnson, M. T., Liss, P. S., Bell, T. G., Lesworth, T. J., Baker, A.
R., Hind, A. J., Jickells, T. D., Biswas, K. F., Woodward, E. M.
S., and Gibb, S. W.: Field observations of the ocean-atmosphere
exchange of ammonia: Fundamental importance of temperature
as revealed by a comparison of high and low latitudes, Global
Biogeochem. Cy., 22, 1–15, doi:10.1029/2007GB003039, 2008.
Kain, J. S.: The Kain-Fritsch convective parameterization: An up-
date, J. Appl. Meteorol., 43, 170–181, 2004.
Kirkby, J., Curtius, J., Almeida, J., Dunne, E., Duplissy, J., Ehrhart,
S., Franchin, A., Gagné, S., Ickes, L., Kürten, A., Kupc, A., Met-
zger, A., Riccobono, F., Rondo, L., Schobesberger, S., Tsagko-
georgas, G., Wimmer, D., Amorim, A., Bianchi, F., Breitenlech-
ner, M., David, A., Dommen, J., Downard, A., Ehn, M., Fla-
gan, R. C., Haider, S., Hansel, A., Hauser, D., Jud, W., Junni-
nen, H., Kreissl, F., Kvashin, A., Laaksonen, A., Lehtipalo, K.,
Lima, J., Lovejoy, E. R., Makhmutov, V., Mathot, S., Mikkilä, J.,
Minginette, P., Mogo, S., Nieminen, T., Onnela, A., Pereira, P.,
Petäjä, T., Schnitzhofer, R., Seinfeld, J. H., Sipilä, M., Stozhkov,
Y., Stratmann, F., Tomé, A., Vanhanen, J., Viisanen, Y., Vrtala,
A., Wagner, P. E., Walther, H., Weingartner, E., Wex, H., Win-
kler, P. M., Carslaw, K. S., Worsnop, D. R., Baltensperger, U.,
and Kulmala, M.: Role of sulphuric acid, ammonia and galac-
tic cosmic rays in atmospheric aerosol nucleation, Nature, 476,
429–433, doi:10.1038/nature10343, 2011.
Krupa, S. V.: Effects of atmospheric ammonia (NH3) on ter-
restrial vegetation: A review, Environ. Pollut., 124, 179–221,
doi:10.1016/S0269-7491(02)00434-7, 2003.
Lana, A., Bell, T. G., Simó, R., Vallina, S. M., Ballabrera-Poy,
J., Kettle, A. J., Dachs, J., Bopp, L., Saltzman, E. S., Ste-
fels, J., Johnson, J. E., and Liss, P. S.: An updated climatology
of surface dimethlysulfide concentrations and emission fluxes
in the global ocean, Global Biogeochem. Cycles, 25, GB1004,
doi:10.1029/2010GB003850, 2011.
Leaitch, W. R., Sharma, S., Huang, L., Toom-Sauntry, D.,
Chivulescu, A., Macdonald, A. M., von Salzen, K., Pierce, J. R.,
Bertram, A. K., Schroder, J. C., Shantz, N. C., Chang, R. Y.-W.,
and Norman, A.-L.: Dimethyl sulfide control of the clean sum-
mertime Arctic aerosol and cloud., Elem. Sci. Anth., 1, 000017,
doi:10.12952/journal.elementa.000017, 2013.
Leck, C., Nilsson, E. D., Bigg, E. K., and Bäcklin, L.: At-
mospheric program on the Arctic Ocean Expedition 1996
(AOE-96): An overview of scientific goals, experimental ap-
proach, and instruments, J. Geophys. Res., 106, 32051–32067,
doi:10.1029/2000JD900461, 2001.
Lefer, B. L., Talbot, R. W., and Munger, J. W.: Nitric acid and am-
monia at a rural northeastern U.S. site, J. Geophys. Res., 104,
1645, doi:10.1029/1998JD100016, 1999.
Legrand, M., Ducroz, F., Wagenbach, D., Mulvaney, R., and Hall,
J.: Ammonium in coastal Antarctic aerosol and snow: Role of po-
lar ocean and penguin emissions, J. Geophys. Res., 103, 11043–
11056, 1998.
Liao, H., Henze, D. K., Seinfeld, J. H., Wu, S., and Mickley, L.
J.: Biogenic secondary organic aerosol over the United States:
Comparison of climatological simulations with observations, J.
Geophys. Res., 112, D06201, doi:10.1029/2006JD007813, 2007.
Lin, J.-T. and McElroy, M.: Impacts of boundary layer mixing
on pollutant vertical profiles in the lower troposphere: Implica-
tions to satellite remote sensing, Atmos. Environ. 44, 1726–1739,
doi:10.1016/j.atmosenv.2010.02.009, 2010.
Lindeboom, H. J.: The Nitrogen Pathway in a Penguin Rookery,
Ecology, 65, 269–277, 1984.
Liss, P. S.: Gas transfer: Experiments and geochemical implications,
in Air-Sea Exchange of Gases and Particles, edited by: Liss, P. S.
and Slinn, W. G. N., 241–298, Springer Netherlands, 1983.
Liss, P. S. and Slater, P. G.: Flux of Gases across the Air-Sea Inter-
face, Nature, 247, 181–184, doi:10.1038/247181a0, 1974.
Liu, H. Y., Jacob, D. J., Bey, I., and Yantosca, R. M.: Constraints
from Pb-210 and Be-7 on wet deposition and transport in a
global three-dimensional chemical tracer model driven by as-
similated meteorological fields, J. Geophys. Res.-Atmos., 106,
12109–12128, 2001.
Lüthje, M., Feltham, D. L., Taylor, P. D., and Worster, M. G.: Mod-
eling the summertime evolution of sea-ice melt ponds, J. Geo-
phys. Res. Ocean., 111, C02001, doi:10.1029/2004JC002818,
2006.
Mallory, M. L. and Forbes, M. R.: Does sea ice constrain the breed-
ing schedules of high Arctic Northern Fulmars?, Condor, 109,
894–906, 2007.
Markovic, M. Z., VandenBoer, T. C., and Murphy, J. G.: Charac-
terization and optimization of an online system for the simul-
taneous measurement of atmospheric water-soluble constituents
in the gas and particle phases, J. Environ. Monit., 14, 1872,
doi:10.1039/c2em00004k, 2012.
www.atmos-chem-phys.net/16/1937/2016/ Atmos. Chem. Phys., 16, 1937–1953, 2016

1952 G. R. Wentworth et al.: Ammonia in the summertime Arctic marine boundary layer
Martin, J., Tremblay, J.-É., Gagnon, J., Tremblay, G., Lapoussiere,
A., Jose, C., Poulin, M., Gosselin, M., Gratton, Y., and Michel,
C.: Prevalence, structure and properties of subsurface chlorophyll
maxima in Canadian Arctic waters, Mar. Ecol.-Prog. Ser., 412,
69–84, 2010.
Martin, S. T., Hung, H.-M., Park, R. J., Jacob, D. J., Spurr, R. J.
D., Chance, K. V., and Chin, M.: Effects of the physical state
of tropospheric ammonium-sulfate-nitrate particles on global
aerosol direct radiative forcing, Atmos. Chem. Phys., 4, 183–
214, doi:10.5194/acp-4-183-2004, 2004.
McKane, R. B., Johnson, L. C., Shaver, G. R., Nadelhoffer,
K. J., Rastetter, E. B., Fry, B., Giblin, A. E., Kielland, K.,
Kwiatkowski, B. L., Laundre, J. A., and Murray, G.: Resource-
based niches provide a basis for plant species diversity and domi-
nance in arctic tundra, Nature, 415, 68–71, doi:10.1038/415068a,
2002.
McKee, C. M.: Biogeochemical Cycles of Ammonia and Dimehtyl-
sulphide in the Marine Environment, PhD thesis, University of
East Anglia, 2001.
McLaren, P. L.: Spring migration and habitat use by seabirds in east-
ern Lancaster Sound and western Baffin Bay, Arctic, 35, 88–111,
1982.
Monin, A. S. and Obukhov, A. M.: Basic laws of turbulent mixing
in the surface layer of the atmosphere, Contrib. Geophys. Inst.
Acad. Sci. USSR, 151, 163–187, 1954 (in Russian).
NASA: Fire Information Resource Management System (FIRMS),
available at: https://earthdata.nasa.gov/earth-observation-data/
near-real-time/firms, last access: 30 June 2015.
Nightingale, P. D., Malin, G., Law, C. S., Watson, A. J., Liss, P.
S., Liddicoat, M. I., Boutin, J., and Upstill-Goddard, R. C.: In
situ evaluation of air-sea gas exchange parameterizations using
novel conservative and volatile tracers, Global Biogeochem. Cy-
cles, 14, 373, doi:10.1029/1999GB900091, 2000.
Norman, M. and Leck, C.: Distribution of marine boundary
layer ammonia over the Atlantic and Indian Oceans dur-
ing the Aerosols99 cruise, J. Geophys. Res., 110, D16302,
doi:10.1029/2005JD005866, 2005.
Park, R. J., Jacob, D. J., Chin, M., and Martin, R. V.: Sources
of carbonaceous aerosols over the United States and impli-
cations for natural visibility, J. Geophys. Res., 108, D15204,
doi:10.1029/2002JD003190, 2003.
Park, R. J., Jacob, D. J., Field, B. D., and Yantosca, R. M.: Natu-
ral and trans-boundary pollution influences on sulphate-nitrate-
ammonium aerosols in the United States: Implications for pol-
icy, J. Geophys. Res., 109, D15204, doi:10.1029/2003JD004473,
2004.
Park, R. J., Jacob, D. J., Naresh, K., and Yantosca, R. M.: Re-
gional visibility statistics in the United States: Natural and trans-
boundary pollution influences, and implications for the Regional
Haze Rule, Atmos. Environ., 40, 5405–5423, 2006.
Paulot, F., Jacob, D. J., Johnson, M. T., Bell, T. G., Baker, A. R.,
Keene, W. C., Lima, I. D., Doney, S. C., and Stock, C. A.: Global
oceanic emission of ammonia: Constraints from seawater and
atmospheric observations, Global Biogeochem. Cy., 29, 1165–
1178, doi:10.1002/2015GB005106, 2015.
Petters, M. D. and Kreidenweis, S. M.: A single parameter repre-
sentation of hygroscopic growth and cloud condensation nucleus
activity, Atmos. Chem. Phys., 7, 1961–1971, doi:10.5194/acp-7-
1961-2007, 2007.
Quinn, P. K., Charlson, R. J., and Bates, T. S.: Simultaneous obser-
vations of ammonia in the atmosphere and ocean, Nature, 335,
336–338, doi:10.1038/335336a0, 1988.
Quinn, P. K., Bates, T. S., Johnson, J. E., Covert, D. S., and Charl-
son, R. J.: Interactions between the sulfur and reduced nitro-
gen cycles over the central Pacific Ocean, J. Geophys. Res., 95,
16405–16416, 1990.
Quinn, P. K., Asher, W. E., and Charlson, R. J.: Equilibria of the
Marine Muitiphase Ammonia System, J. Atmos. Chem., 14, 11–
30, 1992.
Quinn, P. K., Barrett, K. J., Dentener, F. J., Lipschultz, F., and
Six, K. D.: Estimation of the air/sea exchange of ammonia
for the North Atlantic Basin, Biogeochemistry, 35, 275–304,
doi:10.1007/BF02179831, 1996.
Reis, S., Pinder, R. W., Zhang, M., Lijie, G., and Sutton, M.
A.: Reactive nitrogen in atmospheric emission inventories, At-
mos. Chem. Phys., 9, 7657–7677, doi:10.5194/acp-9-7657-2009,
2009.
Riddick, S. N., Dragosits, U., Blackall, T. D., Daunt, F., Wan-
less, S., and Sutton, M. A.: The global distribution of ammonia
emissions from seabird colonies, Atmos. Environ., 55, 319–327,
doi:10.1016/j.atmosenv.2012.02.052, 2012a.
Riddick, S. N., Dragosits, U., Blackall, T. D., Daunt, F., Wan-
less, S., and Sutton, M. A.: Global ammonia emissions
from seabirds. NERC Environmental Information Data Centre,
doi:10.5285/c9e802b3-43c8-4b36-a3a3-8861d9da8ea9, 2012b.
Riddick, S. N., Blackall, T. D., Dragosits, U., Daunt, F., Bra-
ban, C. F., Tang, Y. S., MacFarlane, W., Taylor, S., Wanless,
S., and Sutton, M. A.: Measurement of ammonia emissions
from tropical seabird colonies, Atmos. Environ., 89, 35–42,
doi:10.1016/j.atmosenv.2014.02.012, 2014.
Schmidt, S., Mackintosh, K., Gillett, R., Pudmenzky, A., Allen,
D. E., Rennenberg, H., and Mueller, J. F.: Atmospheric con-
centrations of ammonia and nitrogen dioxide at a tropical coral
cay with high seabird density., J. Environ. Monit., 12, 460–465,
doi:10.1039/b910922f, 2010.
Seabird Information Network: Circumpolar Seabird Data Por-
tal, available at: http://axiom.seabirds.net/circumpolar_portal.
php, last access: 13 March 2015.
Sharma, S., Barrie, L. A., Plummer, D., Mcconnell, J. C., Brickell, P.
C., Levasseur, M., Gosselin, M., and Bates, T. S.: Flux estimation
of oceanic dimethyl slufide around North America, J. Geophys.
Res., 104, 21327–21342, 1999.
Sharma, S., Chan, E., Ishizawa, M., Toom-Sauntry, D., Gong, S.
L., Li, S.-M., Tarasick, D. W., Leaitch, W. R., Norman, A.-L.,
Quinn, P. K., Bates, T. S., Levasseur, M., Barrie, L. A., and
Maenhaut, W.: Influence of transport and ocean ice extent on bio-
genic aerosol sulfur in the Arctic atmosphere, J. Geophys. Res.-
Atmos., 117, D12209, doi:10.1029/2011JD017074, 2012.
Shaver, G. R. and Chapin III, F. S.: Response to fertilization by var-
ious plant growth forms in an Alaskan tundra: nutrient accumu-
lation and growth, Ecology, 61, 662–675, doi:10.2307/1937432,
1980.
Skamarock, W. C., Klemp, J. B., Dudhia, J., Gill, D. O., Barker, D.
M., Wang, W., and Powers, J. G.: A description of the advanced
research WRF version 2, National Center for Atmospheric Re-
search, Technical Note, 88 pp., 2005.
Stewart, K. J., Brummell, M. E., Coxson, D. S., and Siciliano, S. D.:
How is nitrogen fixation in the high arctic linked to greenhouse
Atmos. Chem. Phys., 16, 1937–1953, 2016 www.atmos-chem-phys.net/16/1937/2016/

G. R. Wentworth et al.: Ammonia in the summertime Arctic marine boundary layer 1953
gas emissions?, Plant Soil, 362, 215–229, doi:10.1007/s11104-
012-1282-8, 2012.
Stewart, K. J., Grogan, P., Coxson, D. S., and Siciliano, S. D.: To-
pography as a key factor driving atmospheric nitrogen exchanges
in arctic terrestrial ecosystems, Soil Biol. Biochem., 70, 96–112,
doi:10.1016/j.soilbio.2013.12.005, 2014.
Stohl, A., Forster, C., Frank, A., Seibert, P., and Wotawa, G.:
Technical note: The Lagrangian particle dispersion model
FLEXPART version 6.2, Atmos. Chem. Phys., 5, 2461–2474,
doi:10.5194/acp-5-2461-2005, 2005.
Sutton, M. A., Reis, S., Riddick, S. N., Dragosits, U., Nemitz, E.,
Theobald, M. R., Tang, Y. S., Braban, C. F., Vieno, M., Dore, A.
J., Mitchell, R. F., Wanless, S., Daunt, F., Fowler, D., Blackall,
T. D., Milford, C., Flechard, C. R., Loubet, B., Massad, R., Cel-
lier, P., Personne, E., Coheur, P. F., Clarisse, L., Van Damme,
M., Ngadi, Y., Clerbaux, C., Skjøth, C. A., Geels, C., Hertel,
O., Wichink Kruit, R. J., Pinder, R. W., Bash, J. O., Walker, J.
T., Simpson, D., Horváth, L., Misselbrook, T. H., Bleeker, A.,
Dentener, F., and de Vries, W.: Towards a climate-dependent
paradigm of ammonia emission and deposition, Phil. Trans. R.
Soc. B, 368, 20130166, doi:10.1098/rstb.2013.0166, 2013.
Takahashi, T., Sutherland, S. C., Chipman, D. W., Goddard, J. G.,
and Ho, C.: Climatological distributions of pH, pCO2, total CO2,
alkalinity, and CaCO3 saturation in the global surface ocean, and
temporal changes at selected locations, Mar. Chem., 164, 95–
125, doi:10.1016/j.marchem.2014.06.004, 2014.
Tewari, M., Chen, F., Wang, W., Dudhia, J., LeMone, M. A.,
Mitchell, K., Ek, M., Gayno, G., Wegiel, J., and Cuenca, R. H.:
Implementation and verification of the unified NOAH land sur-
face model, 20th Conference on Weather Analysis and Forecast-
ing/16th Conference on Numerical Weather Prediction, Seattle,
WA, American Meteorolgical Society, 10–15 January 2004.
Theobald, M. R., Crittenden, P. D., Hunt, A. P., Tang, Y. S.,
Dragosits, U., and Sutton, M. A.: Ammonia emissions from a
Cape fur seal colony, Cape Cross, Namibia, Geophys. Res. Lett.,
33, L03812, doi:10.1029/2005GL024384, 2006.
Van Cleve, K. and Alexander, V.: Nitrogen cycling in tundra and
boreal ecosystems, in Terrestrial Nitrogen Cycles, edited by F.
E. Clark and T. Rosswall, 375–404, Swedish National Research
Council, Stockholm, 1981.
van Donkelaar, A., Martin, R. V., Leaitch, W. R., Macdonald, A. M.,
Walker, T. W., Streets, D. G., Zhang, Q., Dunlea, E. J., Jimenez,
J. L., Dibb, J. E., Huey, L. G., Weber, R., and Andreae, M. O.:
Analysis of aircraft and satellite measurements from the Inter-
continental Chemical Transport Experiment (INTEX-B) to quan-
tify long-range transport of East Asian sulfur to Canada, At-
mos. Chem. Phys., 8, 2999–3014, doi:10.5194/acp-8-2999-2008,
2008.
Wang, Q., Jacob, D. J., Fisher, J. A., Mao, J., Leibensperger, E. M.,
Carouge, C. C., Le Sager, P., Kondo, Y., Jimenez, J. L., Cubi-
son, M. J., and Doherty, S. J.: Sources of carbonaceous aerosols
and deposited black carbon in the Arctic in winter-spring: impli-
cations for radiative forcing, Atmos. Chem. Phys., 11, 12453–
12473, doi:10.5194/acp-11-12453-2011, 2011.
Wesely, M. L.: Parameterization of surface resistances to gaseous
dry deposition in regional-scale numerical-models, Atmos. Envi-
ron., 23, 1293–1304, doi:10.1016/0004-6981(89)90153-4, 1989.
Wichink Kruit, R. J., Schaap, M., Sauter, F. J., van Zanten, M. C.,
and van Pul, W. A. J.: Modeling the distribution of ammonia
across Europe including bi-directional surface-atmosphere ex-
change, Biogeosciences, 9, 5261–5277, doi:10.5194/bg-9-5261-
2012, 2012.
Wilson, L. J., Bacon, P. J., Bull, J., Dragosits, U., Blackall, T.
D., Dunn, T. E., Hamer, K. C., Sutton, M. A., and Wan-
less, S.: Modelling the spatial distribution of ammonia emis-
sions from seabirds in the UK, Environ. Pollut., 131, 173–185,
doi:10.1016/j.envpol.2004.02.008, 2004.
Zhu, R., Sun, J., Liu, Y., Gong, Z., and Sun, L.: Potential ammo-
nia emissions from penguin guano, ornithogenic soils and seal
colony soils in coastal Antarctica: effects of freezing-thawing cy-
cles and selected environmental variables, Antarct. Sci., 23, 78–
92, doi:10.1017/S0954102010000623, 2011.
www.atmos-chem-phys.net/16/1937/2016/ Atmos. Chem. Phys., 16, 1937–1953, 2016