Embed Size (px)
Citation preview
A
K
aL
L
0d
Applied nutritional investigation
Amino acid supplementation decreases plasma and livertriacylglycerols in elderly
Elisabet Børsheim, Ph.D.a,*, Quynh-Uyen T. Bui, M.D.b, Sandrine Tissier, P.T.c,Melanie G. Cree, M.D., Ph.D.a, Ola Rønsen, M.D., Ph.D.a, Beatrice Morio, Ph.D.d,
Arny A. Ferrando, Ph.D.a,†, Hisamine Kobayashi, D.V.M.e, Bradley R. Newcomer, Ph.D.f,and Robert R. Wolfe, Ph.D.a,†
a Department of Surgery/Shriners Hospitals for Children, University of Texas Medical Branch, Galveston, Texas, USAb Department of Internal Medicine, University of Texas Medical Branch, Galveston, Texas, USAc Department of Physical Therapy, University of Texas Medical Branch, Galveston, Texas, USA
d Protein and Energy Metabolism Research Unit, Human Nutrition Research Centre of Auvergne, Clermont-Ferrand, Francee AminoScience Laboratories, Ajinomoto Co., Inc., Kawasaki, Japan
f Radiography Program, University of Alabama at Birmingham, Birmingham, Alabama, USA
Manuscript received May 14, 2008; accepted September 9, 2008.
bstract Objective: Hypertriglyceridemia is a risk factor for coronary heart disease. The aim of this studywas to determine the effect of amino acid (AA) supplementation on plasma, liver, and muscle lipidconcentrations and insulin sensitivity in the elderly.Methods: Twelve impaired glucose tolerant elderly (mean � SD 67.0 � 5.6 y of age, seven womenand five men) ingested 11 g of essential AAs plus arginine twice a day for 16 wk, after a 7-wkcontrol run-in. Diet and activity were not otherwise modified. Plasma lipid concentrations and oralglucose tolerance were measured every fourth week and tissue lipid concentrations (magneticresonance spectroscopy) every eighth week.Results: No changes in plasma lipids were observed during the control run-in. AA supplementationlowered plasma triacylglycerol (TG; P � 0.001), total cholesterol (P � 0.048), and very low-densitylipoprotein cholesterol (P � 0.001) concentrations. Plasma TG decreased �20% from the initialvalue of 1.45 � 0.18 mmol/L (mean � SE, 128 � 16 mg/dL), with the greatest decrease in thesubjects starting out with the highest concentrations (r � �0.83). Similarly, liver fat content (liverTG/Intralipid standard) decreased �50% from the initial value of 0.34 � 0.06 (P � 0.021, n � 8),with the greatest decrease in the subjects who initially had the highest values (r � �0.86).Intramuscular fat content and insulin sensitivity did not change.Conclusion: Diet supplementation with AAs lowers plasma TG, total cholesterol, and verylow-density lipoprotein cholesterol concentrations and liver lipid content in impaired glucosetolerant elderly. AA supplementation may have a potential role in the treatment of hypertriglycer-idemia or hepatic steatosis. © 2009 Published by Elsevier Inc.
eywords: Elderly; Amino acids; Plasma lipids; Liver lipids; Insulin sensitivity
The study was supported by grant P30 AG024832, Shriners Grant 8490, and Ajinomoto Co., Inc. (which provided the amino acids). Studies performedt General Clinical Research Center at University of Texas Medical Branch at Galveston were supported by grant M01 RR 000073. AminoScienceaboratories is part of Ajinomoto Co., which is the company that provided the free amino acids in this study.
* Corresponding author. Tel.: �1-409-770-6609; fax: �1-409-770-6825.E-mail address: [email protected] (E. Børsheim).† Current address: Center for Translational Research in Aging and Longevity, University of Arkansas for Medical Sciences, 4301 W. Markham St., #806,
Nutrition 25 (2009) 281–288www.nutritionjrnl.com
ittle Rock, AR 72205, USA.
899-9007/09/$ – see front matter © 2009 Published by Elsevier Inc.oi:10.1016/j.nut.2008.09.001
I
iatE
at(cecpdtmdsddwciccewvpl
emsmarmtcwesBgmb
pwigt(
as
M
S
mvtwsGTssalmwlopG
S
w1iaotbbtpshtwppsicmgcgs
282 E. Børsheim et al. / Nutrition 25 (2009) 281–288
ntroduction
Hypertriglyceridemia has been shown to be a significantndependent risk factor for coronary artery disease [1–3],nd treatment for hypertriglyceridemia has been included inhe Adult Treatment Panel III of the National Cholesterolducation Program [4].
Low-carbohydrate diets have been shown to positivelyffect plasma lipid concentrations, resulting in decreasedriacylglycerol (TG) and increased high-density lipoproteinHDL) concentrations in the presence of weight loss andompared with low-fat diets [5,6]. However, because di-tary fat, carbohydrate, and protein are the primary energy-ontaining macronutrients, it is difficult to study the inde-endent effects of changing one of the components of theiet [7]. If the intake of one of them is decreased, compensa-ory adjustments in one or both of the others must occur toaintain energy balance. Thus, most of the low-carbohydrate
iets have elevated protein intake, and it is difficult toeparate the independent effects of an absence of carbohy-rates in the diet versus elevated protein intake. In accor-ance with this, studies of high-protein diets with or withouteight loss also suggest a lowering effect on plasma TG
oncentration [8–13]. It has been difficult to separate thendependent effects of protein from those of an absence ofarbohydrate or change in body weight. A further compli-ation is the type of individual macronutrient in the diet,.g., protein of plant versus animal origin, carbohydrateith a low versus a high glycemic index, and saturatedersus unsaturated fat. For example, the vegetable plantrotein soy protein seems to have unique effects on plasmaipoproteins [14].
Thus, in an effort to clarify the potential independentffect of protein on plasma and tissue lipids, we supple-ented a normal weight-maintaining diet with a relatively
mall amount of amino acids (AAs; �90 kcal/d) betweeneals in the present study. We measured tissue lipids in
ddition to plasma lipids because the increase in insulinesistance with aging has been linked to increased fat accu-ulation in muscle and liver tissue [15,16]. Increased pro-
ein intake in the context of weight loss improves glucoseontrol [17], but the effect of AA supplementation during aeight-maintaining diet is not known. Further, it has repeat-
dly been shown that AA intake stimulates muscle proteinynthesis and improves muscle protein net balance [18].ecause muscle is the main tissue for insulin-mediatedlucose uptake, it may be hypothesized that an increase inuscle mass would improve insulin action at the whole-
ody level.The over-riding hypothesis of this study was that sup-
lementation of the normal diet with a mixture of AAsould reduce circulating and tissue TG concentrations and
mprove insulin sensitivity in elderly subjects with impairedlucose tolerance. The aim of the study was to investigatehe effect of supplementation of the diet with essential AAs
EAAs) plus arginine on plasma, liver and muscle lipids, lnd insulin sensitivity in impaired glucose tolerant elderlyubjects.
aterials and methods
tudy design
Twelve elderly volunteers participated in an approxi-ately 24-wk study period. After a run-in period of obser-
ation of �7 wk, they ingested 11 g of EAAs plus argininewo times a day, between meals, for 16 wk. Diet and activityere not otherwise modified. Every fourth week after the
tart of AA ingestion, the subjects were admitted to theeneral Clinical Research Center (GCRC) at University ofexas Medical Branch (UTMB), Galveston. Body compo-ition was measured by a full-body dual-energy x-ray ab-orptiometric scan, and insulin sensitivity was measured byn oral glucose tolerance test (OGTT). In addition, a plasmaipid panel was determined. Muscle and liver lipids wereeasured by magnetic resonance spectroscopy every eightheek. At weeks 0 and 16, a muscle biopsy was also col-
ected from the musculus vastus lateralis for measurementf activities of oxidative enzymes. The protocol was ap-roved by the institutional review board at UTMB and theCRC advisory committee at UTMB.
ubjects
Twelve impaired glucose tolerant elderly subjects (sevenomen and five men, mean � SD 67.0 � 5.6 y of age,64.5 � 16.4 cm, 74.3 � 19.7 kg at baseline) participatedn the study. They were fully informed about the purposend procedures of the study before written consent wasbtained. Each subject had a complete medical screening athe GCRC before participation in the experiments (51 � 9 defore the start of supplementation), including vital signs,lood tests, urine tests, and a 12-lead electrocardiogram, andhese results were used as a baseline for the placebo run-ineriod for those subjects who qualified to participate in thetudy. Exclusion criteria included evidence of heart disease,yperlipidemia, kidney or liver disease, or any other diseasehat might influence the results of the study. Hyperlipidemiaas excluded because we wanted to examine the effect ofrotein in the elderly without the confounding variable ofre-existing hyperlipidemia. The subjects also underwent atandard OGTT using 75 g of glucose. Only subjects withmpaired glucose tolerance, defined as a plasma glucoseoncentration �10 mmol/L (180 mg/dL) at 1 h or �7.8mol/L (140 mg/dL) at 2 h after an oral intake of 75 g of
lucose, were included. Diabetic subjects (plasma glucoseoncentration �11.1 mmol/L [200 mg/dL] at 1 or 2 h afterlucose intake) with a decreased insulin production andubjects taking any medication to treat abnormal blood lipid
evels were not included in the study.
N
o00tcipEgcmwrflwwcdi
D
tpcmSdsho7(
M
oatTapwtawo(
ttA(mvworr[cmaF(zawSoelifafyvttu
wwwlasp2o2sma
D
acw
283E. Børsheim et al. / Nutrition 25 (2009) 281–288
utritional supplement
Each dose of the nutritional supplement consisted of 11 gf AAs with the following composition: 0.36 g of histidine,.94 g of isoleucine, 3.95 g of leucine, 1.88 g of lysine · HCl,.39 g of methionine, 0.51 g of phenylalanine, 1.05 g ofhreonine, 0.82 g of valine, and 1.10 g of arginine. Thehoice of AAs was based on our numerous previous find-ngs in muscle that only EAAs are needed for stimulation ofrotein synthesis [19,20]. Thus, we expected that only theAAs were needed to achieve an effect, and the amountiven (grams or kilocalories) could be restricted. We in-luded arginine in addition to the EAAs because arginineay have unique anabolic effects [21,22]. The supplementas taken in two daily doses in the form of capsules and
ecorded in a diary. The first dose was taken between break-ast and lunch, and the second dose was ingested betweenunch and dinner. The subjects visited the hospital every 2k to pick up a new supply of supplements. In the weeksith no hospital visits, the subjects were given follow-up
alls to check on the intake of the supplements and on theiet, activity, and anything else (sickness, etc.) that mightnfluence the results of the study.
iet and physical activity
Before the start of the study the subjects were counseledo maintain their typical dietary intake and physical activityattern. During their visits to the hospital and in telephonealls between visits, they were asked about this and re-inded to not make any changes. The Physical Activitycale for Elderly was used to measure their physical activityuring the study period. Further, at the start of the study theubjects were instructed by the dietitian at the GCRC onow to complete a diet diary. In the week before the firstvernight stay and every fourth week thereafter (weeks 3,, 11, and 15), the participants recorded their diet for 3 d2 weekdays and 1 weekend day).
agnetic resonance spectroscopy
Every eighth week, the intramuscular lipid concentrationf the musculus soleus was measured with a 1H knee coil onGE Advantage 1.5-T whole-body imager (General Elec-
ric, Milwaukee, WI, USA), as previously described [16].he widest part of the calf was located during the first studynd measured from the floor and marked. A marker waslaced at the location during the scan, and this slice of legas always used for scans. Four areas were selected from
he coronal slice localizer and traced onto a transparencylong with multiple anatomic landmarks. These four areasere then rescanned during each subsequent magnetic res-nance spectroscopic analysis. A tube of 20% Intralipid
intravenous high-fat total parenteral feeding solution; Bax- ler Healthcare, Deerfield Park, IL, USA) was placed insidehe knee coil to obtain a standard external reference [23].fter a preliminary localization image, three to seven voxels
�7 mm � 7 mm � 10 mm each) were chosen in theusculus soleus free from fascia, gross fat marbling, and
essels. The exact voxel volumes were recorded. A voxelas also chosen from the Intralipid external reference. Anptimized point resolved spectroscopic sequence with aepetition time of 2000 ms and an echo time of 35 ms wasun. Peak positions and areas of interest (extramuscularCH2]n, intramuscular [CH2]n, extramuscular CH3, intramus-ular CH3, total creatine, and trimethylamine) were deter-ined by time domain fitting using jMRUI [24,25]. In brief,
ll water-suppressed free induction decay (FID; metaboliteID) were deconvoluted with the water-unsuppressed FIDwater FID) acquired from the same voxel to correct forero-order phasing and removal of eddy current-inducedrtifacts [26]. The resulting metabolite FIDs were analyzedith AMARES (Method of Accurate, Robust and Efficientpectral fitting), a non-linear least-square-fitting algorithmperating in the time domain [16,27,28]. Spectra from vox-ls, which did not have optimal shimming or clear intracel-ular and extracellular lipid peak resolution, were not usedn the AMARES fitting analysis. This process was repeatedor the Intralipid phantom. The TG levels were computed asratio relative to the Intralipid standard using the following
ormula: TG � ([PM/VM]/[PI/VI]), where PM is the meth-lene peak area, VM is the total measured tissue voxelolume, PI is the Intralipid peak area, and VI is the In-ralipid voxel volume. This measurement is a TG concen-ration normalized to Intralipid concentration, and thus it isnitless.
Liver lipid concentration was measured with a 1Hhole-body coil on the same system. Hepatic measurementsere performed in the middle right lobe [29]. The scansere localized to the same area of the liver by anatomic
andmarking of the hepatic blood flow and the ribs, so thatpproximately the same area of liver was scanned with eachtudy. A tube of Intralipid was used for reference. After areliminary localization scan, a voxel (�30 mm � 30 mm �0 mm) was chosen at a location free from large vessels. Anptimized point resolved spectroscopic sequence was run56 times without respiratory gating. These spectra repre-ent an average lipid concentration measurement over theidright lobe. Spectra were manually phased, and final
nalysis was then performed with jMRUI.
ual-energy x-ray absorptiometry
The subjects underwent a full-body dual-energy x-raybsorptiometric scan every fourth week to determine bodyomposition. All dual-energy x-ray absorptiometric scansere performed on a Hologic QDR 4500 A system (Ho-
ogic, Inc., Bedford, MA, USA).
O
m1tTFT1pfia
M
OtkImt�o(
S
iOarw(EfuUTTCtticFHucttc
c
ned
C
wdSiTgwhevhia
S
iarnITcstdccrpobtdsS
R
sawvmi
284 E. Børsheim et al. / Nutrition 25 (2009) 281–288
ral glucose tolerance test
An OGTT was performed every fourth week to deter-ine insulin sensitivity. The subjects were fasted for about
2 h before the OGTT. A catheter was placed in a vein inhe arm, and two background blood samples were drawn.hereafter, the subjects received 75 g of glucose (Glucola,isherbrand LIMEONDEX, Fisher HealthCare, Houston,X, USA). Blood samples were collected at 30, 60, 90, and20 min after the glucose ingestion for the determination oflasma glucose, insulin, and glycerol concentrations. Therst blood sample was also analyzed for plasma lipid panelnd, in weeks 0 and 16, AA concentrations.
uscle biopsy
In weeks 0 and 16, a muscle biopsy was taken after theGTT, under local anesthesia, from the lateral portion of
he vastus lateralis, approximately 10–15 cm above thenee. A 5-mm Bergstrom biopsy needle (Depuy, Warsaw,N, USA) was used to sample approximately 30–50 mg ofixed muscle tissue. The sample was quickly rinsed, blot-
ed, and immediately frozen in liquid nitrogen and stored at80°C for later analysis of citrate synthase, cytochrome c
xidase, and �-hydroxyacyl-coenzyme A dehydrogenase�-HAD) activities.
ample analyses
Plasma glucose concentration was determined enzymat-cally (YSI 1500, Yellowspring Instruments, Yellowspring,H, USA). Plasma insulin concentration was determined byradioimmunoassay method (Diagnostic Products Corpo-
ation, Los Angeles, CA, USA). Plasma AA concentrationsere analyzed by high-performance liquid chromatography
Waters Alliance HPLC System 2690, Milford, MA, USA).nzymatic methods were used to determine plasma free
atty acids (FFAs; NEFA-C, Wako Chemicals GmbH, Ne-ss, Germany) and glycerol (Sigma-Aldrich, St. Louis, MO,SA) concentrations. The lipid panel was comprised ofGs, total cholesterol, and HDL cholesterol concentrations.hese were measured on a Vitros 950 system (Ortho-linical Diagnostics, Raritan, NJ, USA). The HDL choles-
erol was measured by precipitation of low-density lipopro-ein (LDL) and very LDL (VLDL), and the cholesterol leftn the supernatant (HDL) was then determined. The LDLholesterol (milligrams per deciliter) was calculated usingriedewald’s equation (LDL cholesterol � total cholesterol �DL cholesterol � [TG]/5) [30]. Thus, the quotient TG/5 issed as an estimate of VLDL cholesterol concentration. Theholesterol concentrations (milligrams per deciliter) werehen multiplied by 0.02586 for conversion to the Interna-ional System of Units (millimoles per liter). Similarly, TGoncentrations were multiplied by 0.01129 for conversion.
Mitochondrial enzyme activities of citrate synthase, cyto-
hrome c oxidase, and �-HAD were measured from homoge- fates of musculus vastus lateralis biopsies in a sucrose/thylene-diaminetetra-acetic acid/Tris buffer, as previouslyescribed [31].
alculations
Whole-body insulin sensitivity after a 75-g glucose loadas estimated by the composite model for insulin sensitivityesigned by Matsuda and DeFronzo [32] as the Insulinensitivity Index (ISI) � 10 000/([fasting glucose � fasting
nsulin] � [mean glucose � mean insulin during OGTT])½.he value derived from this equation is an M value oflucose uptake in milligrams per square meter per minute,hich is approximated to the results that would likelyave been obtained if a more invasive hyperinsulinemic-uglycemic clamp test had been performed. The range ofalues is 0–14, with insulin sensitivity being better with aigher ISI. The area under the curve for plasma glucose andnsulin concentrations was also determined, with the aver-ge pre-OGTT concentration used as the zero point.
tatistical methods
Overall significance of differences in response of dietntake, ISI, tissue lipids, and fasting plasma lipids, insulin,nd glucose concentrations with time was tested by one-wayepeated measures analysis of variance followed by Dun-ett’s test with week 0 as a control (SigmaStat 2.03, SPSSnc., Chicago, IL, USA). The correlation between plasmaG concentrations at week 0 and changes in plasma TGoncentration during the supplementation period was mea-ured by Spearman’s rank correlation coefficient, whereashe corresponding correlation for liver lipid content wasetermined by linear regression analysis. Significance ofhanges in the time course of glycerol, insulin, and glucoseoncentrations during the OGTT was tested by two-wayepeated measures analysis of variance, with week 0 andre-OGTT values as controls. Changes in AA concentrationr muscle oxidative enzymes from week 0 to 16 were testedy paired t tests. Comparisons of plasma lipid concentra-ions and ISI at screening (week �7) and week 0 were alsoone by paired t tests. Results were considered statisticallyignificant if P � 0.05. The results are presented as mean �E unless otherwise noted.
esults
The AA supplementation was well tolerated by theubjects, and there were no overall changes in physicalctivity or diet during the study period. The dietary intakeas 1733 � 226 kcal/d when no supplement was takenersus an average of 1735 � 176 kcal/d during the supple-entation period (n � 9). Corresponding values for protein
ntake were 1.03 � 0.19 versus 0.99 � 0.21 g · kg�1 · d�1,
at intake was 0.86 � 0.15 versus 0.86 � 0.09 g · kg�1 · d�1,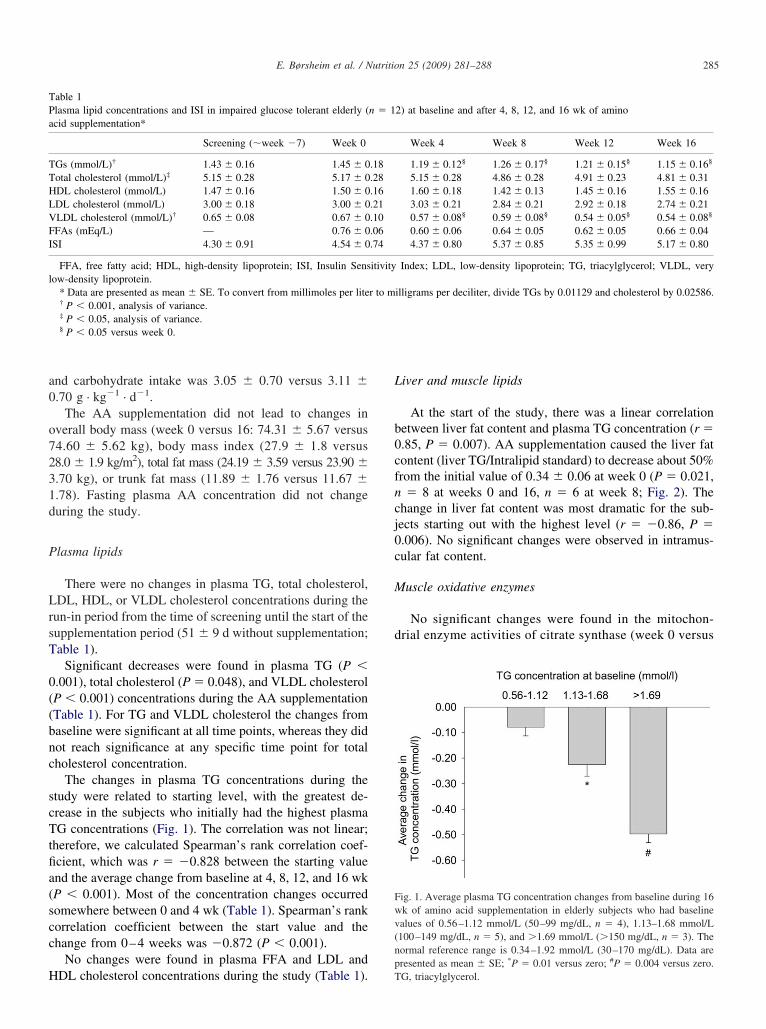
a0
o7231d
P
LrsT
0((bnc
scTtfia(scc
H
L
b0cfncj0c
M
d
TPa
TTHLVFI
l
Fwv(np
285E. Børsheim et al. / Nutrition 25 (2009) 281–288
nd carbohydrate intake was 3.05 � 0.70 versus 3.11 �.70 g · kg�1 · d�1.
The AA supplementation did not lead to changes inverall body mass (week 0 versus 16: 74.31 � 5.67 versus4.60 � 5.62 kg), body mass index (27.9 � 1.8 versus8.0 � 1.9 kg/m2), total fat mass (24.19 � 3.59 versus 23.90 �.70 kg), or trunk fat mass (11.89 � 1.76 versus 11.67 �.78). Fasting plasma AA concentration did not changeuring the study.
lasma lipids
There were no changes in plasma TG, total cholesterol,DL, HDL, or VLDL cholesterol concentrations during the
un-in period from the time of screening until the start of theupplementation period (51 � 9 d without supplementation;able 1).
Significant decreases were found in plasma TG (P �.001), total cholesterol (P � 0.048), and VLDL cholesterolP � 0.001) concentrations during the AA supplementationTable 1). For TG and VLDL cholesterol the changes fromaseline were significant at all time points, whereas they didot reach significance at any specific time point for totalholesterol concentration.
The changes in plasma TG concentrations during thetudy were related to starting level, with the greatest de-rease in the subjects who initially had the highest plasmaG concentrations (Fig. 1). The correlation was not linear;
herefore, we calculated Spearman’s rank correlation coef-cient, which was r � �0.828 between the starting valuend the average change from baseline at 4, 8, 12, and 16 wkP � 0.001). Most of the concentration changes occurredomewhere between 0 and 4 wk (Table 1). Spearman’s rankorrelation coefficient between the start value and thehange from 0–4 weeks was �0.872 (P � 0.001).
No changes were found in plasma FFA and LDL and
able 1lasma lipid concentrations and ISI in impaired glucose tolerant elderly (cid supplementation*
Screening (�week �7) Week 0
Gs (mmol/L)† 1.43 � 0.16 1.45 � 0otal cholesterol (mmol/L)‡ 5.15 � 0.28 5.17 � 0DL cholesterol (mmol/L) 1.47 � 0.16 1.50 � 0DL cholesterol (mmol/L) 3.00 � 0.18 3.00 � 0LDL cholesterol (mmol/L)† 0.65 � 0.08 0.67 � 0FAs (mEq/L) — 0.76 � 0SI 4.30 � 0.91 4.54 � 0
FFA, free fatty acid; HDL, high-density lipoprotein; ISI, Insulin Sensow-density lipoprotein.
* Data are presented as mean � SE. To convert from millimoles per lite† P � 0.001, analysis of variance.‡ P � 0.05, analysis of variance.§ P � 0.05 versus week 0.
DL cholesterol concentrations during the study (Table 1). T
iver and muscle lipids
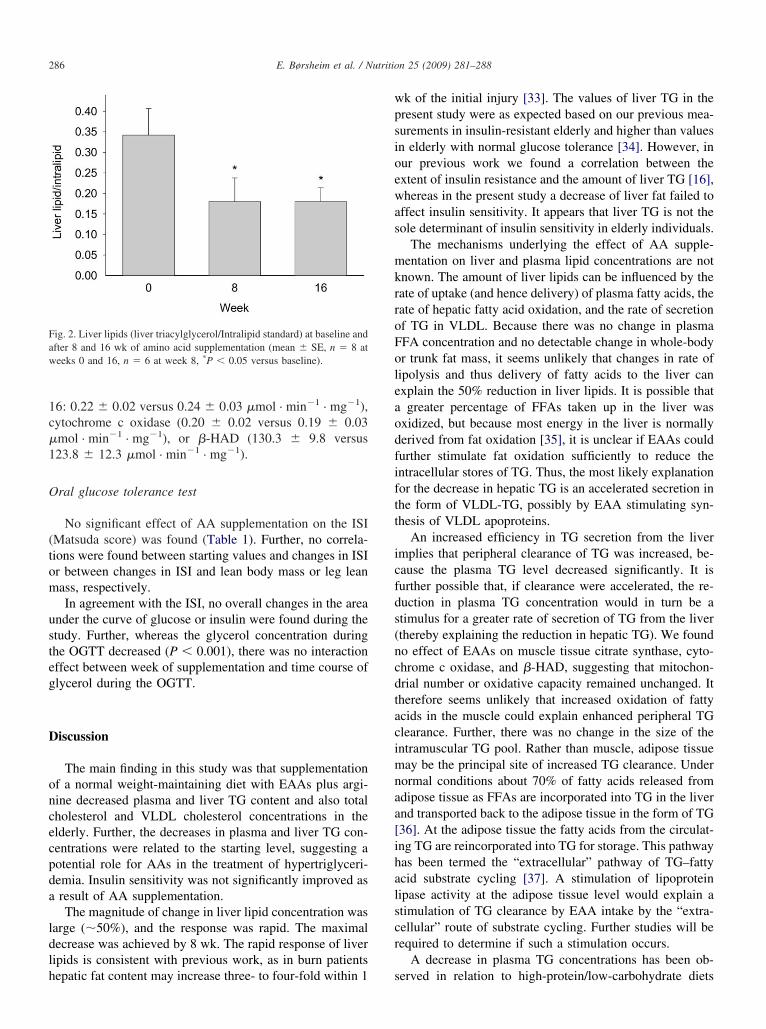
At the start of the study, there was a linear correlationetween liver fat content and plasma TG concentration (r �.85, P � 0.007). AA supplementation caused the liver fatontent (liver TG/Intralipid standard) to decrease about 50%rom the initial value of 0.34 � 0.06 at week 0 (P � 0.021,� 8 at weeks 0 and 16, n � 6 at week 8; Fig. 2). The
hange in liver fat content was most dramatic for the sub-ects starting out with the highest level (r � �0.86, P �.006). No significant changes were observed in intramus-ular fat content.
uscle oxidative enzymes
No significant changes were found in the mitochon-rial enzyme activities of citrate synthase (week 0 versus
2) at baseline and after 4, 8, 12, and 16 wk of amino
Week 4 Week 8 Week 12 Week 16
1.19 � 0.12§ 1.26 � 0.17§ 1.21 � 0.15§ 1.15 � 0.16§
5.15 � 0.28 4.86 � 0.28 4.91 � 0.23 4.81 � 0.311.60 � 0.18 1.42 � 0.13 1.45 � 0.16 1.55 � 0.163.03 � 0.21 2.84 � 0.21 2.92 � 0.18 2.74 � 0.210.57 � 0.08§ 0.59 � 0.08§ 0.54 � 0.05§ 0.54 � 0.08§
0.60 � 0.06 0.64 � 0.05 0.62 � 0.05 0.66 � 0.044.37 � 0.80 5.37 � 0.85 5.35 � 0.99 5.17 � 0.80
Index; LDL, low-density lipoprotein; TG, triacylglycerol; VLDL, very
illigrams per deciliter, divide TGs by 0.01129 and cholesterol by 0.02586.
ig. 1. Average plasma TG concentration changes from baseline during 16k of amino acid supplementation in elderly subjects who had baselinealues of 0.56–1.12 mmol/L (50–99 mg/dL, n � 4), 1.13–1.68 mmol/L100–149 mg/dL, n � 5), and �1.69 mmol/L (�150 mg/dL, n � 3). Theormal reference range is 0.34–1.92 mmol/L (30–170 mg/dL). Data areresented as mean � SE; *P � 0.01 versus zero; #P � 0.004 versus zero.
n � 1
.18
.28
.16
.21
.10
.06
.74
itivity
r to m
G, triacylglycerol.
1c�1
O
(tom
usteg
D
oncecpda
ldlh
wpsioewas
mkrroFoleaodfiftt
icfds(ncdtacimnaa[ihalscr
Faw
286 E. Børsheim et al. / Nutrition 25 (2009) 281–288
6: 0.22 � 0.02 versus 0.24 � 0.03 �mol · min�1 · mg�1),ytochrome c oxidase (0.20 � 0.02 versus 0.19 � 0.03mol · min�1 · mg�1), or �-HAD (130.3 � 9.8 versus23.8 � 12.3 �mol · min�1 · mg�1).
ral glucose tolerance test
No significant effect of AA supplementation on the ISIMatsuda score) was found (Table 1). Further, no correla-ions were found between starting values and changes in ISIr between changes in ISI and lean body mass or leg leanass, respectively.In agreement with the ISI, no overall changes in the area
nder the curve of glucose or insulin were found during thetudy. Further, whereas the glycerol concentration duringhe OGTT decreased (P � 0.001), there was no interactionffect between week of supplementation and time course oflycerol during the OGTT.
iscussion
The main finding in this study was that supplementationf a normal weight-maintaining diet with EAAs plus argi-ine decreased plasma and liver TG content and also totalholesterol and VLDL cholesterol concentrations in thelderly. Further, the decreases in plasma and liver TG con-entrations were related to the starting level, suggesting aotential role for AAs in the treatment of hypertriglyceri-emia. Insulin sensitivity was not significantly improved asresult of AA supplementation.The magnitude of change in liver lipid concentration was
arge (�50%), and the response was rapid. The maximalecrease was achieved by 8 wk. The rapid response of liveripids is consistent with previous work, as in burn patients
ig. 2. Liver lipids (liver triacylglycerol/Intralipid standard) at baseline andfter 8 and 16 wk of amino acid supplementation (mean � SE, n � 8 ateeks 0 and 16, n � 6 at week 8, *P � 0.05 versus baseline).
epatic fat content may increase three- to four-fold within 1 s
k of the initial injury [33]. The values of liver TG in theresent study were as expected based on our previous mea-urements in insulin-resistant elderly and higher than valuesn elderly with normal glucose tolerance [34]. However, inur previous work we found a correlation between thextent of insulin resistance and the amount of liver TG [16],hereas in the present study a decrease of liver fat failed to
ffect insulin sensitivity. It appears that liver TG is not theole determinant of insulin sensitivity in elderly individuals.
The mechanisms underlying the effect of AA supple-entation on liver and plasma lipid concentrations are not
nown. The amount of liver lipids can be influenced by theate of uptake (and hence delivery) of plasma fatty acids, theate of hepatic fatty acid oxidation, and the rate of secretionf TG in VLDL. Because there was no change in plasmaFA concentration and no detectable change in whole-bodyr trunk fat mass, it seems unlikely that changes in rate ofipolysis and thus delivery of fatty acids to the liver canxplain the 50% reduction in liver lipids. It is possible thatgreater percentage of FFAs taken up in the liver was
xidized, but because most energy in the liver is normallyerived from fat oxidation [35], it is unclear if EAAs couldurther stimulate fat oxidation sufficiently to reduce thentracellular stores of TG. Thus, the most likely explanationor the decrease in hepatic TG is an accelerated secretion inhe form of VLDL-TG, possibly by EAA stimulating syn-hesis of VLDL apoproteins.
An increased efficiency in TG secretion from the livermplies that peripheral clearance of TG was increased, be-ause the plasma TG level decreased significantly. It isurther possible that, if clearance were accelerated, the re-uction in plasma TG concentration would in turn be atimulus for a greater rate of secretion of TG from the liverthereby explaining the reduction in hepatic TG). We foundo effect of EAAs on muscle tissue citrate synthase, cyto-hrome c oxidase, and �-HAD, suggesting that mitochon-rial number or oxidative capacity remained unchanged. Itherefore seems unlikely that increased oxidation of fattycids in the muscle could explain enhanced peripheral TGlearance. Further, there was no change in the size of thentramuscular TG pool. Rather than muscle, adipose tissueay be the principal site of increased TG clearance. Under
ormal conditions about 70% of fatty acids released fromdipose tissue as FFAs are incorporated into TG in the livernd transported back to the adipose tissue in the form of TG36]. At the adipose tissue the fatty acids from the circulat-ng TG are reincorporated into TG for storage. This pathwayas been termed the “extracellular” pathway of TG–fattycid substrate cycling [37]. A stimulation of lipoproteinipase activity at the adipose tissue level would explain atimulation of TG clearance by EAA intake by the “extra-ellular” route of substrate cycling. Further studies will beequired to determine if such a stimulation occurs.
A decrease in plasma TG concentrations has been ob-
erved in relation to high-protein/low-carbohydrate diets
[taiildtilwtatrowud
bathma
ltlmaiTi
laoFminsreo
ieTelis
C
wcesosfdap
A
sRCdaTRsRE
R
[
287E. Børsheim et al. / Nutrition 25 (2009) 281–288
5], but the independent effects of a low carbohydrate in-ake, increased protein intake, and changes in body weightre unclear. In a crossover feeding study, it was found that,n the setting of a healthy diet low in saturated fat, a diet richn protein (approximately half from plant sources) significantlyowered plasma TG levels compared with a carbohydrate-richiet [13]. Because the effect was also significantly greaterhan what was seen after a diet rich in unsaturated fat, thenvestigators suggested that protein may have a direct TG-owering effect beyond that of replacing carbohydrates,hich is known to increase TG levels. To our knowledge
here are no previous studies of the effect of AAs on plasmand tissue lipids, except that AA solutions have been giveno patients on dialysis. Thus, patients on peritoneal dialysiseceiving 1.1% solution of AAs instead of all glucose dem-nstrated a 13% decrease in plasma TG concentrationithin 1 mo of the solution change [38]. In a longer studysing AA dialysate for 3 y, patients showed a significantecrease in plasma TG concentration [39].
The present study shows that the TG-lowering effect cane achieved by supplementing the normal diet with a smallmount (expressed as grams or kilocalories) of AAs. Fur-her, an intriguing finding is that the effect was greater atigher TG levels. The use of AA supplementation as treat-ent for patients with hypertriglyceridemia or hepatic ste-
tosis merits further studies.Insulin action declines with age [40]. This has been
inked to increased fat accumulation in muscle and liverissue [15,16]. However, the decrease of liver and plasmaipids in the present study did not translate to an improve-ent in insulin sensitivity. This implies that muscle fat
ccumulation (or muscle lipid metabolism) may be moremportant for insulin resistance than liver fat accumulation.his may be expected because muscle is the primary site of
nsulin-stimulated glucose disposal.We assumed that no improvement in plasma or tissue
ipids would occur over 16 wk without intervention. Thisssumption is supported by the stability of the lipid valuesver the 7-wk run-in period preceding the study (Table 1).urther, the subjects had no conscious control over theeasured endpoints, except that modifying activity or food
ntake could have potentially influenced the results. We didot find any changes in activity or food intake during theupplementation period, and the measurements of lipid pa-ameters were made under the same standardized conditionsach time. Consequently, we feel confident that the changesbserved in this study were due to the ingestion of the AAs.
The potential detrimental effects of high levels of proteinntake have been dealt with extensively in the dietary ref-rence intakes report of the Food and Nutrition Board [41].he report concluded that there is no documented adverseffects of high-protein intake and consequently set no upperimit on safe protein intake. There are no such data regard-ng ingestion of AA formulations, but one would expect a
imilar lack of detrimental effects.onclusion
Supplementation of a normal weight-maintaining dietith EAAs plus arginine decreases liver and plasma TG
oncentrations in impaired glucose tolerant elderly. Theffect is related to the starting level of plasma TG; thus, AAupplementation may have a potential role in the treatmentf hypertriglyceridemia or hepatic steatosis. Because insulinensitivity was not improved despite the reduction in liverat content, the storage of fat in the liver is not the primaryeterminant of insulin sensitivity. Plasma total cholesterolnd VLDL cholesterol are also decreased by the AA sup-lementation.
cknowledgments
The authors thank the subjects who participated in thetudy for their time and dedication. They thank Sue Minello,.N., Roxana Hirst, M.S., and Nancy Poore at the Pepperenter for help in recruiting the volunteers, and the nurses,ietitians, and staff at the General Clinical Research Centert the University of Texas Medical Branch at Galveston.hey thank Kendrick Armstrong, Melissa Bailey, Donovanandolph, Stephaine J. Blase, Tara Cocke, Daniel L. Cre-
on, Christopher P. Danesi, Scott Schutzler, and Pauletteousset for skillful technical assistance. They acknowledgelizabeth Protas, Ph.D., for support of Sandrine Tissier.
eferences
[1] Assmann G, Schulte H, Funke H, von Eckardstein A. The emergenceof triglycerides as a significant independent risk factor in coronaryartery disease. Eur Heart J 1998;19(suppl M):M8–14.
[2] Austin MA, Hokanson JE, Edwards KL. Hypertriglyceridemia as acardiovascular risk factor. Am J Cardiol 1998;81(suppl 4A):7B–12B.
[3] Ebenbichler CF, Kirchmair R, Egger C, Patsch JR. Postprandial stateand atherosclerosis. Curr Opin Lipidol 1995;6:286–90.
[4] Grundy SM, Cleeman JI, Merz CN, Brewer HB Jr, Clark LT, Hun-ninghake DB, et al. Implications of recent clinical trials for theNational Cholesterol Education Program Adult Treatment Panel IIIguidelines. Circulation 2004;110:227–39.
[5] Volek JS, Sharman MJ, Forsythe CE. Modification of lipoproteins byvery low-carbohydrate diets. J Nutr 2005;135:1339–42.
[6] Volek JS, Feinman RD. Carbohydrate restriction improves the fea-tures of metabolic syndrome. Metabolic syndrome may be defined bythe response to carbohydrate restriction. Nutr Metab (Lond) 2005;2:31.
[7] Lichtenstein AH. Thematic review series: patient-oriented research.Dietary fat, carbohydrate, and protein: effects on plasma lipoproteinpatterns. J Lipid Res 2006;47:1661–7.
[8] Wolfe BM, Giovannetti PM. Short-term effects of substituting proteinfor carbohydrate in the diets of moderately hypercholesterolemichuman subjects. Metabolism 1991;40:338–43.
[9] Wolfe BM, Giovannetti PM. High protein diet complements resintherapy of familial hypercholesterolemia. Clin Invest Med 1992;15:349–59.
10] Wolfe BM. Potential role of raising dietary protein intake for reduc-
ing risk of atherosclerosis. Can J Cardiol 1995;11(suppl G):127G–31.
[
[
[
[
[
[
[
[
[
[
[
[
[
[
[
[
[
[
[
[
[
[
[
[
[
[
[
[
[
[
[
288 E. Børsheim et al. / Nutrition 25 (2009) 281–288
11] Wolfe BM, Piche LA. Replacement of carbohydrate by protein in aconventional-fat diet reduces cholesterol and triglyceride concentra-tions in healthy normolipidemic subjects. Clin Invest Med 1999;22:140–8.
12] Brinkworth GD, Noakes M, Keogh JB, Luscombe ND, Wittert GA,Clifton PM. Long-term effects of a high-protein, low-carbohydratediet on weight control and cardiovascular risk markers in obesehyperinsulinemic subjects. Int J Obes Relat Metab Disord 2004;28:661–70.
13] Appel LJ, Sacks FM, Carey VJ, Obarzanek E, Swain JF, Miller ERIII, et al. Effects of protein, monounsaturated fat, and carbohydrateintake on blood pressure and serum lipids: results of the OmniHeartrandomized trial. JAMA 2005;294:2455–64.
14] Anderson JW, Johnstone BM, Cook-Newell ME. Meta-analysis of theeffects of soy protein intake on serum lipids. N Engl J Med 1995;333:276–82.
15] Petersen KF, Befroy D, Dufour S, Dziura J, Ariyan C, Rothman DL,et al. Mitochondrial dysfunction in the elderly: possible role in insulinresistance. Science 2003;300(5622):1140–2.
16] Cree MG, Newcomer BR, Katsanos CS, Sheffield-Moore M, ChinkesD, Aarsland A, et al. Intramuscular and liver triglycerides are in-creased in the elderly. J Clin Endocrinol Metab 2004;89:3864–71.
17] Layman DK, Boileau RA, Erickson DJ, Painter JE, Shiue H, SatherC, et al. A reduced ratio of dietary carbohydrate to protein improvesbody composition and blood lipid profiles during weight loss in adultwomen. J Nutr 2003;133:411–7.
18] Wolfe RR. Regulation of muscle protein by amino acids. J Nutr2002;132(suppl):3219S–24.
19] Tipton KD, Gurkin BE, Matin S, Wolfe RR. Nonessential aminoacids are not necessary to stimulate net muscle protein synthesis inhealthy volunteers. J Nutr Biochem 1999;10:89–95.
20] Børsheim E, Tipton KD, Wolf SE, Wolfe RR. Essential amino acidsand muscle protein recovery from resistance exercise. Am J PhysiolEndocrinol Metab 2002;283:E648–57.
21] Paddon-Jones D, Børsheim E, Wolfe RR. Potential ergogenic effectsof arginine and creatine supplementation. J Nutr 2004;134(suppl):2888S–94.
22] Ban H, Shigemitsu K, Yamatsuji T, Haisa M, Nakajo T, Takaoka M,et al. Arginine and leucine regulate p70 S6 kinase and 4E-BP1 inintestinal epithelial cells. Int J Mol Med 2004;13:537–43.
23] Perseghin G, Scifo P, De Cobelli F, Pagliato E, Battezzati A, Arcel-loni C, et al. Intramyocellular triglyceride content is a determinant ofin vivo insulin resistance in humans: a 1H-13C nuclear magneticresonance spectroscopy assessment in offspring of type 2 diabeticparents. Diabetes 1999;48:1600–6.
24] van den Boogaart A, Van Hecke P, Van Huffel S, Graveron-DemillyD, van Ormondt D, de Beer R. MRUI: a graphical user interface foraccurate routine MRS data analysis. MAGMA 1996;(suppl 2):318.
25] van den Boogaart A. MRUI manual V. 96.3. A user’s guide to themagnetic resonance user interface software package. Delft, The Neth-erlands: Technical University Press; 1997.
26] Klose U. In vivo proton spectroscopy in presence of eddy currents.
Magn Reson Med 1990;14:26–30.27] Vanhamme L, van den BA, Van Huffel S. Improved method foraccurate and efficient quantification of MRS data with use of priorknowledge. J Magn Reson 1997;129:35–43.
28] Rico-Sanz J, Thomas EL, Jenkinson G, Mierisova S, Iles R, Bell JD.Diversity in levels of intracellular total creatine and triglycerides inhuman skeletal muscles observed by (1)H-MRS. J Appl Physiol1999;87:2068–72.
29] Tarasow E, Siergiejczyk L, Panasiuk A, Kubas B, Dzienis W, Proko-powicz D, et al. MR proton spectroscopy in liver examinations ofhealthy individuals in vivo. Med Sci Monit 2002;8:MT36–40.
30] Friedewald WT, Levy RI, Fredrickson DS. Estimation of the concen-tration of low-density lipoprotein cholesterol in plasma, without useof the preparative ultracentrifuge. Clin Chem 1972;18:499–502.
31] Morio B, Hocquette JF, Montaurier C, Boirie Y, Bouteloup-DemangeC, McCormack C, et al. Muscle fatty acid oxidative capacity is adeterminant of whole body fat oxidation in elderly people. Am JPhysiol Endocrinol Metab 2001;280:E143–9.
32] Matsuda M, DeFronzo RA. Insulin sensitivity indices obtained fromoral glucose tolerance testing: comparison with the euglycemic insu-lin clamp. Diabetes Care 1999;22:1462–70.
33] Cree MG, Zwetsloot JJ, Fram RY, Herndon DN, Newcomer BR,Angel C, et al. Insulin sensitivity is related to fat oxidation andprotein kinase C in children with acute burn injury. J Burn Care Res2008;29:585–94.
34] Cree MG, Newcomer BR, Read LK, Sheffield-Moore M, Paddon-Jones D, Chinkes D, et al. Plasma triglycerides are not related totissue lipids and insulin sensitivity in elderly following PPAR-alphaagonist treatment. Mech Ageing Dev 2007;128:558–65.
35] Sidossis LS, Mittendorfer B, Walser E, Chinkes D, Wolfe RR.Hyperglycemia-induced inhibition of splanchnic fatty acid oxidationincreases hepatic triacylglycerol secretion. Am J Physiol EndocrinolMetab 1998;275(5 pt 1):E798–805.
36] Wolfe RR, Klein S, Carraro F, Weber JM. Role of triglyceride–fattyacid cycle in controlling fat metabolism in humans during and afterexercise. Am J Physiol Endocrinol Metab 1990;258(2 pt 1):E382–9.
37] Wolfe RR, Peters EJ. Lipolytic response to glucose infusion in humansubjects. Am J Physiol Endocrinol Metab 1987;252(2 pt 1):E218–23.
38] Brulez HF, van Guldener C, Donker AJ, ter Wee PM. The impact ofan amino acid–based peritoneal dialysis fluid on plasma total homo-cysteine levels, lipid profile and body fat mass. Nephrol Dial Trans-plant 1999;14:154–9.
39] Li FK, Chan LY, Woo JC, Ho SK, Lo WK, Lai KN, et al. A 3-year,prospective, randomized, controlled study on amino acid dialysate inpatients on CAPD. Am J Kidney Dis 2003;42:173–83.
40] Ferrannini E, Vichi S, Beck-Nielsen H, Laakso M, Paolisso G, SmithU. Insulin action and age. European Group for the Study of InsulinResistance (EGIR). Diabetes 1996;45:947–53.
41] Otten JJ, Pitzi Hellwig J, Meyers LD, editors. The dietary referenceintakes: the essential guide to nutrient requirements. Food and Nu-trition Board; Institute of Medicine of the National Academies. Wash-
ington, DC: National Academies Press; 2006.
![€¦ · Web view2009. 4. 23. · [Cr2O72-] Reverse Rate. A. increases increases. B. increases decreases. C. decreases decreases. D. decreases increases. 31. A small amount of H2SO4](https://img.dokumen.tips/doc/110x75/608f2c47b9e3f5096f2e5efc/web-view-2009-4-23-cr2o72-reverse-rate-a-increases-increases-b-increases.jpg)