Embed Size (px)
Citation preview
American Journal of
Volume 146
Number 10
EPIDEMIOLOGY Copyright 0 1997 by The Johns Hopkins University School of Hygiene and Public Health
November 15. 1997 Sponsored by the Society for Epidemiologic Research
REVIEWS AND COMMENTARY
Study Designs for Evaluating Different Efficacy and Effectiveness Aspects of Vaccines
M. Elizabeth Halloran,' Claudio J. Struchiner,' and Ira M. Longini, Jr.'
Vaccine efficacy and effectiveness (VE) are generally measured as 1 minus some measure of relative risk (FIR) in the vaccinated group compared with the unvaccinated group (VE = 1 - RR). In designing a study to evaluate vaccination, the type of effect and the question of interest determine the appropriate choice of comparison population and parameter. Possible questions of interest include that of the biologic effect of vaccination on susceptibility, on infectiousness, or on progression to disease in individuals. The indirect effects, total effects, and overall public health benefits of widespread vaccination of individuals within the context of a vaccination program might also be of primary concern. The change in behavior induced by belief in the protective effects of vaccination might influence the estimates of these effects or might itself be of interest. In this paper, the authors present a framework of study designs that relates the scientific question of interest to the choice of comparison groups, the unit of observation, the level of information available for analysis, and the parameter of effect. Am J Epidemiol 1997;146:789-803.
clinical trials: communicable diseases; community trials; vaccine efficacy; vaccines
Vaccine efficacy and effectiveness (VE) are gener- ally measured as 1 minus some measure o f relative risk (RR) in the vaccinated group compared with the unvaccinated group:
Vaccination can produce several different kinds o f effects, both at the individual level and at the popula- tion level, and the groups in the comparisons could be composed o f individuals, populations, or communi- ties. Vaccination can induce a biologically protective
Received for publication November 12. 1996, and in final form June77 lQQ7 - - . , . - -. ,
Abbreviations: CI, cumulative incidence: IR, incidence rate; PH, Proportional hazards; RR, relative risk; SAR, secondary attack rate; VE, vaccine efficacv/etfectiveness.
' Department oiBiostatistics, Roliins School of Public Health, Emow Universik Atlanta O A ~
2 ' , , . . . . .-, . .
Escola ~adional de Salide P~jblica, Fundapeo Oswaldo Cruz, Ria de Janeiro, RJ 21041, Brazil.
Reprint requests to Dr. M. Elizabeth Halloran, Rollins School of Public Health. Emory Unive~ity, 1518 Clifton Road NE, Atlanta. GA 30322.
response in a vaccinated individual or reduce the de- gree or duration o f infectiousness. Widespread vacci- nation in a population can reduce transmission and produce indirect effects, even in individuals who were not vaccinated. Vaccinated people might change their rate o f making contacts wi th potentially infectious sources, and thereby counterbalance the biologic pro- tective effects or alter the overall public health benefits of vaccination. I n designing a study for evaluating the effects o f vaccination, the question o f interest guides the choice o f unit o f observation, comparison groups, parameter o f effect, and level o f information required.
In this paper, we present a systematic overview (table 1) o f study designs for evaluating various effects o f vaccination and vaccination programs based on the choice o f comparison groups, the unit o f observation, the choice o f parameter, and the level o f information required. The expression VE = 1 - RR i s o f the form o f the prevented fraction in the exposed, and thus belongs to the family o f parameters o f attributable, or prevented, risk. We take as our point o f departure the
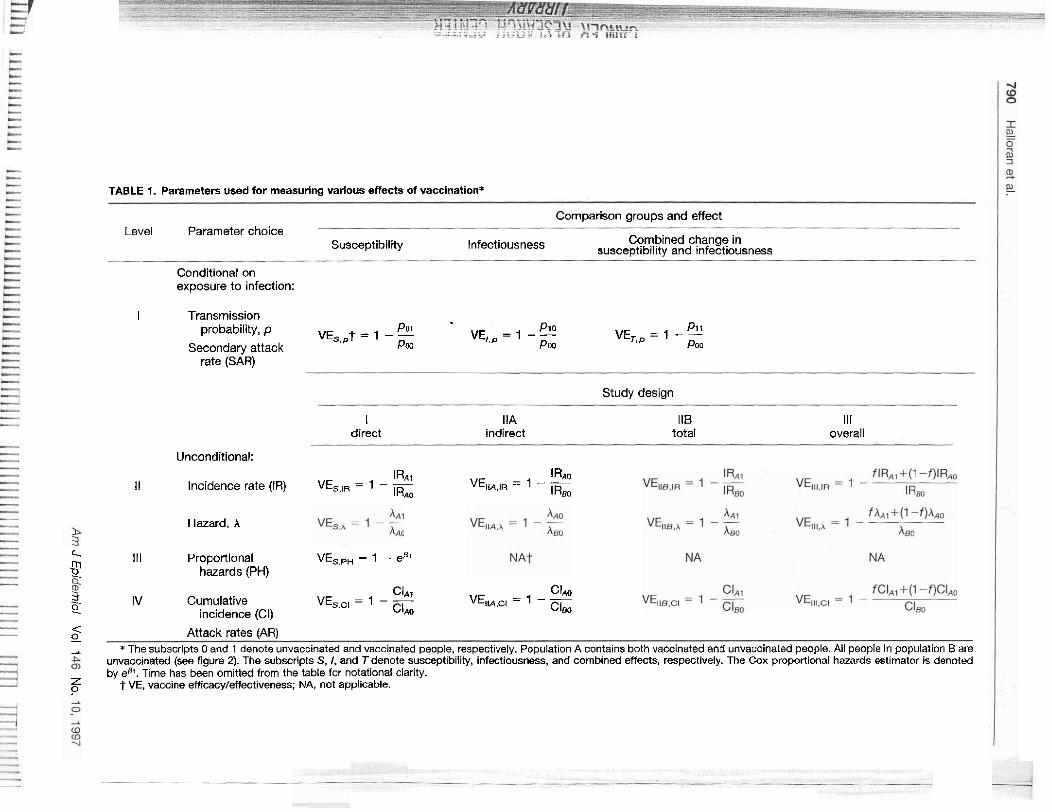
TABLE 1. Parameters used for measuring various effects of vaccination*
Comparison groups and effect Level Parameter choice
Susceptibility Infectiousness Combined change in susce~tlbilitv and ~nfect~ousness
Conditional on exposure to infection:
I Transmission probability, p POI Pi0 P1i VE,,,t = 1 - - VE,,, = 1 - - VE,, = 1 - -
Secondary attack Pw Po0 POO rate (SAR)
Study design
I direct
IIA indirect
118 total
Ill overall
Unconditional:
~RAI IRAQ iI Incidence rate (IR) VE,,,, = 1 - - VE,M,,R = I - -
lR*o I Rm
Hazard. A
x rn 111 ~roponlonal VE,,,, = 1 - eP'
2. hazards (PH)
c l ~ l CIAO -. IV Cumulative VE,,,, = 1 - - VE,M,cl = I - - 0 incidence (CI) CIAO CIm
4 0 Attack rates (AR)
A The subscripts 0 and 1 denote unvaccinated and vaccinated people, respectively. Population A contains bath vaccinated and unvaccinated people. Ail people in population Bare unvaccinated (see figure 2). The subscripts S, I, and Tdenote susceptibility, infectiousness, and combined effects, respectively. The Cox proportional hazards estimator is denoted by eB'. Time has been omitted from the table for notational clarity.
Z ? t VE, vaccine efficacy/effectiveness; NA, not applicable.
review by Greenland and Robins (1.2) of the family of . . . . . . . . . . . . . . . parasite /---,
Study Designs for Different Aspects of Vaccines 791
parameters of attributable or prevented risk, which . . . . . . . . . . . susceptible . . . primarily pertained to noninfectious diseases. The two
main aarameters in this family that Greenland and . . . . ~ o b i n s considered are the prevented hazard fraction, w contact
hased on the incidence or hazard rate ratio. and the . ~~~ ~ ~ . prevented fraction, based on the cumulative incidence ratio with the unit of observation being the individual. These two parameters have their analogies in the fam- ily of vaccine efficacy and effectiveness parameters. However, because of the dependent happenings (3) and the indirect effects of intervention in infections diseases, several more measures are relevant for esti- mating the various prevented risk vaccine efficacy and effectiveness parameters.
In the conceptual framework we present, we expand the family of prevented risk parameters discussed by Greenland and Robiis in two dimensions. In the first dimension, we add the transmission probability or secondaq attack rate, a parameter that conditions on actual exposure to infection, to the incidence or hazard and cumulative incidence (4), parameters that do not condition on exposure to infection. The transmission probability is fundamental to infectious disease epide- miology. We also show that in this direction, the family of vaccine efficacy parameters form a hierarchy ordered by the amount of information required for their estimation. In the second dimension, to estimate the indirect and overall effects of widespread vaccina- tion, we enrich the choice of comparison populations by comparing different populations or communities in the study designs for dependent happenings (5, 6). In these studies, the community or a subpopnlation of the community becomes the main unit of comparison.
We also discuss the behavioral and exposure effica- cies of interventions which often occur through changes in the rates and types of contacts with poten- tially infective sources (7). We emphasize that a study can be designed to evaluate several different types of effects at the same time. We also emphasize the im- portance of distinguishing risk factors for exposure to infection from risk factors for susceptibility. These concepts and study designs are applicable to risk fac- tors and interventions other than vaccination against infectious diseases. We have found this conceptual framework useful to us in ordering our own thoughts and in discussions with other colleagues on evaluating vaccine effects. We present it here in the hope that it will provide a basis for further developments in the rational and complex design of vaccine evaluation.
BIOLOGIC EFFICACY
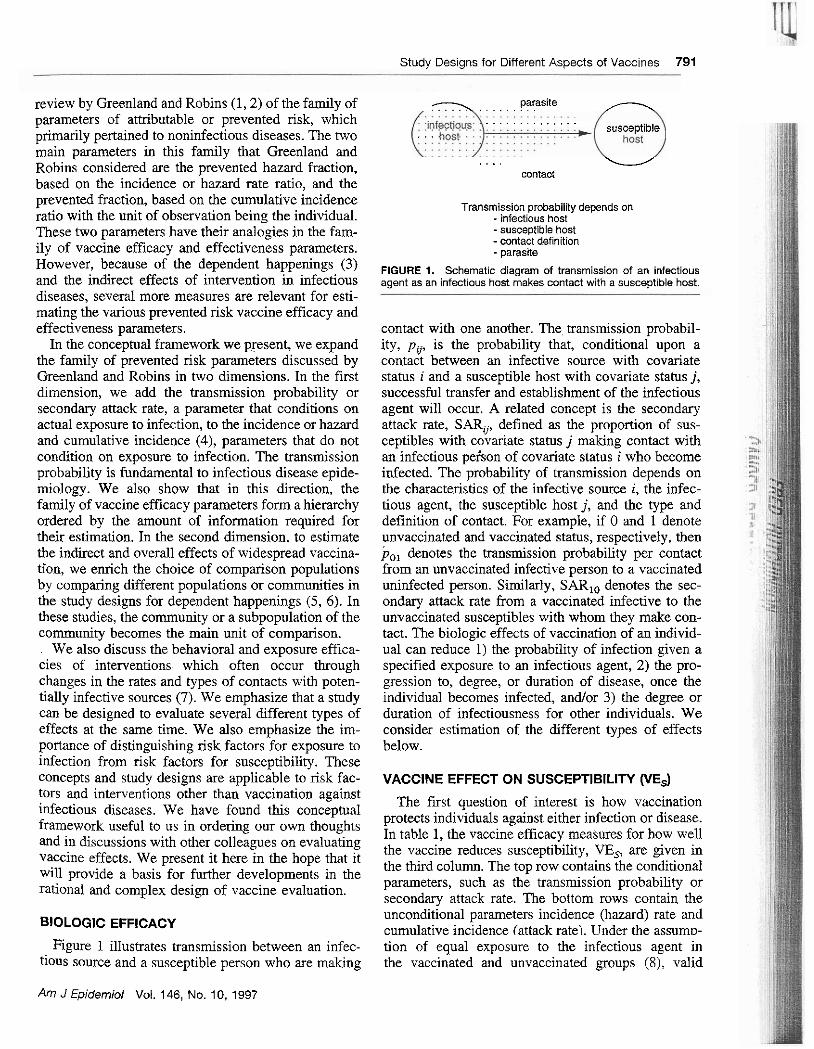
Transmission probability depends on - infectious host -susceptible host -contact definition - parasite
FIGURE I. Schematic diagram of transmission of an infectious agent as an infectious host makes contact with a susceptible host.
contact with one another. The transmission probabil- ity, p , is the probability that, conditional upon a contact between an infective source with covariate status i and a susceptible host with covariate status j, successful transfer and establishment of the infectious agent will occur. A related concept is the secondary attack rate, SARij, defined as the proportion of sus- ceptible~ with covariate status j making contact with an infectious pekon of covariate status i who become infected. The probability of transmission depends on the characteristics of the infective source i, the infec- tious agent, the susceptible host j, and the type and definition of contact. For example, if 0 and 1 denote unvaccinated and vaccinated status, respectively, then p,, denotes the transmission probability per contact from an unvaccinated infective person to a vaccinated uninfected person. Similarly, SARIo denotes the sec- ondary attack rate from a vaccinated infective to the unvaccinated susceptibles with whom they make con- tact. The biologic effects of vaccination of an individ- ual can reduce 1) the probability of infection given a specified exposure to an infectious agent, 2) the pro- gression to, degree, or duration of disease, once the individual becomes infected, and/or 3) the degree or duration of infectiousness for other individuals. We consider estimation of the different types of effects below.
VACCINE EFFECT ON SUSCEPTIBILITY (VE,)
The first question of interest is how vaccination protects individuals against either infection or disease. In table 1, the vaccine efficacy measures for how well the vaccine reduces susceptibility, VE,, are given in the third column. The top row contains the conditional parameters, such as the transmission probability or secondarv attack rate. The bottom rows contain the unconditional parameters incidence (hazard) rate and cumulative incidence (attack rate). Under the assumv-
Figure 1 illustrates transmission between an infec- tion of equal exposure to the infectious agent in tious source and a susceptible person who are making the vaccinated and unvaccinated groups (X), valid
Am J Epidemiol Vol. 146, No. 10, 1997
7 I
792 Halloran et al. T i
estimates of VE, are obtained from VE, = 1 - [R(vaccinated people)lR(unvaccinated people)], where R denotes one of the measures of risk. We show below that the conditional and unconditional parameters form a hierarchy requiring different levels of information about the transmission system. They are also differ- ently affected by potential sources of bias. Interpreta- tion of the estimated VE, as the level of biologic protection conferred by the vaccine is generally com- plicated, as discussed briefly below and elsewhere.
Transmission probability or secondary attack rate
An epidemiologic measure of the biologically pro- tective effect of vaccination is the reduction in the probability of infection or disease conditional on a certain level of exposure to the infectious agent, given a certain type of contact. Thus, in the absence of controlled challenge experiments, the first choice for epidemiologically estimating the biologic protective effect of vaccination is based on the transmission probability ratio, or any similar parameter that condi- tions on actual contact between an infectious source and a susceptible person. The concept of a "contactnis very broad and must be defined in each particular study. In a study of sexually transmitted disease, the contact could be defined per sex act or per partnership. In a study of pertussis, a contact could be defined as attending school on the same day as an infectious person or as living in the same household during the entire period of infectiousness of a case. The mode of transmkion of a parasite determines which types of contacts are potentially infectious. '
The transmission probability is estimated in two main ways. The first method, called the secondary attack rate (9-12) or case-contact rate method, has been used to estimate vaccine efficacy since the per- tussis vaccine trials were carried out in the 1930s (13). The vaccine efficacy measure is based on the SAR,, in the vaccinated susceptibles who were exposed to in- fection compared with the SAR, in unvaccinated sus- ceptible~ who had a similar exposure, where the dot in the subscript can denote any vaccine status for the infective or an average across the population. Second- ary attack rate studies are commonly used for directly transmitted infectious agents with high transmission probabilities, such as measles, chickenpox, mumps, pertussis, and tuberculosis. Another method of esti- mating the transmission probability is based on the binomial model. In this case, we observe susceptible people, count the number of contacts they make with infectives, and count the number of these susceptible people who become infected. The binomial model is commonly used in studies with low transmission prob-
abilities, such as studies of human immunodeficiency virus, in which susceptibles often make more than one contact before becoming infected. The ascertainment of the susceptibles or infectives can occur prospec- tively or retrospectively, depending on the design of the study.
Letp andp., denote the probability of transmission to unvaccinated and vaccinated susceptibles, respec- tively. Analogously, let SAR, and SAR, denote the secondary attack rates for unvaccinated and vaccinated susceptibles, respectively. The dot denotes the infec- tious contacts, which are assumed to be equal for the vaccinated and unvaccinated susceptibles. VE,,p, based on the transmission probability or secondary attack rate, i s estimated from
vaccinated infections = I - (
vaccinated exposures
- unvaccinated infections ' unvaccinated exposures
Estimating vaccine efficacy from the transmission probability ratios requires information on who is in- fectious and when, and on whom they contact and how. Because this method generally requires the most information, Rhodes et al. (14) call the conditional measure a level I parameter (table 1, top row).
Hierarchy of VE, parameters
Gathering information on exposure to infection and on contacts between infective and susceptible people in a vaccine study is often expensive, difficult, or even impossible. Thus, quite often vaccine efficacy studies rely on time-to-infection or time-to-disease data or simply on final value data. The analysis may be strat- ified according to variables believed to correlate with exposure to infection. If time-to-event data are col- lected, VE, can be estimated from the incidence or hazard rate ratio; Rhodes et al. (14) called this level I1 information. For the Cox proportional hazards model (15), a special hazard rate ratio that assumes the same baseline hazard in both the vaccinated and unvacci- nated groups is used. Then only the ordering of the events is needed; this is called level III information. If only final value data, called level IV data, are col- lected, VE, is based on the cumulative incidence or attack rate ratio.
The transmission probability, incidence rate, and cumulative incidence have a fundamental relation to one another because of the dependent happening stmc-
Am J Epidemiol Vol. 146, No. 10, 1997
Study Des~gns for D~fferent Aspects of Vacc~nes 793
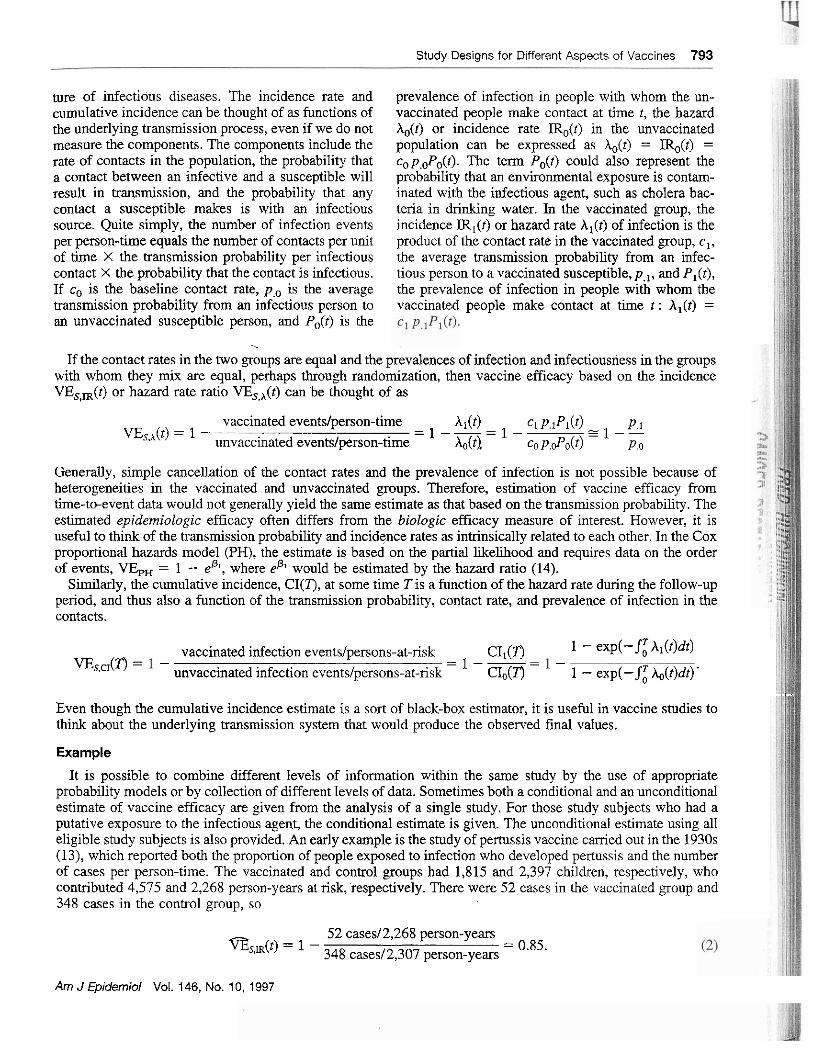
ture of infectious diseases. The incidence rate and cumulative incidence can be thought of as functions of the underlying transmission process, even if we do not measure the components. The components include the rate of contacts in the population, the probability that a contact between an infective and a susceptible will result in transmission, and the probability that any contact a susceptible makes is with an infectious source. Quite simply, the number of infection events per person-time equals the number of contacts per unit of time X the transmission probability per infectious contact X the probability that the contact is infectious. If co is the baseline contact rate, p, is the average transmission probability from an infectious person to an unvaccinated susceptible person, and Po@) is the
..
prevalence of infection in people with whom the un- vaccinated people make contact at time t, the hazard A,@) or incidence rate IRo(t) in the unvaccinated population can be expressed as Ao(t) = IRo(t) = ~ ~ p . ~ P ~ ( t ) . The term Po(t) could also represent the probability that an environmental exposure is contam- inated with the infectious agent, such as cholera bac- teria in drinking water. In the vaccinated group, the incidence IRl( t ) or hazard rate A,(t) of infection is the product of the contact rate in the vaccinated group, c,, the average transmission probability from an infec- tious person to a vaccinated susceptible, p,,, and PI(?), the prevalence of infection in people with whom the vaccinated people make contact at time t : A,(t) =
If the contact rates in the two groups are equal and the prevalences of infection and infectiousness in the groups with whom they mix are equal, perhaps through randomization, then vaccine efficacy based on the incidence VE,,,(t) or hazard rate ratio VE,,,(t) can be thought of as
vaccinated eventslperson-time Ai(t) c1 P . I P ~ ( ~ ) P.1 = 1 -- V%,A(~) = 1 - 2 1 - -
unvaccinated eventslperson-time A,(t). = - co P.$o(~) - Po
Generally, simple cancellation of the contact rates and the prevalence of infection is not possible because of heterogeneities in the vaccinated and unvaccinated groups. Therefore, estimation of vaccine efficacy from time-to-event data would not generally yield the same estimate as that based on the transmission probability. The estimated epidemiologic efficacy often differs from the biologic efficacy measure of interest. However, it is useful to think of the transmission probability and incidence rates as intrinsically related to each other. In the Cox proportional hazards model (PH), the estimate is based on the paaial likelihood and requires data on the order of events, wH = 1 - eP', where eP' would be estimated by the hazard ratio (14).
Similarly, the cumulative incidence, CI(T), at some time Tis a function of the hazard rate during the follow-up period, and thus also a function of the transmission probability, contact rate, and prevalence of infection in the contacts
CIl(13 1 - exp(-$: Al(t)dt) vaccinated infection eventslpersons-at-risk = 1 -- VEs,a(T) = - unvaccinated infection eventslpersons-at-risk c b ( n =
- 1 - exp(-$: Ao(t)dt)'
, .. Even though the cumulative incidence estimate is a soa of black-box estimator, it is useful in vaccine studies to think about the underlying transmission system that would produce the observed final values.
Example
It is possible to combine different levels of information within the same study by the use of appropriate probability models or by collection of different levels of data. Sometimes both a conditional and an unconditional estimate of vaccine efficacy are given from the analysis of a single study. For those study subjects who had a putative exposure to the infectious agent, the conditional estimate is given. The unconditional estimate using all eligible study subjects is also provided. An early example is the study of pertussis vaccine carried out in the 1930s (13), which reported both the proportion of people exposed to infection who developed pertussis and the number of cases per person-time. The vaccinated and control groups had 1,815 and 2,397 children, respectively, who contributed 4,575 and 2,268 person-years at risk, respectively. There were 52 cases in the vaccinated group and 348 cases in the control group, so
52 cases12,268 person-years mssm(t) = - 348 cases/2,307 person-years
= 0.85.
Am J Epidemiol Vol. 146, No. 10, 1997
r 794 Halloran et al.
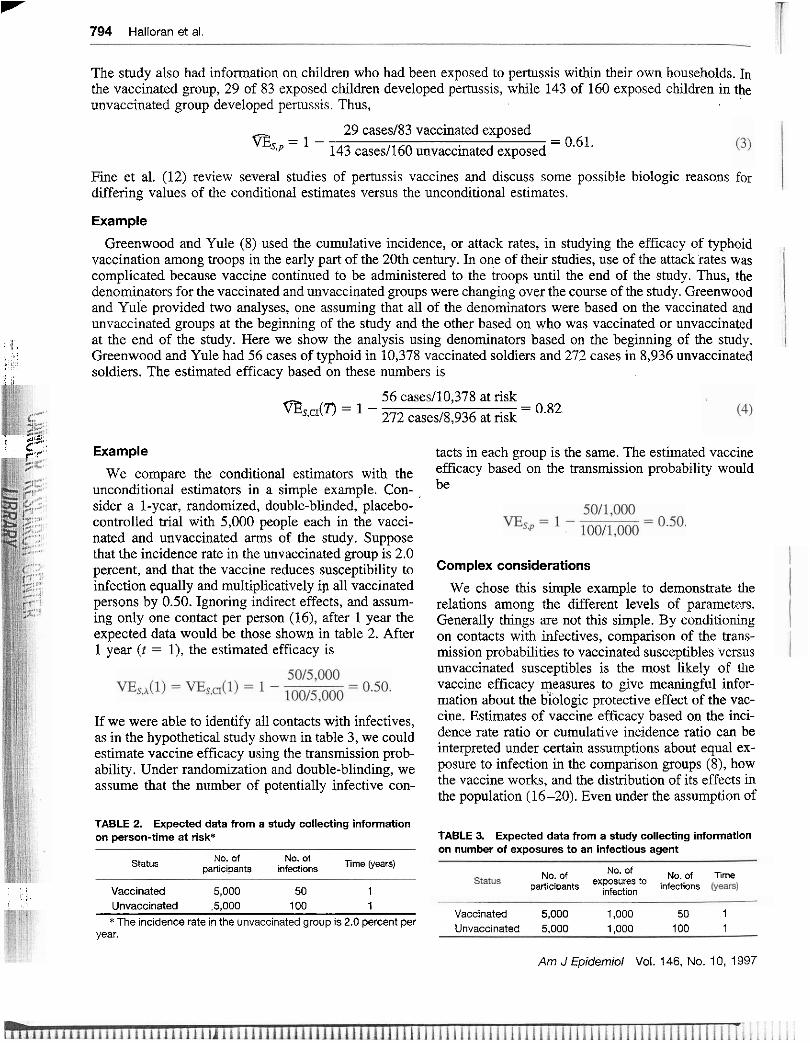
The study also had information on children who had been exposed to pertussis within their own households. In the vaccinated group, 29 of 83 exposed children developed pertussis, while 143 of 160 exposed children in the nnvaccinated group developed pertussis. Thus,
29 cases183 vaccinated exposed ms,p = - 143 cases/l60 unvaccinated exposed
= 0.61.
Fine et al. (12) review several studies of pertussis vaccines and discuss some possible biologic reasons for difering values of the conditional estimates versus the unconditional estimates.
Example
Greenwood and Yule (8) used the cumulative incidence, or attack rates, in studying the efficacy of typhoid vaccination among troops in the early part of the 20th century. In one of their studies, use of the attack rates was complicated because vaccine continued to be administered to the troops until the end of the study. Thus, the denominators for the vaccinated and unvaccinated groups were changing over the course of the study. Greenwood and Yule provided two analyses, one assuming that all of the denominators were based on the vaccinated and nnvaccinated groups at the beginning of the study and the other based on who was vaccinated or unvaccinated
) , at the end of the study. Here we show the analysis using denominators based on the beginning of the study. , , ,
1 1 , , , Greenwood and Yule had 56 cases of typhoid in 10,378 vaccinated soldiers and 272 cases in 8,936 unvaccinated soldiers. The estimated efficacy based on these numbers is I :is
56 cases/10,378 at risk ms~ci(n = - ?J2 cases/8,936 at risk
= 0.82,
1 215,; : 5;:: Example
We compare the conditional estimators with the unconditional estimators in a simple example. Con- , sider a 1-year, randomized, double-blinded, placebo- controlled trial with 5,000 people each in the vacci- nated and unvaccinated arms of the study. Suppose that the incidence rate in the unvaccinated group is 2.0 percent, and that the vaccine reduces susceptibility to infection equally and multiplicatively ip all vaccinated persons by 0.50. Ignoring indirect effects, and assum- ing only one contact per person (16), after 1 y e a the
- expected data would be those shown in table 2. After 1 year (t = I), the estimated efficacy is
If we were able to identify all contacts with infectives, as in the hypothetical study shown in table 3, we could estimate vaccine efficacy using the transmission prob- ability. Under randomization and double-blinding, we assume that the number of potentially infective con-
TABLE 2. Expected data from a study collecting information on person-time at risk*
status NO. of NO. of participants infmions Dears)
! ; . Vaccinated 5,000 50 1 , , Unvaccinated 5,000 100 1
*The incidence rate in the unvaccinated group is 2.0 percent per year.
tacts in each group is the same. The estimated vaccine efficacy based on the transmission probability would be
Complex considerations
We chose this simple example to demonstrate the relations among the dierent levels of parameters. Generally things are not this simple. By conditioning on contacts with inFectives, comparison of the trans- mission probabilities to vaccinated susceptibles versus unvaccinated snsceptibles is the most likely of i?~e vaccine efficacy measures to give meaningful infor- mation about the biologic protective effect of the vac- cine. Estimates of vaccine efficacy based on the inci- dence rate ratio or cumulative incidence ratio can be interpreted under certain assumptions about equal ex- posure to infection in the comparison groups (8), how the vaccine works, and the distribution of its effects in the population (16-20). Even under the assumption of
TABLE 3. Expected data from a study collecting information on number of exposures to an infectious agent
NO. Of NO. of Time
exposures to inktizLs participants infection
Vaccinated 5,000 1.000 50 1 Unvaccinated 5.000 1,000 100 1
Am J Epidemiol Vol. 146. No. 10, 1997
Studv Desians for Different Aspects of Vaccines 795
equal exposure to infection in the vaccinated and un- vaccinated groups, VE,,, and VE,,, can give very biased estimates of the effect of vaccination on the transmission probability (17, 19-21).
Several complicating factors in the evaluation of vaccine efficacy go beyond the four levels of infor- mation and their respective parameters presented here. Some vaccines made of live, attenuated infectious agents can spread from the vaccinees to people who have not been vaccinated, a phenomenon referred to as "contagious treatment" (6). If the vaccine virus spreads to a substantial number of nnvaccinated study subjects, the efficacy of the vaccine could be under- estimated.
Another complicating factor is how to interpret time-varying vaccine efficacy estimates. Vaccine eff- cacy estimates can vary over time because of hetero- gcileity in susceptibility, rates of exposure to infec- iious agents, or the protection conferred by the vaccine (17, 19.20). They could also vary because the efficacy of the vaccine actually wanes over time (22). The efficacy could also increase with time if the level of efficacy depends on boosting by natural infection (6). Common to all of these effects is the fact that they can be captured only if time-to-event data are available. Although heterogeneities can be taken into account with frailty models (19, 20) and waning can be esti- mated with parametric or nonparametric models (22). designing studies to estimate changes in efficacy due, to natural boosting remains a challenge. Another open challenge is that of distinguishing among the possible causes of time-varying estimates. The overall, long- term effects of vaccination in a population depend on these characteristics (23-25), so study designs and methods of analysis for evaluating them are important areas for further development.
Practical choice of estimators
The amount of mformation gathered-that is, from the most (level I) to the least (level IV)-will be determined by many practical considerations that we cannot consider in deml here. The choice of estima- tors can be driven by the type and duration of the study. Postlicensure evaluation of a vaccine after an acute outbreak of an infectious agent often must be carried out using only information on whether people became infected or developed the disease during the period of the outbreak, since time-to-event or exposure data are not available. In this case, estimation of vac- cine efficacy will be based on the cumulative inci- dence, or attack rates. If time-to-event data were aval- able, relative incidence rates or relative hazards could be used. If the study occurred over a longer period of time, with the risk set also changing over time, then
Am J Epidemiol Vol. 146, No. lo, 1997
CONTACT RATES AND EXPOSURE EFFICACY 1 :>;:'i
the relative incidence or relative hazard rates would be , .
Knowledge of being vaccinated could alter the con- tact rate of a vaccinated person or the contact pattern in a vaccinated population. With interventions other than vaccines, the primary goal of an intervention may be change in exposure to infection. "Contact rate ef- ficacy" is the relative change in the contact rates due to an intervention. "Exposure efficacy" or "behavior efficacy" is the relative increase or decrease in the risk of infection or disease due to the change in exposure to the infectious agent, depending on the outcome mea- sure chosen (7). For example, if we consider the com- ponents of the hazard rate as discussed above, changes in exposure to the infectious agent can occur in the rate of contact, in the prevalence of infection in the contact groups, or in the transmission probability through a change in the type of contact. In nomandomized or observational'studies, the vaccinated and unvaccinated groups often differ in their exposure to infection with- out changing their behavior. Unequal exposure to in- fection in the two comparison groups can bias esti- mates of the efficacy measures of interest. Although vaccine efficacy estimates based on the transmission probability require more information than those based on the unconditional parameters, they are less sensi- tive to bias from unequal exposure to infection in the two groups.
a more appropriate choice for the dynamic cohort that would be under observation.
, i
Example (continued)
, .- , .$ .,$ .> . . ..2
, j , - .* ~ . .,' ..~- :j :$ ..
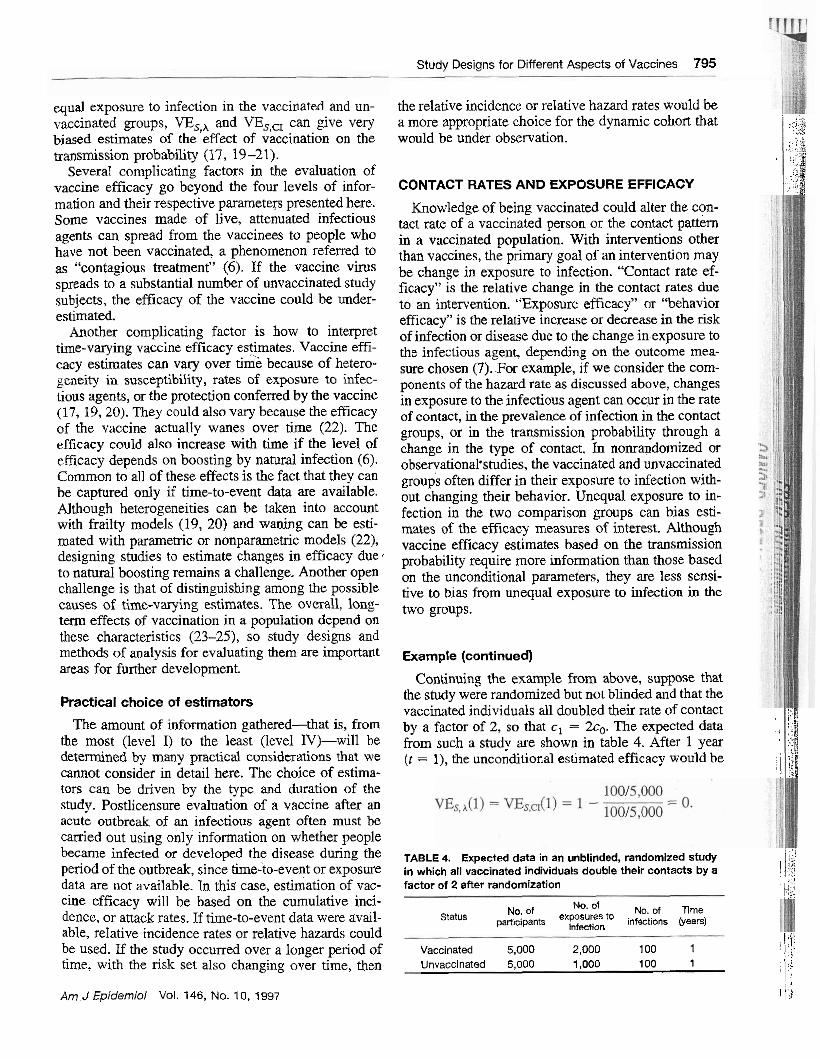
TABLE 4. Expected data in an unblinded, randomized study I,:/ in which all vaccinated individuals double their contacts by a I I!!;
.,. factor of 2 after randomization ,,:
i I:!;! , ,...
Continuing the example from above, suppose that the study were randomized but not blinded and that the vaccinated individuals all doubled their rate of contact ;:!
NO. Of Of N a of Tme status paniaipanh exposures to infections (years)
infection 1 ,i'
by a factor of 2, so that c , = 2c0. The expected data ' ,
from such a study are shown in table 4. After 1 year ) ( t = I), the unconditional estimated efficacy would he
; 1, ,
Vaccinated 5,000 2,000 100 1 , , \ : I ; : .;
1,000 100 1 , .
Unvaccinated 5,000 , , I ,. i.
I , ! , : 1 : ;
1;: , d !;I 21 ,:, .
The efficacy estimate based on the number of infec- tions conditional on the number of exposures to infec- tion would be
796 Halloran et al.
Using the unconditional estimates, with no knowledge of the change in exposure to infection, we would believe the protective effect of the vaccine to be zero, while, using the conditional estimates, we correctly estimate the protective efficacy to be 0.50. A similar result would occur if vaccinated people made contact with people who were more infectious or with groups in which the prevalence of infection was twice as high. Such a result would also occur if the vaccinated people changed the type of contact they made to one that had a higher baseline transmission probability.
The combined effect of the change in exposure to infection and the biologic protective effect of the vac- cine is an important public health measure of interest. Indeed, an increase in the contact rate or other source of increased exposure to infection could outweigh any biologic protection conferred by the vaccine. Thus, a biologically protective vaccine could have detrimental public health effects. Whether the biologic protective efficacy or overall efficacy for an individual is of interest depends on the question underlying the study. The study design must be chosen to ensure that the question or questions of interest will be answered. In general, it is important to differentiate risk factors for exposure to infection from risk factors for biologic susceptibility. Stratification by surrogates for amount of exposure to infection could help to reduce potential
T'.-
bias in unconditional estimators. It is possible to design studies to examine several
questions at the same time and to estimate more than one parameter from the data. In the last example, if the number of exposures to infection were ascertained, then both VE,, and VESA could be estimated, giving an estimate of both the biologic protective efficacy and the effect of the combined reduction in susceptibility with increased exposure.
VACCINE EFFECT ON INFECTIOUSNESS WE,)
The biologic effect of the vaccine in reducing infec- tiousness, YE,, can be estimated epidemiologically by comparing the per-contact transmission probability from vaccinated people who become infected with the transmission probability from unvaccinated people who become infected. In contrast to VE,, which is estimated using either conditional or unconditional parameters, VE, can generally be estimated only using conditional measures such as the transmission proba- bility or the secondary attack rate (4, 26-28). To estimate the biologic effect of the vaccine in reducing infectiousness (4), the relative risk cornpatison groups are defined according to the vaccination status of the infectious person contacting the susceptible person. In fable 1, the VE, estimate is shown in the second column of the top row of conditional parameters. For completeness, the third column of parameters contains the estimate of the combined effects of the vaccine in reducing the transmission probability if both the in- fectious person and the susceptible person in the con- tact are vaccinated (VET).
Example
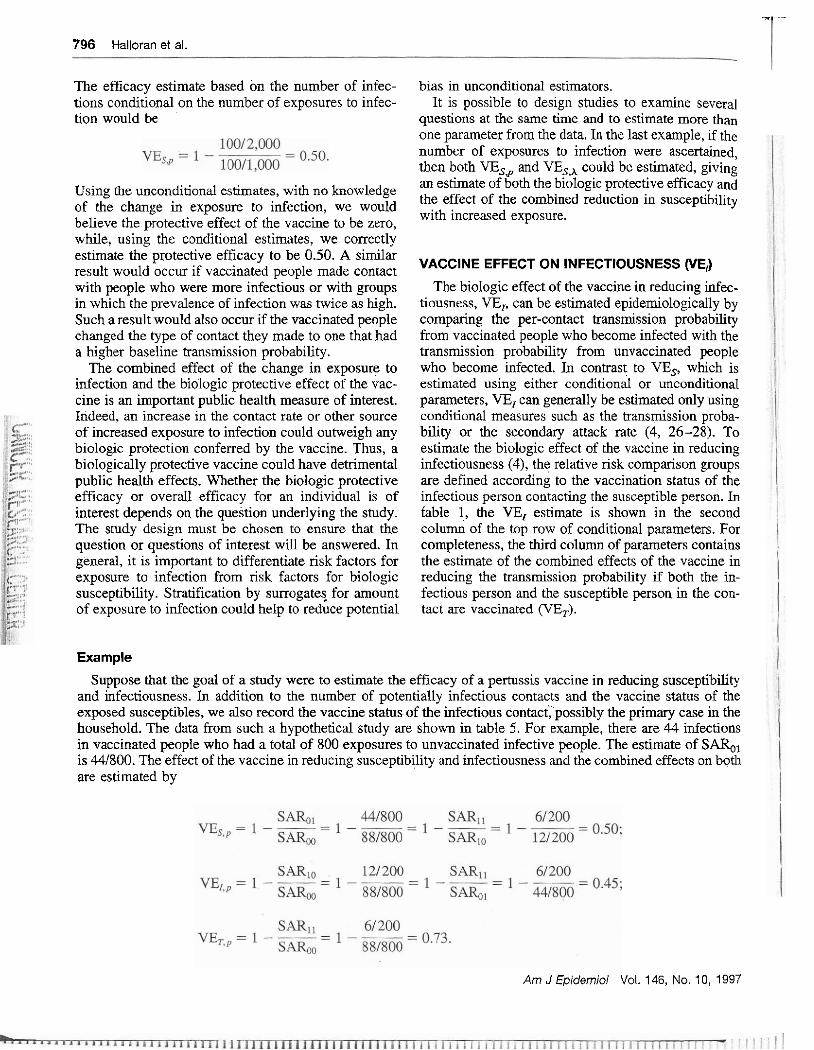
Suppose that the goal of a study were to estimate the efficacy of a pertussis vaccine in reducing susceptibility and infectiousness. In addition to the number of potentially infectious contacts and the vaccine status of the exposed susceptibles, we also record the vaccine status of the infectious contact, possibly the primary case in the household. The data from such a hypothetical study are shown in table 5. For example, there are 44 infections in vaccinated people who had a total of 800 exposures to unvaccinated infective people. The estimate of S&, is 441800. The effect of the vaccine in reduclng susceptibility and infectiousness and the combined effects on both are estimated by
Am J Epidemioi Val. 146, No. 10, 1997
Studv Desians for Different AsDects of Vaccines 797
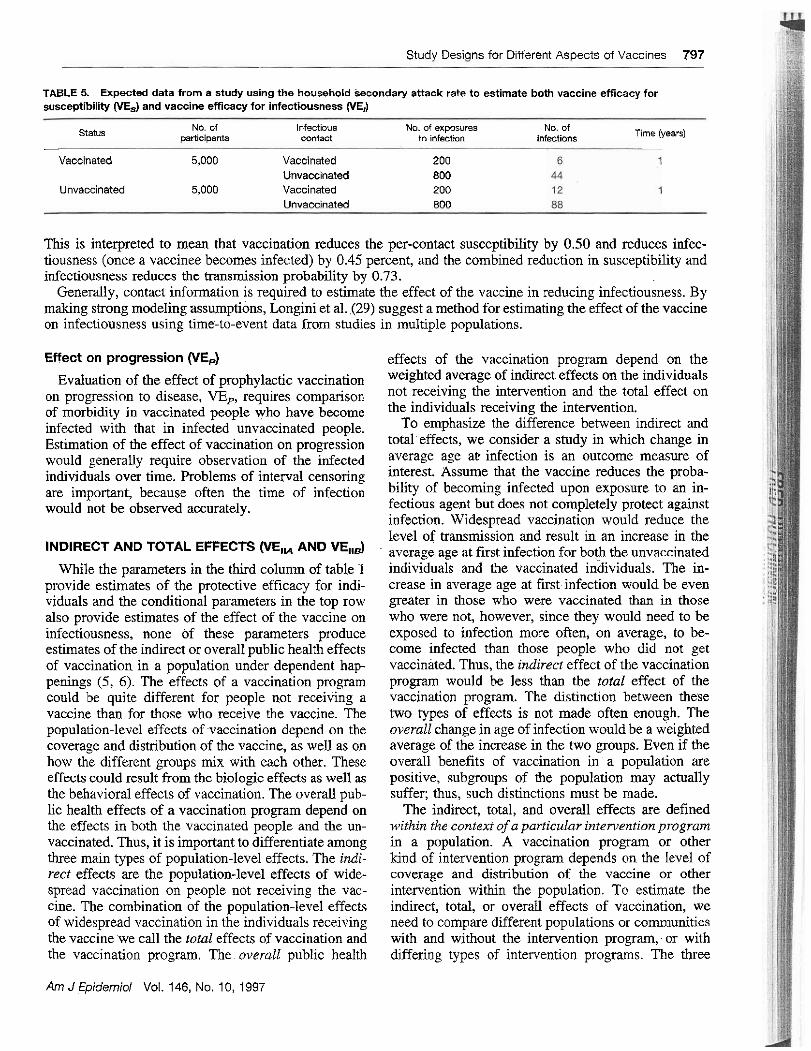
TABLE 5. Expected data from a study using the household Secondary attack rate to estimate both vaccine efficacy for susceptibility (YE,) and vaccine efficacy for infectiousness (VE,)
status No. of infectious No. of exposures No, of ~af l ic i~ants contact to infMion infections Time (years)
- - -
Vaccinated 5,000 Vaccinated 200 Unvacc~nated 800
Unvaccinated 5,000 Vaccinated 200 I lnvlrnnet.4 RrUl
This is interpreted to mean that vaccination reduces the per-contact susceptibility by 0.50 and reduces infec- tiousness (once a vaccinee becomes infected) by 0.45 percent, and the combined reduction in susceptibility and infectiousness reduces the transmission probability by 0.73.
Generally, contact information is required to estimate the effect of the vaccine in reducing infectiousness. By making strong modeling assumptions, Longini et al. (29) suggest a method for estimating the effect of the vaccine on infectiousness using time-to-event data from studies in multiple populations.
Effect on progression (VEJ
Evaluation of the effect of prophylactic vaccination on progression to disease, VE,, requires comparison of morbidity in vaccinated people who have become infected with that in infected unvaccinated people. Estimation of the effect of vaccination on progression would generally require observation of the infected individuals over time. Problems of interval censoring are important, because often the time of infection would not be observed accurately.
INDIRECT AND TOTAL EFFECTS WE,, AND VE,,$ . While the parameters in the third column of table 1
provide estimates of the protective efficacy for indi- viduals and the conditional parameters in the top row also provide estimates of the effect of the vaccine on infectiousness, none of these parameters produce estimates of the indirect or overall public health effects of vaccination in a population under dependent hap- penings (5, 6) . The effects of a vaccination program could be quite different for people not receiving a vaccine than for those who receive the vaccine. The population-level effects of vaccination depend on the coverage and distribution of the vaccine, as well as on how the different groups mix with each other. These effects could result from the biologic effects as well as the behavioral effects of vaccination. The overall pub- lic health effects of a vaccination program depend on the effects in both the vaccinated people and the un- vaccinated. Thus, it is important to differentiate among three main types of population-level effects. The indi- rect effects are the population-level effects of wide- spread vaccination on people not receiving the vac- cine. The combination of the population-level effects of widespread vaccination in the individuals receiving the vaccine we call the total effects of vaccination and the vaccination program. The overall public health
Am J Epidemiol Vol. 146, No. 10, 1997
effects of the vaccination program depend on the weighted average of indirect effects on the individuals not receiving the intervention and the total effect on the individuals receiving the intervention.
To emphasize the difference between indirect and totaleffects, we consider a study in which change in average age a t infection is an outcome measure of interest. Assume that the vaccine reduces the proba- bility of becoming infected upon exposure to an in- fectious agent but does not completely protect against infection. Widespread vaccination would reduce the level of transmission and result in an increase in the average age at first infection for both the unvaccinated individuals and the vaccinated inhividuals. The in- crease in average age at firstinfection would be even greater in those who were vaccinated than in those who were not, however, since they would need to be exposed to infection more often, on average, to be- come infected than those people who did not get vaccinated. Thus, the indirect effect of the vaccination program would be less than the total effect of the vaccination program. The distinction between these two types of effects is not made often enough. The overall change in age of infection would be a weighted average of the increase in the two groups. Even if the overall benefits of vaccination in a population are positive, subgroups of the population may actually suffer; thus, such distinctions must be made.
The indirect, total, and overall effects are defined within the context of a particular intervention program in a population. A vaccination program or other kind of intervention program depends on the level of coverage and distribution of the vaccine or other intervention within the population. To estimate the indirect, total, or overall effects of vaccination, we need to compare different populations or communities with and without the intervention program; or with differing types of intervention programs. The three
'i 798 Halloran et al.
t P ,
!.! different kinds of population-level effects-indirect, $ i. total, and overall-motivate three types of study de-
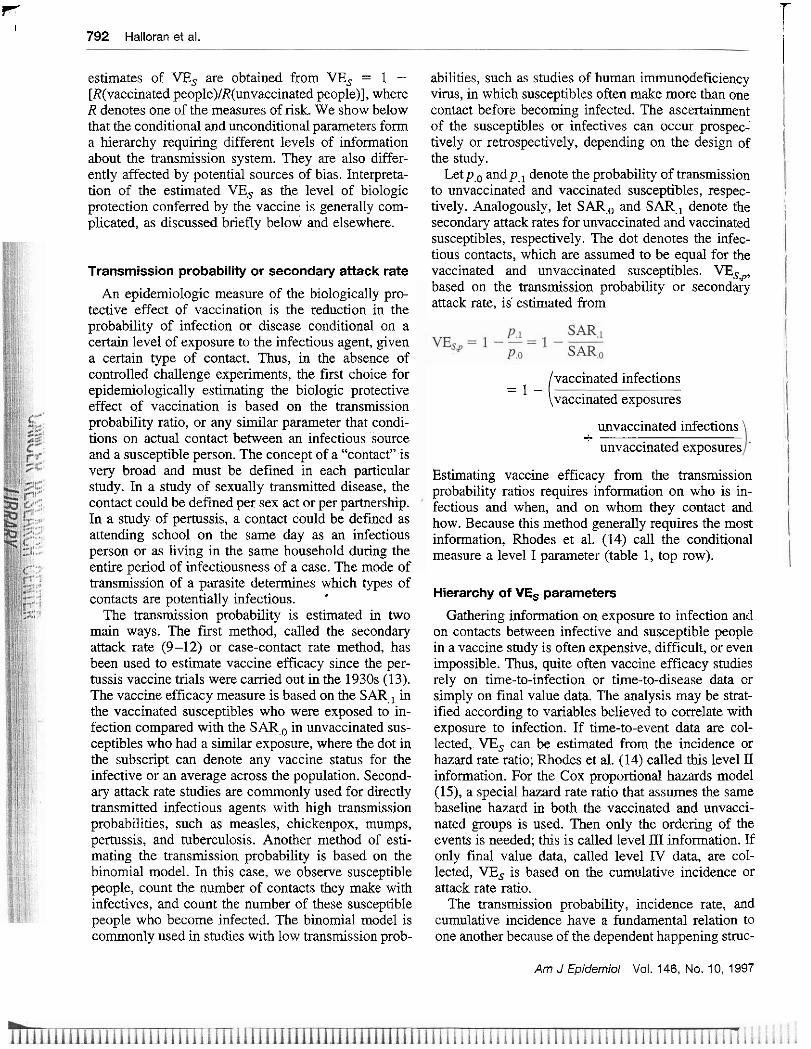
signs depending on the choice of comparison popula- tions. In the expression VE = 1 - RR, the estimate of relative risk is derived from comparing different pop- ulations. Together with the study designs for individ- ual effects presented above, these are the four study designs for dependent happenings (5, 6) (figure 2). In table 1, the study designs for population-level effects are shown in the right three columns and include study designs IIA, IIB, and 111 from figure 2. The parameters discussed above are study designs of type I, shown in the third column of the table.
Since the population-level effects of interest are def ied within the context of a particular intervention program, the unit of inference is the population, and several populations might be included in the study. The issues raised are similar to those in community trials of interventions against noninfectious diseases. It is important in designing such studies that the popu- lations or communities chosen as the unit of observa- tion be separated as much as possible in every way that is relevant for transmission of the infection under study. The separation could be geographic, cultural, or temporal. We could compare neighboring villages, different cities, or child-care centers with different levels and distributions of vaccination. If there is transmission-relevant mixing among the population units, this could bias the estimates of effectiveness. One population could be the preintervention popula- tion while the other population was the postinterven- tion population, raising problems of historical con- trols. Studies comparing interventions in different populations can be done either as part of phase 111 trials or as part of postlicensure surveillance. Increas- ing interest is being shown in evaluation of potential indirect and overall effects of vaccination strategies before licensure.
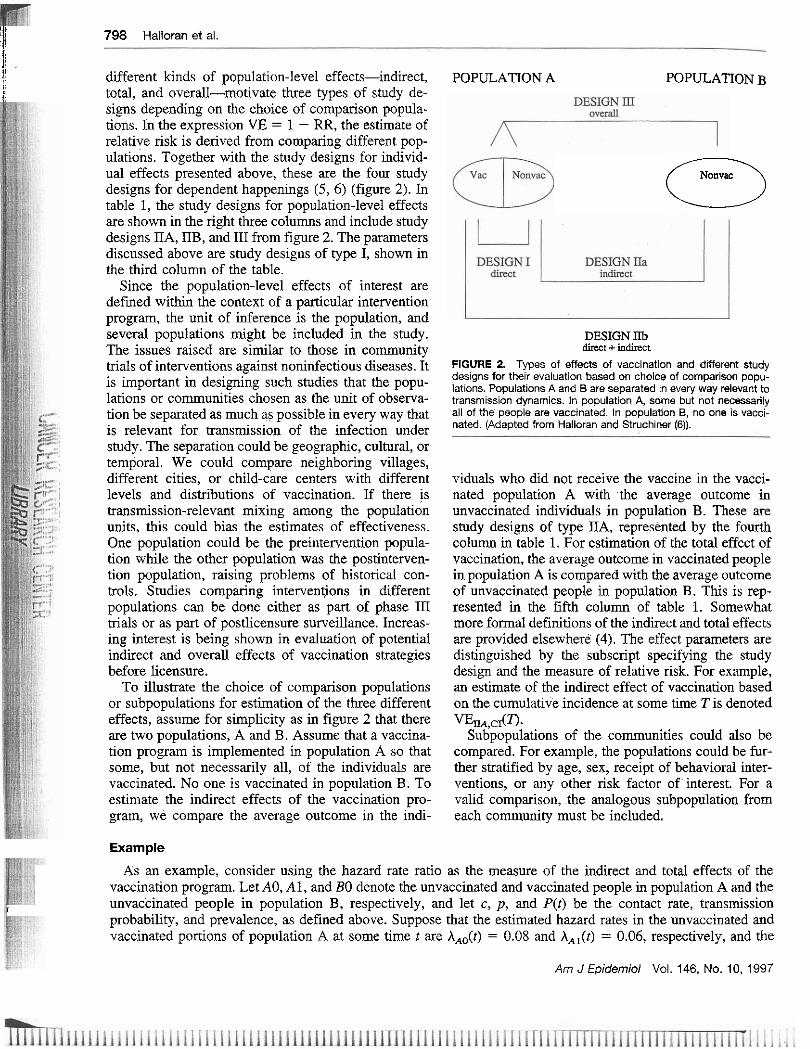
To illustrate the choice of comparison populations or subpopulations for estimation of the three different effects, assume for simplicity as in figure 2 that there are two populations, A and B. Assume that a vaccina- tion program is implemented in population A so that some, but not necessarily all, of the individuals are vaccinated. No one is vaccinated in population B. To estimate the indirect effects of the vaccination pro- gram, we compare the average outcome in the indi-
POPULATION A POPULATION B
Nonvac (3
DESIGN IIb d k t + indirect
FIGURE 2. Types of effects of vaccination and different study designs for their evaluation based on choice of comparison popu- lations. Populations A and B are separated in every way relevant to transmission dynamics. in population A, some but not necessarily ail of the people are vaccinated. In population B, no one is vacci- nated. (Adapted from Halloran and Stmchiner (6)).
viduals who did not receive the vaccine in the vacci- nated population A with the average outcome in unvaccinated individuals in population B. These are study designs of type IIA, represented by the fourth column in table 1. For estimation of the total effect of vaccination, the average outcome in vaccinated people in population A is compared with the average outcome of unvaccinated people in population B. This is rep- resented in the fifth column of table 1. Somewhat more formal definitions of the indirect and total effects are provided elsewhere (4). The effect parameters are distinguished by the subscript specifying the study design and the measure of relative risk. For example, an estimate of the indiiect effect of vaccination based on the cumulative incidence at some time T is denoted % , c I ( ~ .
Subpopulations of the communities could also be compared. For example, the populations could be fur- ther stratified by age, sex, receipt of behavioral inter- ventions, or any other risk factor of interest. For a valid comparison, the analogous subpopulation from each community must be included.
Example
As an example, consider using the hazard rate ratio as the measure of the indirect and total effects of the vaccination program. Let AO, A l , and BO denote the unvaccinated and vaccinated people in population A and the
I unvaccinated people in population B, respectively, and let c, p, and P(t) be the contact rate, transmission probability, and prevalence, as defined above. Suppose that the estimated hazard rates in the unvaccinated and vaccinated portions of population A at some time tare A,,(t) = 0.08 and A,,(t) = 0.06, respectively, and the
Am J Epidernioi Vol. 146, No. 10, 1997
Study Desiqns for Different Aspects of Vaccines 799
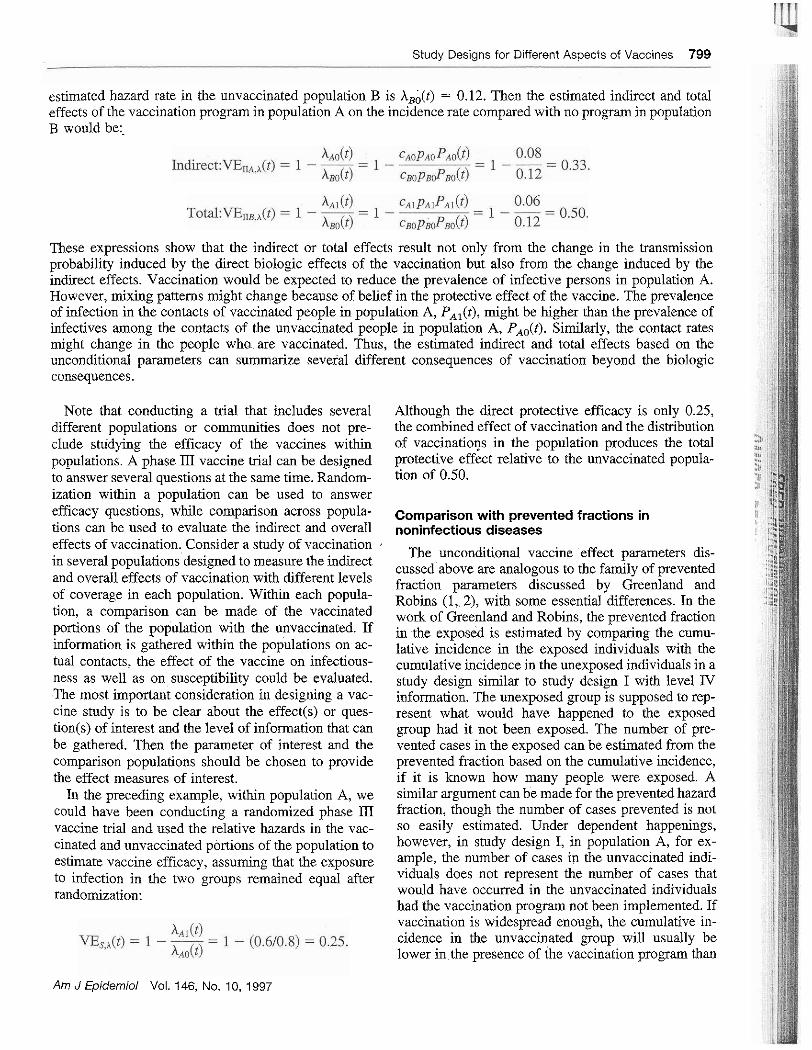
estimated hazard rate in the unvaccinated population B is X,;(t) = 0.12. Then the estimated indirect and total effects of the vaccination program in population A on the incidence rate compared with no program in population B would be:.
These expressions show that the indirect or total effects result not only from the change in the transmission probability induced by the direct biologic effects of the vaccination but also from the change induced by the indirect effects. Vaccination would be expected to reduce the prevalence of infective persons in population A. However, mixing patterns might change because of belief in the protective effect of the vaccine. The prevalence of infection in the contacts of vaccinated people in population A, PA,(t), might be higher than the prevalence of infectives among the contacts of the unvaccinated people in population A, PA,(t). Similarly, the contact rates might change in the people wha are vaccinated. Thus, the estimated indirect and total effects based on the unconditional parameters can summarize several different consequences of vaccination beyond the biologic consequences.
Note that conducting a trial that includes several Although the direct protective efficacy is only 0.25, different populations or communities does not pre- the combined effect of vaccination and the distribution clude studying the efficacy of the vaccines within of vaccinations in the population produces the total populations. A phase 111 vaccine trial can be designed protective effect relative to the unvaccinated popula- to answer several questions at the same time. Random- tion of 0.50. ization within a population can be used to answer efficacy questions, while comparison across popula- ~ ~ , ~ , , i ~ ~ ~ with prevented fractions in tions can be used to evaluate the indirect and overall noninfectious diseases effects of vaccination. Consider a study of vaccination . in several populations designed to measure the indirect and overall effects of vaccination with different levels of coverage in each population. Within each popula- tion, a comparison can be made of the vaccinated portions of the population with the unvaccinated. If information is gathered within the populations on ac- tual contacts, the effect of the vaccine on infectious- ness as well as on susceptibility could be evaluated. The most important consideration in designing a vac- cine study is to be clear about the effect(s) or ques- tion(~) of interest and the level of information that can be gathered. Then the parameter of interest and the comparison populations should be chosen to provide the effect measures of interest.
In the preceding example, within population A, we could have been conducting a randomized phase 111 vaccine trial and used the relative hazards in the vac- cinated and unvaccinated portions of the population to estimate vaccine efficacy, assuming that the exposure to infection in the two groups remained equal after randomization:
Am J Epidemiol Vol. 146, No. 10, 1997
The unconditional vaccine effect parameters dis- cussed above are analogous to the family of prevented fraction parameters discussed by Greenland and Robins (1, 2), with some essential differences. In the work of Greenland and Robins, the prevented fraction in the exposed is estimated by comparing the cumu- lative incidence in the exposed individuals with the cumulative incidence in the unexposed individuals in a study design similar to study design I with level IV information. The unexposed group is supposed to rep- resent what would have happened to the exposed group had it not been exposed. The number of pre- vented cases in the exposed can be estimated from the prevented fraction based on the cumulative incidence, if it is known how many people were exposed. A similar argument can be made for the prevented hazard fraction, though the number of cases prevented is not so easily estimated. Under dependent happenings, however, in study design I, in population A, for ex- ample, the number of cases in the unvaccinated indi- viduals does not represent the number of cases that would have occurred in the unvaccinated individuals had the vaccination program not been implemented. If vaccination is widespread enough, the cumulative in- cidence in the unvaccinated group will usually be lower in the presence of the vaccination program than
800 Halloran et al.
it would be if no one had been vaccinated. Thus, the estimated number of cases prevented generally will underestimate the actual number of cases prevented in the vaccinated group if this figure is calculated using methods designed for noninfectious diseases, as in study design I and in Greenland and Robins (1, 2).
The comparison needs to be made between the cu- mulative incidence in the vaccinated group and what the cumulative incidence would have been in the un- vaccinated group if no vaccination program had been in place, as in study design IIB. A similar argument applies to estimation of the prevented hazard fraction. Thus, the conceptual framework of the table goes beyond simply extending the family of parameters discussed by Greenland and Robins (1, 2) in two dimensions; it also helps to clarify the similarities and differences between the families of prevented fraction parameters in infectious diseases versus noninfectious diseases.
Reduction in individual infectiousness versus indirect effects
There is an important difference between estimating the reduction in individual infectiousness based on the transmission probability and estimating the indirect effects based on unconditional parameters such as hazard rates or cumulative incidence. The uncondi- tional indirect effect in study design IIA results from the decrease in the exposure to the infectious agent, because 1) fewer people are infected due to reduced transmission and 2) those vaccinated people who be- come infected might be less infectious. The reduction in infectiousness as estimated using the per-contact reduction in transmission probability does not take into account the lack of infectiousness in people who did not become infected at all because of vaccination. We cannot know who would have become infected without the vaccination program. Thus, with the trans- mission probability, we obtain a truncated estimate of the reduction in infectiousness, while the indirect ef- fect estimate takes decreased exposure to the infec- tious agent for a combination of reasons into account.
OVERALL EFFECTIVENESS OF VACCINATION PROGRAMS WE,,,)
Considering further the study designs for dependent happenings (figure 2), the overall public health benefit of a vaccination program in a population compared with no vaccination is the weighted average of the outcomes in the vaccinated and unvaccinated persons at risk in population A compared with the outcomes in persons at risk in population B. The overall effect depends on the fraction f that is vaccinated in popula-
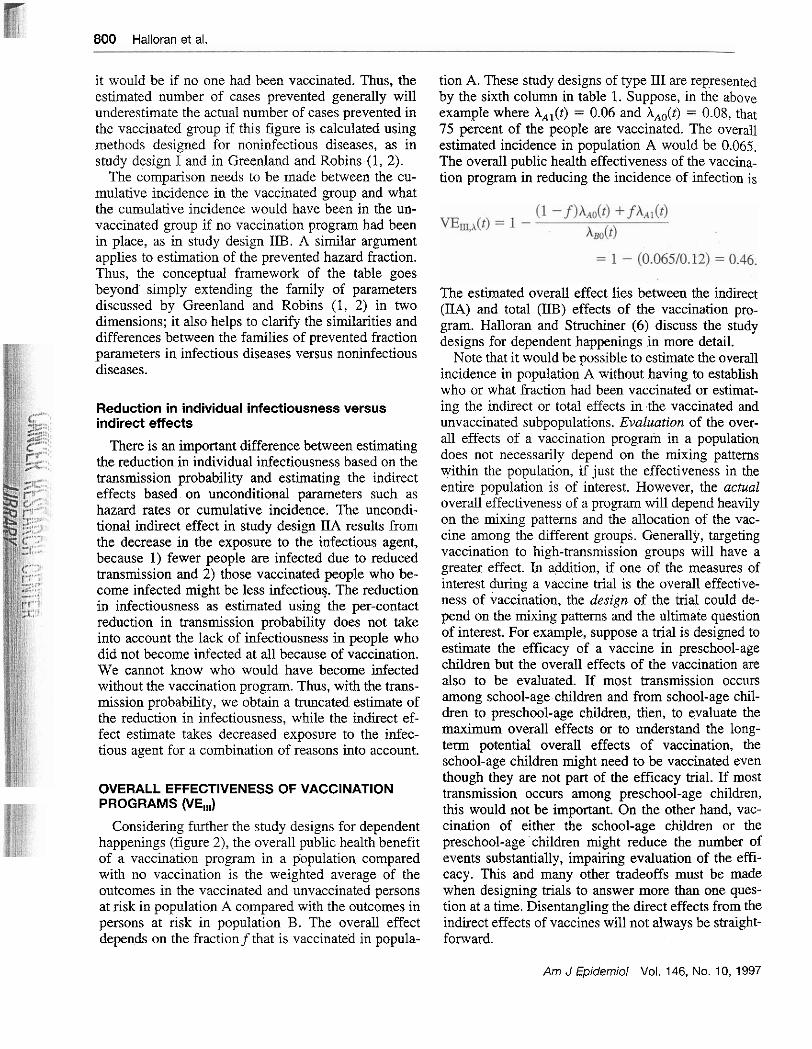
tion A. These study designs of type III are represented by the sixth column in table 1. Suppose, in the above example where AAi(t) = 0.06 and AA,(t) = 0.08, that 75 percent of the people are vaccinated. The overall estimated incidence in population A would be 0.065. The overall public health effectiveness of the vaccina- tion program in reducing the incidence of infection is
The estimated overall effect lies between the indirect (IIA) and total (IIB) effects of the vaccination pro- gram. Halloran and Struchiner (6) discuss the study designs for dependent happenings in more detail.
Note that it would be possible to estimate the overall incidence in population A without having to establish who or what fraction had been vaccinated or estimat- ing the indirect or total effects in the vaccinated and unvaccinated subpopulations. Evaluation of the over- all effects of a vaccination program in a population does not necessarily depend on the mixing patterns within the population, if just the effectiveness in the entire population is of interest. However, the actual overall effectiveness of a program will depend heavily on the mixing patterns and the allocation of the vac- cine among the different groups. Generally, targeting vaccination to high-transmission groups will have a greater effect. In addition, if one of the measures of interest during a vaccine trial is the overall effective- ness of vaccination, the design of the trial could de- pend on the mixing patterns and the ultimate question of interest. For example, suppose a trial is designed to estimate the efficacy of a vaccine in preschool-age children but the overall effects of the vaccination are also to be evaluated. If most transmission occurs among school-age children and from school-age chil- dren to preschool-age children, then, to evaluate the maximum overall effects or to understand the long- term potential overall effects of vaccination, the school-age children might need to be vaccinated even though they are not part of the efficacy trial. If most transmission occurs among preschool-age children, this would not be important. On the other hand, vac- cination of either the school-age children or the preschool-age children might reduce the number of events substantially, impairing evaluation of the effi- cacy. This and many other tradeoffs must be made when designing trials to answer more than one ques- tion at a time. Disentangling the direct effects from the indirect effects of vaccines will not always be straight- forward.
Am J Epidemioi Vol. 146, No. 10, 1997
Example
Monto et al. (30) estimated both the protective ef- ficacy and the overall effect of an influenza vaccina- tion program. They vaccinated 85 percent of the school-age children in Tecumseh, Michigan, against Hong Kong influenza just before the epidemic of 1968. The 10-week epidemic period was November 17, 1968, to January 26, 1969. The weekly mean ~nflueuza illness rates in vaccinated and unvaccinated children were 0.072 and 0.090, respectively. This 1 yields an approximate estimate of vaccine efficacy of 0.20 (i.e., VE, - 1 - (0.07U0.090) = 0.20), which is rather low. The overall influenza illness attack rate in Tecumseh for the epidemic period was 0.14, while the adjusted overall influenza attack rate in unvaccinated, neighboring Adrian, Michigan, was 0.42 for the same period. Using the methods of study design JII, the
I oirerall effectiveness of vaccinating 85 percent of I Tecumseh's schoolchildren is estimated to have been
0.57. The use of study designs similar to design III, com-
paring the overall effects of interventions across pop- ~:lations, has been common in infectious disease epi-
1 demiology for a long time, but it is becoming more widespread with the integration of more current epi- demiologic and statistical methods (31-33). Hayes et 1 al. (34) discuss matching on communities for the ran- domization and analysis scheme. A design similar to , 1 that of study design 1II is being used cuqently in a cholera vaccine effectiveness trial in more than 20 communities (J. Clemens, National Institutes of Health, personal communication, 1997) by dividing each community in half geographically and vaccinat- ing all of the individuals in just one half. A similar design will soon be used in community trials of influ- enza vaccines in matched day-care centers. Evaluation of malaria transmission-blocking vaccines that have only indirect effects in humans will require evaluation comparing separate populations. Many of the lessons from group-randomized designs will be applicable, with special consideration of the dependence of events in infectious diseases. Study designs 11.4 and IIB, which examine the effects in the vaccinated or unvac- cinated subpopulations, have been less common. Hopefully they will become an integral part of vaccine evaluation as investigators become more aware of the differences among the population-level effects in the different groups and combine efficacy and effective- ness evaluation in the same study.
Basic reproductive number (Rd
Another important parameter of infectious disease epidemiology is the basic reproductive number, R,.
Am J Epidemiol Vol. 146, No. 10, 1997
Study Designs for Different Aspects of Vaccines 801
With microparasitic infectious agents, such as viruses, bacteria, and small parasites, the R, is the number of new infectives produced by one infectious person in a completely susceptible population during his or her period of infectiousness (35). Similar to the hazard rate, it can be thought of as the product of several components of the transmission system, including the transmission probability, the rate of contact, and the duration of infectiousness. The duration of infectious- ness in the expression for R, replaces the prevalenceof infectives in the expression for the hazard rate. Al- though it is not included in table l , R, is important in understanding the population dynamics of an infec- tious agent and the public health effects of interven- tion. Since a vaccinated person has only a fraction of the transmission probability and possibly a shorter duration of infectiousness, a vaccinated person would not be transmission-dynamically equivalent to a na- ively susceptible person. The fractional contribution of a vaccinated person to Ro compared with the conti- bution of an unvaccinated individual is called the "naive susceptible equivalent" (25). The biologic ef- - - feet of the vatcine can reduce either the transmission
5
probability per contact or the duration of infectious- 3 ) uess. Thus, estimates of the effect of vaccination on infectiousness, susceptibility, or changes in the dura- z tion of infectiousness could provide some information I
on the effect of vaccination on R,. For example, if !
everyone. in a population were vaccinated and the reduction in susceptibility were 0.50, the reduction in infectiousness were 0.30, and the reduction in the duration of infectiousness were 0.60, a vaccinated person would be the naive susceptible equivalent of 0.09 of an unvaccinated person. The reproductive number in the vaccinated population would he 0.09 times the original R,. A vaccine effectiveness measure can also be based on 1 minus the relative basic repro- ductive numbers in two groups, depending on the choice of comparison populations.
SUMMARY
We have presented a systematic framework of study designs for evaluating different effects of vaccination and vaccination programs depending on the choice of comparison groups and parameter of effect (table 1). We have found this framework useful in organizing our own thoughts and in discussions with other col- leagues in designing studies to evaluate vaccination. We hope that others find it useful and that it can contribute to more clarity in the design and analysis of studies of the effects of vaccination on individuals and in populations. Although there are several similarities to the family of prevented risk parameters discussed by Greenland and Robins (1, 2), the dependent hap-
802 Halloran et al.
pening structure of infectious diseases adds more lev- els and types of parameters.
In the third column of table 1, the aim of the studies is to estimate the protective efficacy of vaccination in individuals. This column is divided into two parts, with the amount of information required for estimation increasing from bottom to top (14). This column pro- vides an overview of what is estimable based on the type of data collected in the study. The lower part contains vaccine efficacy based on the unconditional parameters incidence rate ratio (VE,,), hazard rate ratio (VE,,a, and cumulative incidence ratio (VE,,,), which do not require information on actual exposure to infection. These are study designs of type I. If expo- sure to infection is not equal in the two comparison groups, these designs estimate the combined effects of unequal exposure and the direct biologic protective effects of vaccination. The top row represents the conditional parameters, such as the transmission prob- ability or secondary attack rate. While the third col- umn represents the design needed to estimate the vac- cine's effect on susceptibility, VE,,,, the fourth and fifth columns represent designs for the effect on in- fectiousness, VE,,,, and the combined effects on the two, VG,,, respectively.
To measure the indirect, total, or overall public health effects of widespread vaccination, it is neces- sary to compare the effects of vaccination programs in different populations on the parameters of interest. The choice of subpopulations within the different pop- ulations determines whether one is measuring the in- direct effects, VE, (study design IIA), the total ef- fects, VE, (study design IIB), or the overall effects VE, (study design 110 of the vaccination program. We have emphasized that studies can be designed to answer more than one question at a time.
The fundamental relation between the aspects of exposure to infection and susceptibility to the rate of events clarifies the difference between biologic as- pects of the transmission process and the contact as- pects. The hierarchy of parameters also provides a framework for thinking about vaccine efficacy studies based on different parameters, especially the condi- tional versus unconditional parameters, as a missing- data or errors-in-variables problem (4, 7, 36).
We have not discussed vaccine efficacy based on difference parameters here. These were considered by Greenwood and Yule (8) as early as 1915. Difference estimates depend on the absolute incidence in the unvaccinated group, and provide more evidence of the possible public health relevance of vaccines, even when measured within a single population. Table 1 could be entirely rewritten for difference parameters. The parameters listed in table 1 are not exhaustive, but
they represent several of the commonly used mea- sures. Many other outcome measures could be used t~ estimate the effects of a vaccine or a vaccination program. These include average age of f r s t infection and time-to-event as in accelerated failure time mod- els, both of which are related to the hazard rate. Case-control studies are represented by the framework shown here whenever the odds ratio estimator is an approximation of one of the relative risk parameters of table 1.
Increased attention is being given to the design and analysis of vaccine evaluation studies, both pre- and postlicensure. This framework should prove useful in providing a wider and more precise vocabulary for expressing the various kinds of effects being measured and the types of studies needed to estimate the vacci- nation effects of interest.
ACKNOWLEDGMENTS
This work was partially supported by National Institute of Allergy and Infectious Diseases FIRST Award R29- A131057 and grant R01-AI32042. Dr. C. J. Struchiner was partially supported by the Brazilian Research Council (CNPq).
REFERENCES
1. Greenland S, Robins JM. Conceptual problems in the defini- tion and interpretation of attributable fractions. Am J Epide- mi01 1988;128:1185-97.
2. Robins JM, Greenland S. Estimability and estimation of c x ~ cess and etiologic fractions. Stat Med 1989;8:845-59.
3. Ross R. An application of the theory of probabilities to the study of a priori pathometry. Part 1. Pmc R Soc Ser A 1916:92:204-10.
4. Halloran ME, Struchiner CJ. Causal inference in infectious diseases. Epidemiology 1995;6:142-51.
5. Stluchiner CJ, Halloran ME, Robins JM, et al. The behaviour of common measures of association used to assess a vaccina- tion programme under complex disease transmission patterns-a computer simulation study of malaria vaccines. Int J Enidemiol 1990:19:187-96. ~ ~~
6. h all or& ME, ~tru&her CJ. ~ m d y designs for dependent happenings. Epidemiology 1991;2:331-8.
7. Halloran ME, Longini IM Jr, Haber M, et al. Exposure effi- cacy and change in contact rates in evaluating prophylactic HIV vaccines in the field. Stat Med 1994;13:357-77.
8. Greenwood M. Yule UG. The statistics of anti-twhoid and anti-cholera inoculations. and the internretation ofsuch statis- tics in general. Proc R Sbc Med 1915:8(~art 2):113-94.
9. Fox JP, Hall CE, Elveback LR. Epidemiology: man and dis- ease. New York, NY: MacMillan Publishing Company, Inc, 1970 A,. ".
10. Orenstein WA, Bemier RH, Dondero TI, et al. Field evalua- tion of vaccine efficacy. Bull World Health Organ 1985;63: ln<<-L12 L".l>-L.".
11. Orenstein WA. Bernier RH. Hinman AR. Assessine vaccine efficacy in the field: further observations. ~ ~ i d e & o l Rev 1988;10:212-41.
12. Fine PE, Clarkson JA, Miller E. The efficacy of pertussis
Am J Epidemiol Vol. 146, No. 10, 1997
Study Designs for Different Aspects of Vaccines 803
vaccines under conditions of household exposure: further analysis of the 1978-80 PHLS/ERL study in 21 area health authorities in England. Int J Epidemiol 1988;17:635-42.
13. Kendrick P, Eldering G. A study in active immu~zation against pertussis. Am J Hyg Sect B 1939;38:133.
14. Rhodes PH, Halloran ME, LongiN IM Jr. Counting process models for differentiating exposure to infection and suscepti- bility. J R Stat Soc B 1996;58:751-62.
15. Cox DR. Regression models and life tables (with discussion). T R Stat Soc IB) 1972:34187-220. ~ -~ ~
16. Halloran IkE: ~ a b e r M. &ngini Ih4 Jr, et al. Direct and indirect effects in vaccine field efficacy and effectiveness. Am J Epidemiol 1991;133:323-31.
17. Smith PG, Rodrigues LC, Fine PE. Assessment of the Drotec- tive efficacy of vaccines against common diseases using case- couh-01 and cohort studies. Int J Epidemiol 1984;13:87-93.
18. Halloran ME, Haher M, Longini IM Jr. Interpretation and estimation of vaccine efficacy under heterogeneity. Am J Epidemiol 1992;136:328-43.
19. Longini Ih4 Jr, Halloran ME. A frailty mixture model for estimating vaccine efficacy. Appl Stat~l996;45:165-73.
20. Halloran ME, L o n g i ~ IM Jr, Struchiner CJ. Estimability and interpretation of vaccine efficacy using frailty mixing models. .1M J Epidemiol 1996;144:83-97.
21. Smchiner CJ, Halloran ME. Randomization and baseline transmission in vaccine field trials. (Technical report no. 96- 7). Atlanta, GA: Emory University, 1996.
22. Durham LK, Longini Ih4 Jr, Halloran ME, et al. Nonparamet- ric estimation of waning vaccine effects using Schoenfeld residuals from the Cox model. (Technical report no. 97-7). Atlanta. GA: Emorv Universitv. 1997. ,
23. iiaLl.,~an It:. ~truchtner CJ. Spiclman A. IrluJ~.ltng rnslxia \dcc~nc\. I I . t'opulart(,n cffects of stqc-5pcc1fic mlan:~ ~3:- clnui dcpmdcnt on narural hoostin: \ I d h BIO\:I l'JhY:44: 1 1 5-AU .A" ,,,
24. Halloran ME, Watelet L, Smchiner CJ. Epidemiologic effects of vaccines with complex direct effects in an age-structwed population. Math Biosci 1994;121:193-225.
25. Halloran ME, Cochi SL, Lieu TA, et al. Theoretical epidemi- ologic and morbidity effects of routine varicella immunization
of preschool children in the United States. Am J Epidemiol 1994:140:81-104.
26. ~oo&nan JS, Little RJ. Assessing HIV vaccine effeCts. A q J Epidemiol 1995;142:1113-20.
27. LongiN IM Jr, Datta S , Halloran ME. Measuring vaccine efficacv for both suscentibilitv to infection and reduction in infectiousness for prop~ylactic HIV-1 vaccines. J Acquir Im- mune Defic Syndr Hum Retrovirol 1996;13:440-7.
28. Halloran ME. Evaluating HIV vaccines: discussion. Stat Med 1996;15:2405-12.
29. LongiN IM Jr, Sagatelian K, &da WN, et al. Optimal vaccine trials design when estimating vaccine efficacy for susceptibil- ity and infectiousness from multiple populations. Stat Med (in press).
30. Monto AS, Davenport FM, Napier JA, et al. Effect of vacci- nation of a school-age population upon the course of an -A2-Hong Kong influenza epidemic. Bull World Health Organ 1969;41:537-42.
31. Grosskuth H, Mosha F, Todd I, et al. Impact of improved treatment of sexually transmitted diseases on HIV infection in rural Tanzania: randomised controlled trial. Lancet 1995;346: 530-6.
32. Katz J, Carey VJ, Zeger SL, et al. Estimation of design effects and diarrhea clustering within households and villages. Am J Epidemiol 1993;138:994-1006.
33. Clemens J, Brenner R, Rao M, et al. Evaluating new vaccines for developing countries: efficacy or effectiveness? JAMA 1996:275:390-7.
34. Hayes R, Mosha F, Nicoll A, et al. A community trial of the impact, of improved sexually transmitted disease treatment on the HIV epidemic in rural Tanzania. 1. Design. AlDS 1995; 9:919-26.
35. Anderson RM, May RM. Infectious diseases of humans: dy- namics and control. New York, NY: Oxford University Press, 1991.
36. Golm GT, Halloran ME, Longini IM Jr. Semiparametric mod- els for mismeasured exposure information in vaccine trials. (Technical report no. 97-5). Atlanta, GA: Emory University, 1997.
Am JEpiderniol Vol. 146, No. 10, 1997