Embed Size (px)
Citation preview
American Association of Port AuthoritiesFinance Seminar
Session 5: Trends and New Approaches to Port Financing
Ira Smelkinson
Executive Director
Morgan Stanley
1221 Avenue of the Americas, 30th Floor
New York, NY 10019
(212) 762-8029

prototype template (5428278)\print library_new_final.ppt 6/11/2010
2
Everything Old Is New Again…
“The charm of history and its enigmatic lesson consist in the fact that, from age to age,
nothing changes and yet everything is completely different”
- Aldous Huxley
“Each time history repeats itself, the price goes up”
- Anonymous
prototype template (5428278)\print library_new_final.ppt 6/11/2010
3
Where Have We Been?
Credit Market Melt Down
Subprime mortgage defaults
Failure of mortgage backed securities
Credit default swaps triggered
Crisis of confidence/liquidity concern leads to bailout
2008 to 2010
prototype template (5428278)\print library_new_final.ppt 6/11/2010
4
Government Bailout
TARP / government investments
Guarantee of money funds / commercial paper
Flight to quality leading to interest rates falling in US Treasuries
Higher federal deficits / Deficit Reduction Commission
Financial reform legislation – bankers, lenders, derivatives, rating agencies
2008 to 2010
prototype template (5428278)\print library_new_final.ppt 6/11/2010
5
Macroeconomic Developments
Rate of GDP recovery?
Unemployment / underemployment concerns
Continuing depressed real estate markets
Deficit / default concerns from Europe
Contagion to domestic municipal market?
2008 to 2010
prototype template (5428278)\print library_new_final.ppt 6/11/2010
6
Municipal Market Continues to Function
Credit quality matters
Yields remain low
Reduced appeal / application of bond insurers
Heightened investor focus on credit / reaching out to investors
Build America Bond Program
A success story (so far)
prototype template (5428278)\print library_new_final.ppt 6/11/2010
7
Securing Funds for Port Development
Municipal market investors continue to lend to ports
Rating agencies have port industry under “negative outlook”
Traditional bond financing provides attractive funding but involves more steps and
time than several years ago
Private/P3 transactions continue to play a role

Economic Update
prototype template (5428278)\print library_new_final.ppt 6/11/2010
9
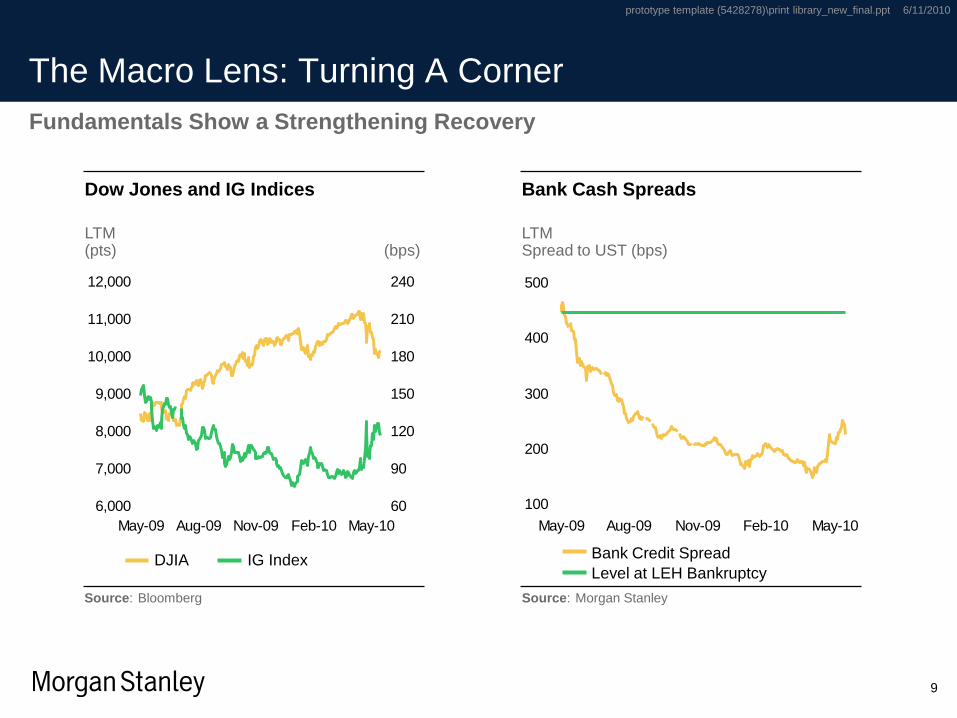
The Macro Lens: Turning A Corner
6,000
7,000
8,000
9,000
10,000
11,000
12,000
May-09 Aug-09 Nov-09 Feb-10 May-10
60
90
120
150
180
210
240
DJIA IG Index
Dow Jones and IG Indices
LTM(pts) (bps)
Fundamentals Show a Strengthening Recovery
100
200
300
400
500
May-09 Aug-09 Nov-09 Feb-10 May-10
Bank Credit Spread
Level at LEH Bankruptcy
Bank Cash Spreads
LTMSpread to UST (bps)
Source: Bloomberg Source: Morgan Stanley
prototype template (5428278)\print library_new_final.ppt 6/11/2010
10
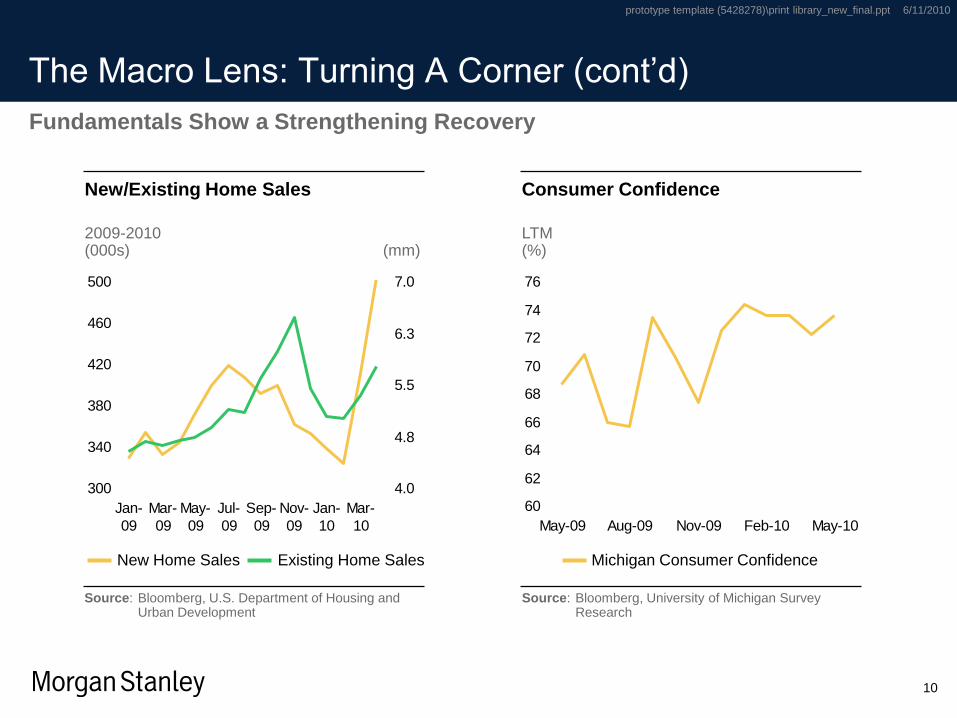
The Macro Lens: Turning A Corner (cont’d)
300
340
380
420
460
500
Jan-
09
Mar-
09
May-
09
Jul-
09
Sep-
09
Nov-
09
Jan-
10
Mar-
10
4.0
4.8
5.5
6.3
7.0
New Home Sales Existing Home Sales
New/Existing Home Sales
2009-2010(000s) (mm)
Fundamentals Show a Strengthening Recovery
60
62
64
66
68
70
72
74
76
May-09 Aug-09 Nov-09 Feb-10 May-10
Michigan Consumer Confidence
Consumer Confidence
LTM(%)
Source: Bloomberg, U.S. Department of Housing and Urban Development
Source: Bloomberg, University of Michigan Survey Research
prototype template (5428278)\print library_new_final.ppt 6/11/2010
11
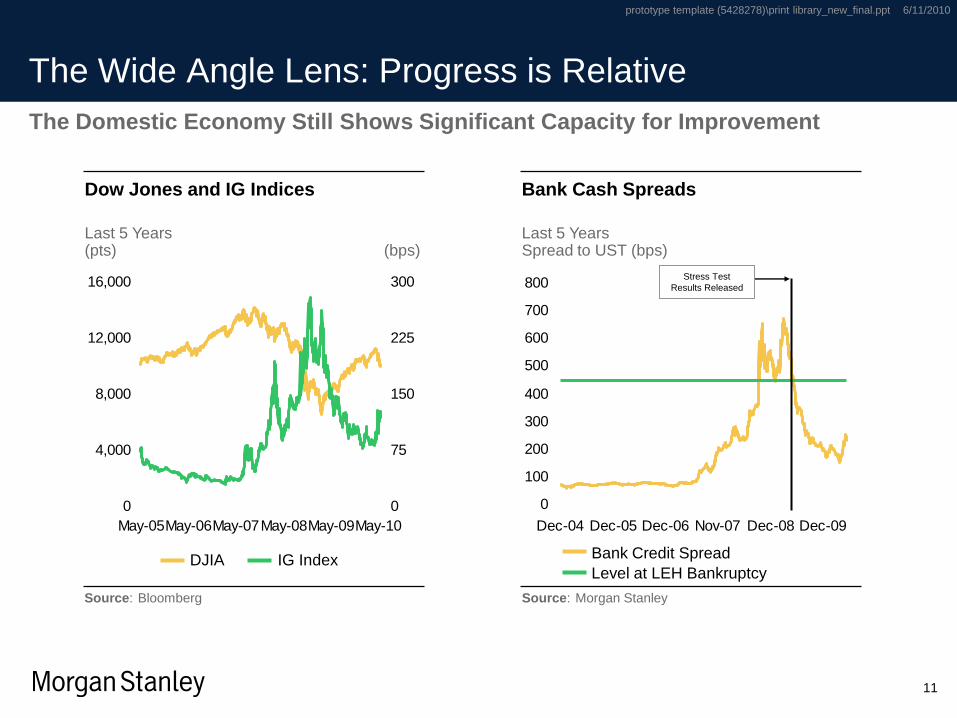
The Wide Angle Lens: Progress is Relative
0
4,000
8,000
12,000
16,000
May-05May-06May-07May-08May-09May-10
0
75
150
225
300
DJIA IG Index
Dow Jones and IG Indices
Last 5 Years(pts) (bps)
The Domestic Economy Still Shows Significant Capacity for Improvement
0
100
200
300
400
500
600
700
800
Dec-04 Dec-05 Dec-06 Nov-07 Dec-08 Dec-09
Bank Cash Spreads
Last 5 YearsSpread to UST (bps)
Source: Bloomberg Source: Morgan Stanley
Bank Credit Spread
Level at LEH Bankruptcy
Stress Test
Results Released
prototype template (5428278)\print library_new_final.ppt 6/11/2010
12
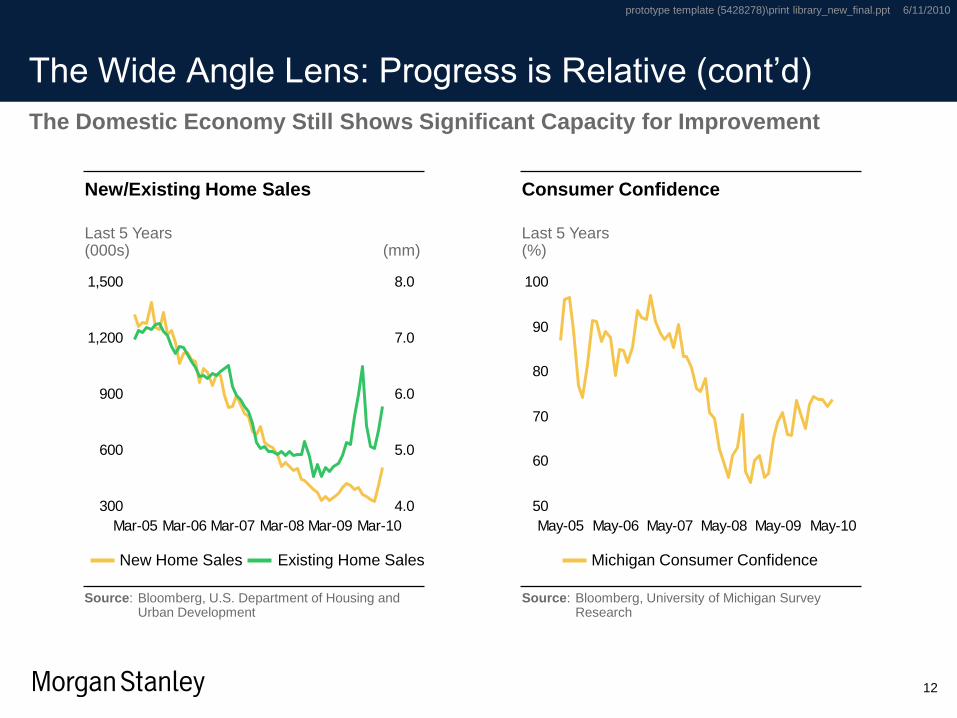
The Wide Angle Lens: Progress is Relative (cont’d)
300
600
900
1,200
1,500
Mar-05 Mar-06 Mar-07 Mar-08 Mar-09 Mar-10
4.0
5.0
6.0
7.0
8.0
New Home Sales Existing Home Sales
New/Existing Home Sales
Last 5 Years(000s) (mm)
The Domestic Economy Still Shows Significant Capacity for Improvement
50
60
70
80
90
100
May-05 May-06 May-07 May-08 May-09 May-10
Consumer Confidence
Last 5 Years(%)
Source: Bloomberg, U.S. Department of Housing and Urban Development
Source: Bloomberg, University of Michigan Survey Research
Michigan Consumer Confidence

prototype template (5428278)\print library_new_final.ppt 6/11/2010
13
Risk Versus Economic Indicators: Past 10 Years
Risk Indicators: Better Than Historical Averages
Worst since January 2000(1) Best since January 2000(1)
CurrentAverage
81
369
629
803
279
1818
677
10
2
82
106
29
246
1565
32
31
187
225
117
Nov-08 Jan-07
Oct-08 Jan-02
Dec-08 Feb-07
Dec-08 Mar-05
Dec-08 Feb-07
Dec-08 Jun-07
Mar-09 Oct-07
VIX
LIBOR-OIS
IG Corporate
BBB Rated Corp
CDX IG Index
High Yield Corp
SPX1089
623
504
33
68
10.2
145
308
23
55
61
83
3.8
17
1,389
71
112
60
74
9.9
74
Dec-08 May-04
Jun-09 Apr-00
Feb-10 Jul-05
Oct-09 Apr-00
Jul-08 Nov-01
Dec-08 Dec-03
Nov-08 Jan-00
ISM Manufacturing
Capacity Utilization
New Home Sales
Unemployment Rate
WTI Crude
University of MichiganConsumer Confidence
ISM New Orders
Economic Indicators: Slowly Improving
66
74
Comparing Worst, Best, Average, and Current
prototype template (5428278)\print library_new_final.ppt 6/11/2010
14
0
2
4
6
8
10
12
14
1 3 5 7 9 11 13 15 17 19 21 23 25 27 29
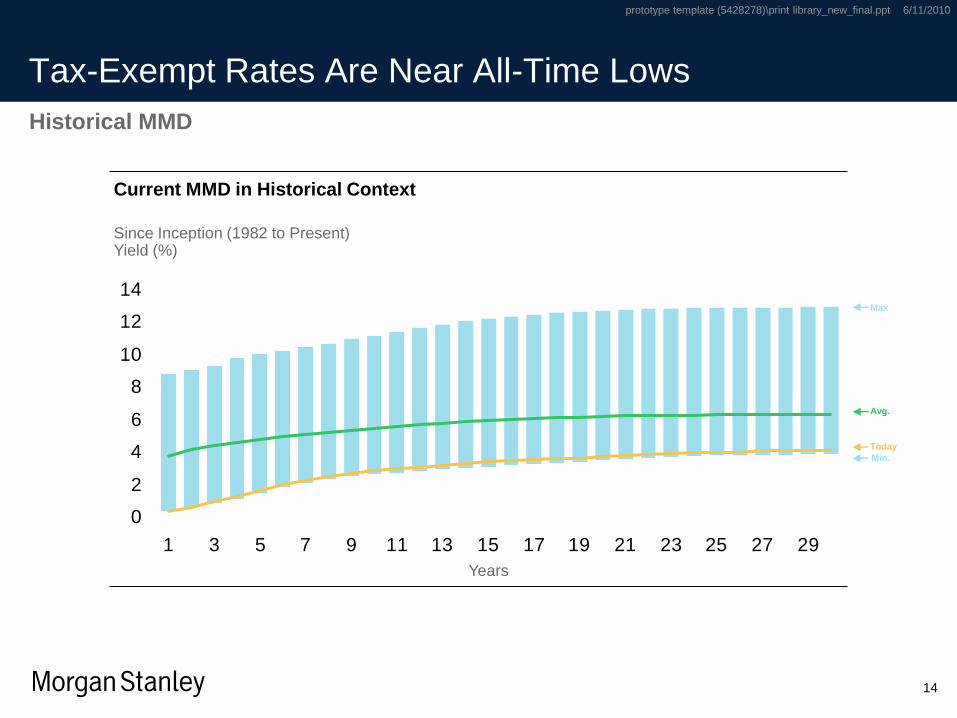
Tax-Exempt Rates Are Near All-Time Lows
Historical MMD
Current MMD in Historical Context
Since Inception (1982 to Present)Yield (%)
Today
Avg.
Min.
Max
Years
prototype template (5428278)\print library_new_final.ppt 6/11/2010
15
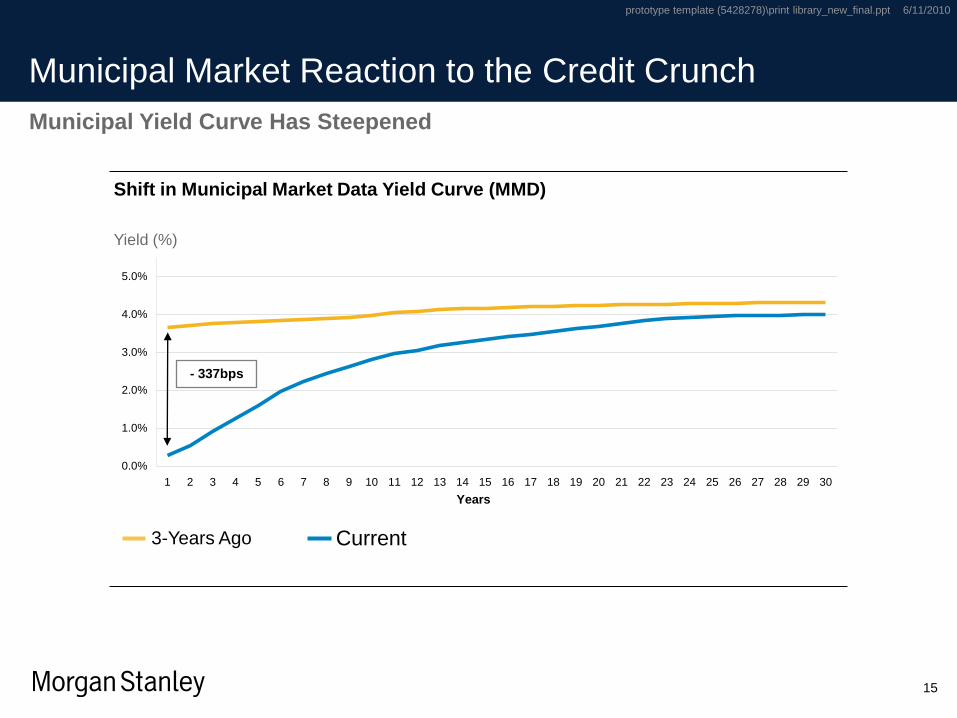
Municipal Market Reaction to the Credit Crunch
Municipal Yield Curve Has Steepened
Shift in Municipal Market Data Yield Curve (MMD)
0.0%
1.0%
2.0%
3.0%
4.0%
5.0%
1 2 3 4 5 6 7 8 9 10 11 12 13 14 15 16 17 18 19 20 21 22 23 24 25 26 27 28 29 30
Years
- 337bps
Yield (%)
3-Years Ago Current
prototype template (5428278)\print library_new_final.ppt 6/11/2010
16
0
50
100
150
200
250
300
350
400
May-08 Sep-08 Jan-09 May-09 Sep-09 Jan-10 May-10
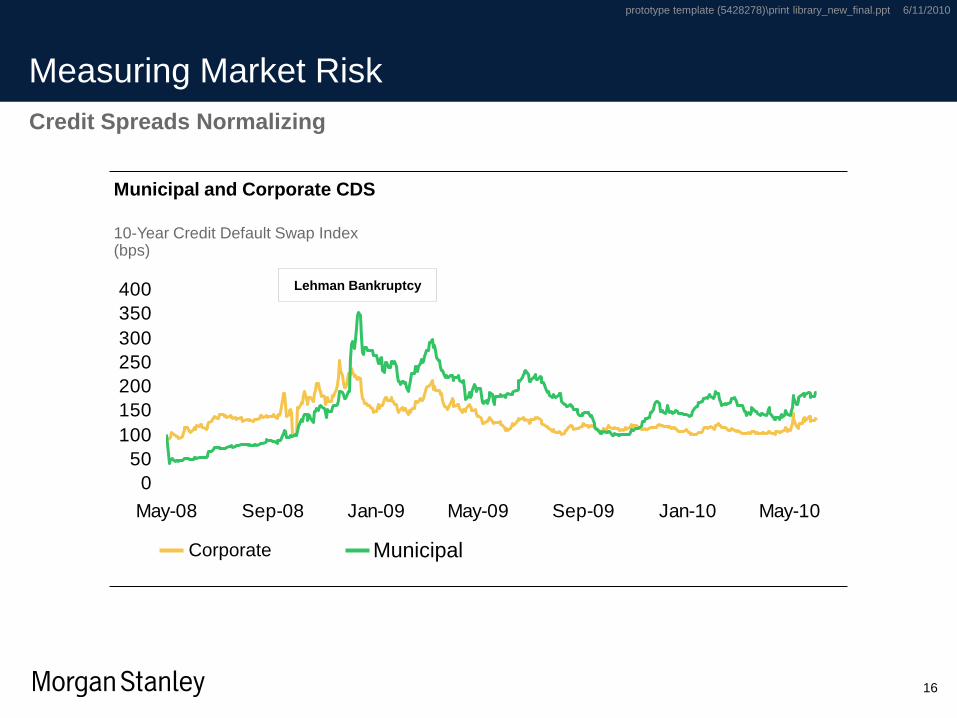
Measuring Market Risk
Corporate Municipal
Credit Spreads Normalizing
Municipal and Corporate CDS
10-Year Credit Default Swap Index(bps)
Lehman Bankruptcy
prototype template (5428278)\print library_new_final.ppt 6/11/2010
17
0
50
100
150
200
250
300
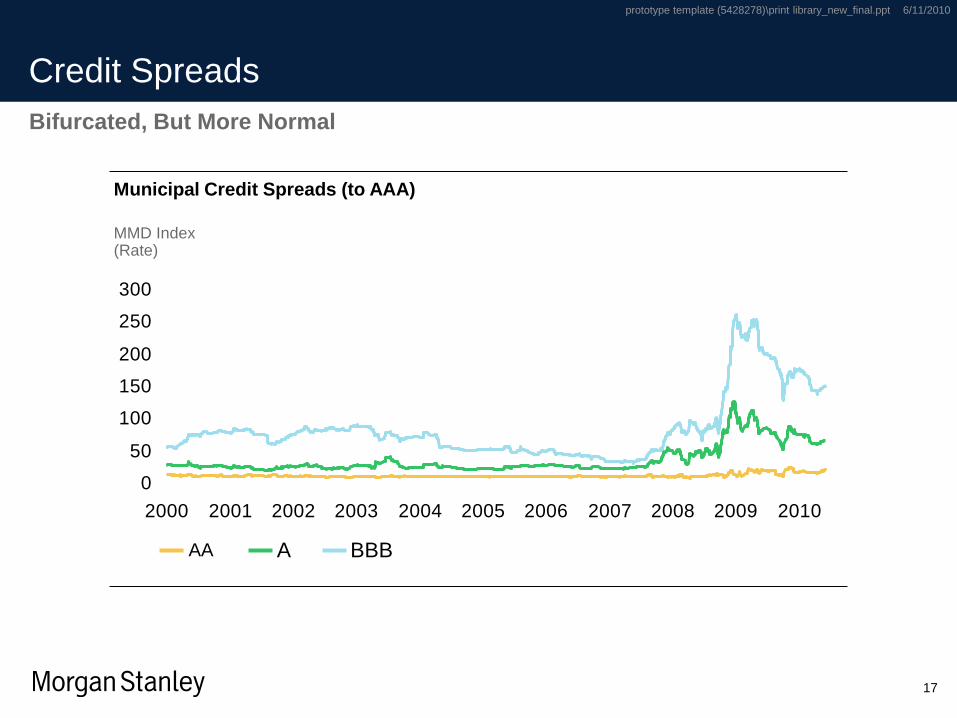
2000 2001 2002 2003 2004 2005 2006 2007 2008 2009 2010
Credit Spreads
AA A
Bifurcated, But More Normal
Municipal Credit Spreads (to AAA)
MMD Index(Rate)
BBB
prototype template (5428278)\print library_new_final.ppt 6/11/2010
18
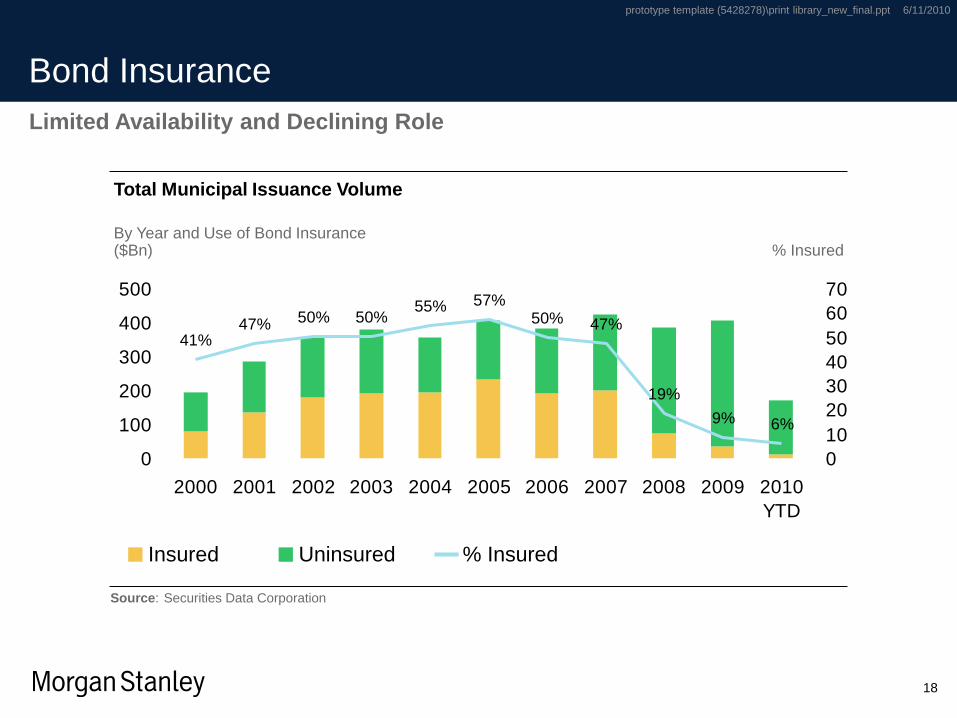
41%47% 50% 50%
55% 57%50% 47%
19%
9% 6%
0
100
200
300
400
500
2000 2001 2002 2003 2004 2005 2006 2007 2008 2009 2010
YTD
0
10
20
30
40
50
60
70
Bond Insurance
Limited Availability and Declining Role
Total Municipal Issuance Volume
By Year and Use of Bond Insurance($Bn) % Insured
% InsuredInsured Uninsured
Source: Securities Data Corporation
prototype template (5428278)\print library_new_final.ppt 6/11/2010
19
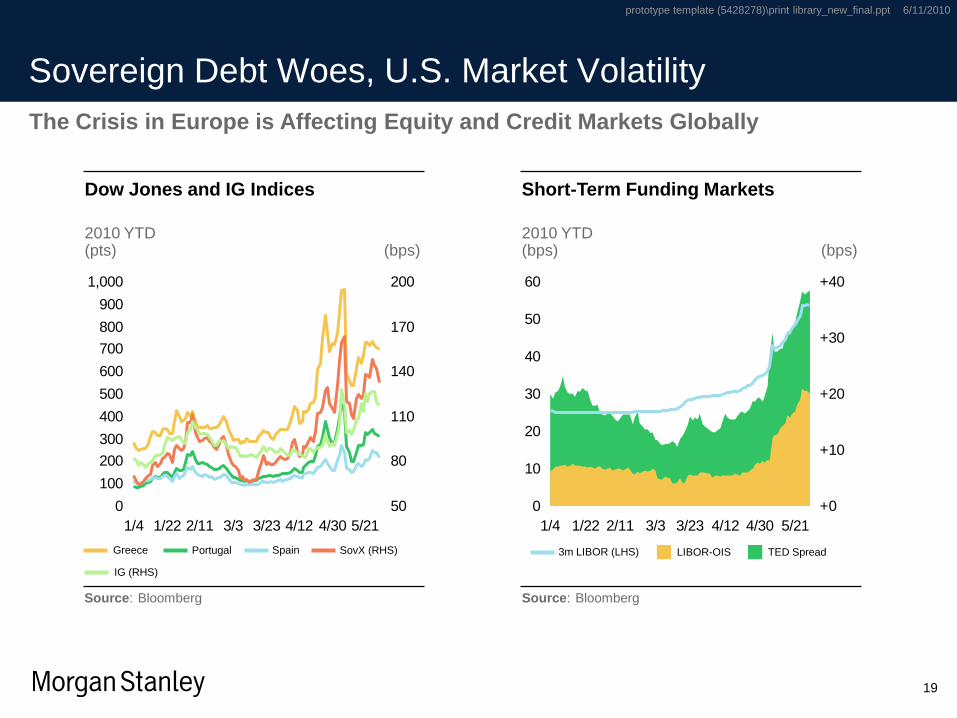
Sovereign Debt Woes, U.S. Market Volatility
0
100
200
300
400
500
600
700
800
900
1,000
1/4 1/22 2/11 3/3 3/23 4/12 4/30 5/21
50
80
110
140
170
200
Dow Jones and IG Indices
2010 YTD(pts) (bps)
The Crisis in Europe is Affecting Equity and Credit Markets Globally
0
10
20
30
40
50
60
1/4 1/22 2/11 3/3 3/23 4/12 4/30 5/21
+0
+10
+20
+30
+40
Short-Term Funding Markets
2010 YTD(bps) (bps)
Source: Bloomberg Source: Bloomberg
Greece
IG (RHS)
Portugal Spain SovX (RHS) 3m LIBOR (LHS) LIBOR-OIS TED Spread
prototype template (5428278)\print library_new_final.ppt 6/11/2010
20
Sovereign Debt Risk is Not New
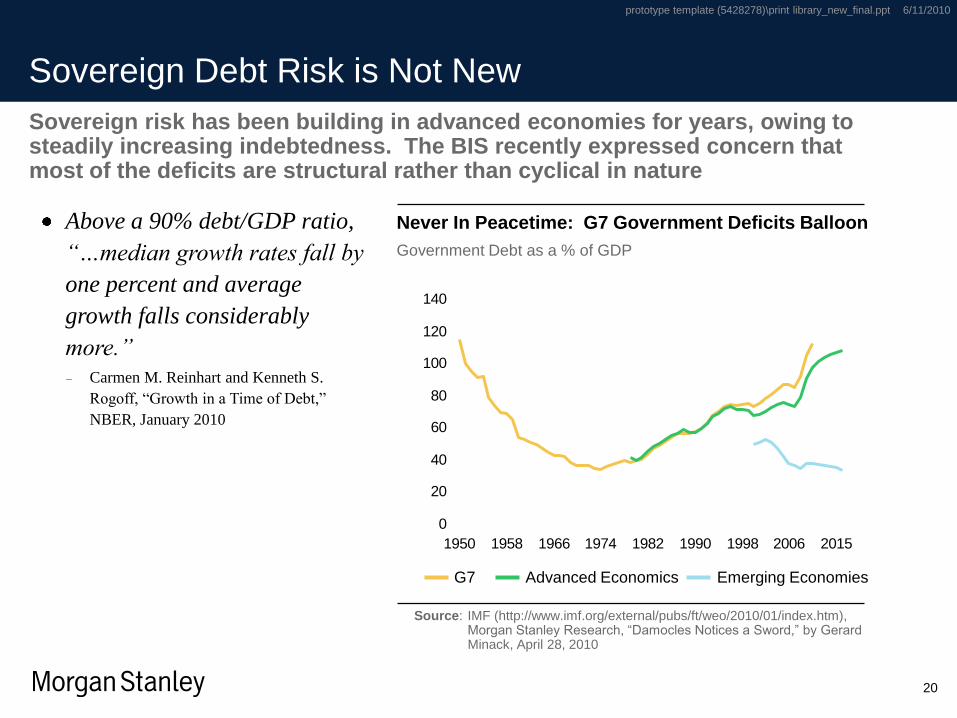
Sovereign risk has been building in advanced economies for years, owing to steadily increasing indebtedness. The BIS recently expressed concern that most of the deficits are structural rather than cyclical in nature
0
20
40
60
80
100
120
140
1950 1958 1966 1974 1982 1990 1998 2006 2015
Never In Peacetime: G7 Government Deficits Balloon
Government Debt as a % of GDP
Source: IMF (http://www.imf.org/external/pubs/ft/weo/2010/01/index.htm), Morgan Stanley Research, “Damocles Notices a Sword,” by Gerard Minack, April 28, 2010
G7 Advanced Economics
Above a 90% debt/GDP ratio,
“…median growth rates fall by
one percent and average
growth falls considerably
more.”
Carmen M. Reinhart and Kenneth S.
Rogoff, “Growth in a Time of Debt,”
NBER, January 2010
Emerging Economies
prototype template (5428278)\print library_new_final.ppt 6/11/2010
21
Sovereign Debt Risk is Not New (cont’d)
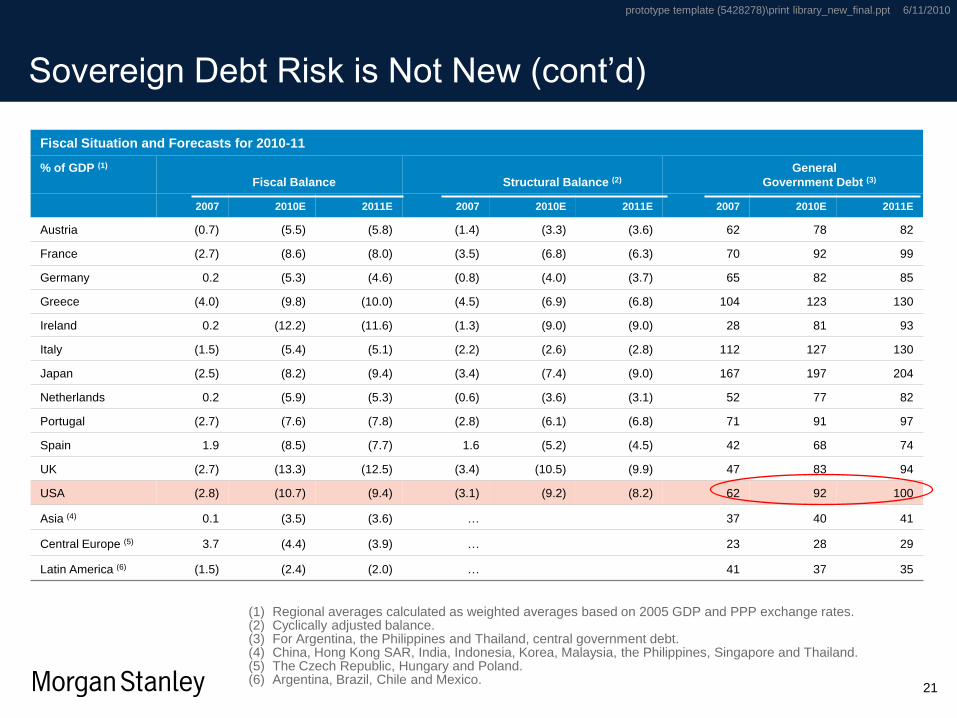
(1) Regional averages calculated as weighted averages based on 2005 GDP and PPP exchange rates.(2) Cyclically adjusted balance.(3) For Argentina, the Philippines and Thailand, central government debt.(4) China, Hong Kong SAR, India, Indonesia, Korea, Malaysia, the Philippines, Singapore and Thailand.(5) The Czech Republic, Hungary and Poland.(6) Argentina, Brazil, Chile and Mexico.
Fiscal Situation and Forecasts for 2010-11
% of GDP (1)
Fiscal Balance Structural Balance (2)
General
Government Debt (3)
2007 2010E 2011E 2007 2010E 2011E 2007 2010E 2011E
Austria (0.7) (5.5) (5.8) (1.4) (3.3) (3.6) 62 78 82
France (2.7) (8.6) (8.0) (3.5) (6.8) (6.3) 70 92 99
Germany 0.2 (5.3) (4.6) (0.8) (4.0) (3.7) 65 82 85
Greece (4.0) (9.8) (10.0) (4.5) (6.9) (6.8) 104 123 130
Ireland 0.2 (12.2) (11.6) (1.3) (9.0) (9.0) 28 81 93
Italy (1.5) (5.4) (5.1) (2.2) (2.6) (2.8) 112 127 130
Japan (2.5) (8.2) (9.4) (3.4) (7.4) (9.0) 167 197 204
Netherlands 0.2 (5.9) (5.3) (0.6) (3.6) (3.1) 52 77 82
Portugal (2.7) (7.6) (7.8) (2.8) (6.1) (6.8) 71 91 97
Spain 1.9 (8.5) (7.7) 1.6 (5.2) (4.5) 42 68 74
UK (2.7) (13.3) (12.5) (3.4) (10.5) (9.9) 47 83 94
USA (2.8) (10.7) (9.4) (3.1) (9.2) (8.2) 62 92 100
Asia (4) 0.1 (3.5) (3.6) … 37 40 41
Central Europe (5) 3.7 (4.4) (3.9) … 23 28 29
Latin America (6) (1.5) (2.4) (2.0) … 41 37 35
prototype template (5428278)\print library_new_final.ppt 6/11/2010
22
Sovereign Contagion Risk Could Impact US Munis
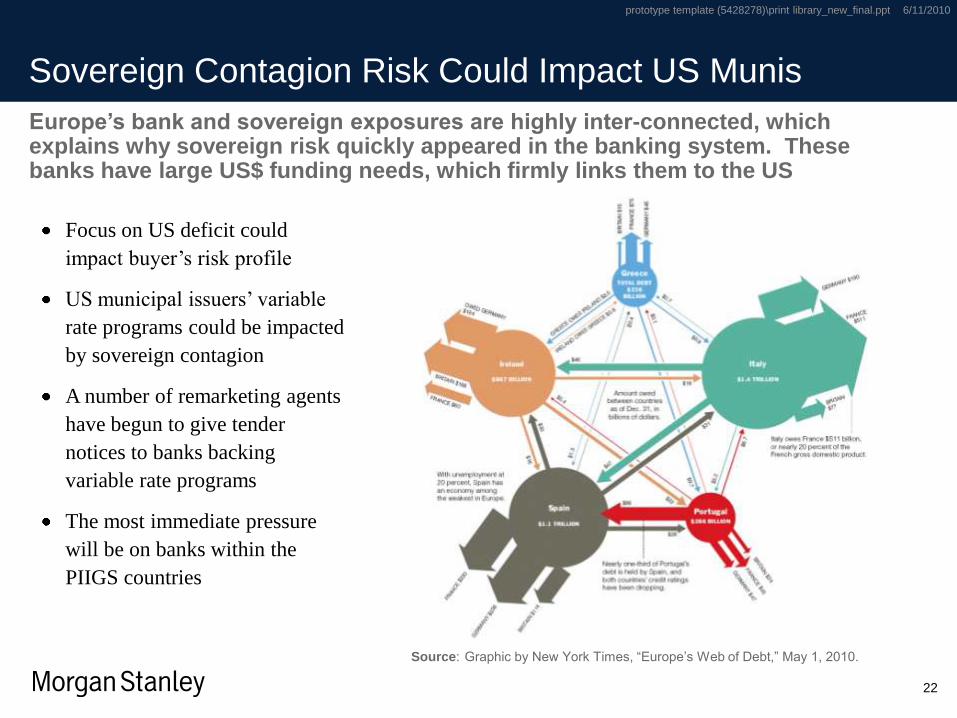
Europe’s bank and sovereign exposures are highly inter-connected, which explains why sovereign risk quickly appeared in the banking system. These banks have large US$ funding needs, which firmly links them to the US
Focus on US deficit could
impact buyer’s risk profile
US municipal issuers’ variable
rate programs could be impacted
by sovereign contagion
A number of remarketing agents
have begun to give tender
notices to banks backing
variable rate programs
The most immediate pressure
will be on banks within the
PIIGS countries
Source: Graphic by New York Times, “Europe’s Web of Debt,” May 1, 2010.
prototype template (5428278)\print library_new_final.ppt 6/11/2010
23
26%
7%
6%
5%
10%
17%
24%
5%
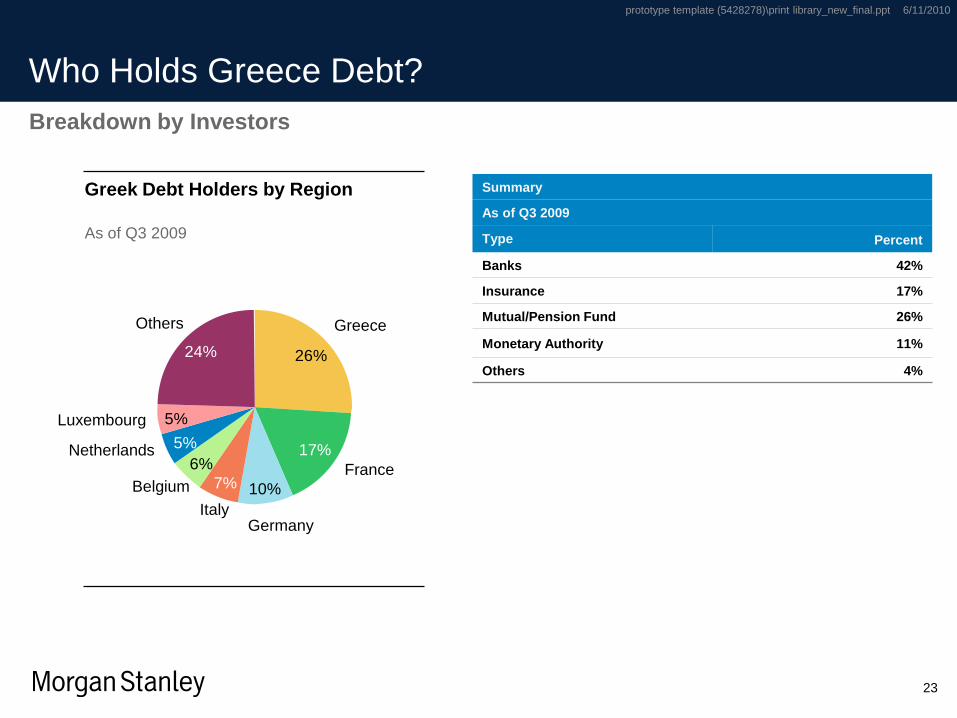
Who Holds Greece Debt?
Greece
GermanyItaly
Belgium
Netherlands
Luxembourg
Others
Greek Debt Holders by Region
As of Q3 2009
Breakdown by Investors
Summary
As of Q3 2009
Type Percent
Banks 42%
Insurance 17%
Mutual/Pension Fund 26%
Monetary Authority 11%
Others 4%
France
prototype template (5428278)\print library_new_final.ppt 6/11/2010
24
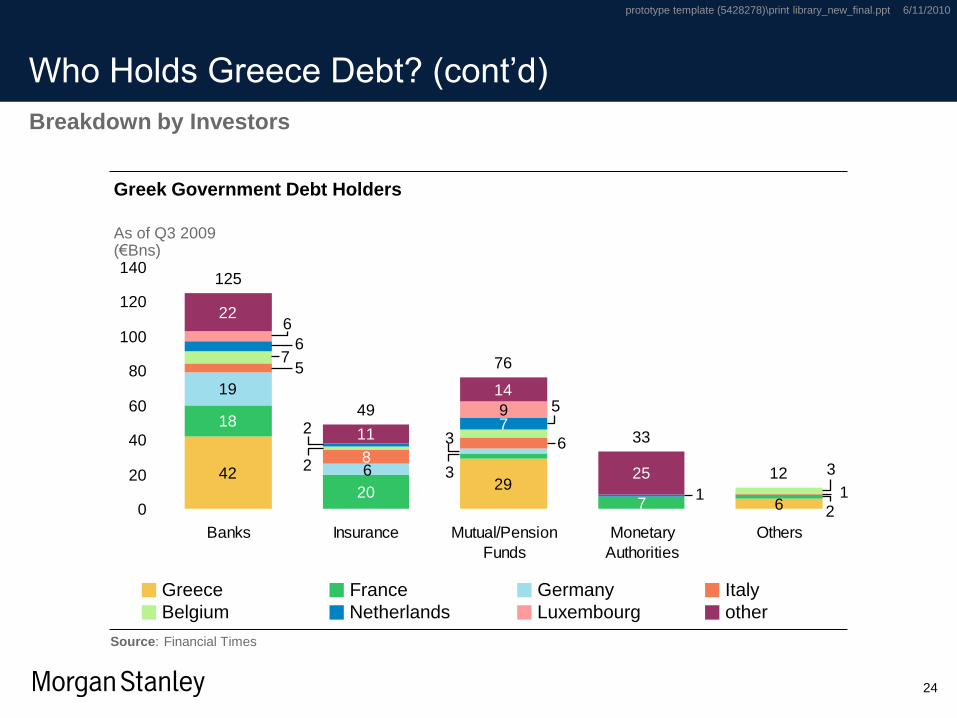
Who Holds Greece Debt? (cont’d)
Breakdown by Investors
4229
6
18
207
19
8
9
22
11
14
25
125
49
76
33
12
2
36
3
1
6
5
32
5
7
2
1
7
6
6
0
20
40
60
80
100
120
140
Banks Insurance Mutual/Pension
Funds
Monetary
Authorities
Others
Greece
Belgium
Germany
Netherlands Luxembourg
Italy
other
France
Greek Government Debt Holders
As of Q3 2009(€Bns)
Source: Financial Times
prototype template (5428278)\print library_new_final.ppt 6/11/2010
25
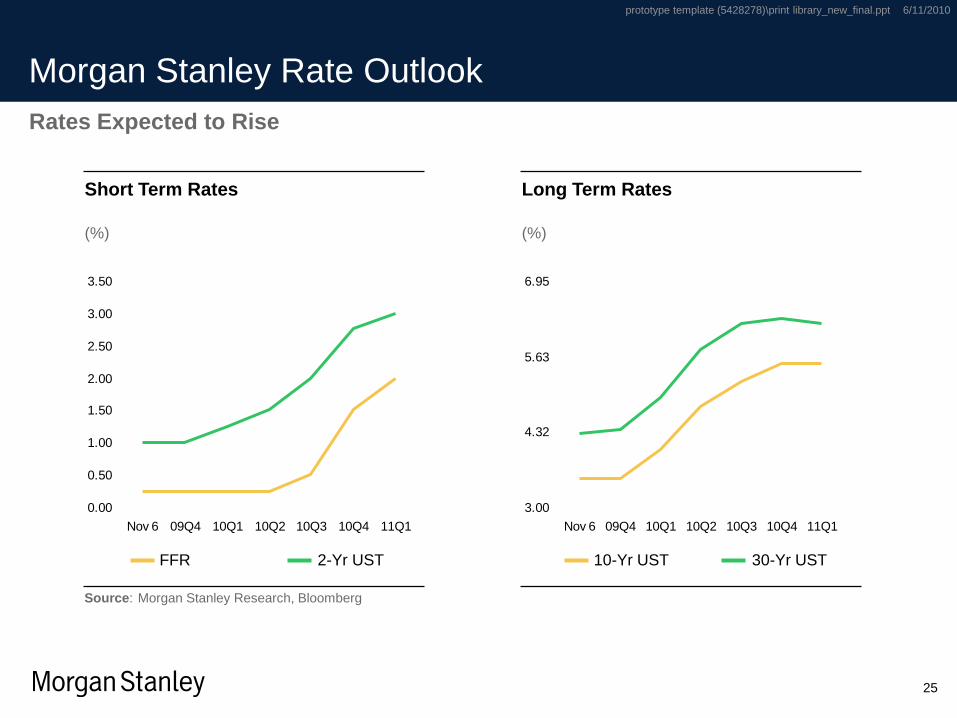
Morgan Stanley Rate Outlook
0.00
0.50
1.00
1.50
2.00
2.50
3.00
3.50
Nov 6 09Q4 10Q1 10Q2 10Q3 10Q4 11Q1
FFR 2-Yr UST
Short Term Rates
(%)
Rates Expected to Rise
3.00
4.32
5.63
6.95
Nov 6 09Q4 10Q1 10Q2 10Q3 10Q4 11Q1
Long Term Rates
(%)
Source: Morgan Stanley Research, Bloomberg
10-Yr UST 30-Yr UST
Seaport Finance Market
prototype template (5428278)\print library_new_final.ppt 6/11/2010
27
24
37 3933
2733
47
3033
37
19
0.0
1.0
2.0
3.0
4.0
5.0
2000 2001 2002 2003 2004 2005 2006 2007 2008 2009 2010
YTD
0
10
20
30
40
50
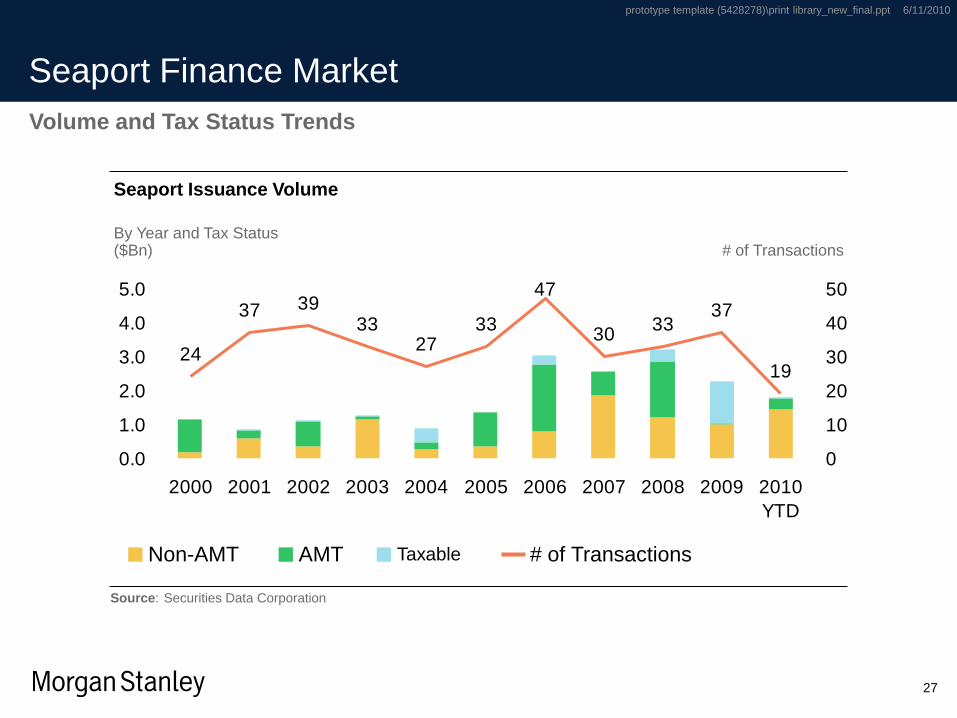
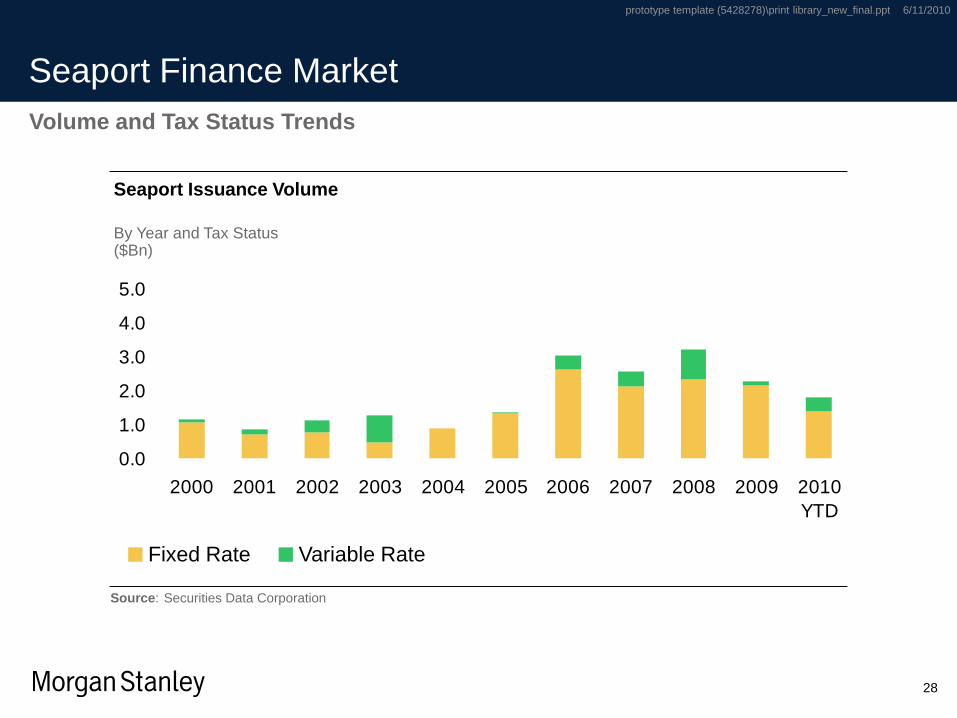
Seaport Finance Market
Volume and Tax Status Trends
Seaport Issuance Volume
By Year and Tax Status($Bn) # of Transactions
# of TransactionsNon-AMT AMT
Source: Securities Data Corporation
Taxable
prototype template (5428278)\print library_new_final.ppt 6/11/2010
28
0.0
1.0
2.0
3.0
4.0
5.0
2000 2001 2002 2003 2004 2005 2006 2007 2008 2009 2010
YTD
Seaport Finance Market
Volume and Tax Status Trends
Seaport Issuance Volume
By Year and Tax Status($Bn)
Fixed Rate Variable Rate
Source: Securities Data Corporation
prototype template (5428278)\print library_new_final.ppt 6/11/2010
29
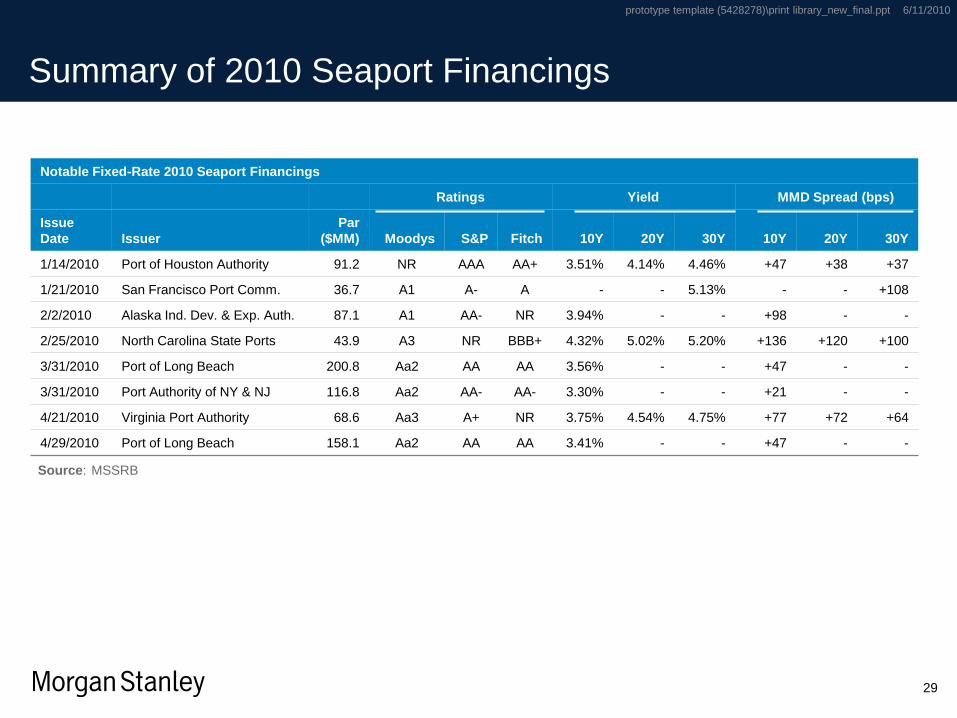
Summary of 2010 Seaport Financings
Notable Fixed-Rate 2010 Seaport Financings
Ratings Yield MMD Spread (bps)
Issue
Date Issuer
Par
($MM) Moodys S&P Fitch 10Y 20Y 30Y 10Y 20Y 30Y
1/14/2010 Port of Houston Authority 91.2 NR AAA AA+ 3.51% 4.14% 4.46% +47 +38 +37
1/21/2010 San Francisco Port Comm. 36.7 A1 A- A - - 5.13% - - +108
2/2/2010 Alaska Ind. Dev. & Exp. Auth. 87.1 A1 AA- NR 3.94% - - +98 - -
2/25/2010 North Carolina State Ports 43.9 A3 NR BBB+ 4.32% 5.02% 5.20% +136 +120 +100
3/31/2010 Port of Long Beach 200.8 Aa2 AA AA 3.56% - - +47 - -
3/31/2010 Port Authority of NY & NJ 116.8 Aa2 AA- AA- 3.30% - - +21 - -
4/21/2010 Virginia Port Authority 68.6 Aa3 A+ NR 3.75% 4.54% 4.75% +77 +72 +64
4/29/2010 Port of Long Beach 158.1 Aa2 AA AA 3.41% - - +47 - -
Source: MSSRB
prototype template (5428278)\print library_new_final.ppt 6/11/2010
30
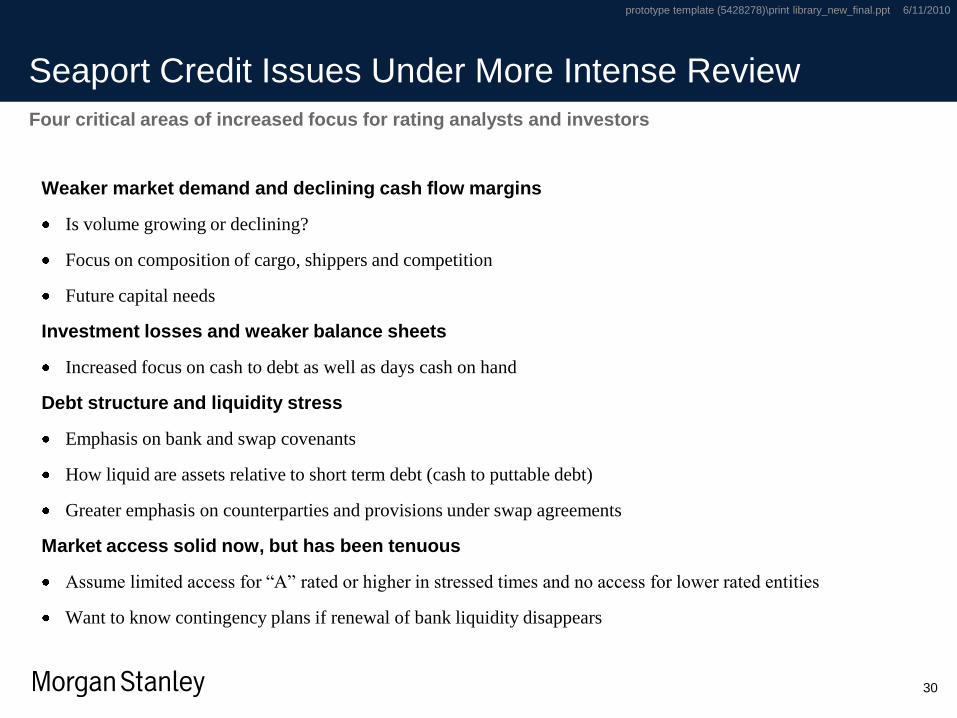
Seaport Credit Issues Under More Intense Review
Weaker market demand and declining cash flow margins
Is volume growing or declining?
Focus on composition of cargo, shippers and competition
Future capital needs
Investment losses and weaker balance sheets
Increased focus on cash to debt as well as days cash on hand
Debt structure and liquidity stress
Emphasis on bank and swap covenants
How liquid are assets relative to short term debt (cash to puttable debt)
Greater emphasis on counterparties and provisions under swap agreements
Market access solid now, but has been tenuous
Assume limited access for “A” rated or higher in stressed times and no access for lower rated entities
Want to know contingency plans if renewal of bank liquidity disappears
Four critical areas of increased focus for rating analysts and investors

Seaport Finance MarketThe New Ways of Marketing and Distribution
prototype template (5428278)\print library_new_final.ppt 6/11/2010
32
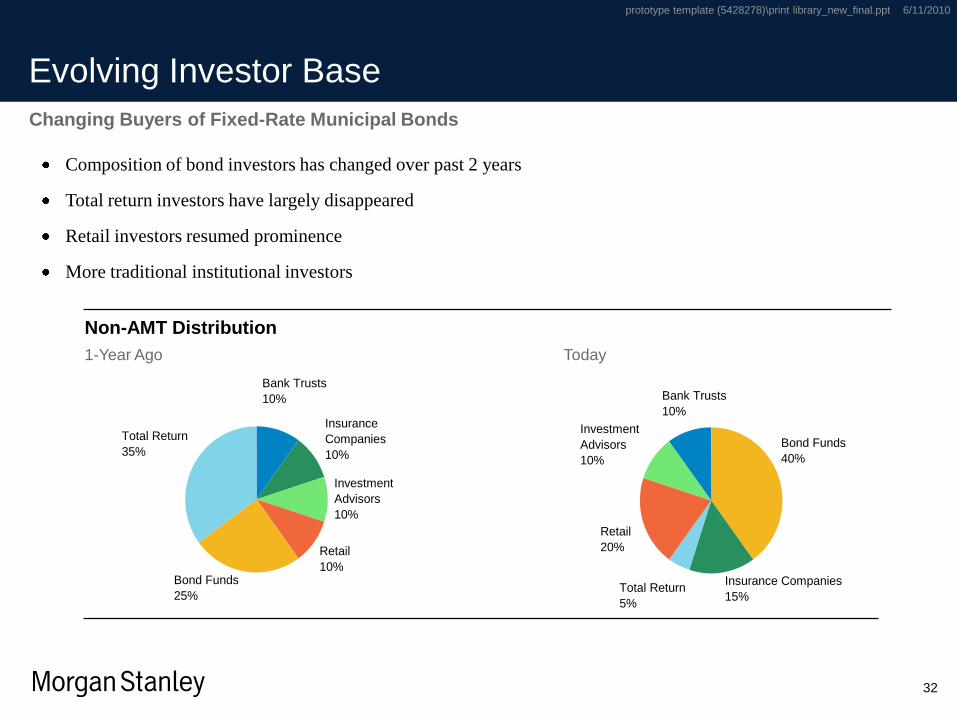
Evolving Investor Base
Retail
10%
Investment
Advisors
10%
Bank Trusts
10%
Insurance
Companies
10%
Bond Funds
25%
Total Return
35%
Non-AMT Distribution
1-Year Ago Today
Bond Funds
40%
Insurance Companies
15%Total Return
5%
Retail
20%
Investment
Advisors
10%
Bank Trusts
10%
Composition of bond investors has changed over past 2 years
Total return investors have largely disappeared
Retail investors resumed prominence
More traditional institutional investors
Changing Buyers of Fixed-Rate Municipal Bonds
prototype template (5428278)\print library_new_final.ppt 6/11/2010
33
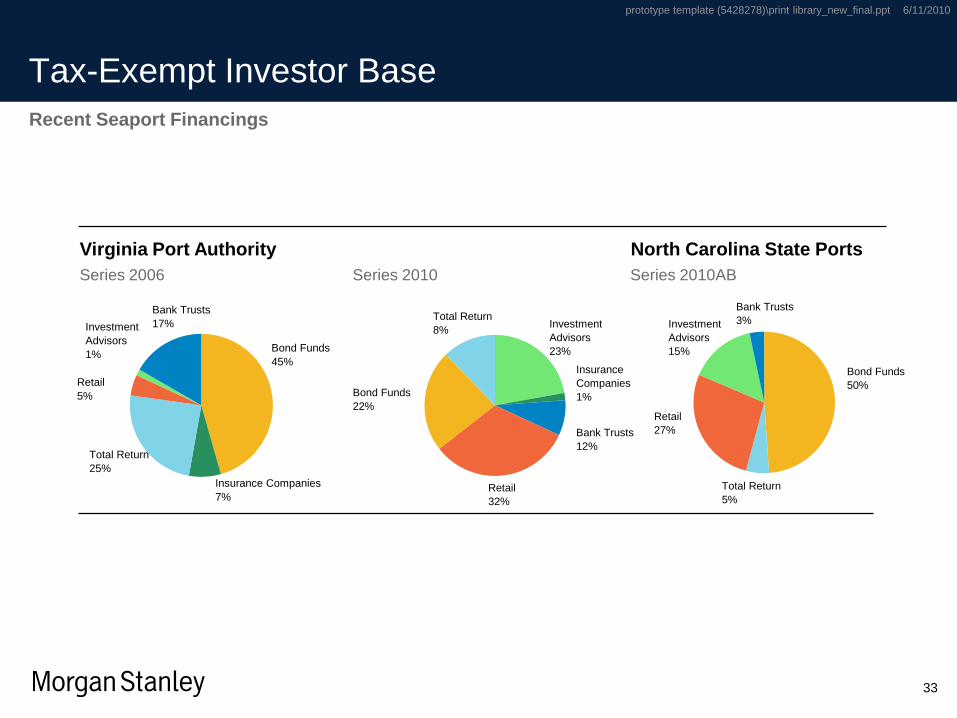
Tax-Exempt Investor Base
Retail
32%
Investment
Advisors
23%
Bank Trusts
12%
Insurance
Companies
1%Bond Funds
22%
Total Return
8%
Virginia Port Authority North Carolina State Ports
Series 2006 Series 2010 Series 2010AB
Bond Funds
45%
Insurance Companies
7%
Total Return
25%
Retail
5%
Investment
Advisors
1%
Bank Trusts
17%
Recent Seaport Financings
Bond Funds
50%
Total Return
5%
Retail
27%
Investment
Advisors
15%
Bank Trusts
3%
prototype template (5428278)\print library_new_final.ppt 6/11/2010
34
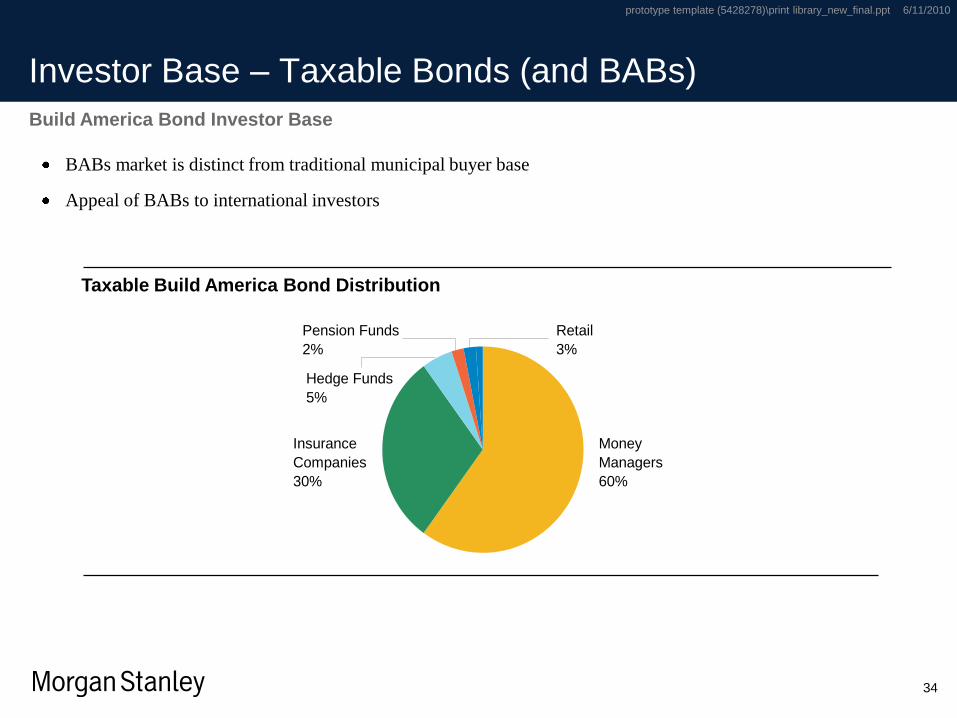
Investor Base – Taxable Bonds (and BABs)
Taxable Build America Bond Distribution
BABs market is distinct from traditional municipal buyer base
Appeal of BABs to international investors
Build America Bond Investor Base
Money
Managers
60%
Insurance
Companies
30%
Hedge Funds
5%
Pension Funds
2%
Retail
3%
prototype template (5428278)\print library_new_final.ppt 6/11/2010
35
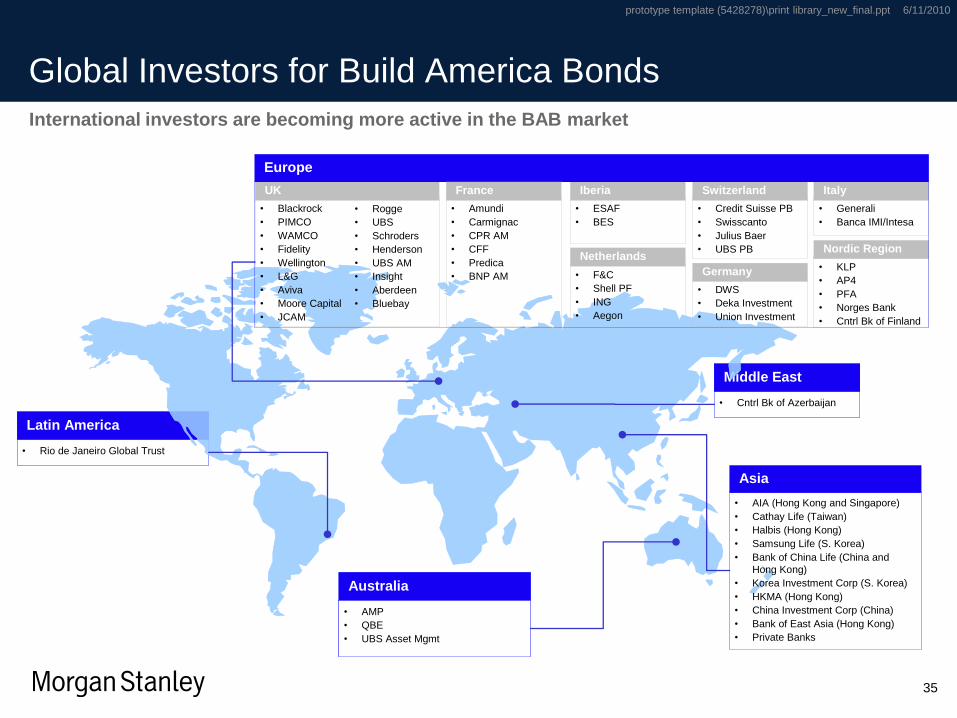
Global Investors for Build America Bonds
International investors are becoming more active in the BAB market
• Cntrl Bk of Azerbaijan
Middle East
• Cntrl Bk of Azerbaijan
Middle East
• Rio de Janeiro Global Trust
Latin America
• Rio de Janeiro Global Trust
Latin America
Asia
• AMP
• QBE
• UBS Asset Mgmt
Australia
• AMP
• QBE
• UBS Asset Mgmt
Australia
UK
• ESAF
• BES
Iberia
Netherlands
• Credit Suisse PB
• Swisscanto
• Julius Baer
• UBS PB
Switzerland
Germany
• Generali
• Banca IMI/Intesa
Italy
• KLP
• AP4
• PFA
• Norges Bank
• Cntrl Bk of Finland
Nordic Region
Europe
• Amundi
• Carmignac
• CPR AM
• CFF
• Predica
• BNP AM
France
• Blackrock
• PIMCO
• WAMCO
• Fidelity
• Wellington
• L&G
• Aviva
• Moore Capital
• JCAM
• Rogge
• UBS
• Schroders
• Henderson
• UBS AM
• Insight
• Aberdeen
• Bluebay
• F&C
• Shell PF
• ING
• Aegon
• DWS
• Deka Investment
• Union Investment
• AIA (Hong Kong and Singapore)
• Cathay Life (Taiwan)
• Halbis (Hong Kong)
• Samsung Life (S. Korea)
• Bank of China Life (China and
Hong Kong)
• Korea Investment Corp (S. Korea)
• HKMA (Hong Kong)
• China Investment Corp (China)
• Bank of East Asia (Hong Kong)
• Private Banks
prototype template (5428278)\print library_new_final.ppt 6/11/2010
36
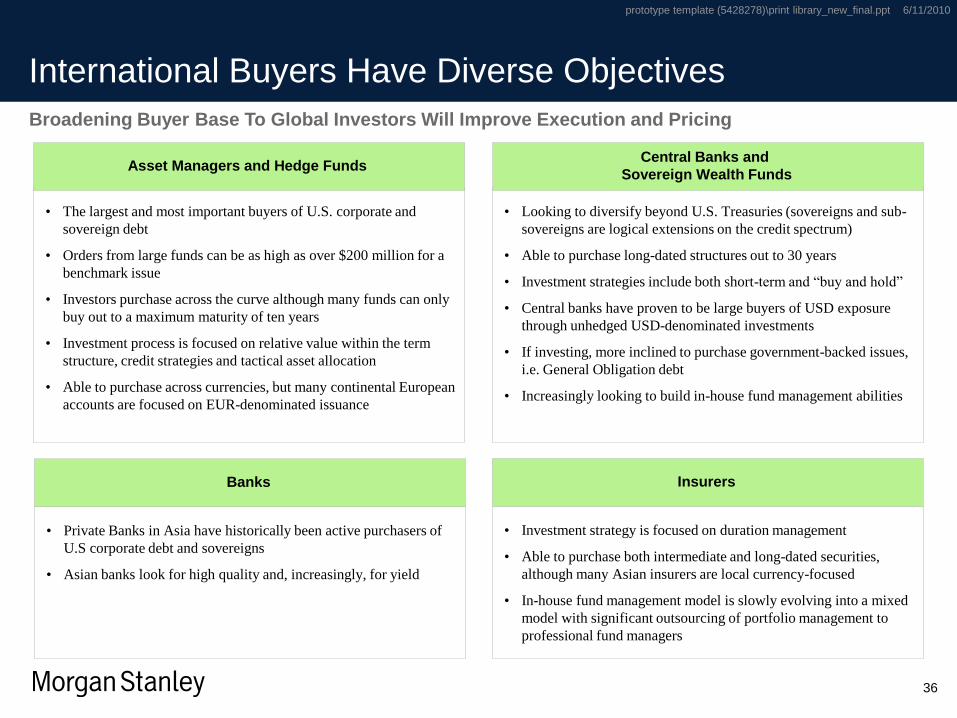
International Buyers Have Diverse Objectives
Broadening Buyer Base To Global Investors Will Improve Execution and Pricing
• The largest and most important buyers of U.S. corporate and
sovereign debt
• Orders from large funds can be as high as over $200 million for a
benchmark issue
• Investors purchase across the curve although many funds can only
buy out to a maximum maturity of ten years
• Investment process is focused on relative value within the term
structure, credit strategies and tactical asset allocation
• Able to purchase across currencies, but many continental European
accounts are focused on EUR-denominated issuance
• Looking to diversify beyond U.S. Treasuries (sovereigns and sub-
sovereigns are logical extensions on the credit spectrum)
• Able to purchase long-dated structures out to 30 years
• Investment strategies include both short-term and “buy and hold”
• Central banks have proven to be large buyers of USD exposure
through unhedged USD-denominated investments
• If investing, more inclined to purchase government-backed issues,
i.e. General Obligation debt
• Increasingly looking to build in-house fund management abilities
• Private Banks in Asia have historically been active purchasers of
U.S corporate debt and sovereigns
• Asian banks look for high quality and, increasingly, for yield
• Investment strategy is focused on duration management
• Able to purchase both intermediate and long-dated securities,
although many Asian insurers are local currency-focused
• In-house fund management model is slowly evolving into a mixed
model with significant outsourcing of portfolio management to
professional fund managers
Asset Managers and Hedge FundsCentral Banks and
Sovereign Wealth Funds
Banks Insurers
prototype template (5428278)\print library_new_final.ppt 6/11/2010
37
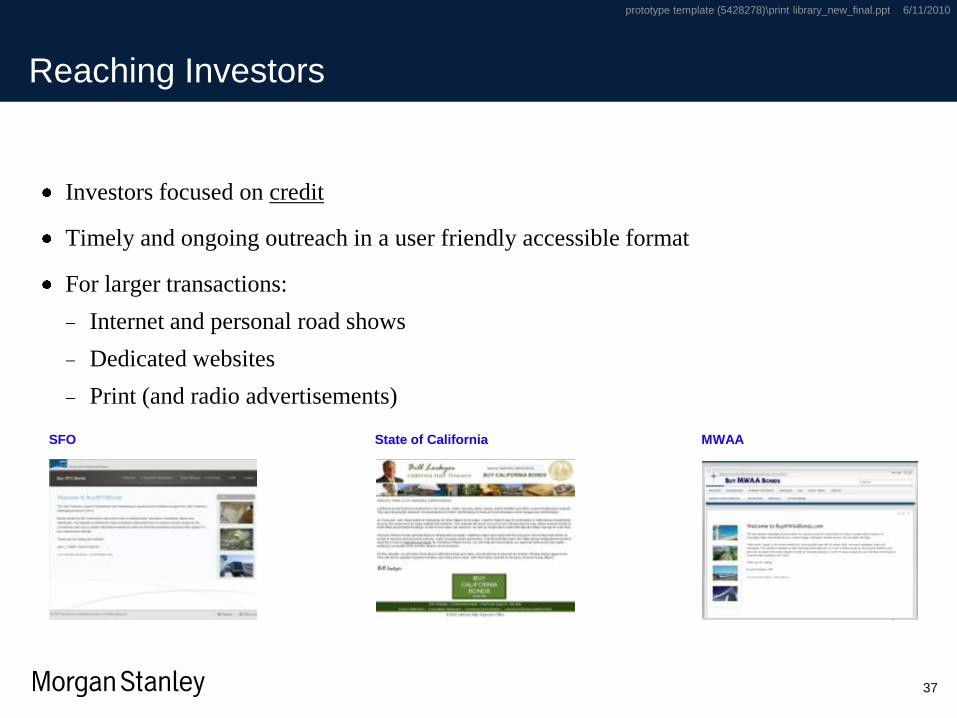
Reaching Investors
Investors focused on credit
Timely and ongoing outreach in a user friendly accessible format
For larger transactions:
Internet and personal road shows
Dedicated websites
Print (and radio advertisements)
SFO MWAAState of California

Seaport Finance MarketARRA and Legislative Developments
prototype template (5428278)\print library_new_final.ppt 6/11/2010
39
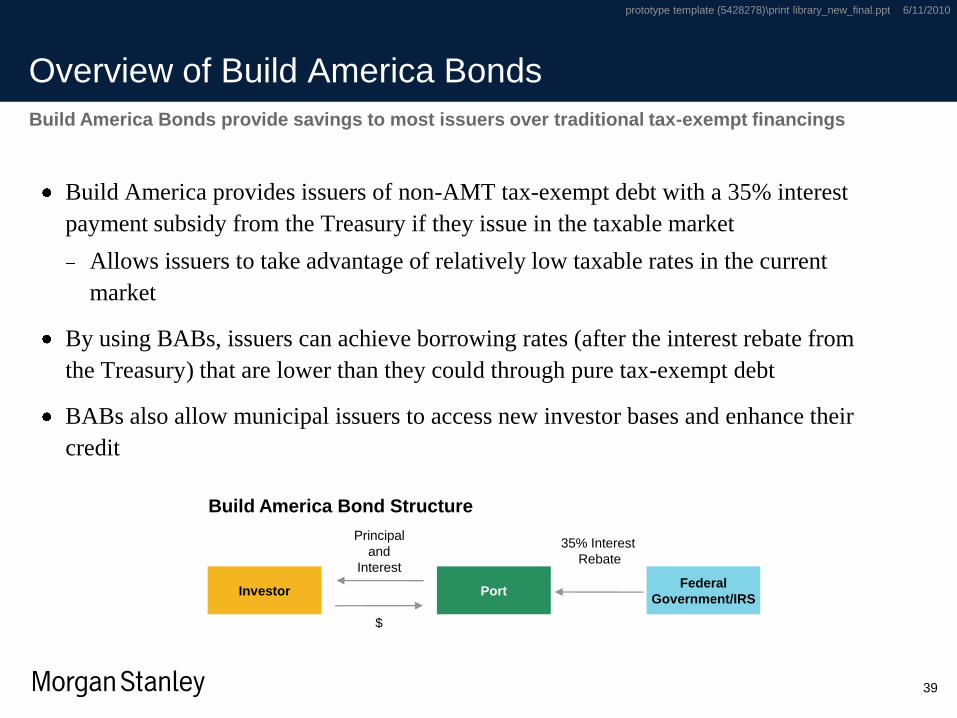
Overview of Build America Bonds
Build America provides issuers of non-AMT tax-exempt debt with a 35% interest
payment subsidy from the Treasury if they issue in the taxable market
Allows issuers to take advantage of relatively low taxable rates in the current
market
By using BABs, issuers can achieve borrowing rates (after the interest rebate from
the Treasury) that are lower than they could through pure tax-exempt debt
BABs also allow municipal issuers to access new investor bases and enhance their
credit
Build America Bonds provide savings to most issuers over traditional tax-exempt financings
Build America Bond Structure
Investor PortFederal
Government/IRS
$
35% Interest
Rebate
Principal
and
Interest

prototype template (5428278)\print library_new_final.ppt 6/11/2010
40
Terms and Conditions
Build America Taxable Bonds Program
Applicable Period:These provisions only apply to bonds issued before January 1, 2011, but apply
for the life of the bond.
Tax Status:Interest paid on the bonds would be included in gross income for federal
income tax purposes.
Qualified Issuers:Only issuers that meet the standards of Section 1.103 of the Internal Revenue
Code can issue the bonds.
Eligible Projects:100% of the project proceeds from the bond issue must be used for capital
expenditures that meet certain specifications in Section 54A.
Payment of Credit:
The Secretary of the Treasury would direct the federal government to pay 35%
of the interest payable under the bond issue on each payment date, thereby
lowering the costs on the original issuance.
Arbitrage:All arbitrage rules apply; the arbitrage yield is calculated net of the government
payment to the issuer.
Due to program constraints, limited applicability for ports
prototype template (5428278)\print library_new_final.ppt 6/11/2010
41
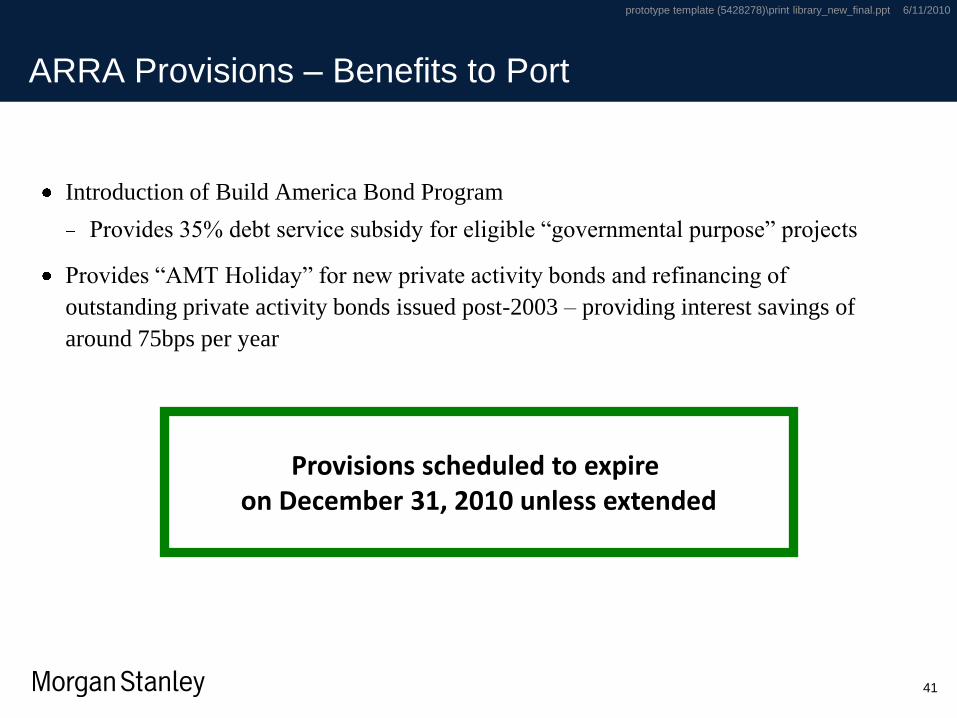
ARRA Provisions – Benefits to Port
Introduction of Build America Bond Program
Provides 35% debt service subsidy for eligible “governmental purpose” projects
Provides “AMT Holiday” for new private activity bonds and refinancing of
outstanding private activity bonds issued post-2003 – providing interest savings of
around 75bps per year
Provisions scheduled to expire on December 31, 2010 unless extended

prototype template (5428278)\print library_new_final.ppt 6/11/2010
42
ARRA Provisions – Current Legislative Status
Current bills under consideration by the House and Senate would:
BABs:
Extend BABs for 2 years
Drop subsidy to 32% and eventually 30%
Allow current refunding of BABs
AMT Holiday:
Extend holiday through December 31, 2010 for new money and refundings of
bonds issued post December 31, 2003
prototype template (5428278)\print library_new_final.ppt 6/11/2010
43
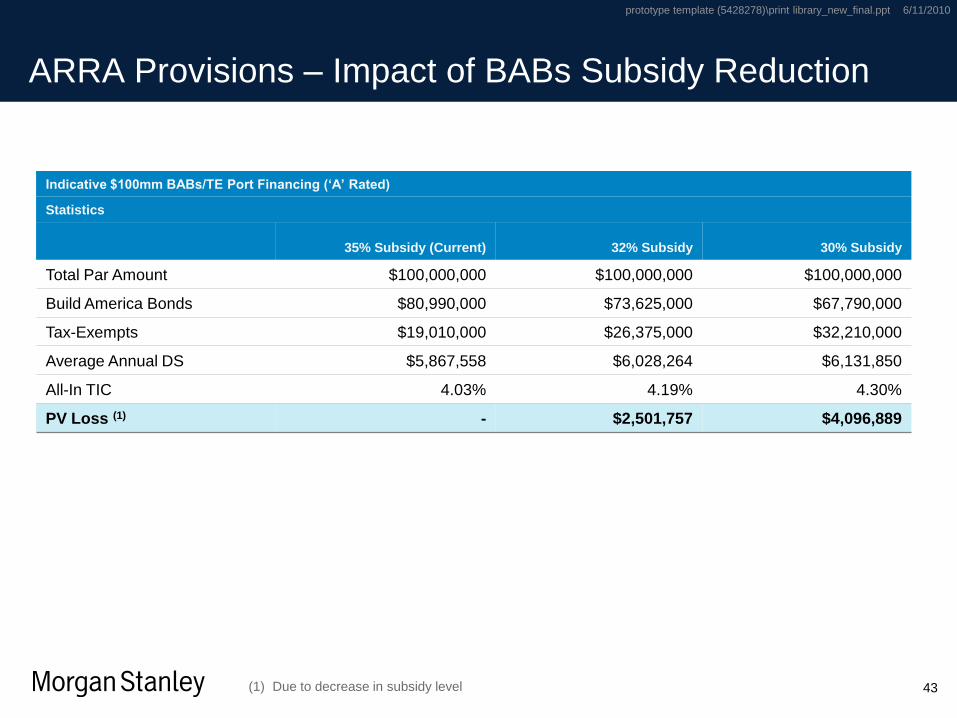
ARRA Provisions – Impact of BABs Subsidy Reduction
(1) Due to decrease in subsidy level
Indicative $100mm BABs/TE Port Financing (‘A’ Rated)
Statistics
35% Subsidy (Current) 32% Subsidy 30% Subsidy
Total Par Amount $100,000,000 $100,000,000 $100,000,000
Build America Bonds $80,990,000 $73,625,000 $67,790,000
Tax-Exempts $19,010,000 $26,375,000 $32,210,000
Average Annual DS $5,867,558 $6,028,264 $6,131,850
All-In TIC 4.03% 4.19% 4.30%
PV Loss (1) - $2,501,757 $4,096,889
prototype template (5428278)\print library_new_final.ppt 6/11/2010
44
Conclusion
Ports will continue to secure funding from the traditional sources
Extension of ARRA provisions provide additional opportunities for capital formation
Differentiating & positioning the port’s credit in a granular way
Maintaining ongoing outreach with investors