Embed Size (px)
Citation preview

Ministry of Environment
Province of British Columbia
Ambient Water Quality Guidelines for
Cadmium
Technical Report
February 2015
Water Protection & Sustainability Branch
Environmental Sustainability and Strategic Policy Division
BC Ministry of Environment

2
Prepared by:
J.A. Sinclair1, A. Schein
1, M.E. Wainwright
1, H.J. Prencipe
1, D.D. MacDonald
1, M.L. Haines
1, and C.
Meays2
1MacDonald Environmental Sciences Ltd.
2Water Protection & Sustainability Branch
Environmental Sustainability and Strategic Policy Division
BC Ministry of Environment
ISBN 978-0-7726-6741-0

3
Acknowledgements
We would like to thank Bruce Carmichael, Jody Fisher, Liz Freyman, Bob Grace,
Stephanie Huska, James Jacklin, Kym Keough, Gabi Matscha, Alison Neufeld, Nicole
Obee, Kara Przeczek, Jolene Ragett, Danny St. Hilaire, Chris Swan, Patrick Williston,
Monique de Jong, Stephanie Strachan, Ayisha Yeow, Shauna Bennett, and Scott Denkers
for providing the data and information on cadmium concentrations in water bodies across
British Columbia. Special thanks to Julia Beatty for facilitating the compilation of
literature to develop the guidelines. Special thanks to Kevin Rieberger, Dr. Carl
Schwartz, Lana Miller, and James Jacklin for their technical and editorial contributions
and to Dr. Gregory Pyle for technical contributions. We would also like to thank the
following external reviewers for their technical and editorial comments on this document:
Ryan Hill, Gary Mann, and Patrick Allard (Azimuth Consulting Group Partnership), Dan
Steinke (Urban Systems Ltd.), Cameco Corporation, Teck Resources Ltd., Gilbert
Larocque (Association of Professional Engineers and Geoscientists of British Columbia),
and Angela Waterman and others at the Mining Association of British Columbia.

4
Table of Contents
Table of Contents .......................................................................................................................4
List of Tables ..............................................................................................................................6
List of Figures ............................................................................................................................7
List of Appendices .....................................................................................................................8
List of Abbreviations .................................................................................................................9
Executive Summary .................................................................................................................10
1.0 Introduction ......................................................................................................................13
2.0 Physical and Chemical Properties of Cadmium ...........................................................17
3.0 Analysis of Cadmium in Environmental Samples ........................................................18
4.0 Environmental Concentrations of Cadmium in British Columbia Waters ................20
4.1 Methods for Estimating Background Concentrations of Cadmium in British
Columbia ................................................................................................................20
4.2 Background Levels of Cadmium in British Columbia ..........................................22
4.2.1 Vancouver Island ......................................................................................22
4.2.2 Lower Mainland .......................................................................................25
4.2.3 Thompson-Okanagan ...............................................................................26
4.2.4 Kootenay ..................................................................................................26
4.2.5 Cariboo .....................................................................................................27
4.2.6 Skeena ......................................................................................................27
4.2.7 Omineca-Peace .........................................................................................28
4.2.8 Summary ..................................................................................................28
5.0 Environmental Fate and Transport ...............................................................................28
6.0 Bioaccumulation and Bioconcentration of Cadmium in the Aquatic Environment..30
7.0 Toxicity of Cadmium to Freshwater Aquatic Organisms ............................................37
7.1 Mode of Toxicity ...................................................................................................37
7.2 Toxicity to Algae and Aquatic Plants ....................................................................38
7.3 Toxicity to Aquatic Invertebrates ...........................................................................39
7.3.1 Short-Term Toxicity to Aquatic Invertebrates .........................................39
7.3.2 Long-Term Toxicity to Aquatic Invertebrates .........................................41
7.4 Toxicity to Fish .....................................................................................................43
7.4.1 Short-Term Toxicity to Fish .....................................................................43
7.4.2 Long-Term Toxicity to Fish .....................................................................44

5
7.5 Toxicity to Amphibians .........................................................................................46
7.6 Factors Affecting the Bioavailability and Toxicity of Cadmium ..........................46
7.6.1 Hardness and Alkalinity ...........................................................................47
7.6.2 pH .............................................................................................................49
7.6.3 Dissolved Organic Matter ........................................................................51
7.6.4 Temperature ..............................................................................................53
7.6.5 Acclimation ..............................................................................................55
7.6.6 Biotic Ligand Model for Cadmium ..........................................................57
8.0 Water Quality Guidelines from Other Jurisdictions ....................................................57
8.1 Canadian Council of Ministers of the Environment Water Quality Guidelines ...58
8.2 Provincial Water Quality Guidelines ....................................................................59
8.3 United States Environmental Protection Agency Water Quality Criteria .............60
8.4 Other Water Quality Guidelines .............................................................................60
9.0 Derivation of Water Quality Guidelines for Cadmium in British Columbia .............62
9.1 Acquisition of Toxicological Data for Cadmium ..................................................62
9.2 Evaluation and Classification of Toxicological Data ............................................63
9.3 Normalization of the Toxicological Data to a Standard Hardness ........................65
9.3.1 Data Evaluation ........................................................................................65
9.3.2 Development of the Relationship between Short-Term Toxicity and
Water Hardness ........................................................................................66
9.3.3 Development of the Relationship between Long-Term Toxicity and
Water Hardness ........................................................................................71
9.3.4 Evaluation of Developed Relationships for Normalizing Toxicity to a
Standard Hardness ....................................................................................74
9.4 Derivation of Water Quality Guidelines ...............................................................76
9.4.1 Short-Term Maximum Water Quality Guidelines ....................................77
9.4.2 Long-Term Average Water Quality Guidelines .......................................82
9.4.3 Evaluation of Uncertainty in the Water Quality Guidelines for
Cadmium ..................................................................................................87
9.4.4 Application of Water Quality Guidelines for Cadmium ..........................90
9.4.5 Research and Development Needs ...........................................................91
10.0 References Cited ..............................................................................................................93
6
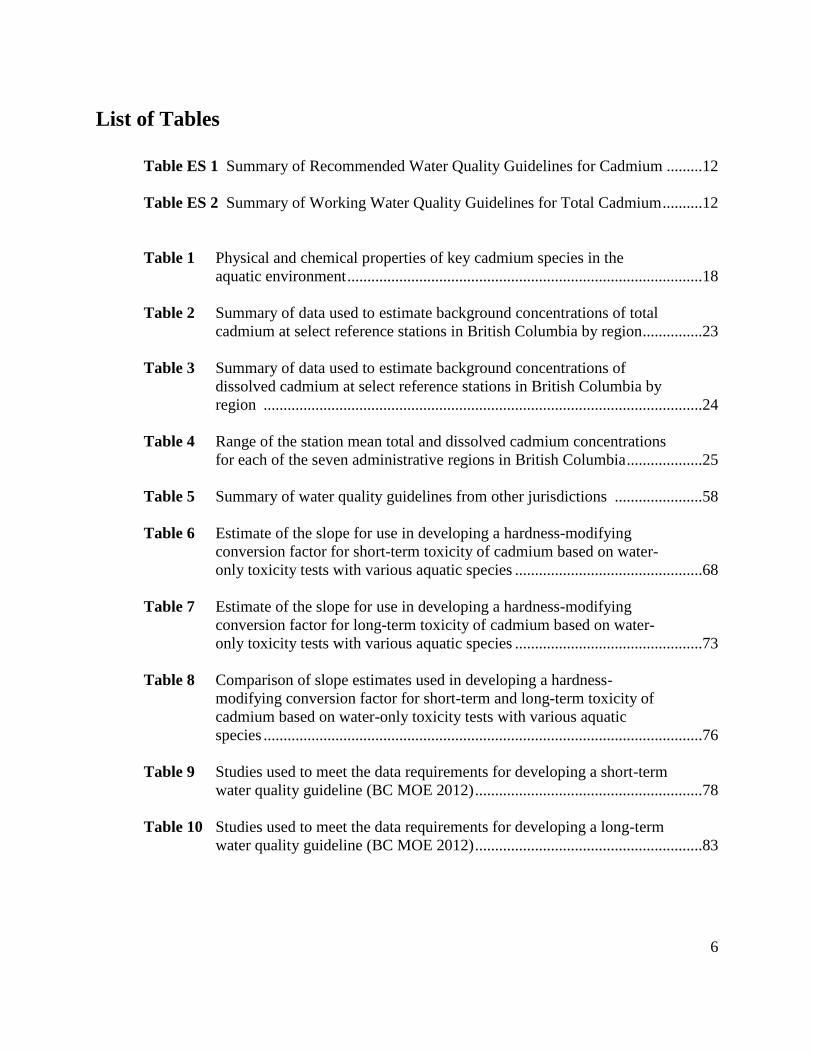
List of Tables
Table ES 1 Summary of Recommended Water Quality Guidelines for Cadmium .........12
Table ES 2 Summary of Working Water Quality Guidelines for Total Cadmium ..........12
Table 1 Physical and chemical properties of key cadmium species in the
aquatic environment .........................................................................................18
Table 2 Summary of data used to estimate background concentrations of total
cadmium at select reference stations in British Columbia by region ...............23
Table 3 Summary of data used to estimate background concentrations of
dissolved cadmium at select reference stations in British Columbia by
region ..............................................................................................................24
Table 4 Range of the station mean total and dissolved cadmium concentrations
for each of the seven administrative regions in British Columbia ...................25
Table 5 Summary of water quality guidelines from other jurisdictions ......................58
Table 6 Estimate of the slope for use in developing a hardness-modifying
conversion factor for short-term toxicity of cadmium based on water-
only toxicity tests with various aquatic species ...............................................68
Table 7 Estimate of the slope for use in developing a hardness-modifying
conversion factor for long-term toxicity of cadmium based on water-
only toxicity tests with various aquatic species ...............................................73
Table 8 Comparison of slope estimates used in developing a hardness-
modifying conversion factor for short-term and long-term toxicity of
cadmium based on water-only toxicity tests with various aquatic
species ..............................................................................................................76
Table 9 Studies used to meet the data requirements for developing a short-term
water quality guideline (BC MOE 2012) .........................................................78
Table 10 Studies used to meet the data requirements for developing a long-term
water quality guideline (BC MOE 2012) .........................................................83

7
List of Figures
Figure 1 Locations of reference sites used to estimate background
concentrations of cadmium in B.C. waters ......................................................21
Figure 2 Relationship between short-term toxicity of cadmium and ambient
water hardness in water-only toxicity tests with various aquatic species ........69
Figure 3 Validation analysis of the relationship between short-term toxicity of
cadmium and ambient water hardness in individual water-only toxicity
tests with various aquatic species ....................................................................70
Figure 4 Relationship between long-term toxicity of cadmium and ambient
water hardness in water-only toxicity tests with various aquatic species ........72
Figure 5 Validation analysis of the relationship between long-term toxicity of
cadmium and ambient water hardness in individual water-only toxicity
tests with various aquatic species ....................................................................75
Figure 6 Distribution of LC50/EC50 values from the primary and secondary
studies used to determine the short-term toxicity of cadmium in
freshwater environments ..................................................................................79
Figure 7 Distribution of responses from water-only toxicity tests classified as
primary and secondary studies relative to the short-term maximum
guideline for cadmium .....................................................................................82
Figure 8 Distribution of low-effects threshold values from the primary and
secondary studies used to determine the long-term toxicity of cadmium
in freshwater environments ..............................................................................84
Figure 9 Distribution of responses from water-only toxicity tests classified as
primary and secondary studies relative to the long-term average
guideline for cadmium .....................................................................................86

8
List of Appendices
Appendix 1 Water Quality Data from Reference Sites in British Columbia
Table A1.1 Relevant water quality data collected from reference sites
used in the estimation of background cadmium
concentrations in B.C. waters
Appendix 2 Summary of Studies Evaluated to Support Water Quality Guideline
Derivation
Table A2.1 Summary of primary and secondary data from short-term
cadmium toxicity tests.
Table A2.2 Summary of primary and secondary data from long-term
cadmium toxicity tests.
Table A2.3 List of studies identified as unacceptable for the derivation
of a water quality guideline for cadmium.
Table A2.4 Summary of data used to determine the relationship
between the short-term toxicity of cadmium and ambient
water hardness.
Table A2.5 Summary of data used to determine the relationship
between the long-term toxicity of cadmium and ambient
water hardness.
Table A2.6 Observed effect values (based on the most sensitive
endpoint) in long-term toxicity tests from primary and
secondary studies used to derive a water quality guideline
for cadmium.
9
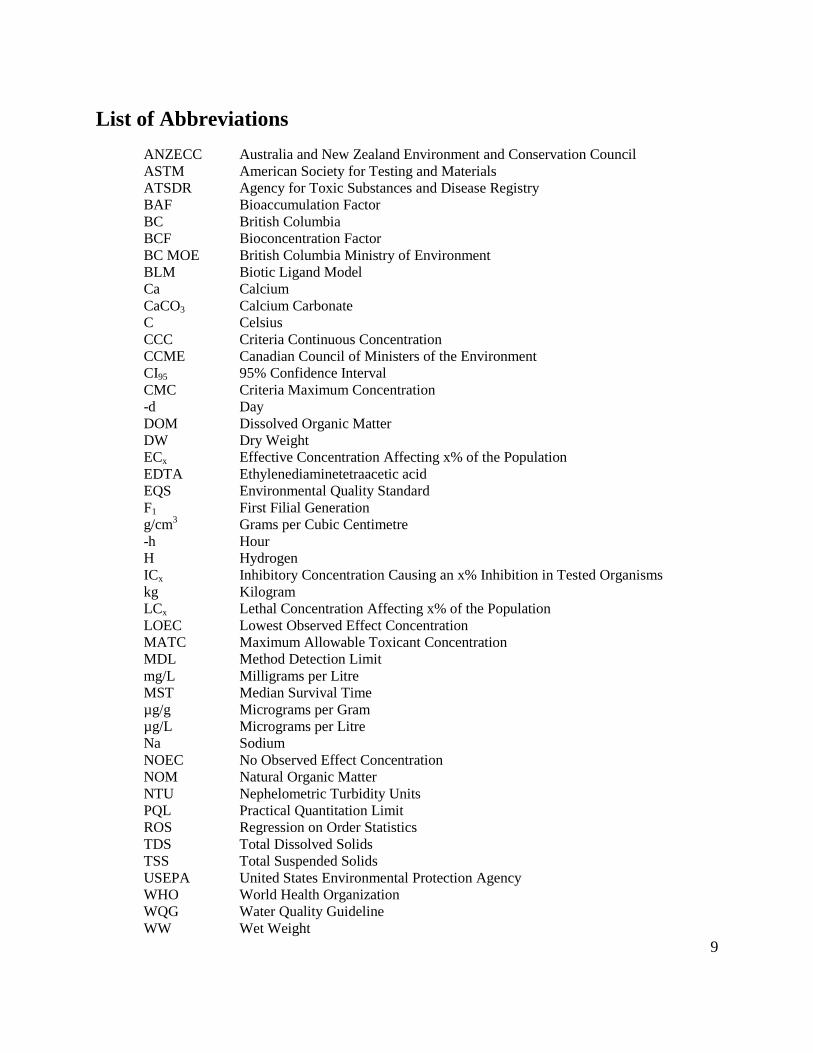
List of Abbreviations
ANZECC Australia and New Zealand Environment and Conservation Council
ASTM American Society for Testing and Materials
ATSDR Agency for Toxic Substances and Disease Registry
BAF Bioaccumulation Factor
BC British Columbia
BCF Bioconcentration Factor
BC MOE British Columbia Ministry of Environment
BLM Biotic Ligand Model
Ca Calcium
CaCO3 Calcium Carbonate
C Celsius
CCC Criteria Continuous Concentration
CCME Canadian Council of Ministers of the Environment
CI95 95% Confidence Interval
CMC Criteria Maximum Concentration
-d Day
DOM Dissolved Organic Matter
DW Dry Weight
ECx Effective Concentration Affecting x% of the Population
EDTA Ethylenediaminetetraacetic acid
EQS Environmental Quality Standard
F1 First Filial Generation
g/cm3 Grams per Cubic Centimetre
-h Hour
H Hydrogen
ICx Inhibitory Concentration Causing an x% Inhibition in Tested Organisms
kg Kilogram
LCx Lethal Concentration Affecting x% of the Population
LOEC Lowest Observed Effect Concentration
MATC Maximum Allowable Toxicant Concentration
MDL Method Detection Limit
mg/L Milligrams per Litre
MST Median Survival Time
µg/g Micrograms per Gram
µg/L Micrograms per Litre
Na Sodium
NOEC No Observed Effect Concentration
NOM Natural Organic Matter
NTU Nephelometric Turbidity Units
PQL Practical Quantitation Limit
ROS Regression on Order Statistics
TDS Total Dissolved Solids
TSS Total Suspended Solids
USEPA United States Environmental Protection Agency
WHO World Health Organization
WQG Water Quality Guideline
WW Wet Weight

10
Executive Summary
Cadmium (Cd) has been identified as a metal of major importance by multiple agencies
because of its toxicity to humans and wildlife. In aquatic ecosystems, Cd interferes with
the uptake of calcium by organisms, resulting in cellular damage, decreases in metabolic
activity, and adverse effects on osmoregulation. There is also evidence of Cd
bioaccumulation through ingestion of contaminated prey. The results of Cd toxicity on
freshwater aquatic organisms include increased mortality, decreased growth, and
decreased reproductive capacity and success.
Cd enters aquatic ecosystems through natural processes, such as the weathering of
minerals and forest fires, or through human activities such as mining and other land-use
activities. Cd concentrations in natural (i.e., unimpacted) surface waters and groundwater
are generally less than 1 µg/L Cd; however, some areas may contain naturally elevated
cadmium levels due to the geological composition of the area. In BC, Cd concentrations
are generally lower in southern regions compared to central and northern regions.
The British Columbia Ministry of Environment (BC MOE) develops ambient water
quality guidelines (WQGs) to assess and manage the health, safety and sustainability of
British Columbia’s (BC’s) aquatic resources. Guidelines are developed to protect aquatic
life, wildlife, agriculture (irrigation and livestock watering), drinking water sources, and
recreation and aesthetics.
In BC, the development of WQGs for aquatic life is directed by the following guiding
principles:
WQGs are science-based and intended for generic provincial application;
WQGs do not account for site-specific conditions or socio-economic factors;
All components of the aquatic ecosystem (e.g., algae, macrophytes, invertebrates,
amphibians, and fish) are considered when data are available;
Where data are available but limited, interim WQGs may be developed; and,
All forms of aquatic life and all aquatic stages of their life cycle are to be
protected during indefinite exposures.
WQGs for the protection of aquatic life represent levels that are protective of the most
sensitive species at its most sensitive life-stage during both short-term and long-term
exposures. The short-term maximum guideline represents a level that should not be
exceeded at any given time (i.e., instantaneous maximum) to prevent severe short-term
effects, whereas the long-term average guideline represents a level that the 30-day
average concentration (calculated as the mean of 5 samples within 30 days) should not be
exceeded to prevent chronic effects.
In 1996, the Canadian Council of Ministers of the Environment (CCME) proposed
ambient freshwater WQGs for total Cd and the BC MOE adopted this guideline as a

11
working WQG. Since that time, additional studies on the toxicity of Cd to aquatic life
have been conducted and published. In addition, CCME has updated the WQG for Cd
(CCME 2014a). This report reviews the most recent science on Cd toxicity in the
freshwater environment and uses this information to derive updated WQGs for Cd.
Water hardness influences cadmium toxicity by directly competing for binding sites on
organism tissues such as gills. The working Cd WQG was a hardness-based guideline,
which used hardness levels measured at the site to determine appropriate WQG levels.
This approach is maintained in the updated Cd WQG. The updated Cd WQG has changed
from the working Cd WQG in that it is now based on dissolved cadmium, rather than
total Cd. Dissolved Cd was chosen for the following reasons:
Dissolved Cd is the more bioavailable and ecologically relevant form;
Concentrations of total Cd in BC waters are highly variable and depend on water
flow and the associated concentrations of suspended sediment; and,
Published toxicity tests were conducted using dissolved salts, and as such are best
represented as dissolved Cd.
The results of published studies were used to derive relationships between Cd toxicity
and water hardness. The following equation is recommended to calculate short-term
maximum WQGs for water with different water hardness concentrations:
WQGSHORT-TERM = e[1.03 * ln(Hss) - 5.274]
Where: HSS = site-specific water hardness (mg/L CaCO3).
At a water hardness of 50 mg/L CaCO3, the recommended short-term maximum WQG
for dissolved Cd to protect freshwater aquatic life is 0.288 μg/L.
The following equation is recommended to calculate long-term average WQGs for water
with different water hardness concentrations:
WQGLONG-TERM = e[0.736 * ln(Hss) – 4.943]
Where: HSS = site-specific water hardness (mg/L CaCO3).
At a water hardness of 50 mg/L CaCO3, the recommended long-term (30-d) average
WQG for dissolved Cd to protect freshwater aquatic life is 0.127 μg/L.
A summary of the short-term maximum and long-term average WQGs at various water
hardness levels is presented in Table ES 1. Table ES 2 presents the working WQGs for
marine water, sediment (both marine and freshwater), livestock watering, and irrigation.

12
Table ES 1. Summary of Recommended Water Quality Guidelines for Cadmium.
Guideline Type/Equation
British Columbia WQG (µg/L Cd) for Dissolved
Cadmium at Varying Water Hardness
Lower
BoundA
50 mg/L
CaCO3
180 mg/L
CaCO3
320 mg/L
CaCO3
Upper
BoundB,C
Short-Term Maximum WQG
WQG Short-term = e[1.03 * ln(Hss) - 5.274]
0.0380 0.288 1.08 1.95 2.80
Long-Term Average WQG
WQG Long-term = e[0.736 * ln(Hss) - 4.943]
0.0176 0.127 0.326 0.457B 0.457
A The lower bound for the short-term maximum guideline is 7 mg/L CaCO3; the lower bound for the long-term
average guideline is 3.4 mg/L CaCO3. B The upper bound for the short-term maximum guideline is 455 mg/L CaCO3; the upper bound for the long-term
average guideline is 285 mg/L CaCO3. C When water hardness is greater than the upper bound (i.e., highest water hardness tested), a site-specific
assessment may be required.
Table ES 2. Summary of Working Water Quality Guidelines for Total Cadmium.
Guideline Type Working WQG for Total CadmiumA
Water (µg/L) - Marine 0.12
Sediment (µg/g) - Freshwater
Interim Sediment Quality Guideline (ISQG) 0.6
Probable Effect Level (PEL) 3.5
Sediment (µg/g) Marine
Interim Sediment Quality Guideline (ISQG) 0.7
Probable Effect Level (PEL) 4.2
Livestock watering (µg/L) 80
Irrigation (µg/L) 5.1
A A Compendium of Working WQGs for BC (BC MOE 2006); adopted from CCME (2014b).
It is important to note that, while water hardness is considered to be a primary factor in
ameliorating Cd toxicity, other factors also play a role. The ameliorating effects of
hardness are tightly linked to the pH and alkalinity of the system in natural surface
waters; therefore, due care should be applied in systems in which water hardness is
influenced by anthropogenic activities.

13
1.0 Introduction
The BC Ministry of Environment (BC MOE) develops province-wide ambient water
quality guidelines (WQGs) for substances or physical attributes that are important for
managing both fresh and marine surface waters of BC. This work has the following
goals:
To provide protection of the most sensitive aquatic life form and most sensitive
life stage indefinitely;
To provide a basis for the evaluation of data on water, sediment, and biota for
water quality and environmental impact assessments;
To provide a basis for the establishment of site-specific ambient water quality
objectives;
To provide a basis for identifying areas where degraded conditions may exist and
warrant further evaluation;
To provide a basis for establishing wastewater discharge limits; and,
To report to the public on the state of water quality and promote water
stewardship.
BC WQGs are science-based and intended for generic provincial application. They do
not account for site-specific conditions or socio-economic factors. All components of the
aquatic ecosystem (e.g., algae, macrophytes, invertebrates, amphibians, and fish) are
considered if the data are available. Where data are available but limited, interim
guidelines may be developed.
The approach to develop guidelines for aquatic life reflects the guiding principles that all
forms of aquatic life and all aquatic stages of their life cycle are to be protected during
indefinite exposure. For some substances both a short-term maximum and a 30-day
average (long-term) guideline are recommended as provincial WQGs, provided sufficient
toxicological data are available. Both conditions should be met to protect aquatic life.

14
The goal of freshwater aquatic life guidelines is the protection and maintenance of all
forms of aquatic life and all life stages in the freshwater environment. Therefore, it is
essential that, at a minimum, data for fish, invertebrates, and plants be included in the
guidelines derivation process. Data from amphibians are also highly desirable.
Guidelines or interim guidelines may also include studies involving species not required
in the minimum data set (e.g., protozoa, bacteria) when reasonable justification exists.
It should be noted that there are several sources of uncertainty when it comes to
developing WQGs and therefore it is necessary to apply uncertainty factors. Sources of
uncertainty include:
Laboratory to field differences;
Single to multiple contaminants (additive, synergistic, antagonistic effects);
Toxicity of metabolites;
Intra and inter-species differences (limited species to conduct tests on, which may
not include the most sensitive species);
Indirect effects (e.g., foodweb dynamics);
Whole life-cycle vs. partial life-cycle (many toxicity studies are only conducted
on partial life-cycles and it can be difficult to determine the most sensitive life
stage);
Delayed effects;
Impacts of climate change (species may be more vulnerable with additional
stressors); and,
Other stressors including cumulative effects.
The appropriate uncertainty factor to be applied is decided on a case-by-case basis and is
based on data quality and quantity, toxicity of the contaminant, severity of toxic effects,
and bioaccumulation potential (BC MOE 2012). The use of an uncertainty factor is a
policy decision; however, scientific judgment is used when determining the value.

15
Presently, WQGs do not have any direct legal standing. They are intended as a tool to
provide policy direction to those making decisions affecting water quality provided that
they do not allow legislated effluent standards to be exceeded. WQGs can be used to
establish the allowable limits in waste discharges. These limits are set out in waste
management permits, approvals, plans, or operating certificates which do have legal
standing. An exceedance of the WQGs presented in this document does not imply that
unacceptable risks are present, but that the potential for adverse effects is increased and
additional investigation and monitoring should be conducted.
Cadmium (Cd) has been identified as a metal of major importance by multiple agencies
because of its toxicity to humans and wildlife (e.g., Agency for Toxic Substances and
Disease Registry, Environment Canada, Health Canada, and U.S. Environmental
Protection Agency). In experiments with duckweed (Lemna minor), Cd was determined
to be the most toxic of the four metals tested, including copper, nickel, and zinc (Drost et
al. 2007). Cd is also known to be toxic to algae (e.g., Canton and Slooff 1982; Benhra et
al. 1997; Baer et al. 1999; Källqvist 2009), invertebrates (e.g., Suedel et al. 1997; Watts
and Pascoe 2000; Black 2001; Felten et al. 2008; Wang et al. 2010; Mebane et al. 2012),
fish (e.g., Eaton et al. 1978; Suedel et al. 1997; Hansen et al. 2002a; Besser et al. 2007;
Brinkman and Vieira 2008; Mebane et al. 2012), and amphibians (e.g., Canton and Slooff
1982; Ferrari et al. 1993; Nebeker et al. 1995).
Cd is released into the environment from both natural and anthropogenic sources. Small
amounts of Cd enter the environment from the natural weathering of minerals, forest
fires, volcanic emissions, generation of sea salt aerosols, and other natural processes.
Major anthropogenic sources of Cd in the environment include non-ferrous metal mining
and smelting operations, fossil fuel combustion, application of phosphate fertilizers, and
waste incineration and disposal (ATSDR 2012). Furthermore, up until the early 1990s an
unknown quantity of Cd had been administered through three turf grass production
fungicides that contained Cd (CCME 1999).

16
In 2010, it was estimated that 2,670 kg of Cd were released into Canadian waters as a
result of domestic anthropogenic activities. The largest proportion originated from water,
sewage, and other systems, releasing 45% (1,213 kg) of the national total (Environment
Canada 2012). Pulp, paper, and paperboard mills released 26% (705 kg), whereas 12%
(321 kg) originated from non-ferrous production and processing (excluding aluminum).
Other sources included foundries, metal ore mining, iron and steel mills, ferro-alloy
manufacturing, and the manufacturing of petroleum and coal products (Environment
Canada 2012). Sources in Ontario, BC, and Quebec had the highest releases of Cd,
contributing 31% (831 kg), 27% (730 kg), and 26% (704 kg) to the national total,
respectively. In BC, wastewater treatment plants were responsible for the majority of Cd
releases, while non-ferrous production/processing, and pulp, paper, and paperboard mills
were also important contributors (Environment Canada 2012).
The purpose of this report is to compile and review the key current scientific literature
related to the toxicity of Cd to freshwater aquatic life. The information from these key
studies was evaluated for its applicability for deriving short-term maximum and long-
term average WQGs for the protection of freshwater aquatic life for the province of BC
using the guidance provided in BC MOE (2012). This report is organized into a number
of sections to facilitate the development of the WQGs, including:
Introduction;
Physical and Chemical Properties of Cadmium;
Analysis of Cadmium in Environmental Samples;
Environmental Concentrations of Cadmium in British Columbia Waters;
Environmental Fate and Transport;
Bioaccumulation and Bioconcentration of Cadmium in the Aquatic
Environment;
Toxicity of Cadmium to Freshwater Aquatic Organisms;

17
Water Quality Guidelines from Other Jurisdictions; and,
Derivation of Water Quality Guidelines for Cadmium in British Columbia.
2.0 Physical and Chemical Properties of Cadmium
Cd is a soft, silver-white metal, with an atomic number of 48 and a molar mass of 112.4 g
(Budavari et al. 1989). Often associated with zinc, lead, and copper ores, Cd is found in
the earth’s crust at concentrations ranging from 0.1 to 0.5 mg/kg (ATSDR 2012). Cd is
usually found in rocks as a minor component of mineral sulphides, especially zinc
sulphides such as sphalerite and wurtzite (Nriagu 1980).
Elemental Cd has a density of 8.65 g/cm3 at 25
oC, a melting point of 321
oC and a boiling
point of 765oC (ATSDR 2012). Cd can occur in two oxidation states: elemental Cd and
as the divalent Cd ion (Cd2+
). However, Cd typically occurs in nature in its ionic form or
in metal-ligand complexes. Although elemental Cd is insoluble in water, several of its
salts such as cadmium chloride (CdCl2), cadmium nitrate (Cd[NO3]2), and cadmium
sulphate (CdSO4) are freely soluble in water (Budavari et al. 1989). Some water-
insoluble compounds such as cadmium oxide (CdO), cadmium sulphide (CdS), and
cadmium carbonate (CdCO3) may be solubilized under strong acidic or oxidizing
conditions (WHO 1992) and are typically found as insoluble complexes in the
environment. The physical and chemical properties of Cd and key salts of environmental
relevance are found in Table 1.

18
Table 1. Physical and chemical properties of key cadmium species in the aquatic
environment.
Compound Chemical
Formula
Molecular
Mass (g)
Density
(g/cm3)
Melting
Point (°C)
Boiling
Point (°C)
Water
Solubility
(g/L)
Reference
Cadmium Cd 112.41 8.65 @
25°C
321 765 Insoluble ATSDR (2012)
Cadmium
carbonate
CdCO3 172.42 4.58 @
20°C
357
(decomposes)
ND Insoluble ATSDR (2012)
Cadmium
chlorideA
CdCl2 183.32 4.047 @
25°C
568 960 1400 @
20°C
WHO (1992);
ATSDR (2012)
Cadmium
hydroxide
Cd(OH)2 146.41 4.79 @
25°C
300
(decomposes)
ND 0.0026 @
26°C
WHO (1992)
Cadmium
nitrateA
Cd(NO3)2 236.40 ND 59.5 132 Soluble NJDHSS
(2008)
Cadmium
sulphateA
CdSO4 208.47 4.69 @
20°C
1000 ND 755 @ 0°C WHO (1992);
ATSDR (2012)
ATSDR = Agency for Toxic Substances and Disease Registry; ND = no data; NJDHSS = New Jersey Department of Health and
Senior Services; WHO = World Health Organization. A Commonly used in toxicity tests.
3.0 Analysis of Cadmium in Environmental Samples
A variety of instruments and associated methods are used to measure Cd in
environmental samples (e.g., water samples), each with their own associated cost,
efficiency, and sensitivity of detection for the target analyte. Methods such as flame
atomic absorption spectrometry (FAAS; detection limit around 1.0 µg/L) and graphite
furnace atomic absorption spectrometry (GFAAS; detection limit around 0.01 µg/L)
detect one element at a time, while inductively coupled plasma atomic emission
spectrometry (ICP-AES) and inductively coupled plasma mass spectrometry (ICP-MS)
are commonly employed by laboratories and can detect multiple elements in a sample.
The method detection limits (MDLs) typically attained by ICP-AES range between 0.1
and 1.0 µg/L, while the more sensitive method of ICP-MS can attain MDLs of 0.001 to
0.01 µg/L (Thermo Elemental 2001). While the MDL is defined as “the minimum
concentration of a substance that can be measured and reported with 99% confidence that
the analyte concentration is greater than zero and is determined from analysis of a sample
in a given matrix containing the analyte” (CFR 2011), the practical quantitation limit
(PQL) is defined as “the lowest achievable level of analytical quantitation during routine

19
laboratory operating conditions within specified limits of precision and accuracy”
(USEPA 1985a). In practice, the PQL has been defined as a concentration 5-10 times the
MDL (USEPA 1985a). Importantly, appropriate MDLs need to be achieved for
monitoring programs that are designed to evaluate water quality conditions relative to
ambient WQGs. Therefore, MDLs should be, at minimum, five times below the ambient
WQG to ensure a higher level of precision and accuracy. However, in cases where
laboratories have defined PQLs for the substance of interest, it is recommended that the
PQL be at or below the ambient WQG.
Cd may be analysed in a water sample as either the dissolved or total fraction. Analysis
of dissolved Cd includes the dissolved metal only (i.e., the fraction that passes through a
0.45 µm filter), while the analysis of total Cd includes the dissolved fraction and any Cd
associated with particulates (e.g., suspended sediments) in the sample. While neither
method provides information on the speciation of metals (e.g., ionic Cd) in the sample,
the dissolved fraction provides a better estimate of bioavailable Cd (Campbell 1995;
Paquin et al. 2002) as Cd associated with suspended sediments (and therefore not
available for uptake) is excluded from the measurement. However, while measurements
of dissolved metals in water may provide a more effective basis for evaluating the
potential effects of metals on fish and aquatic life, such measurements do not provide
comprehensive data for evaluating risks to aquatic life (i.e., only through direct toxicity)
associated with exposure to metals or for managing discharges of metals into the
environment. Therefore, monitoring of both dissolved and total Cd in the aquatic
environment may be useful to address study questions because:
WQGs based on the dissolved fraction are not designed to account for
contamination due to loading of particulate metals to the water column and
bottom sediments; and,
WQGs based on the dissolved fraction are not designed to protect against
accumulation through diet.

20
4.0 Environmental Concentrations of Cadmium in British
Columbia Waters
Cd may enter aquatic ecosystems as a result of natural processes such as the weathering
of minerals, forest fires, volcanic emissions, generation of sea salt aerosols, and other
natural phenomena. While the concentration of Cd in natural (i.e., un-impacted) surface
waters and groundwater is generally less than 1 µg/L Cd (ATSDR 2012), some areas
contain naturally elevated levels of Cd due to the geological composition of the area.
Additionally, the variability in background concentrations of Cd is determined by local
climate, soil, water quantity and flow regime, and water and sediment quality conditions
(e.g., pH and redox potential). It is therefore useful to estimate the environmental
concentrations of Cd in BC waters to provide context for the development of WQGs.
4.1 Methods for Estimating Background Concentrations of Cadmium in
British Columbia
In order to estimate the background levels of Cd in BC waters, data sets containing
samples collected from 343 reference sites throughout the province were compiled from
various sources (including Environment Canada, BC MOE, and the private sector) for
evaluation (Figure 1; Appendix 1). These samples were collected to support multiple
programs including BC MOE and Environment Canada water quality monitoring
programs, the Canadian Aquatic Biomonitoring Network (CABIN), source-water
monitoring programs, and baseline monitoring programs to support environmental
assessments, and thus, were deemed appropriate for estimating background
concentrations of Cd in BC waters. The compiled data sets included information on
water quality variables (total and dissolved Cd, turbidity and/or total suspended solids
[TSS], and hardness) and sampling information (i.e., sample collection date and
geographic coordinates). Estimates of the mean concentration of Cd at each of the
evaluated stations were summarized within each of the seven BC MOE administrative

21
Figure 1. Locations of reference sites used to estimate background concentrations
of cadmium in B.C. waters.
regions (i.e., Vancouver Island, Lower Mainland, Thompson-Okanagan, Kootenay,
Cariboo, Skeena, and Omineca-Peace). Laboratory replicates were identified during data
compilation and were incorporated as a sample average. Field replicates were treated as
discrete samples and were not averaged.
To facilitate the characterization of background concentrations of total and dissolved Cd
in BC, the mean concentration of Cd was calculated for each station prior to determining
the distribution of Cd concentrations in regions and in the province. Conducting the
analysis in this way gives equal weighting to each station used in the analysis. To
calculate station means using data containing non-detect concentrations, the regression on
order statistics (ROS) method was employed to estimate each mean where at least some
of the samples were non-detect data (Huston and Juarez-Colunga 2009). However, due
Nelson
Stewart
Kelowna
Victoria
Smithers
Kamloops
Vancouver
PentictonCranbrook
Williams Lake
Prince George
Fort St. John
Legend
Sample Locations
Stream/River Sites
Lake Sites
Region
Vancouver Island
Lower Mainland
Thompson - Okanagan
Kootenay
Cariboo
Skeena
Omineca - Peace
Cities
0 100 200 300 400 50050Kilometres

22
to the high number of non-detect concentrations present at some of the stations (i.e., >
80% of samples), some level of uncertainty exists in the calculated station means. In
cases where all samples collected at a particular station were below detection limits, the
highest detection limit present in the samples at that station was selected to represent the
estimated station mean. The mean concentrations for stations in which all samples had
detected concentrations were calculated as arithmetic means. A single dataset was created
from the individual samples collected at the 343 reference sites, which included the mean
total and dissolved concentrations by station for all collected samples.
The characterization of Cd concentrations at the regional level was derived by calculating
the minimum and maximum of the station means. In cases where all stations within a
region were represented by station means below detection limits, the minimum and
maximum detection limits of the data within that region were used to determine the
range.
4.2 Background Levels of Cadmium in British Columbia
The processed (i.e., screened) data set consisted of 2,680 total Cd samples (Table 2) and
671 dissolved Cd samples (Table 3), which were used for estimating the range of
background concentrations of Cd in each of the seven BC MOE administrative regions.
A summary of the range of environmental concentrations in each of these regions is
provided in the following sections and in Table 4.
4.2.1 Vancouver Island
Cd concentrations collected from 9 stations were used to estimate background
concentrations on Vancouver Island. The mean total Cd concentrations by station were
among the lowest in the province at both lentic and lotic sites. Mean total Cd
concentrations by station in lotic systems of Vancouver Island ranged from 0.00287 to
0.0165 µg/L (n = 9 stations); the mean dissolved Cd concentrations ranged from 0.00275
to 0.0160 µg/L (n = 8 stations).

23
Table 2. Summary of data used to estimate background concentrations of total cadmium
at select reference stations in British Columbia by regionA.
Data Source #
Stations
#
Samples Date Range
Concentration
Range (µg/L)
DL Range
(µg/L)
%
Samples <
DL
Vancouver Island
BCMOE 8 153 2001-2011 <0.005 - 0.1 0.005 - 0.01 71.9
EC (Fed-Prov sites) 1 70 2006-2011 0.001 - 0.027 NA 0
All data 9 223 2001-2011 0.001 - 0.1 0.005 - 0.01 49.3
Lower Mainland
BCMOE 2 4 2002 <0.01 - 0.06 0.01 25.0
CABIN 9 9 2008 <0.01 - 0.04 0.01 88.9
All data 11 13 2002-2008 <0.01 - 0.06 0.01 69.2
Thompson-Okanagan
BCMOE 7 47 1999- 2012 <0.006 - 1.69 0.006 - 0.01 17.0
CABIN 47 52 2007-2012 <0.005 - 0.082 0.005 - 0.01 44.2
All data 54 99 1999-2012 <0.005 - 1.69 0.005 - 0.01 31.3
Kootenay
EC (Fed-Prov sites) 6 893 1985-2012 <0.001 - 1 0.001 3.47
CABIN 31 39 2007-2011 <0.005 - 0.062 0.005 - 0.01 46.2
All data 37 932 1985-2012 <0.001 - 1 0.001 - 0.01 5.26
Cariboo
BCMOE 15 281 1998-2012 <0.005 - 0.65 0.005 - 0.05 67.6
CABIN 2 3 2006-2011 <0.01 - 0.012 0.01 - 0.01 66.7
All data 17 284 1998-2012 <0.005 - 0.65 0.005 - 0.05 67.6
Skeena
CABIN 111 162 2003-2011 0.0006 - 0.151 0.005 - 0.01 66.0
EC (Fed-Prov sites) 3 407 2003-2012 <0.001 - 0.248 0.001 - 0.001 1.23
Seabridge Gold (KSM
Mine)
17 93 2009 <0.01 - 0.176 0.01 - 0.03 39.8
TTM Resources (Chu
Molybdenum Mine)
3 4 2008-2009 <0.017 - 0.0218 0.017 - 0.017 75.0
All data 134 666 2003-2012 0.0006 - 0.248 0.001 - 0.03 22.8
Omineca - Peace
BCMOE 5 32 2002-2006 <0.01 - 0.04 0.01 - 0.01 90.6
EC (Fed-Prov sites) 1 200 2003-2012 <0.001 - 0.014 0.001 - 0.001 3.50
CABIN 8 8 2005-2006 <0.01 - 0.02 0.01 - 0.01 87.5
Cardero Coal (Carbon
Creek)
19 93 2011-2012 0.011 - 0.117 0.05 - 0.05 6.45
CKD Mines (Gething
Coal)
12 122 2006-2011 <0.0085 - 0.488 0.0085 - 0.025 46.7
Xstrata Coal
(Goodrich Coal)
1 8 2011 0.015 - 0.029 NA 0
All data 46 463 2002-2012 <0.001 - 0.488 0.001 - 0.05 22.9
BCMOE = British Columbia Ministry of Environment; CABIN = Canadian Aquatic Biomonitoring Network;
DL = Detection Limit; EC = Environment Canada; Fed-Prov = Federal-Provincial monitoring sites. A Summary does not include data that were excluded during the screening process.

24
Table 3. Summary of data used to estimate background concentrations of dissolved
cadmium at select reference stations in British Columbia by regionA.
Data Source #
Stations
#
Samples
Date
Range
Concentration
Range (µg/L)
DL Range
(µg/L)
%
Samples
< DL
Vancouver Island
BCMOE 8 130 2001-2010 <0.005 - 0.09 0.005 - 0.01 74.6
Lower Mainland
CABIN 24 25 2007-2008 <0.01 - 0.07 0.01 - 0.01 96.0
Thompson-Okanagan
CABIN 22 22 2007-2008 <0.01 - 0.03 0.01 - 0.01 77.3
Kootenay
EC (Fed-Prov sites) 1 3 2003-2004 0.003 - 0.009 NA 0
Cariboo
BCMOE 15 142 1999-2012 <0.005 - 0.145 0.005 - 0.017 73.9
Skeena
Seabridge Gold (KSM
Mine)
17 94 2009 <0.01 - 0.057 0.01 - 0.017 74.5
Omineca - Peace
BCMOE 5 32 2002-2006 <0.01 - 0.03 0.01 - 0.01 87.5
Cardero Coal (Carbon
Creek)
19 93 2011-2012 0.007 - 0.071 0.01 - 0.05 14.0
CKD Mines (Gething
Coal )
12 122 2006-2011 <0.0085 - 0.054 0.0085 -
0.025
67.2
Xstrata Coal
(Goodrich Coal)
1 8 2011 0.014 - 0.022 NA 0
All data 37 255 2002-2012 0.007 - 0.071 0.0085 - 0.05 48.2
BCMOE = British Columbia Ministry of Environment; CABIN = Canadian Aquatic Biomonitoring Network;
DL = Detection Limit; EC = Environment Canada; Fed-Prov = Federal-Provincial monitoring sites. A Summary does not include data that were excluded during the screening process.

25
Table 4. Range of the station mean total and dissolved cadmium concentrations for each
of the seven administrative regions in British Columbia.
Cadmium Fraction Number of
Stations
Station Mean Cd Concentration (µg/L)
Minimum Maximum
Vancouver Island
Total 9 0.00287 0.0165
Dissolved 8 0.00275 0.0160
Lower Mainland
Total 11 < 0.01 0.0500
Dissolved 24 < 0.01 0.0700
Thompson - Okanagan
Total 54 < 0.005 0.173
Dissolved 22 < 0.01 0.0300
Kootenay
Total 37 0.00435 0.115
Dissolved 1 0.00600 0.00600
Cariboo
Total 17 0.00345 0.132
Dissolved 15 0.00372 0.145
Skeena
Total 134 < 0.005 0.151
Dissolved 17 < 0.01 0.0300
Omineca - Peace
Total 46 0.00397 0.123
Dissolved 37 < 0.00850 0.0558
The detection limits for samples used in the analysis of background data from the
Vancouver Island region ranged from 0.005 to 0.01 µg/L for both total and dissolved Cd.
Overall, 49% of the samples analysed for total Cd fell below the detection limit, whereas
75% of the samples for the dissolved fraction were below detection limits.
4.2.2 Lower Mainland
Background Cd concentrations for the Lower Mainland region were estimated using data
collected at 28 stations. The mean total Cd concentrations by station were among the
lowest in the province for lotic sites. Mean total Cd concentrations by station ranged

26
from < 0.01 to 0.0500 µg/L (n = 11 stations) while mean dissolved Cd concentrations by
station ranged from < 0.01 to 0.0700 µg/L (n = 24 stations).
The detection limit for all samples analysed from the Lower Mainland was 0.01 µg/L;
overall, 69% of the samples analysed for total Cd were below the detection limit, whereas
96% of the samples for the dissolved fraction fell below the detection limit.
4.2.3 Thompson-Okanagan
Data from 63 stations provided information on the background concentrations of Cd in
the Thompson-Okanagan region. Mean concentrations of total Cd by station ranged from
< 0.005 to 0.173 µg/L for all data (n = 54 stations). Mean concentrations of dissolved Cd
by station ranged from < 0.01 to 0.0300 µg/L (n = 22 stations).
Detection limits for samples used to estimate background Cd concentrations in the
Thompson-Okanagan region ranged from 0.005 to 0.01 µg/L for total Cd and the
detection limit was 0.01 µg/L for the dissolved fraction. Overall, 31% of the samples
analysed for total Cd fell below the detection limit, whereas 77% of the data for dissolved
Cd were below the detection limit.
4.2.4 Kootenay
Data collected from 37 reference sites were used to estimate background Cd
concentrations in the Kootenay region. Mean total Cd concentrations by station ranged
from 0.00435 to 0.115 µg/L (n = 37 stations) when all data were considered. Dissolved
Cd data were only provided for one station with the estimated mean concentration for this
station being 0.006 µg/L.
Detection limits of samples used to estimate background Cd concentrations in the
Kootenay region ranged from 0.001 to 0.01 µg/L. Overall, only 5% of the samples
analysed for total Cd fell below the detection limit, whereas all samples analysed for
dissolved Cd were above the detection limit.

27
4.2.5 Cariboo
Data used to estimate background Cd concentrations for the Cariboo region were
collected from 17 reference sites. Compared to rivers and creeks in the other regions,
mean total Cd concentrations in the Cariboo region were among the highest in samples
collected. In addition, the concentrations of dissolved Cd measured in all samples
collected were among the highest in the province. Mean concentrations of total Cd by
station ranged from 0.00345 to 0.132 µg/L for all data (n = 17 stations). Mean
concentrations of dissolved Cd by station ranged from 0.0372 to 0.145 µg/L (n = 15
stations).
Detection limits for samples used to estimate background Cd concentrations in the
Cariboo region ranged from 0.005 to 0.05 µg/L for total Cd and 0.005 to 0.017 µg/L for
dissolved Cd. Overall, 68% of samples analysed for total Cd fell below the detection
limit, whereas 74% of samples were below the detection limit for dissolved Cd.
4.2.6 Skeena
Data collected from 127 lotic and 7 lentic reference stations provided information on the
background concentrations of Cd in the Skeena region, which were among the highest in
the province for total Cd. Mean concentrations of total Cd by station ranged from < 0.005
to 0.151 µg/L for all data (n = 134 stations). Mean concentrations of dissolved Cd by
station ranged from < 0.01 to 0.03 µg/L (n = 17 stations).
Detection limits for samples used in the analysis of background Cd concentrations in the
Skeena region ranged from 0.001 to 0.03 µg/L for total Cd and from 0.01 to 0.017 µg/L
for dissolved Cd. Overall, 23% of the samples analysed for total Cd fell below the
detection limit, whereas 75% of the samples for the dissolved Cd fraction were below
detection limits.

28
4.2.7 Omineca-Peace
Data collected from 46 reference sites were used to estimate background Cd
concentrations in the Omineca-Peace region, which were among the highest in the
province for total Cd data collected. Mean total Cd concentrations by station ranged
from 0.00397 to 0.123 µg/L (n = 46 stations) when all data were considered. Station
mean dissolved Cd concentrations ranged from < 0.0085 to 0.0558 µg/L.
Detection limits for samples used to estimate background Cd concentrations in the
Omineca-Peace region ranged from 0.001 to 0.05 µg/L for total Cd and 0.0085 to 0.05
µg/L for dissolved Cd. Overall, 23% of samples analysed for total Cd fell below the
detection limit and 48% of samples analysed for dissolved Cd were below detection
limits.
4.2.8 Summary
In general, Cd concentrations were found to be lower in southern BC compared to central
and northern regions, which may be attributed to variability in local rock composition and
ambient conditions such as climate, soil type, pH, and water quantity and flow regime. In
general, the mean total Cd concentrations by station were the lowest on Vancouver Island
and in the Kootenay region, whereas the highest concentrations were found in samples
collected in the Cariboo, Skeena, and Omineca-Peace regions. Overall, mean total Cd
concentrations by station in BC waters ranged from 0.00287 to 0.173 µg/L. Mean
dissolved Cd concentrations by station ranged from 0.00275 µg/L to 0.145 µg/L (Table
4).
5.0 Environmental Fate and Transport
Cd is released into the environment through a variety of natural processes and
anthropogenic activities. Although Cd and Cd compounds are typically non-volatile,
combustion processes may emit Cd into the atmosphere as part of oxide, chloride, and
sulphate complexes. These particles can be transported over long distances (hundreds to

29
thousands of kilometres) before being deposited onto the soil or surface water (ATSDR
2012). In addition, Cd can be released onto soils through the application of phosphate
fertilizers (ATSDR 2012). Dependent upon the pH of the soil and the abundance of
organic matter, Cd can become immobilized in the soils, becoming available for uptake
to plants and into the food web (ASTDR 2012). However, Cd may become more mobile
under low pH conditions and be transported into surface waters and groundwater.
Compared to most other heavy metals, Cd is relatively mobile in aquatic systems. In
water, Cd typically exists as a hydrated ion or as a component of ionic complexes with
other substances (e.g., cadmium chloride, cadmium nitrate, and cadmium sulphate;
ASTDR 2012), which migrate easily in the water column. Under high pH (i.e., alkaline)
conditions however, Cd can form insoluble complexes with carbonate (CdCO3) or
hydroxide (Cd[OH]2) and settle out in bottom sediments (Hahne and Kroontje 1973;
Guegen et al. 2003). Additionally, in organic-rich waters, Cd readily adsorbs to humic
acids and other organic substances (USEPA 1979).
In sediments, Cd is primarily found as a component of insoluble complexes (e.g., CdCO3)
or adsorbed to organic matter (e.g., humic acid ligands). In addition, bacteria in sediment
may play a role in the partitioning of Cd to sediments from the water column (Burke and
Pfister 1988). The potential for Cd to re-mobilize from bottom sediments to the water
column is determined by a number of factors. Cd that partitions into sediments by
complexation with carbonate minerals or co-precipitation with hydrous iron oxides is less
likely to re-mobilize by turbulence (i.e., disturbance of the sediments). However, Cd that
is adsorbed to sediment surfaces (e.g., clay or organic matter) is more readily released to
a dissolved state. In addition, Cd (as well as other metals) may disassociate from
sediments under certain conditions (USEPA 1979).
The degree of Cd toxicity to aquatic biota is dependent on its bioavailability in the water
column. The Cd ion is readily taken up by multiple aquatic organisms (including algae,
plants, aquatic invertebrates, fish, and amphibians) by interfering (i.e., competing) with

30
calcium ions for Ca2+
receptors on the tissues of organisms (Verbost et al. 1987; 1989;
Playle et al.1993a; 1993b; Playle 1998). Generally, ambient conditions that favour the
ionic form of Cd result in conditions that are most toxic to aquatic species (Campbell
1995). Further, there is some evidence to support that in addition to uptake (i.e.,
bioconcentration) of Cd through direct contact (e.g., at the gill-water interface),
bioaccumulation of Cd through ingestion of contaminated food sources may contribute to
the Cd body burden and thus toxicity in fish (Farag et al. 1994; Woodward et al. 1995)
and invertebrates (van Hattum et al. 1989). However, there is no evidence to support the
possibility that Cd biomagnifies in the aquatic environment (i.e., increases in
concentration in higher trophic levels).
6.0 Bioaccumulation and Bioconcentration of Cadmium in the
Aquatic Environment
Field measurements of contaminants in water, sediment, and tissue provide information
on the concentrations of the contaminant in the aquatic environment. However, these
measurements provide little information about the bioaccumulation or bioconcentration
of the contaminants in the tissues of aquatic organisms and the potential transfer of those
contaminants to higher trophic levels. Bioconcentration factors (BCFs) and
bioaccumulation factors (BAFs) express the ratio of contaminant concentration in the
ambient environment to the contaminant concentration within an organism (Arnot and
Gobas 2006). The BCF estimates the relationship between the uptake and retention of a
chemical by an aquatic organism from the ambient water to excretion of that chemical
(Barron 1990; Meylan et al. 1999; Arnot and Gobas 2006), whereas BAFs incorporate
the concentrations of a chemical from all surrounding media (i.e., water, sediment, and
food; Arnot and Gobas 2006). Therefore, bioconcentration and bioaccumulation express
the competing rates of chemical uptake and loss by aquatic organisms, which depend on a
number of factors such as the concentration and properties of the chemical (i.e.,
speciation), ambient conditions (e.g., hardness, temperature, salinity) and the type of
exposure (Taylor 1983). Organism physiology (i.e., mechanisms of uptake, excretion,

31
and detoxification) and food web structure are also important factors. A BCF is typically
calculated from data derived in laboratory studies, while a BAF is usually calculated
using field measurements (Arnot and Gobas 2006), but can be calculated from properly
designed laboratory studies. Although BCFs and BAFs are important for some
contaminants, they are not recommended for use with metals (McGeer et al. 2003;
Fairbrother et al. 2007). A review of the literature found that BCFs for Cd had high
variability and were inversely related to exposure concentration (McGeer et al. 2003).
The purpose of this section is to provide information on the studies that have been
conducted to investigate the potential for bioconcentration and bioaccumulation of Cd.
While the general consensus in the literature suggests that aquatic plants uptake Cd
readily, there is considerable variability in calculated BCFs. Phytoplankton have been
found to uptake Cd rapidly, adversely affecting growth and photosynthesis (Hutchinson
1973; Klass et al. 1974; Cossa 1976; Conway and Williams 1979). Bioconcentration
factors for phytoplankton of up to 24,000 (unspecified moisture basis) have been
reported, with values typically decreasing at the highest range of exposure levels (Cain et
al. 1980; Conway and Williams 1979; Ferard et al. 1983). For example, Cain et al.
(1980) reported BCFs between 329 and 4,900 (dry weight [DW] basis) in 14-d exposures
of freshwater phytoplankton to Cd concentrations of 10 to 2,000 µg/L Cd, and found that
maximum uptake efficiency occurred at the lower concentration rather than the
concentration that resulted in the greatest accumulation. Ferard et al. (1983) reported
BCFs for phytoplankton ranging from 1,850 to 3,000 (DW basis) after a 10-d exposure to
10 to 250 µg/L Cd. Conway and Williams (1979) found markedly higher BCFs of 3,500
to 24,400 (unspecified moisture basis) in concentrations of 0.05 to 8.5 µg/L Cd; in this
short-term study, the initial sorption was observed during the first 5-10 minutes of Cd
exposure (Conway and Williams 1979). Investigations have found the uptake of Cd by
aquatic plants to quickly reach steady-state concentrations, with the accumulation of Cd
in roots to be greater than the accumulation in leaves (e.g., Giesy et al. 1981). A mixture
of algae and small crustaceans, in a channel microcosm study, also exhibited rapid uptake
of Cd, reaching steady-state in less than 23 days (Giesy et al. 1981). The BCF calculated

32
from the data was 7,200 when the community was exposed to 5 µg/L Cd and 5,800 when
exposed to 10 µg/L Cd (DW basis; Giesy et al. 1981).
Invertebrates tend to exhibit larger BCFs at lower Cd water concentrations (Marshall
1978; Spehar et al. 1978; Giesy et al. 1981). When the cladoceran, Daphnia galeata
mendotae, was exposed to four different concentrations of Cd (1, 2, 4, 8 µg/L) for 22
weeks, the BCF decreased from 17,600 to 6,463 (DW basis) as the water concentration
increased (Marshall 1978). Though it was not stated whether steady-state was reached,
the long period of exposure (22 weeks) suggests that the BCFs were calculated when
concentrations were at steady-state (Marshall 1978; ASTM 2012a). In an experiment
exposing stoneflies (Pteronarcys dorsata), caddisflies (Hydropsyche betteni), and snails
(Physa integra) to concentrations ranging from 3 to 238 µg/L Cd, Spehar et al. (1978)
found an increase in whole-body Cd concentration as the exposure water concentration
increased, with the whole-body concentrations (DW) ranging from 600 to 30,000 times
greater than the associated water concentrations. While it was not stated whether steady-
state was reached, BCFs calculated for stoneflies after 28 days of exposure ranged from
798 in exposure chambers with a concentration of 238 µg/L Cd to 4,096 in exposure
chambers with a concentration of 8.3 µg/L Cd. For caddisflies, these BCFs ranged from
1,260 at 238 µg/L Cd to 31,667 at 3 µg/L Cd, while for snails the BCFs ranged from
6,024 at 8.3 µg/L Cd to 13,667 at 3 µg/L Cd (analysis of graphical data; DW basis;
Spehar et al. 1978). Giesy et al. (1981) obtained similar BAFs (DW basis), with
concentrations of Cd between 820 and 17,600 times greater in the bodies of beetles
(Coleoptera), dragonflies (Anisoptera), damselflies (Zygoptera), midges (Chironomidae
and Ceratopogonidae), and mayflies (Ephemeroptera) than in the water of exposure
chambers with concentrations of 5 or 10 µg/L Cd. These BAFs were highest in the
detritivores and herbivores (Ephemeroptera and Chironomidae; Giesy et al. 1981).
Crayfish (Cambarus latimanus) exposed to 5 and 10 µg/L Cd for 5 months were found to
have whole-body BAFs of 2,980 and 2,196, respectively (DW basis; Thorp et al. 1979).
In comparison, crayfish (Procambarus acutus acutus) exposed to 5 and 10 µg/L Cd for

33
21 days accumulated significantly more Cd in the gills than controls, but not in dorsal
tail-muscle tissue (Dickson et al. 1982). Although it was not stated whether steady-state
was reached, based on the water Cd concentrations, the BCFs (using gill tissue) were
40,808 for crayfish exposed to 5 µg/L Cd and 17,936 in 10 µg/L Cd exposures (DW
basis). However, despite the large increase in gill Cd concentration, there was not a
significant difference in mortality or molting between Cd-exposed and control crayfish
(Dickson et al. 1982). Differences in Cd uptake between different tissue types were also
seen in the freshwater mussel Dreissena polymorpha (Herwig et al. 1989). After 4 weeks
of exposure to 100 µg/L Cd, the Cd concentration in the shell had reached a steady-state
concentration of approximately 30 µg/g Cd (DW). However, the Cd concentration in the
soft body tissue increased linearly over the exposure period, to about 290 µg/g Cd (DW;
Herwig et al. 1989). Although 4 weeks is generally considered a reasonable length of
time for reaching steady-state (ASTM 2012a), the linear increase in Cd concentration
shown in Herwig et al. (1989) implies that the BCF calculated in this case would not be
accurate. An experiment exposing isopods (Asellus aquaticus) to Cd through food and
water also did not reach steady-state (van Hattum et al. 1989) after a 30-d exposure.
However, using a first order one-compartment bioaccumulation model, van Hattum et al.
(1989) estimated the steady-state Cd concentration in A. aquaticus and calculated a BCF
of 17,560 ± 9,960 and a BAF of 0.082 ± 0.068 (both DW), where the BAF was
considered to represent the accumulation of Cd from food alone. Over 89% of the Cd
uptake was estimated to be from direct contact with water, except for in the treatment
with high Cd in the food source, when food and water each contributed 50% of the Cd
taken up by A. aquaticus (van Hattum et al. 1989).
In fish, Cd appears to preferentially accumulate in certain organs relative to the whole
body overall. A study exposing rainbow trout (Oncorhynchus mykiss) fingerlings to 4
µg/L Cd for 10 weeks found the highest Cd concentrations in the kidney, followed by the
liver and the gills (Kumada et al. 1980). Similarly, when Benoit et al. (1976) exposed 3
generations of brook trout (Salvelinus fontinalis) to Cd, the first generation was exposed
for 38 weeks and the highest concentration (about 50 µg/g, DW) of Cd was found in the

34
kidney, followed by the liver and gills. Cd appeared to have reached steady-state in the
kidney, giving a BCF of about 14,000 (DW basis) for that organ for fish exposed to 3.4
µg/L Cd (Benoit et al. 1976). In second generation fish exposed to 3.4 µg/L Cd for 70
weeks from fertilization, the kidney again had the highest Cd concentration, with a BCF
of about 19,000 (DW basis). In the third generation, only whole-body tissue residues
were analysed; the BCF of these juveniles exposed to 3.4 µg/L Cd was 371, while for fish
exposed to 0.9 µg/L Cd the BCF was 756 (DW basis; Benoit et al. 1976).
By modelling uptake and elimination rates, Giesy et al. (1981) calculated the steady-state
concentrations of Cd in mosquitofish (Gambusia affinis) after 139 days. Using these
numbers, the BAFs were 7,156 and 6,100 for fish exposed to 5 and 10 µg/L Cd,
respectively (DW basis; Giesy et al. 1981). In contrast, fathead minnows (Pimephales
promelas) exposed to 48.8 µg/L Cd reached a steady-state concentration of
approximately 7 µg/g in whole-body tissue after 50 days, giving a BCF of around 150
(though the whole-body concentration peaked after 46 days at 10.7 μg/L; Sullivan et al.
1978). Hansen et al. (2002b) found that juvenile bull trout (Salvelinus confluentus)
exposed to a range of Cd concentrations (0.052 to 0.786 µg/L Cd) accumulated increased
amounts of Cd with increasing water concentration at each time point sampled (20, 40,
and 55 days of exposure). The concentration of Cd also increased over time within a
given exposure concentration, and steady-state was not reached after 55 days in the
higher concentrations. However, the 2 lowest exposure concentrations resulted in similar
whole-body Cd concentrations at all 3 sampling times; the BCFs in exposures of 0.052
and 0.089 µg/L Cd were approximately 3,000 and 2,000, respectively (DW basis; Hansen
et al. 2002b). Exposing rainbow trout to higher Cd concentrations (3 and 10 µg/L Cd)
for 30 days resulted in lower whole-body BCFs (167 and 120, respectively; wet weight
basis; Hollis et al. 1999). The gills accumulated a greater proportion of Cd on a per gram
basis, with BCFs of 2,000 and 1,200 (weight wet basis) for fish exposed to 3 and 10 µg/L
Cd, respectively (Hollis et al. 1999). Although steady-state was not reached in this case,
the 30-d exposure period was longer than the 28 days recommended for calculating a
BCF for fish (ASTM 2012a).

35
In an even longer-term experiment, Cearley and Coleman (1974) found that Cd
concentrations in largemouth bass (Micropterus salmoides) and bluegill (Lepomis
macrochirus) were at steady-state when sampled at 2 and 4 months of exposure. When
exposed to 8 µg/L Cd, the BCFs for the bass gills and body carcass were 2.0, while for
the internal organs, the BCF was 2.75. For all body components the BCF was less than
one when the fish were exposed to 80 µg/L Cd. Only the whole body of the bluegill was
analysed; the calculated BCF was 1.75 and 2.12 when exposed to 8 and 850 µg/L Cd,
respectively (all BCFs on a DW basis; Cearley and Coleman 1974). These numbers were
all calculated using body concentrations estimated from graphs, so it is possible that these
BCFs are not as accurate as those reported from other studies. In another long-term
study, Giles (1988) looked at Cd accumulation in several organs in rainbow trout over
178 days. The gills accumulated the most Cd, while Cd in the muscle did not increase
significantly compared to the control in both Cd treatments. Based on the calculated
average whole-body Cd concentrations, the BAFs (DW basis) for this study were 36 for
the 3.6 μg/L Cd exposure and 30 for the 6.4 µg/L Cd exposure, although the whole-body
Cd burden may not have reached steady-state (Giles 1988).
There is some evidence that it is important to consider ingestion of Cd from food sources
rather than only considering direct contact with water. Farag et al. (1994) exposed adult
rainbow trout to a mixture of metals, including Cd, through water and/or food. They
found significantly more Cd in the gills and liver of fish exposed to metals through water
than in controls or in fish exposed through food only. However, there was significantly
more Cd in the stomach and pyloric caeca in fish exposed through food than in the
control (i.e., no exposure through food or water) suggesting that the ingestion of Cd-
contaminated prey may play a role in Cd body burden (Farag et al. 1994). In addition,
rainbow trout and brown trout exposed to metal-contaminated food for 88 days post-
hatch had significantly decreased weight compared to control fish; only brown trout
weighed significantly less than controls when exposed to contaminants through water
alone (Woodward et al. 1995). After 84 days of exposure, feeding activity was decreased
in rainbow trout fed contaminated food. As well, the whole body concentration of Cd in

36
brown trout was significantly increased after 88 days due to exposure through food and
water, but rainbow trout only accumulated Cd from the water exposure (Woodward et al.
1995). Kraemer et al. (2006) compared Cd uptake in yellow perch (Perca flavescens)
from food with uptake from water. Evidence for uptake through water was stronger than
uptake through food, though there was some accumulation of Cd from the diet.
However, statistical comparisons of the treatments could not be completed due to high
mortality in the reference and test treatments. In addition, water hardness in the test and
reference lakes was not measured, which may have influenced waterborne Cd uptake
(Kraemer et al. 2006). Nonetheless, in vivo and in vitro studies with yellow perch
suggested that Cd uptake is controlled at the gut rather than at the gills (Klinck et al.
2007). An in vitro study with rainbow trout found that the presence of excess iron
decreased Cd accumulation in some parts of the gastro-intestinal tract, and iron
absorption in the mucosal epithelium was inhibited in the presence of Cd (Kwong and
Niyogi 2009). Therefore, it appears that Cd enters the fish gastro-intestinal tract through
the same pathway as iron, and a diet rich in iron might protect fish from Cd uptake and
toxicity (Kwong and Niyogi 2009).
Although there is some evidence of Cd accumulation from the diet (Farag et al. 1994;
Woodward et al. 1995), there is little evidence to support that Cd biomagnifies in the
food web (i.e., increases in concentration with increasing trophic level; Nfon et al. 2008).
When looking at Cd transfer through multiple trophic levels (algae, cladocerans, fish),
Ferard et al. (1983) only found evidence of lower trophic levels exhibiting
bioaccumulation; the alga Chlorella vulgaris had a mean BCF of approximately 2,200
(DW basis). While the concentration of Cd in the daphnids increased as the Cd
concentration in the algae they were exposed to increased, they did not accumulate as
much Cd as the algae on a µg/g basis (BAFs < 1 on a DW basis). Fish (Leucaspius
delineatus) feeding on the algae and daphnids did not show a relationship between Cd
exposure and tissue concentration; fish accumulated less than 1 µg/g DW of Cd at all Cd
exposure levels (Ferard et al. 1983). Similarly, Williams and Giesy (1978) and
Hatakeyama and Yasuno (1982) found that fish took up more Cd through contaminated

37
water than food, suggesting Cd does not biomagnify with increasing trophic level. Nfon
et al. (2009) found no evidence of Cd biomagnification in a pelagic food chain in the
Baltic Sea; in fact, Cd was diluted in tissues as trophic levels increased from zooplankton
to herring. Direct exposure from water is the primary pathway for Cd toxicity.
Therefore, the WQGs presented in this document were developed based on direct
exposure toxicity data.
7.0 Toxicity of Cadmium to Freshwater Aquatic Organisms
Cd has been identified as a metal of major importance by multiple agencies including the
Agency for Toxic Substances and Disease Registry, Environment Canada, Health
Canada, and the U.S. Environmental Protection Agency due to its toxicity to humans and
wildlife. The following sections provide information on the mode of toxic action of Cd
in freshwater aquatic organisms, and the factors which affect the toxicity and
bioavailability of Cd in the aquatic environment. Typically, values presented in the
following sections reflect dissolved concentrations of Cd from the dissolution of Cd salts.
To facilitate the assessment of the toxicological data to derive short-term maximum and
long-term average WQGs for Cd, all of the toxicological data were normalized to a
standard hardness of 50 mg/L CaCO3. The details and justification of the normalization
procedure are presented in Section 9.3.
7.1 Mode of Toxicity
Cd is known to interfere with the uptake of calcium at calcium binding sites of aquatic
organisms (Verbost et al. 1987; 1989; Reid and McDonald 1988), which is linked to
adverse effects which include increased mortality, decreased growth, and decreased
reproductive capacity and success.
In aquatic plants and algae, Cd uptake causes adverse effects by inhibiting
photosynthesis, growth, and chlorophyll synthesis, therefore decreasing water and
nutrient uptake (Faller et al. 2005). In aquatic invertebrates, Cd inhibits the influx of
38
calcium, causing cellular damages (Soegianto et al. 1999), and affects osmoregulation
(Felton et al. 2008). In fish, Cd inhibits calcium uptake at the gills (Verbost et al.
1987; 1989). The magnitude of calcium inhibition depends on the concentration,
bioavailability in the aquatic environment, and exposure time (Verbost et al. 1989).
7.2 Toxicity to Algae and Aquatic Plants
There have only been a few studies completed for evaluating the toxicity of Cd to algae
and aquatic plants. However, the applicable data have been acquired and evaluated for
the purpose of deriving a short-term maximum and/or long-term average WQG for Cd.
While Cd is generally considered to be a non-essential metal as it has no known
biological/biochemical functions in plants (Drost et al. 2007), it is taken up by plants
quite readily. The uptake of Cd may affect metabolic activities, leading to adverse effects
including inhibition of photosynthesis and growth, and a decrease in water and nutrient
uptake (Faller et al. 2005). Kwan and Smith (1991) suggested that Cd competes with
calcium for binding sites in plants, interfering with calcium uptake; however, their
experiment showed mixed results. A later study by Faller et al. (2005) reported that
cadmium (Cd2+
) binds to calcium (Ca2+
) receptors during photoactivation, interfering
with photosynthesis. Many plants (including aquatic plants) can become acclimated to
elevated levels of Cd by producing phytochelatins, which bind with the cadmium ions,
effectively forming complexes that mitigate the competitive nature of the ions (Grill et al.
1985; Kobayashi et al. 2006). Similarly, in tests conducted with the algae, Selenastrum
capricornutum (now known as Pseudokirchneriella subcapitata), reductions in growth
had recovered with the addition of the chelating agent ethylenediaminetetraacetic acid
(EDTA; Thompson and Couture 1990).
Duckweed (L. minor), a common freshwater macrophyte in BC waters, was studied in
72-hour (h) and 7-day (d) exposures (Drost et al. 2007). In the 72-h exposure, an
effective concentration affecting 50% of the population (EC50) for growth rate of 393
μg/L Cd was observed. In the same study, long-term exposure to Cd resulted in a 7-d

39
EC50 of 214 μg/L Cd. Both experiments were conducted in exposures with a water
hardness of 166 mg/L CaCO3. However, the growth rate of duckweed recovered to that
observed in control exposures after being removed from the treatment for an additional
72-h. While growth rates recovered, the concentration of Cd in the tissues of the plant
did not decrease (i.e., there was no depuration of the Cd; Drost et al. 2007). In a study
conducted with the green alga, P. subcapitata, Källqvist (2009) found that the observed
72-h EC50 for growth ranged from 9.4 to 199 μg/L Cd over an increasing range of water
hardness (i.e., 3.4 to 46.2 mg/L CaCO3).
7.3 Toxicity to Aquatic Invertebrates
Toxicity of Cd to aquatic invertebrates is highly variable between taxonomic groups.
Within a taxonomic group, variability in observed effects is often dependent on factors
including life-stage, measured endpoint (e.g., reproduction), duration of exposure, and
water quality in the laboratory exposures (e.g., water hardness). In aquatic invertebrates,
the adsorption of Cd causes cellular damages that include structural changes to the
epithelial cells and decreases in the number of apical microvilli, basal infoldings, and
mitochondria of crustacean gills (Soegianto et al. 1999). Cd also inhibits the influx of
calcium, by competing for binding-sites at the environment-tissue interface, which affects
osmoregulation (Felton et al. 2008). To facilitate the assessment of toxicity of Cd to
aquatic invertebrates, a summary of the short-term and long-term studies are discussed
separately in the following sections.
7.3.1 Short-Term Toxicity to Aquatic Invertebrates
Adverse effects from short-term exposure to Cd in aquatic invertebrates vary greatly
between the taxonomic groups. Crustaceans (e.g., cladocerans and amphipods) are
among the most sensitive groups along with the hydra, Hydra viridissima, and various
mussel species, while the aquatic life-stage of various insects including the midges,
mayflies, and stoneflies are more tolerant during short-term exposure (McCahon and

40
Pascoe 1988; Suedel et al. 1997; Ward and Robinson 2005; Shaw et al. 2006; Brinkman
and Johnston 2008).
From an assessment of the literature, the cladoceran, D. magna, was one of the most
sensitive invertebrate species to Cd toxicity. In toxicity tests that were conducted in
exposures with water hardness of 160 to 180 mg/L CaCO3, the reported 48-h lethal
concentration affecting 50% of the population (LC50) was 26 μg/L Cd (95% confidence
interval [CI95] not reported; Ward and Robinson 2005). However, in the same study, the
authors reported that D. magna exhibited a wide range of sensitivity to Cd, depending on
the genetic strain used in each of the eight tests. The 48-h LC50 in the eights tests ranged
from 26 to > 120 μg/L Cd. The amphipod, Hyalella azteca, was also found to be
sensitive in short-term exposures to Cd. Suedel et al. (1997) reported a 96-h LC50 of 2.8
μg/L Cd (CI95: 2.4 - 3.3 μg/L Cd) in toxicity tests performed at a water hardness between
6 and 28 mg/L CaCO3. Holdway et al. (2001) reported a 96-h LC50 of 3.0 μg/L Cd (CI95
not reported) for the hydra, H. viridissima, in toxicity tests conducted at a water hardness
between 19 and 20 mg/L CaCO3. Mussels were also determined to be relatively sensitive
to Cd exposure. For example, Black (2001) reported a 96-h LC50 of 19.1 μg/L Cd (CI95
not reported) in exposures performed at a hardness of 84 mg/L CaCO3.
Generally, the aquatic life-stage of insects such as mayflies, midges, caddisflies, and
stoneflies is relatively more tolerant of short-term exposure to Cd. Mebane et al. (2012)
performed toxicity tests with the mayfly larvae, Baetis tricaudatus, in exposures with
water hardness between 21 and 59 mg/L CaCO3. The 96-h LC50 reported from the test
ranged between 16 μg/L Cd (CI95: 1 - 314 μg/L Cd) and > 444 μg/L Cd. In the same
study, another species of mayfly, Rithrogena sp., was tested in similar exposures; the
observed 96-h LC50 ranged from > 50 to 157 μg/L Cd (CI95: 90 - 273 μg/L Cd). In
another study with the mayfly, R. hageni, Brinkman and Johnson (2008) reported a
comparatively higher 96-h LC50 of 10,500 μg/L Cd (CI95 not reported), in exposures with
water hardness of 48 mg/L CaCO3. In toxicity tests performed by Watts and Pascoe
(2008), two species of midge larvae (Chironomus tentans [now known as Chironomus

41
dilutus] and Chironomus riparius) were tested in exposures with water hardness of 114
mg/L CaCO3. The 48-h LC50s reported from the toxicity tests were 9,340 μg/L Cd (3,400
- 25,300 μg/L Cd) for C. dilutus and 2,620 μg/L Cd (CI95: 1,800 - 3,800 μg/L Cd) for C.
riparius. Results from other studies with the midge, C. dilutus, showed similar results
with a 48-h LC50 of 29,560 μg/L Cd (CI95: 21,250 - 37,870 μg/L Cd) in exposures with
water hardness between 6 and 28 mg/L CaCO3.
7.3.2 Long-Term Toxicity to Aquatic Invertebrates
In the studies of long-term exposure to Cd that were evaluated, crustaceans (e.g.,
cladocerans and amphipods) were the most sensitive aquatic invertebrate species.
Elnabarawy et al. (1986) reported a 7-d EC16 for reproduction of 0.2 µg/L Cd for
Ceriodaphnia reticulata in exposures conducted with water hardness of 240 mg/L
CaCO3. In the same study, the 14-d EC16 for reproduction for D. pulex was also reported
as 0.2 μg/L Cd (CIs not reported), however these estimates are considered less reliable
due to limitations of the study design and statistical analyses. Chadwick Ecological
Consultants, Inc. (2004) also determined that reproduction in cladocerans was more
sensitive in long-term exposures than other endpoints such as survival. The 21-d
inhibitory concentration causing a 20% inhibition in tested organisms (IC20) for
reproduction in D. magna was reported as 2.23 μg/L Cd in exposures with water hardness
of 99 mg/L CaCO3.
In long-term exposures to Cd, biomass was also determined to be relatively more
sensitive than survival, indicating that sub-lethal concentrations of Cd in aquatic habitats
can have adverse effects on aquatic invertebrates. In tests conducted with the amphipod,
H. azteca, Ingersoll and Kemble (2001) reported a 28-d IC25 for biomass of 0.51 μg/L Cd
(CI95 not reported) compared to a 28-d LC25 of 2.1 μg/L Cd (CI95 not reported) in
exposures performed at a water hardness of 280 mg/L CaCO3. Similar results were
reported from Chadwick Ecological Consultants, Inc. (2004), where the 28-d IC20 for
biomass in tests conducted with H. azteca ranged from 0.50 to 0.76 μg/L Cd (CI95 not
reported) in exposures with water hardness of 126 and 153 mg/L CaCO3, respectively.

42
In a study completed by Suedel et al. (1997), the long-term exposure of H. azteca, D.
magna, and C. reticulata to Cd was evaluated. Of the crustaceans, H. azteca was
determined to be the most sensitive to Cd in both 7-d and 14-d exposures. The lowest
observed effect concentration (LOEC) for survival reported in the study for the 14-d test
was 0.25 μg/L Cd. In exposures with the cladoceran, C. reticulata, conducted at a similar
water hardness (between 6 and 28 mg/L CaCO3), the 14-d LOEC for survival was
reported as 13 μg/L Cd. In tests with the cladoceran, D. magna, exposures with a higher
water hardness (between 69 and 87 mg/L CaCO3) were used. The 7-d LOEC for survival
was reported as 10 μg/L.
Similar to the results of the assessment of short-term toxicity to aquatic invertebrates, it
was found that the aquatic life-stage of insects such as midges and mayflies are relatively
more tolerant of long-term exposure to Cd. Ingersoll and Kemble (2001) performed life-
cycle tests (60-d) with the midge, C. dilutus. The life-cycle tests are designed to evaluate
multiple endpoints, including developmental (e.g., survival, growth, and emergence) and
reproductive (e.g., fecundity) endpoints. The authors reported that the percent of eggs
hatched was the most sensitive endpoint in the test. The IC25 was reported as 4.0 μg/L
Cd (CI95 not reported) at a water hardness of 280 mg/L CaCO3. For the developmental
endpoints, individual weight was observed to be the most sensitive of the endpoints
measured with an IC25 of 9.9 μg/L Cd (CI95 not reported). In 10-d tests with the mayfly,
R. hageni, Brinkman and Johnson (2008) measured the effects of long-term exposure to
Cd on moulting rate and survival. The authors observed a LOEC for both moulting rate
and survival of 1,880 μg/L Cd in exposures with water hardness of 48 mg/L CaCO3.
In addition to the aquatic life-stage of insects, mussels also exhibited a relative tolerance
to long-term exposure to Cd. Lasee (1991) observed a LOEC for anterior shell length in
Lampsilis ventricosa of 10 μg/L in tests using a water hardness of 145 mg/L CaCO3.
Similar results were obtained from a study completed by Wang et al. (2010); the reported
IC20 in the 28-d test with L. siliquoidea was 5.0 μg/L Cd in exposures with a water
hardness of 47 mg/L CaCO3.

43
7.4 Toxicity to Fish
Toxicity of Cd to fish is highly variable between taxonomic groups. Within a taxonomic
group, variability in observed effects is often dependent on factors including the
measured endpoint (e.g., reproduction), duration of exposure, water quality in the
laboratory exposures (e.g., water hardness), and life-stage. For example, with the
exception of newly-hatched steelhead trout (O. mykiss) alevins, which were more tolerant
to Cd exposure, toxicity was greater for the early life-stages (i.e., swim-up and parr) than
for smolts (Chapman 1978). Similarly, Reid and McDonald (1988) found Cd to be more
toxic to juvenile rainbow trout relative to adult fish. In fish, as in other aquatic
organisms, Cd inhibits the influx of calcium ions through receptor sites in the gills, which
may lead to cellular impairment and/or death (Verbost et al. 1987; 1989). To facilitate
the assessment of toxicity of Cd to fish, a summary of the short-term and long-term
studies are discussed in the following sections.
7.4.1 Short-Term Toxicity to Fish
Cd is highly toxic to salmonid fish during short-term exposure, and in particular, to the
rainbow trout (O. mykiss; e.g., Buhl and Hamilton 1991; Davies et al. 1993; Hansen et al.
2002a; Sloman et al. 2003; Besser et al. 2007; Mebane et al. 2012). Of the studies
examined from the primary literature, rainbow trout was the most sensitive fish species,
exhibiting a relatively wide sensitivity range depending on life-stage and water quality
(e.g., water hardness, pH, and water temperature). Hansen et al. (2002a) ran a series of
toxicity tests with rainbow trout fry in exposures with varied water hardness (29.3 to 89.3
mg/L CaCO3), pH (6.5 to 7.5), and water temperature (7.6 to 12.1°C). The reported 120-
h LC50 ranged from 0.35 (CI95: 0.33 - 0.37 μg/L Cd) to 2.07 μg/L Cd (CI95: 1.83 - 2.35
μg/L Cd). Similarly, Mebane et al. (2012) reported a 96-h LC50 for fry that ranged
between 0.34 (CI95: control - 0.50 μg/L Cd) and < 2.9 μg/L Cd. Cuisimano (1986) also
reported a similar 96-h LC50 in exposures with similar pH (between 5.7 and 7.0) and very
soft water (9.2 mg/L CaCO3) of between < 0.5 and 0.7 μg/L Cd (CI95: 0.6 - 0.8 μg/L Cd).
The authors reported a markedly higher 96-h LC50 of 28 μg/L Cd (CI95: 22 - 37 μg/L Cd)

44
in exposures with pH 4.7. Other salmonids were notably more tolerant of Cd in short-
term exposures. Hansen et al. (2002a) reported a 120-h LC50 for the bull trout, S.
confluentus, that ranged from 0.83 (CI95: 0.76 - 0.91 μg/L Cd) to 5.23 μg/L Cd (CI95: 4.63
- 5.89 μg/L Cd) in exposures with varied water hardness (29.3 to 89.3 mg/L CaCO3), pH
(6.5 to 7.6), and water temperature (7.6 to 12.1°C). Chapman (1978) conducted a study
that evaluated the effects of short-term exposure to Cd on the chinook salmon,
Oncorhynchus tshawytscha. The 96-h LC50 reported from the test varied depending on
the life-stage of the fish. The most sensitive of the life-stages was the swim-up stage.
The reported 96-h LC50 in exposures with water hardness of 23 mg/L CaCO3 was 1.8
μg/L Cd (CI95: 1.7 - 2.0 μg/L Cd). The least sensitive of the life stages was the newly-
hatched alevin with a reported 96-h LC50 of > 26 μg/L Cd.
Generally, non-salmonid fish were as sensitive to Cd during short-term exposures as the
salmonid fish, with the exception of rainbow trout. The shorthead sculpin (Cottus
confusus) exhibited the lowest 96-h LC50 of the non-salmonid fishes of 0.93 μg/L Cd
(CI95: 0.62 - 1.4 μg/L Cd; Mebane et al. 2012). Newly-hatched mottled sculpin (Cottus
bairdi) were also relatively sensitive to short-term exposure to Cd with a reported 96-h
LC50 of 2.9 μg/L Cd (CI95: 2.2 - 3.8 μg/L Cd; Besser et al. 2007). Palawski et al. (1985)
reported a 96-h LC50 for the striped bass (Morone saxtilis) that ranged from 4 (CI95: 3 - 6
μg/L Cd) to 75 μg/L Cd (CI95: 59 - 96 μg/L Cd) in exposures with increasing hardness
(40 to 455 mg/L CaCO3).
7.4.2 Long-Term Toxicity to Fish
In long-term toxicity studies, the rainbow trout was the most sensitive fish species to Cd.
Other salmonid and non-salmonid fish exhibited similar sensitivities to long-term
exposure to Cd. Of the endpoints tested, growth was observed to be more sensitive than
survival, indicating that sub-lethal concentrations of Cd in aquatic habitats can have
adverse effects on fish. In addition, few studies were available on the effects of Cd
exposure on physiology or behaviour of fish, but the results of these studies indicated that
these endpoints were not as sensitive relative to growth.

45
In toxicity tests with the early life-stage rainbow trout, Mebane et al. (2008) reported a
62-d LOEC for growth (i.e., weight) of 0.16 μg/L Cd in exposures with water hardness of
29.4 mg/L CaCO3; however, the authors reported that no clear dose-response relationship
was apparent for this endpoint. Comparatively, the 62-d LC10 from the same test was
reported as 1.6 μg/L Cd (CI95 not reported). Besser et al. (2007) conducted 28-d toxicity
tests with rainbow trout at the swim-up stage. The authors reported that the 28-d LOECs
for biomass and survival were the same, 2.7 μg/L Cd in exposures with water hardness of
103 mg/L CaCO3. Scott et al. (1993) reported from tests with juvenile rainbow trout, that
in 7-d exposures with water hardness of 120 mg/L CaCO3, the LOEC for behaviour (i.e.,
predator avoidance) was 2 μg/L Cd. Hansen et al. (2002b) reported a 55-d LOEC for
growth and survival in bull trout (S. confluentus) of 0.787 μg/L Cd in exposures with a
water hardness of 30.6 mg/L CaCO3. Brown trout (Salmo trutta) exhibited a similar
response in 30-d exposures with water hardness of 29.2 mg/L CaCO3 with a reported IC20
for biomass of 0.87 μg/L Cd (CI95 not reported; Brinkman and Hansen 2007). However,
the IC20 was markedly higher in additional tests from the same study that were conducted
with higher water hardness of 67.6 and 151 mg/L CaCO3. The IC20s reported from these
tests were 2.18 and 6.62 μg/L Cd (CI95 not reported). Of the salmonids evaluated from
the primary literature, coho salmon (Oncorhynchus kisutch) were found to be the least
sensitive to long-term Cd exposure. In 27-d exposures with water hardness of 45 mg/L
CaCO3, Eaton et al. (1978) reported a LOEC for biomass of 3.4 μg/L Cd. In longer
exposures (i.e., 47- and 82-d), the reported LOEC was 12.5 μg/L Cd.
Sub-lethal effects were also observed in non-salmonid fish, including the mottled sculpin
(C. bairdi). Besser et al. (2007) reported a LOEC for growth of 1.3 μg/L Cd in 21-d
exposures with water hardness of 103 mg/L CaCO3. Similarly, the 21-d LOEC for
survival was also reported as 1.3 μg/L Cd. Castillo and Longley (2001) conducted a
study to evaluate the effects of long-term exposure to Cd on the fathead minnow. Growth
was determined to be more sensitive in the tests. The 7-d LOEC for growth was reported
as 8.0 μg/L Cd in exposures with water hardness of 292 mg/L CaCO3. Comparatively,
the 7-d LOEC for survival ranged between 16.5 and 213.3 μg/L Cd in exposures with

46
water hardness varying between 261 and 285 mg/L CaCO3. Although few long-term
exposure studies have been completed with lake trout (Salvelinus namaycush), northern
pike (Esox lucius), white sturgeon (Acipenser transmontanus), and white sucker (C.
commersoni), these species appear to be less sensitive to Cd, reporting no low-effect
values at the low end of the range exhibited by other species. Eaton et al. (1978) reported
a 41- and 74-d LOEC for early life-stage biomass of 12.3 μg/L Cd in exposures with
water hardness of 45 mg/L CaCO3. In the same study, a similar result was reported for
early life-stage northern pike with a 35-d LOEC for biomass of 12.9 μg/L Cd observed.
For the early life-stage of the white sucker, a 40-d LOEC for biomass of 12.0 μg/L Cd
was reported. Vardy et al. (2011) reported a 27-d LC20 for early life-stage white sturgeon
of 8.7 μg/L Cd (CI95: 7.9 - 9.5 μg/L Cd) in exposures with water hardness of 70 mg/L
CaCO3.
7.5 Toxicity to Amphibians
Very few studies have been conducted on the toxicity of Cd to amphibians. Nebeker et
al. (1995) reported a 96-h LC50 for the northwestern salamander (Ambystoma gracile) of
468 µg/L Cd in exposures with water hardness of 45 mg/L CaCO3. Sub-lethal
concentrations of Cd in long-term (i.e., 10- and 24-d) exposures from the same study
resulted in a LOEC for growth (weight) of 227 µg/L Cd and a LOEC of 193 µg/L Cd for
growth (weight), respectively.
7.6 Factors Affecting the Bioavailability and Toxicity of Cadmium
Cd is most toxic to aquatic organisms in its ionic form (i.e., Cd2+
), as it interacts with ion
receptors (i.e., ligands) at the environment-tissue interface. Therefore, factors that
influence the uptake of the Cd ion by aquatic organisms and factors that affect the
bioavailability of the Cd ion in the water column and associated sediments determine the
magnitude of toxicity to freshwater aquatic organisms. The ambient water quality
conditions that influence the toxicity and bioavailability of Cd include hardness,
alkalinity, pH, dissolved organic matter (DOM), and temperature.

47
7.6.1 Hardness and Alkalinity
Water hardness and related factors (including the concentration of major cations)
influence the toxicity of specific metals (i.e., divalent metals) by directly competing with
those metals for binding with Ca2+
and Na+ channels on organism tissues (such as gills).
Additionally, other cations including Na+ and H
+ provide additional competition with Cd
(and other divalent metals) for binding on tissue receptors.
Alkalinity is a measure of the buffering capacity (i.e., ability to neutralize acids) of the
system and is a function of the concentration of carbonate (CO32-
). Carbonate will bind
with Cd (and other metals) to form insoluble metal complexes that settle out onto the
sediments, reducing the bioavailability of the metal in the system. Hardness and
alkalinity (as well as pH) are often correlated in aquatic systems, as one of the primary
constituents of hardness in natural waters is CaCO3. Hardness and alkalinity both reduce
the toxicity of some divalent metals (such as Cd) by competing with the metal for Ca2+
binding sites and providing a ligand for complexation, thus reducing the bioavailability of
Cd in the system. In the majority of the studies compiled, both hardness and alkalinity
increased in the exposure chamber, making it difficult to discern the relative contribution
of metal competition and metal complexation on the observed toxicity in the experiment.
Källqvist (2009) explored the relationship between water hardness and toxicity of Cd to
the green alga (P. subcapitata) in low-hardness systems (characteristic of the
Fennoscandian region of Europe). The study looked at the effects of Cd exposure on the
growth rate of the algae. The observed EC50 values increased with increasing hardness,
even at the relatively low water hardness in the exposures (3 treatments: 6.2, 16.2, and
46.2 mg/L CaCO3). The 72-h EC50 for growth ranged from 29 μg/L Cd (95% confidence
interval [CI95]: 26 - 33 μg/L Cd) to 199 μg/L Cd (CI95: 158 - 265 μg/L Cd; Källqvist
2009). The exposures were spiked with Ca2+
to obtain the desired water hardness, and
thus the reduction in toxicity can be attributed primarily to the increased competition of
the Ca2+
ions with Cd2+
(i.e., reduced uptake of Cd) rather than the reduction in
bioavailability caused by complexation with CO32-
.

48
Chapman et al. (1980) looked at the effects of water hardness on the short-term and long-
term toxicity of Daphnia magna in water-only exposures. The 48-h LC50 values
calculated from the results increased by 4.9 times as hardness increased from 51 to 209
mg/L CaCO3. While other water quality conditions remained similar in the treatments,
both alkalinity and pH (to a lesser degree) increased, resulting in the potential of both to
contribute to the reduced toxicity observed. Similar results were obtained in long-term
exposures. The 21-d maximum acceptable toxicant concentration (MATC) for
reproduction increased from 0.15 to 0.44 μg/L Cd as hardness increased from 53 to 209
mg/L CaCO3 (Chapman et al. 1980).
Several studies have looked at the relationship between short-term and long-term toxicity
of Cd at varying water hardness. For example, in a study conducted by Brinkman and
Hansen (2007), the 96-h LC50 for brown trout (Salma trutta) fry increased from 1.23 to
10.1 μg/L Cd with increasing water hardness (from 30.6 to 151 mg/L CaCO3), while
other water quality variables, except alkalinity, remained constant. Similar results were
observed in long-term tests where early life stage (egg to 41 days post-hatch) exposures
with brown trout showed increasing MATCs for swim-up survival (from 3.52 to 13.6
μg/L Cd) with increasing hardness. Similarly, toxicity tests with fry resulted in 30-d
MATCs for survival ranging from 1.02 to 6.54 μg/L Cd as hardness increased from 30 to
150 mg/L CaCO3. Further, the IC20 (endpoint: biomass) for early life stage fish increased
from 2.22 to 13.6 μg/L Cd (CI95 not reported) and in fry increased from 0.87 to 6.62 μg/L
Cd (CI95 not reported) over the 3 hardness treatments (Brinkman and Hansen 2007).
Palawski (1985) designed a study to assess the sensitivity of striped bass (Morone
saxatilis) to Cd under varying water quality conditions. The 96-h LC50 of 4 μg/L Cd
(CI95: 3 - 6 μg/L Cd) in 40 mg/L CaCO3 water hardness increased to 75 μg/L Cd (CI95: 59
- 96 μg/L Cd) in exposure chambers with hardness of 455 mg/L CaCO3.
However, Davies et al. (1993) showed that the ameliorating effects of hardness were
greatly reduced when magnesium alone was used to increase hardness. The 96-h LC50
was calculated from toxicity tests in exposures with water hardness of 50, 200, and 400
mg/L CaCO3. In these exposure chambers, alkalinity was held constant at 30 mg/L.

49
While the observed LC50, which ranged from 3.08 μg/L Cd (CI95: 2.80 - 3.39 μg/L Cd) to
5.92 μg/L Cd (CI95: 4.34 - 9.11 μg/L Cd), increased as water hardness increased, a
statistically significant effect was not observed.
7.6.2 pH
The pH of the aquatic system affects both the uptake of Cd and bioavailability of the Cd
ion. In acidic waters, concentrations of the free Cd2+
ion can account for up to 90% of
total Cd due to the dissociation of Cd from metal-ligand complexes (Campbell and
Stokes 1985). This is supported by models showing that the Cd2+
ion is the predominant
form of Cd in acidic conditions (i.e., pH < 7), but forms insoluble complexes with
carbonate (CO32-
) and hydroxide (OH-) as pH increases above 7 (Bervoets and Blust
2000; Gueguen et al. 2003). At low pH, the increased concentration of hydrogen ions
(H+) increases competition with Cd for binding sites on cell surfaces and may also affect
the membrane potential of the cell, both of which can reduce the toxicity of Cd
(Campbell and Stokes 1985). However, at pH above 7, the Cd ion is less bioavailable
and therefore exposure is limited.
Several studies support the hypothesis that Cd is most toxic between pH 6 and 7. Kwan
and Smith (1991) observed that the uptake of Cd by the aquatic plant L. minor was
greatest at pH 6, suggesting that Cd is most toxic at this pH. In the same experiment,
uptake was reduced in exposures with pH above 8 and below 4. Hahne and Kroontje
(1973) also reported that in exposures with pH greater than 8, Cd forms insoluble
hydroxide complexes, which greatly reduce the bioavailability of the metal. Further, in
an experiment with the alga, Stichococcus bacillaris, the toxicity of Cd was studied under
varying pH. The largest decrease in growth (approximately 60% of control) and
chlorophyll a content (25-30% of control) was observed between pH 6 and 7. At pH 3,
the toxic effects of Cd were greatly reduced (Skowronski et al. 1991). The results of
these studies corroborate the observations in other studies with algae that increased
adsorption and uptake of Cd occurs as pH increases from 4 to 7.5 (Skowronski 1986a;
1986b).

50
A similar trend has also been observed in experiments with fish. Cuismano et al. (1986)
reported 96-h LC50 values for steelhead trout in soft water ranging from 28 μg/L Cd
(CI95: 22 - 37 μg/L Cd) at pH 4.7 to < 0.5 μg/L Cd at pH 7.0. Similarly, in long-term
exposures (i.e., 7 days) the LC50 for steelhead trout decreased from 6.3 μg/L Cd (CI95: 4.6
- 8.9 μg/L Cd) to < 0.5 μg/L Cd as pH increased from 4.7 to 7.0 (Cuismano et al. 1986).
Mortality after 24 hours was also greater for juvenile rainbow trout exposed to Cd at pH
7.8 (28.6%) compared to pH 4.8 (0%) in hard water, as well as in soft water (34.8% and
19.0%, respectively; Reid and McDonald 1988). In a study with rainbow trout and bull
trout, Hansen et al. (2002a) reported increased toxicity at pH 7.5 relative to pH 6.5. In
this study, the 120-h LC50 for rainbow trout increased from 0.53 μg/L Cd (CI95: 0.48 -
0.59 μg/L Cd) at pH 7.5 to 0.84 μg/L Cd (CI95: 0.76 - 0.93 μg/L Cd) at pH 6.5. For bull
trout, the 120-h LC50 increased from 0.83 μg/L Cd (CI95: 0.76 - 0.91 μg/L Cd) at pH 7.5
to 2.41 μg/L Cd (CI95: 2.15 - 2.70 μg/L Cd) at pH 6.5.
However, other studies have reported contrasting results. Schubauer-Berigan et al.
(1993) ran short-term toxicity tests with the cladoceran, Ceriodaphnia dubia; the
amphipod, H. azteca; the fathead minnow, P. promelas; and, the oligochaete,
Lumbriculus variegatus at three pH levels: 6.3, 7.3, and 8.3. Cd was most toxic to C.
dubia and H. azteca at pH 8.3 and least toxic at pH 6.3, while toxicity to P. promelas and
L. variegatus remained constant with increasing pH. Similarly, Musko et al. (1990)
found that Cd was more toxic to the amphipod Gammarus fossarum at pH 8.5 than 6.0.
In addition, Cd was more acutely toxic to H. azteca at pH 5 than 6, while damselflies
(Enallagma sp.) were more sensitive to Cd at pH 3.5 than 4.5 (Mackie 1989). In contrast,
the clams Pisidium casertanum and P. compressum, and the snail Amnicola limosa
exhibited higher mortality when exposed to Cd at pH 4.5 than 3.5 (Mackie 1989).
In insects, Cd uptake is likely a mixture of internal intake and adsorption to the
exoskeleton. Uptake was greater in Ephemeroptera at pH 7 than pH 5 (Gerhardt 1990).
However, survival was greater at pH 7 than pH 5, suggesting most Cd was taken up in the
exoskeleton and did not affect the organism (Gerhardt 1990). In general, Cd uptake over
6 hours in the midge, C. riparius, increased as pH increased from 5.5 to 9.0, before

51
decreasing at pH 10, though the magnitude of uptake depended on the pH in the
acclimation chambers (Bervoets and Blust 2000). The authors suggest that physiological
changes occur in the larvae during acclimation that influence the uptake of Cd during
exposure (i.e., that pH influences Cd uptake as well as metal speciation).
7.6.3 Dissolved Organic Matter
Dissolved organic matter (DOM), including humic acid and fulvic acid, may reduce the
bioavailability of Cd by binding to free Cd2+
ions, but competition for the DOM binding
sites from other cations (e.g., Ca2+
and Mg2+
) may reduce Cd binding efficacy. While the
binding of calcium with DOM may also inhibit the ameliorating effects of water
hardness, the calcium ions also compete for the binding sites at the environment-tissue
interface. Penttinen et al. (1998) showed that Cd did not bind to DOM as readily in
conditions with elevated water hardness. Thus, at low water hardness, toxicity to D.
magna was reduced in the presence of DOM. At higher water hardness, less Cd was
bound to the DOM, but toxicity to D. magna was comparatively low due to the
ameliorating effects of the increased Ca2+
ions. Similar results were observed in studies
with the zebrafish (Danio rerio), where survival at low hardness was relatively higher
compared to treatments with elevated water hardness (Meinelt et al. 2001).
In contrast, Winner (1984) found that the addition of 1.5 mg/L of humic acid increased
the toxicity of Cd to daphnids; the observed 72-h LC50 decreased from 87.8 to 71.1 µg/L
Cd. Survival in long-term exposures (i.e., 20 to 42 days) also decreased in treatments
with humic acid (Winner 1984; Winner and Gauss 1986). However, the addition of
humic acid did not affect Cd bioaccumulation over 7 days (Winner and Gauss 1986).
Winner and Gauss (1986) suggested that this discrepancy between toxicity and
bioaccumulation could be due to adsorption of Cd at the gill surface, rather than
accumulating in the body tissue. Oikari et al. (1992) also found that humic acid
increased the short-term toxicity of Cd to D. magna (48-h LC50 of 12 µg/L Cd compared
to 99 µg/L Cd with no humic acid; CI95 not reported). In another study, the addition of
humic acid (50 mg/L) had mixed results on toxicity tests with Daphnia pulex.

52
Stackhouse and Benson (1988) reported that the addition of humic acid significantly
increased (p < 0.05) the LC50 across all measured exposure periods. For example, the 24-
h LC50 increased from 179.9 μg/L Cd (CI95: 159.9 - 203.8 μg/L Cd) to 739.3 μg/L Cd
(CI95: 680.1 - 816.8 µg/L Cd) with the addition of humic acid. Similarly, the 96-h LC50
increased from 32.4 µg/L Cd (CI95: 29.6-35.7 µg/L Cd) to 112.6 µg/L Cd (CI95: 101.2-
127.9 µg/L Cd) with the addition of humic acid (Stackhouse and Benson 1988).
However, the addition of smaller volumes of humic acid (i.e., 0.5 and 5 mg/L) increased,
decreased, or did not significantly change the LC50, depending on the exposure period
measured (Stackhouse and Benson 1988). In a separate test, the concentration of free Cd
ions decreased as the volume of humic acid increased, suggesting that the decrease in
observed toxicity reported in the 50 mg/L humic acid treatment was due to the formation
of metal-ligand complexes (Stackhouse and Benson 1988). Supporting this, the
bioaccumulation of Cd in D. magna after 96 hours was significantly decreased (p < 0.05)
with 50 mg/L humic acid compared to the control (24.6 ± 0.9 µg/g Cd DW compared to
65.0 ± 5.0 µg/g Cd DW; Stackhouse and Benson 1989).
The presence of DOM has also been shown to reduce the toxicity of Cd to algae. Koukal
et al. (2003) found that the addition of 1 mg/L humic acid significantly decreased
(p<0.05) photosynthetic inhibition of P. subcapitata exposed to 200 µg/L Cd (33.2 to
45% inhibition in treatments with humic acid versus 52% inhibition without humic acid).
The observed decrease in toxicity was even more pronounced when 5 mg/L of humic acid
was added (9.7 to 26.7% inhibition; Koukal et al. 2003). However, the addition of fulvic
acids (from the Suwannee River in the United States) did not reduce Cd toxicity to P.
subcapitata (Koukal et al. 2003). The authors suggested that Cd and fulvic-acid
complexes dissociate more readily than Cd and humic-acid complexes. Secondly, they
proposed that fulvic acids do not adsorb to algae as well as humic acids, suggesting that
fulvic acids do not shield the cell membranes from Cd as well (Koukal et al. 2003).
In experiments with fish, DOM was also found to reduce the toxicity of Cd. In a study
with rainbow trout exposed to copper and Cd in soft water for 15 days, survival increased

53
from 70% to 87% with the addition of 5 mg/L DOM; survival further increased to 100%
with the addition of 10 and 20 mg/L DOM (Hollis et al. 1996). However, Cd binding at
the gill sites did not differ significantly between treatments. Similarly, Hollis et al.
(1996) observed that in exposures with 5 mg/L DOM and various metals, a significantly
increased concentration of Cd at the gill binding sites of trout was observed relative to the
control treatments, but significantly less Cd on the gills than in exposures with metals
alone. This suggests that other metals may have increased DOM binding efficacy relative
to Cd. However, when juvenile rainbow trout were exposed to a mixture of six metals for
74 hours, the addition of up to 10 mg/L natural organic matter (NOM) did not decrease
Cd adsorption on the gills, though it did increase survival of the fish (Richards et al.
2001). Using three different sources of NOM, Richards et al. (2001) found that adding
allochthonous NOM resulted in the highest fish survival.
In a 144-h multi-factor experiment designed to evaluate the effects of calcium and DOM
on Cd toxicity, zebrafish embryos and larvae were exposed to multiple levels of Cd,
calcium, and DOM. Survival was highest in the high calcium, no DOM treatment (90 -
100% survival) over the entire range of Cd treatments (0 - 9.3 μg/L Cd; Meinelt et al.
2001). The high calcium with DOM treatment produced similar results, however survival
was reduced (40% after 144 h) in the 9.3 μg/L Cd exposure. Survival was lowest in the
low calcium without DOM treatment (reaching 0% in the 4.2 and 9.3 μg/L Cd treatments
(Meinelt et al. 2001). In this study, Meinelt et al. (2001) showed that both DOM and
calcium contribute to reducing the toxicity of Cd, but interactions between DOM and
calcium need to be considered.
7.6.4 Temperature
As many aquatic organisms are ectotherms, water temperature may affect the toxicity of
Cd. Changes in water temperature can alter feeding activity, swimming speed, metabolic
rate, and physiological state (Donker et al. 1998). Elevated water temperature may
increase metabolic demand and respiration, increasing the potential uptake of
contaminants through the gills (Cairns et al. 1975). Several researchers have investigated
54
the hypothesis that toxicity of Cd increases with increasing temperature. For example,
Edgren and Notter (1980) found that perch (Perca fluviatilis) fingerlings kept at 15°C
accumulated radioactive Cd (Cd-115) in greater quantities (BCF: 17) than fish kept at
5°C (BCF: 7.5) after 39 days. After exposure to 0.5 µg/L Cd for an additional 25 days,
12 fish were euthanized and analysed. Cd accumulated primarily in the kidney (9.0
mg/kg Cd DW), and to a lesser degree in the liver (5.0 mg/kg Cd DW) and gills (3.6
mg/kg Cd DW; Edgren and Notter 1980). In another study, Yang and Chen (1996)
observed that the kidney, liver, and gills of the Japanese eel (Anguilla japonica) showed
greater accumulation of Cd when exposed to higher temperatures. For example, the
concentration of Cd in the kidney measured approximately 5 mg/kg Cd WW in the 15°C
treatment compared to approximately 33 mg/kg wet weight (WW) in the 30°C treatment
over the same exposure period. Similarly, Cd uptake in the freshwater plant L. minor
increased as temperature increased from 4°C (approximately 1 µmol/g DW after 48-h) to
34°C (approximately 8 µmol/g DW after 48-h; Kwan and Smith 1991). Cd uptake was
also about 50% greater in the algae P. subcapitata at 20°C compared to 2°C (Errécalde
and Campbell 2000). Another study reported an increase in bioaccumulation of Cd in the
Asiatic clam (Corbicula fluminea) when exposed to Cd at 21°C relative to the treatment
at 9°C (Graney et al. 1984). In addition, Lewis and Horning (1991) reported that in
treatments with elevated water temperature (i.e., 26°C), the 24-h and 48-h LC50 were
significantly lower compared with treatments at 20°C.
Heugens et al. (2003) performed multiple experiments to assess the effect of temperature
on Cd toxicity to D. magna. Short-term (i.e., 48-h) toxicity tests were performed using
multiple treatments between 10 and 35°C. The results showed no control mortality at
temperatures of 26°C and below, almost 80% control mortality at 32°C, and 100%
control mortality at 35°C. The 48-h LC50 decreased from approximately 1,200 µg/L Cd
at 10°C to approximately 50 µg/L Cd at 32°C. In a separate test, the uptake rate of Cd in
D. magna in 45-h exposures was significantly greater at 20°C (2.56 mg/kg DW/hour)
than at 10°C (1.06 mg/kg DW/hour). The authors also estimated a lethal toxicity
threshold concentration for D. magna at 26°C of 51.6 mg/kg Cd DW; CI95: 42-61 mg/kg

55
Cd DW) compared to 270 mg/kg Cd DW (CI95: 220-330 mg/kg Cd DW) at 10°C.
Therefore, they concluded that changes in sensitivity to Cd, along with increased
accumulation kinetics, occur at higher temperatures and play a part in increasing toxicity
of Cd to daphnids.
7.6.5 Acclimation
Acclimation refers to the exposure of organisms to sub-lethal concentrations of a toxicant
over time. In some cases, the organism becomes more resistant (i.e., tolerant) to higher,
normally lethal, concentrations of the toxicant. The resistance is often due to
physiological changes in the organism (Klerks and Weis 1987). While no studies were
found that evaluated the effects of acclimation on chronic exposure to Cd, studies on the
effects of acclimation on acute exposure were compiled. Benson and Birge (1985)
designed an experiment to evaluate the potential acclimation of fathead minnows (P.
promelas) to Cd. Fish collected from a flyash pond (mean concentration: 0.46 μg/L Cd)
were tested along with hatchery-reared fish (mean concentration: 0.28 μg/L Cd). The
observed 24-h LC50 was significantly greater (p < 0.05) in fish collected from the flyash
pond (6.06 mg/L Cd; CI95: 5.12 - 7.29 mg/L Cd) compared to hatchery-reared fish (4.03
mg/L Cd; CI95: 2.71 - 4.99 mg/L Cd). However, the 96-h LC50 was not significantly
different (3.89 mg/L Cd; CI95: 3.23-4.47 versus 3.06 mg/L Cd; CI95: 2.00-3.81).
Nonetheless, the median lethal time (LT50) was significantly less in the treatments with
the hatchery-reared fish compared with the fish collected from the flyash pond.
Specifically, in the 6 mg/L exposure treatment, the LT50 for the acclimated fish was 50 h
(CI95: 29.4 - 85.0 h) compared to the LT50 in the hatchery-reared fish (6.8 h; CI95: 4.3 -
10.8 h). A similar trend was also observed at higher exposure concentrations.
Interestingly, when fish from the flyash pond were held in clean water prior to testing the
96-h LC50 decreased from 9.5 mg/L Cd (deacclimation period: 0 d) to 7.5 mg/L Cd
(deacclimation period: 14 d). The holding period did not affect the hatchery-reared fish;
the observed LC50 remained around 3 mg/L Cd. Benson and Birge (1985) also exposed
hatchery-reared fish to 10 µg/L Cd for 35 d to determine if these fish would become
acclimated to the increased Cd concentration. Indeed, the 96-h LC50 was significantly

56
greater (2.88 mg/L Cd; CI95: 2.07 - 3.72 mg/L Cd) than in the control treatment (1.71
mg/L Cd; CI95: 1.15 - 2.19 mg/L Cd).
Exposure of white suckers (Catostomus commersoni) to 0.41 or 0.73 mg/L Cd for one
week prior to toxicity testing resulted in a greater LC50 relative to fish in the control
treatment (i.e., no acclimation period; Duncan and Klaverkamp 1983). For example, the
96-h LC50 in the control treatment was 1.0 mg/L Cd. In the 0.41 mg/L acclimation
treatment, the reported 96-h LC50 was 1.9 mg/L Cd. For fish acclimated to 0.71 mg/L
Cd, the 96-h LC50 was 2.2 mg/L Cd. In the same study, the fish acclimated to 0.73 mg/L
Cd also exhibited a longer median survival time (MST; 18 h) relative to fish that were not
acclimated to Cd (8.5 h).
Juvenile rainbow trout exposed to 3 or 10 µg/L Cd for 30 days exhibited increased
resistance to Cd toxicity compared to fish that were not acclimated to Cd (Hollis et al.
1993). The 96-h LC50 in the 3 μg/L Cd acclimation treatment was 286 µg/L Cd, whereas
the 96-h LC50 in the 10 μg/L Cd acclimation treatment was 242 µg/L Cd. The 96-h LC50
for the fish that were not acclimated was markedly less (22 ± 12 µg/L Cd). While 30%
mortality was observed in the acclimation chambers during the first three days of the
exposure to 10 μg/L Cd, less than 1% mortality was observed in the 3 μg/L Cd chambers.
The authors hypothesized that physiological changes, increasing Cd storage and
detoxification efficiency as well as greater resistance of gill processes are possible
mechanisms for acclimation to Cd. Other authors have reported similar results with
rainbow trout. Stubblefield et al. (1999) exposed juvenile and adult rainbow trout to sub-
lethal levels of Cd for 21 days. Acclimated juvenile trout fish increased their Cd
tolerance by a factor of 1.4 to 2.0, while acclimated adult rainbow trout exhibited a 15 to
20 times increase in Cd tolerance.
Fewer studies on acclimation of aquatic invertebrates to Cd have been found in the
primary literature. Stuhlbacher and Maltby (1992) found that acclimating the amphipod
Gammarus pulex to 5, 10, or 20 µg/L Cd for 24 hours resulted in a significantly greater (p

57
< 0.05) 48-h EC50 for mortality or immobility than unexposed amphipods. The observed
48-h EC50 increased from 1.4 to 2.2 with increasing acclimation concentration. However,
exposing the amphipods to 50.4 µg/L Cd prior to toxicity testing resulted in a
significantly lower (p < 0.05) 48-h EC50 (1.05 mg/L Cd) relative to control. In the same
study, increasing the acclimation period to seven days in the 10 μg/L Cd treatment did
not result in an increased tolerance to Cd exposure.
7.6.6 Biotic Ligand Model for Cadmium
The biotic-ligand model (BLM) is an approach that integrates multiple factors that may
influence the toxicity of Cd. This approach accounts for the competition between certain
metals (e.g., Cd and zinc), cations (including the constituents of hardness) and other
naturally occurring ligands (including DOM) to develop a tool for incorporating site-
specific water quality conditions into the assessment of metals toxicity (Paquin et al.
2002; Niyogi and Wood 2004).
While the effects of varying water hardness on metals toxicity is often considered to be a
primary factor for ameliorating the toxicity of metals such as Cd, other factors such as
alkalinity, pH, and specific ions have been found to be critical to mediating toxicity of Cd
in laboratory studies (Paquin et al. 2002; Niyogi and Wood 2004). Further, abiotic
ligands (e.g., DOM) may bind with free Cd, reducing its bioavailability. However, there
is currently no short-term or long-term BLM for Cd that has been adopted by other
jurisdictions for the development of WQGs. In addition, the existing toxicological studies
typically do not provide the requisite information (i.e., model inputs) for the BLM that
could be applied to evaluate toxicological data from multiple species for use in adapting
WQGs to site-specific conditions.
8.0 Water Quality Guidelines from Other Jurisdictions
As noted in Section 4.0, the environmental concentrations of water quality variables (e.g.,
Cd) are reflective of many local characteristics (e.g., soil type, pH, hydrological regimes,

58
and water hardness). This highlights the importance of developing WQGs taking into
consideration local conditions in conjunction with WQGs for the protection of aquatic
life developed in other jurisdictions. A comparison of the WQGs for Cd from other
jurisdictions is provided in Table 5.
8.1 Canadian Council of Ministers of the Environment Water Quality
Guidelines
The CCME is the national body that promulgates WQGs for the protection of aquatic life.
The CCME WQG for short-term exposure to total Cd was developed using the site-
specific water hardness (as mg/L CaCO3) and the following equation:
CCME WQG (μg/L Cd) = 101.016[log(hardness)]-1.71
Table 5. Summary of water quality guidelines from other jurisdictions.
Guideline Type/JurisdictionA
Water Quality Guideline for Cadmium (µg/L)
50 mg/L CaCO3 180 mg/L CaCO3 320 mg/L CaCO3
Short-Term Water Quality Guideline
CCME B 1.0 3.8 6.8
Ontario B
0.1 0.5 0.5
USEPA C
1.0 3.8 6.8
Australia/New Zealand B 0.32 0.99 1.6
European Union C 0.60 0.90 1.5
Long-Term Water Quality Guideline
CCME B 0.09 0.26 0.37
USEPA C
0.15 0.39 0.60
European Union C 0.09 0.15 0.25
A See Section 8.0 for details on the application of the WQGs. B This guideline applies to the total cadmium concentration. C This guideline applies to the dissolved cadmium concentration.
At water hardness of 50 mg/L CaCO3, the WQG is 1.0 µg/L (CCME 2014a). The CCME
short-term hardness equation is valid for hardness between 5.3 and 360 CaCO3 mg/L. At

59
hardness < 5.3 mg/L CaCO3, the short-term WQG is 0.11 µg/L, while at hardness > 360
mg/L CaCO3 the WQG is 7.7 µg/L.
The CCME WQG for long-term exposure to total Cd was developed using the site-
specific water hardness (as mg/L CaCO3) and the following equation:
CCME WQG (μg/L Cd) = 100.83[log(hardness)]-2.46
At water hardness of 50 mg/L CaCO3, the WQG is 0.09 µg/L (CCME 2014a). The
CCME long-term hardness equation is valid for hardness between 17 and 280 CaCO3
mg/L. At hardness < 17 mg/L CaCO3, the long-term WQG is 0.04 µg/L, while at
hardness > 280 mg/L CaCO3 the WQG is 0.37 µg/L.
8.2 Provincial Water Quality Guidelines
Provinces of Canada typically develop province-specific WQGs or adopt the WQG from
another jurisdiction (e.g., CCME). The Ontario Ministry of Environment has set policies
to manage Ontario’s water resources, including providing Provincial Water Quality
Objectives (PWQOs) for surface water to protect aquatic life (OMOEE 1994). The
PWQO for total Cd is 0.2 µg/L, however an interim PWQO is under development. The
interim PWQO for total Cd is 0.1 µg/L for water with hardness between 0 and 100 mg/L
CaCO3 and 0.5 µg/L for water with hardness > 100 mg/L CaCO3 (OMOEE 1994).
Saskatchewan has adopted the CCME WQGs, including the WQG for total Cd
(Saskatchewan Environment 2006) while the province of Quebec has adopted the United
States Environmental Protection Agency (USEPA) Cd water quality criteria (WQC) for
protection of aquatic life (MDDEFP 2002). Alberta has not developed a WQG for Cd;
however, it has adopted the use of both the CCME and USEPA WQGs for protection of
aquatic life (Alberta Environment 1999).

60
8.3 United States Environmental Protection Agency Water Quality Criteria
The USEPA has recommended acute (i.e., short-term) and chronic (i.e., long-term)
national WQC for the protection of aquatic life for use with the dissolved metal
concentration (USEPA 2013). The WQC for Cd are based on water hardness and
calculated using the following equations:
CMC (μg/L) = [1.136672 – (ln(hardness)*0.041838)] * e1.0166[ln(hardness)] - 3.924
CCC (μg/L) = [1.101672 – (ln(hardness)*0.041838)] * e0.7409[ln(hardness)] - 4.719
Where: CMC = Criteria Maximum Concentration
CCC = Criteria Continuous Concentration
At a hardness of 50 mg/L CaCO3, the USEPA acute WQC (i.e., CMC) for dissolved Cd
would be 1.0 µg/L. The chronic WQC (i.e., CCC) for dissolved Cd would be 0.15 µg/L.
The USEPA is in the process of updating their 2001 Cd criteria (Gallagher personal
communication, 2013).
8.4 Other Water Quality Guidelines
Australia and New Zealand have joint WQGs that are described as trigger values; that is,
they trigger a response if exceeded (ANZECC 2000a; 2000b). To protect 95% of aquatic
life, ANZECC (2000a; 2000b) has developed a high reliability trigger value for Cd of 0.2
µg/L, which applies to waters with hardness of 30 mg/L CaCO3. The trigger value to
protect 99% of aquatic life is 0.06 μg/L Cd and is recommended for use for slightly-
moderately disturbed ecosystems for protection of cladoceran species (ANZECC 2000b).
The trigger value for Cd can be adjusted to the site-specific water hardness using:
Hardness-Modified Trigger Value * (hardness/30)0.89

61
At a water hardness of 50 mg/L CaCO3 the 95% protection level trigger value is 0.32
µg/L. ANZECC (2000a) generally recommends using the 95% protection level for
slightly-moderately disturbed ecosystems (considered typical systems), though they
provide guidance for 90% and 80% protection levels as well for use at highly disturbed
sites (ANZECC 2000a). To protect 90% of aquatic life, the trigger value for Cd is 0.4
µg/L, while the 80% protection level is 0.8 µg/L (at a hardness of 30 mg/L CaCO3;
ANZECC 2000a).
The European Union’s Water Framework Directive provides a list of priority substances
to monitor and control in water, and has set out Environmental Quality Standards (EQSs)
for these priority substances defined as concentrations that should not be exceeded (EU
2008). For Cd, the EQSs are separated by five water hardness classes. The Cd annual
average EQSs (calculated as the average Cd concentration over a year) for inland surface
waters are as follows:
0.08 µg/L (hardness < 40 mg/L CaCO3);
0.08 µg/L (hardness 40 to < 50 mg/L CaCO3);
0.09 µg/L (hardness 50 to < 100 mg/L CaCO3);
0.15 µg/L (hardness 100 to < 200 mg/L CaCO3); and,
0.25 µg/L (hardness ≥ 200 mg/L CaCO3).
The Cd maximum allowable concentration EQSs for inland surface waters are:
0.45 µg/L (hardness < 40 mg/L CaCO3);
0.45 µg/L (hardness 40 to < 50 mg/L CaCO3);
0.6 µg/L (hardness 50 to < 100 mg/L CaCO3);
0.9 µg/L (hardness 100 to < 200 mg/L CaCO3); and,

62
1.5 µg/L (hardness ≥ 200 mg/L CaCO3).
9.0 Derivation of Water Quality Guidelines for Cadmium in
British Columbia
The derivation of WQGs for dissolved Cd for BC to protect freshwater aquatic life
followed the protocol of BC MOE (2012). To facilitate the development of WQGs,
scientific literature on the toxicity of Cd to freshwater aquatic life was compiled and
evaluated. Studies were evaluated to identify high-quality data (i.e., data which meet the
criteria outlined in BC MOE [2012]), which were used in the formation of the short-term
maximum and long-term average guidelines. The toxicological data were adjusted to
account for site-specific toxicity-modifying factors (i.e., water hardness) by normalizing
to 50 mg/L CaCO3, based on the relationship between water hardness and toxicity from
select studies. Consistent with guidance in BC MOE (2012), the lowest value from a
primary study was selected to form the preliminary guideline. The minimum uncertainty
factor of 2 was applied to the guideline to account for incomplete knowledge or various
uncertainties in the toxicity data.
9.1 Acquisition of Toxicological Data for Cadmium
The current scientific literature was reviewed, and studies that evaluated the toxicity of
Cd to freshwater aquatic organisms under laboratory conditions were compiled from
literature reviews conducted between October 2012 and October 2014. Information on
the toxicity of Cd to aquatic organisms was compiled from multiple sources including
recent WQG derivation documents (USEPA 2001 and CCME 2014a), scientific
databases, and personal communications with researchers investigating the toxicity of
metals to aquatic life. The compilation of relevant studies focussed on species relevant to
BC and ensured that an appropriate number of studies were obtained to meet the
minimum data requirements for WQG derivation (BC MOE 2012). These studies were
subsequently classified for their appropriateness. Summaries of the data and

63
bibliographical information for each of the studies used in the evaluation are reported in
Appendix 2.
9.2 Evaluation and Classification of Toxicological Data
The evaluation of toxicological data followed the BC protocol for guidelines
development (BC MOE 2012). Each of the compiled studies was evaluated based on test
procedures and experimental design, to ensure that only those studies that were
scientifically sound and of high-quality were used in the WQG derivation. Toxicological
studies were classified as primary, secondary, or unacceptable. While the primary studies
were used to derive the short-term maximum and long-term average WQG, toxicological
data from both primary and secondary studies were considered in the development of the
guideline.
Information on the test species, test conditions, experimental design, chemical and
physical properties of the test water, statistical analyses, and negative control
performance were reviewed. The key points for determining the classification (i.e.,
primary, secondary, or unacceptable) are summarized below.
To be considered as primary data, studies must have included the following (BC MOE
2012):
Cd concentrations measured and reported at a minimum at the beginning and
end of the exposure period;
Flow-through or renewal test, unless a static test included evidence that Cd
concentrations did not change and environmental conditions were acceptable
throughout the test;
Two or more replicate test chambers per concentration (ASTM 2012b;
2012c);
64
Ecologically relevant endpoints (i.e., related to growth, reproduction, hatching
success, or survival);
Acceptable negative control performance reported (less than 10% mortality
for short-term [96-h] tests and less than the ASTM International test
acceptability criteria for the appropriate species and test for long-term
exposures);
Measurements of temperature, pH, dissolved oxygen, and water hardness
reported and results are acceptable (e.g., dissolved oxygen met the
requirements in ASTM E729 for short-term tests [ASTM 2012b] and ASTM
E1241 for early life-stage tests [ASTM 2012c]); and,
Appropriate statistical analyses were applied.
Guidance for secondary data includes (BC MOE 2012):
Toxicity tests may incorporate the exposure of test organisms to additional
stressors or effects (e.g., low temperature, lack of food, exposure of F1
generation);
Calculated (vs. measured) concentrations of Cd in exposure chambers are
acceptable;
Static (non-renewal) tests are acceptable;
Pseudoreplication (e.g., only one test chamber with multiple organisms inside
per concentration) is acceptable;
Broader array of endpoints is acceptable, though endpoints need to be
ecologically relevant (e.g., pathological, behavioural, and physiological
endpoints, in addition to the primary data endpoints); and,
Must meet the same requirements for negative control performance, water
quality measurements, and statistical analyses as primary data sets.

65
If any of the conditions for primary or secondary data were not met, the data were given a
ranking of unacceptable (BC MOE 2012). A summary of all short-term and long-term
primary and secondary data is provided in Appendix 2 (Tables A2.1 and A2.2). A list of
the studies that were ranked as unacceptable is provided in Table A2.3.
9.3 Normalization of the Toxicological Data to a Standard Hardness
Studies classified as primary and secondary were evaluated for their potential use in
developing relationships between Cd toxicity and water hardness. Short-term and long-
term exposure data were extracted from these studies and compiled.
9.3.1 Data Evaluation
To facilitate the normalization of raw toxicological data to a standard hardness prior to
guideline derivation, short-term and long-term toxicological data were evaluated
independently. To determine the relationship between toxicity and water hardness in
short-term exposures, the LC50s from studies that tested a range of water hardness were
identified. To develop the relationship for toxicity and water hardness in long-term
exposures, MATCs or other similar low-effect values for survival and growth were
identified. Data were grouped by species and life-history stage and then evaluated to
ensure that the experimental conditions (i.e., experimental design, life-stage, exposure
duration, and water quality parameters such as temperature and pH) were similar between
studies within the data set for a particular species. Studies with experimental conditions
that differed (i.e., introduced confounding factors) were excluded from the analysis.
Criteria for using data in the evaluation included:
Primary or secondary classification;
No additional stressors were placed on the organisms;
The effect value must have been defined (i.e., undefined LCx, ECx, or long-
term values that were estimated to be higher than the highest tested
concentration were not included); and,

66
A minimum of 3 data points for each species over a range of water hardness
must have been tested.
While studies that were designed to explicitly evaluate the relationship between toxicity
and water hardness were preferred, no studies on the relationship between short-term
toxicity and water hardness for aquatic invertebrates met the data evaluation criteria.
Chapman et al. (1980) designed an experiment to develop and evaluate the relationship
between toxicity and water hardness using the cladoceran, D. magna. While this study
failed to meet the evaluation criteria outlined in Section 9.2 (control mortality was not
reported), the study was specifically designed to investigate the relative toxicity of Cd to
D. magna (i.e., estimate of the slope) at varying water hardness under experimental
conditions, and was therefore included in the analysis.
9.3.2 Development of the Relationship between Short-Term Toxicity and Water
Hardness
Eight studies were used to develop a relationship between short-term toxicity and water
hardness (Appendix 2; Table A2.4). A total of 6 species, comprising 39 data points, were
used in the evaluation (striped bass, M. saxatilis, n = 3; brown trout, Salmo trutta, n = 3;
bull trout, S. confluentus, n = 6; cutthroat trout, O. clarkii lewisi, n = 3; rainbow trout, O.
mykiss, n = 19; water flea, D. magna, n = 5; Figure 2).
Using the methods described in USEPA (1985b), USEPA (2001), and Mebane (2010),
the raw toxicity and hardness data were transformed using the natural log prior to
application of the linear regression model to each species. The results of the regression
analysis are presented in Table 6. The derived slope for the individual species ranged
from 0.912 (rainbow trout) to 1.48 (bull trout), with coefficients of determination (i.e.,
R2) ranging from 0.270 (rainbow trout) to 0.998 (brown trout). The higher variability in
the rainbow trout model may be explained by the inclusion of multiple life-stages in the
data set. These data (i.e., the rainbow trout effects data) were pooled because limited data
for rainbow trout were available for each life-stage at multiple water hardness

67
concentrations. The ANCOVA procedure (Zar 1999) was employed to develop a
common (i.e., pooled) slope that could be used to normalize the toxicological data that
had been compiled from the primary and secondary studies evaluated. The first step of
the ANCOVA procedure was to use an F-test to test that the estimated slopes from the
individual species were not statistically different. The results of this test showed that the
individual slopes were not statistically different (F = 0.190, p = 0.902) and therefore, the
common slope was used. Using the pooled data to establish a relationship between short-
term toxicity (represented by an LC50) and water hardness, the common slope was

68
Table 6. Estimate of the slope for use in developing a hardness-modifying conversion factor for short-term toxicity of cadmium based
on water-only toxicity tests with various aquatic species.
Receptor Group /
Species
Life
Stage
Test
Duration
Effect Level
and Endpoint n
Slope Estimation
R2 p Reference
Slope 95%
LCL
95%
UCL
Fish
Morone saxatilis
(Striped bass)
63-d old 96-h LC50; Mortality 3 0.99 -6.78 8.76 0.723 0.353 Palawski (1985)
Fish - Salmonids
Salmo trutta
(Brown trout)
Fry 96-h LC50; Mortality 3 1.28 0.582 1.98 0.998 0.0273* Brinkman & Hansen
(2007)
Salvelinus confluentus
(Bull trout)
Fry 120-h LC50; Mortality 6 1.48 0.123 2.84 0.698 0.0385* Hansen et al. (2002a)
Oncorhynchus clarkia
lewisi
(Cutthroat trout)
YOY 96-h LC50; Mortality 3 0.94 -4.00 5.88 0.853 0.250 Mebane et al. (2012)
Oncorhynchus mykiss
(Rainbow trout)
Fry 120-h LC50; Mortality
19 0.912 0.144 1.68 0.270 0.0227*
Hansen et al. (2002a)
Fry 96-h LC50; Mortality Mebane et al. (2012)
Alevin, Juv
96-h
LC50; Mortality Buhl & Hamilton
(1991)
Swim-up, Juv 96-h LC50; Mortality Besser et al. (2007)
Swim-up, Parr 96-h LC50; Mortality Chapman (1978)
Invertebrates
Daphnia magna
(Water flea)
< 24-h old 48-h LC50; Mortality 5 1.18 0.519 1.84 0.915 0.0108* Chapman et al. (1980)
Common Slope (All species)A 39 1.03 0.61 1.45 0.786 < 0.001***
Common Slope (All significant relationships)A 33 1.04 0.54 1.54 0.758 < 0.001***
* p < 0.05; ** p < 0.01; *** p < 0.001; LCL = lower confidence limit; UCL = upper confidence limit; d = day; h = hour; juv = juvenile; LC = lethal concentration; n = number;
YOY = young-of-year. A Common (i.e., pooled) slope estimated using the ANCOVA method (Zar 1999; USEPA 2001).

69
Figure 2. Relationship between short-term toxicity of cadmium and ambient water
hardness in water-only toxicity tests with various aquatic species.
A. Only the Daphnia magna study by Chapman et al. (1980) was included in the analysis to minimize variability in the data resulting
from varying experimental conditions and genetic strains. B. Estimated common (i.e., pooled) slope of all species and associated 95% confidence intervals.
estimated to be 1.03 (n = 39, R2 = 0.786, p < 0.001) with a 95% confidence interval
around the slope of 0.61 to 1.45. Using the common slope, the raw toxicological data can
be normalized to a standard hardness (i.e., 50 mg/L CaCO3) using the following equation:
ECx (at 50 mg/L CaCO3) = e[((ln(50) - ln(Measured Hardness)) * 1.03) + ln(Measured ECx)]
The relationship between short-term toxicity of Cd and water hardness was developed by
incorporating the results of toxicity tests from multiple studies to capture the inherent
-2 0 2 4 6 8
-2
0
2
4
6
8
Ln Hardness (mg/L CaCO3 )
Ln
LC
50
Brown Trout
Bull Trout
Cutthroat Trout
Daphnia magnaA
Rainbow Trout
Striped Bass
ANCOVA Results:
Common SlopeB
= 1.03 ( 0.61 - 1.45 )
R2
= 0.786
p = <0.001

70
variability in response at varying water hardness. However, the influence of additional
water quality variables, experimental conditions, or mixed life-stages may influence the
resulting pooled slope. To test the influence of these factors on the slope estimate, a
sensitivity analysis was performed using only those studies for which the intent of the
experimental design was to test the change in the short-term response to Cd toxicity at
varying water hardness. The LC50s from 3 studies on 3 separate species were identified
and a revised slope estimate was determined using the same process (Figure 3). The
original slope estimate (1.03) and the estimated pooled slope from the sensitivity analysis
(1.04) were in agreement, and thus the original estimated slope was used in the analysis.
Figure 3. Validation analysis of the relationship between short-term toxicity of cadmium
and ambient water hardness in individual water-only toxicity tests with various aquatic
species.
A. Estimated common (i.e., pooled) slope of all species and associated 95% confidence intervals.
-2 0 2 4 6 8
-2
0
2
4
6
8
Ln Hardness (mg/L CaCO3 )
Ln
LC
50
Brinkman and Hansen (2007) - Brown Trout
Chapman et al. (1980) - Daphnia magna
Palawski (1985) - Striped Bass
ANCOVA Results:
Common SlopeA
= 1.1 ( 0.651 - 1.55 )
R2
= 0.914
p = <0.001

71
9.3.3 Development of the Relationship between Long-Term Toxicity and Water
Hardness
Observed effect values from 15 studies were used to evaluate the relationship between
water hardness and long-term toxicity (Table A2.5). The majority of the studies used
hypothesis testing in the evaluation of toxicity. Therefore, the data used in the analysis of
the relationship between long-term toxicity and water hardness were limited to MATCs
for survival to ensure that equivalent endpoints were available for each species across a
range of water hardness concentrations. For two studies, MATCs for growth and/or
biomass were used in order to supplement the data set and complete the analysis (brown
trout, S. trutta, n = 4; brook trout, n = 5), which facilitated the evaluation of the
relationship between toxicity and water hardness for both sub-lethal and lethal effects.
Additionally, the estimated LC10 (steelhead trout/rainbow trout, n = 2), EC20 (rainbow
trout, n = 1), and EC20 (green algae, n = 4) were used as no MATCs were calculated in
these studies. The variability from the use of multiple endpoints within a species data set
was not found to be significant. A total of 7 species, comprising 44 data points, were
used in the evaluation (fathead minnow, n = 7; rainbow trout, n = 7; brown trout, n = 10;
brook trout, n = 7; H. azteca, n = 6; D. magna, n = 3; green algae, n = 4; Figure 4).
The methods for developing the relationship were consistent with the methods followed
to develop the short-term relationship. Linear regression models were applied to each of
the individual species. The results of the regression analysis are presented in Table 7.
The individual slopes ranged from 0.550 (green algae) to 0.804 (brown trout), with
coefficients of determination (i.e., R2) ranging from 0.347 (brown trout) to 0.963 (D.
magna). The ANCOVA procedure (Zar 1999) was used to develop a common (i.e.,
pooled) slope to normalize the toxicological data that were compiled from the primary
and secondary studies. The first step of the ANCOVA procedure was to use the F-test to
test that the estimated slopes for the individual species were not statistically different. It
was found that the slopes were not statistically different (F = 0.0846, p = 0.997) and

72
Figure 4. Relationship between long-term toxicity of cadmium and ambient water
hardness in water-only toxicity tests with various aquatic species.
A. MATCs were calculated as the geometric mean of the NOEC and LOEC for survival from individual toxicity tests, except for the
use of the EC20rainbow trout; n = 1; Mebaneet al.2008) and green algae; n = 4; Källqvist (2009)], LC10steelhead/rainbow trout; n
= 2; Chapman (1978)], the MATC for biomass [brown trout; n = 4; brook trout; n =3; Eatonet al.(1978)], and the MATC for growth
[brook trout; n = 2; Benoitet al.1976)].
B. Only theDaphnia magnastudy by Chapmanet al.(1980) was included in the analysis to minimize variability in the data resulting
from varying experimental conditions and genetic strains. C. Estimated common (i.e., pooled) slope of all species and associated 95% confidence intervals.
-2 0 2 4 6 8
-2
0
2
4
6
8
Ln Hardness (mg/L CaCO3 )
Ln
Ma
xim
um
Acce
pta
ble
To
xic
an
t C
on
ce
ntr
atio
n (
MA
TC
)A
Brook Trout
Brown Trout
Daphnia magnaB
Fathead Minnow
Hyalella azteca
Green Algae
Rainbow Trout
ANCOVA Results:
Common SlopeC
= 0.736 ( 0.546 - 0.926 )
R2
= 0.869
p = <0.001

73
Table 7. Estimate of the slope for use in developing a hardness-modifying conversion factor for long-term toxicity of cadmium based on
water-only toxicity tests with various aquatic species.
Receptor Group /
Species
Life
Stage
Test
Duration
Effect Level
and Endpoint n
Slope Estimation
R2 p Reference
Slope 95%
LCL
95%
UCL
Plants/Algae
Pseudokirchneriella
subcapitata
(Green algae)
NA 72-h EC20; Growth Rate 4 0.55 -0.331 1.43 0.783 0.115 Källqvist (2009)
Fish
Pimephales
promelas
(Fathead minnow)
Larvae 7-d MATC; Survival
7 0.768 0.159 1.38 0.677 0.0230*
Castillo & Longley (2001)
Fry 30-d MATC; Survival Pickering & Gast (1972)
NR 7-, 10-, 14-d MATC; Survival Suedel et al. (1997)
Fish - Salmonids
Salvelinus fontinalis
(Brook trout)
Juv 84-, 112-d MATC; Growth
7 0.724 -0.217 1.66 0.439 0.105
Benoit et al. (1976)
ESL 55-, 89-, 150-d MATC; Biomass Eaton et al. (1978)
Fry 60-d MATC; Survival Sauter et al. (1976)
Salmo trutta
(Brown trout)
Fry, ELS 30-, 55-d MATC; Survival 10 0.804 -0.0969 1.7 0.347 0.0734
Brinkman & Hansen (2007)
ELS 31-, 63-, 83-, 110-d MATC; Biomass Eaton et al. (1978)
Oncorhynchus
mykiss
(Rainbow trout)
Swim-up 28-d MATC; Survival
7 0.720 0.260 1.18 0.763 0.0102*
Besser et al. (2007)
Juv 30-d MATC; Survival Hollis et al. (1999)
ESL 53-, 62-, 69-d MATC; Survival Mebane et al. (2008)
Swim-
up, Parr
8.3-d LC10; Survival Chapman (1978)
Invertebrates
Daphnia magna
(Water flea)
< 24-h
old
21-d MATC;
Reproductionl
3 0.787 -1.18 2.76 0.963 0.124 Chapman et al. (1980)
Hyalella azteca
(Amphipod)
7-8 d old 28-d MATC; Survival
6 0.765 0.323 1.21 0.853 0.00849**
CEC, Inc. (2004)
7-8 d old 28-, 35-, 42-d MATC; Survival Ingersoll & Kemble (2001)
NR 14-d MATC; Survival Suedel et al. (1997)
Common Slope (All species)A 44 0.736 0.546 0.926 0.869 < 0.001***
Common Slope (All significant relationships)A 20 0.758 0.514 1.000 0.876 < 0.001***
* p < 0.05; ** p < 0.01; *** p < 0.001. LCL = lower confidence limit; UCL = upper confidence limit; CEC, Inc. = Chadwick Ecological Consultants, Inc.; d = day; ESL = early life
stage; h = hour; juv = juvenile; LC = lethal concentration; MATC = maximum acceptable toxicant concentration; n = number; NR = not reported. A Common (i.e., pooled) slope estimated using the ANCOVA method (Zar 1999; USEPA 2001)
74
therefore the common slope was used. Using the pooled data to establish a relationship
between long-term toxicity and water hardness, the common slope was estimated to be
0.736 (n = 44, R2 = 0.869, p < 0.001) with a 95% confidence interval around the slope of
0.546 to 0.926. Using the common slope, the raw toxicological data can be normalized to
a standard hardness (i.e., 50 mg/L CaCO3) using the following equation:
ECx (at 50 mg/L CaCO3) = e[((ln(50) - ln(Measured Hardness)) * 0.736) + ln(Measured ECx)]
The relationship between long-term toxicity of Cd and water hardness was developed by
incorporating the results of toxicity tests from multiple studies to capture the inherent
variability in response at varying water hardness. However, the influence of additional
water quality variables, experimental conditions, or life-stages may influence the
resulting pooled slope. To test the influence of these factors on the slope estimate, a
sensitivity analysis was performed using only those studies for which the intent was to
test the change in response to Cd toxicity at varying water hardness. The MATCs from 4
studies on 3 species were identified and a revised slope estimate was determined using
the same process (Figure 5). The original slope estimate (0.736) and the estimated
pooled slope from the validation analysis (0.735) were in agreement, and thus the original
estimated slope was used in the analysis.
9.3.4 Evaluation of Developed Relationships for Normalizing Toxicity to a
Standard Hardness
To facilitate the development of a short-term maximum and long-term average WQG for
Cd, the toxicological data used in the derivation process were normalized to a standard
hardness using procedures in USEPA (1985b), USEPA (2001), and Mebane (2010).
The derived slopes for normalizing the toxicological data to a standard hardness were
compared to slopes estimated using similar approaches (USEPA 2001; Mebane 2010;

75
Figure 5. Validation analysis of the relationship between long-term toxicity of
cadmium and ambient water hardness in individual water-only toxicity tests with
various aquatic species.
A. MATCs were calculated as the geometric mean of the NOEC and LOEC for survival from individual toxicity tests, except for the
use of the EC20green algae; n = 4; Källqvist (2009)]. B. Estimated common (i.e., pooled) slope of all species and associated 95% confidence intervals.
Table 8). Using the approach described in Section 9.3.2, the estimated slope for
normalizing the short-term toxicological data was 1.03 (0.610 - 1.45). This slope was
similar to that calculated for the update of the USEPA WQC for Cd of 1.02 (0.975 - 1.06;
USEPA 2001) as well as the slope calculated by CCME of 1.016 (CCME 2014a).
However, this slope was slightly higher than that which was derived by Mebane (2010)
using additional data. The slope derived in this case was 0.84 (0.676 - 1.00). The
derived slope estimate used to develop the short-term maximum WQG for BC is similar
-2 0 2 4 6 8
-2
0
2
4
6
8
Ln Hardness (mg/L CaCO3 )
Ln
Ma
xim
um
Acce
pta
ble
To
xic
an
t C
on
ce
ntr
atio
n (
MA
TC
)A
Brinkman and Hansen (2007a) - Brown Trout (30-d)
Brinkman and Hansen (2007b) - Brown Trout (55-d)
Chapman et al. (1980) - Daphnia magna (21-d)
Kallqvist (2009) - Green Algae (72-h)
ANCOVA Results:
Common SlopeB
= 0.735 ( 0.466 - 1 )
R2
= 0.976
p = <0.001

76
to the theoretical slope of 1.0 derived in Meyer (1999), and is determined to be a robust
method for normalizing the short-term toxicological data.
Table 8. Comparison of slope estimates used in developing a hardness-modifying
conversion factor for short-term and long-term toxicity of cadmium based on
water-only toxicity tests with various aquatic species.
Exposure
Period /
Agency
Slope Estimation
R2 P
A Reference
Slope
95% Lower
Confidence
Limit
95% Upper
Confidence
Limit
Short-Term
BCMOE 1.03 0.61 1.45 0.786 < 0.001*** This document
USGS 0.840 0.676 1.00 0.978 < 0.01** Mebane (2010)
USEPA 1.017 0.975 1.059 0.967 < 0.05* USEPA (2001)
CCME 1.016 NA NA 0.966 NA CCME (2014a)
Long-Term
BCMOE 0.736 0.546 0.926 0.869 < 0.001*** This document
USGS 0.625 0.533 0.716 0.991 < 0.001*** Mebane (2010)
USEPA 0.741 0.336 1.146 0.994 < 0.05* USEPA (2001)
CCME 0.83 NA NA 0.985 NA CCME (2014a)
* p < 0.05; ** p < 0.01; *** p < 0.001. BCMOE = British Columbia Ministry of the Environment; USGS = United
States Geological Survey; USEPA = United States Environmental Protection Agency; CCME = Canadian Council of
Ministers of the Environment; NA = not applicable. A p-value as it was reported in the document; values should not be used to compare relative significance between
methods.
Using the approach described in Section 9.3.3, the estimated slope for normalizing the
long-term toxicological data was 0.736 (0.546 - 0.926). This slope was similar to that
calculated for the update of the USEPA WQC for Cd of 0.741 (0.336 - 1.15; USEPA
2001), the slope derived by CCME of 0.83 (CCME 2014a), and that which was derived
by Mebane (2010) using additional data of 0.625 (0.533 - 0.716), and is determined to be
a robust method for normalizing the long-term toxicological data.
9.4 Derivation of Water Quality Guidelines
A total of 20 short-term and 28 long-term studies were classified as primary studies.
These data provided sufficient information to meet the minimum data requirements for

77
developing a short-term maximum and long-term average WQG for Cd as outlined in BC
MOE (2012) and summarized below:
3 studies on freshwater fish species resident in BC, including two cold-water
species;
2 studies on aquatic invertebrates from different classes, including one
planktonic species resident in BC;
1 study on a freshwater vascular plant or algal species resident in BC (data for
long-term exposure only were available); and,
When available, toxicological data on amphibians should be included.
The WQGs for Cd were developed based on the results of toxicity tests in water-only
exposures under laboratory conditions. While there is some evidence to support that the
bioaccumulation of Cd (i.e., through the ingestion of contaminated prey and direct
contact with water) can contribute to the overall body burden in some species and/or
trophic levels, dietary studies have generally indicated that the contribution is not
significant. Further, the mechanism for bioaccumulation and conditions under which
bioaccumulation is a contributing factor in Cd body burden have not been clearly
established.
The laboratory studies evaluated in the derivation process used cadmium chloride
(CdCl2), cadmium nitrate (Cd[NO3]2), or cadmium sulphate (CdSO4). All values reported
in this document are reported as dissolved Cd, and as such, the WQG will be determined
for this form.
9.4.1 Short-Term Maximum Water Quality Guidelines
The 20 primary short-term studies contained data on 9 resident fish species (including 6
cold-water species), 13 resident invertebrate species, and 1 resident amphibian species
(Table 9). These data were considered sufficient to meet the minimum data requirements

78
Table 9. Studies used to meet the data requirements for developing a short-term water
quality guideline.
for the development of a short-term maximum WQG. While no toxicity data were
available that met the short-term exposure criteria for algae or aquatic plants, a
comparison of the derived short-term maximum WQG and the long-term exposure data
Species (all resident in BC) Dur. Normalized LC50 (µg/L; CI)A
Reference
Fish - Non-Salmonid Species
Cottus bairdi 96-h 1.38 (1.05 - 1.81) Besser et al. (2007)
Cottus confusus 96-h 2.27 (1.52 - 3.42) Mebane et al. (2012)
Pimephales promelas 48-h 27.0 (23.4 - 30.7) Suedel et al. (1997)
Fish - Salmonid Species
Oncorhynchus clarkii lewisi 96-h 2.00 (1.75 - 2.33) Mebane et al. (2012)
Oncorhynchus mykiss 96-h 1.76 (1.52 - 2.04) Besser et al. (2007)
Oncorhynchus mykiss 96-h 2.23 (1.78 - 2.45) Chapman (1978)
Oncorhynchus mykiss 96-h 4.00 (3.43 - 4.57) Cusimano et al. (1986)
Oncorhynchus mykiss 5-d 0.576 (0.528 - 0.64) Hansen et al. (2002a)
Oncorhynchus mykiss 96-h 0.831 (0 - 1.22) Mebane et al. (2012)
Oncorhynchus tshawytscha 96-h 4.01 (3.78 - 4.45) Chapman (1978)
Prosopium williamsoni 96-h 4.92 (4.58 - 5.29) Brinkman & Vieira (2008)
Salmo trutta 96-h 2.14 (NR) Brinkman & Hansen (2007)
Salvelinus confluentus 5-d 1.37 (1.26 - 1.50) Hansen et al. (2002a)
Invertebrates
Baetis tricaudatus 96-h 13.5 (0.843 - 265) Mebane et al. (2012)
Chironomus riparius 96-h 753 (428 - 1330) Watts & Pascoe (2000)
Chironomus dilutus 48-h 89,800 (64,600 - 115,000) Suedel et al. (1997)
Chironomus dilutus 96-h 719 (342 - 1450) Watts & Pascoe (2000)
Rhithrogena sp. 96-h 321 (184 - 557) Mebane et al. (2012)
Rhithrogena hageni 96-h 11,000 (NR) Brinkman & Johnston (2008)
Gammarus pulex 96-h 15.7 (NR) Felten et al. (2008)
Hyalella azteca 96-h 8.51 (7.29 - 10.0) Suedel et al. (1997)
Ceriodaphnia dubia 48-h 37.3 (NR) Black (2001)
Ceriodaphnia dubia 48-h 39.6 (26.9 - 48.1) Shaw et al. (2006)
Ceriodaphnia dubia 96-h 51.3 (41.9 - 60.8) Suedel et al. (1997)
Daphnia ambigua 48-h 12.7 (7.07 - 15.6) Shaw et al. (2006)
Daphnia magna 48-h 73.5 (51.1 - 106) Schuytema et al. (1984)
Daphnia magna 48-h 127 (67.9 - 283) Shaw et al. (2006)
Daphnia magna 96-h 8.03 (7.27 - 8.79) Suedel et al. (1997)
Daphnia pulex 48-h 56.6 (46.7 - 63.6) Shaw et al. (2006)
Simocephalus serrulatus 96-h 33.0 (25.4 - 42.9) Giesy et al. (1977)
Orconectes virilis 96-h 12,000 (9,220 - 15,500) Mirenda (1986)
Amphibians
Ambystoma gracile 96-h 522 (NR) Nebeker et al. (1995)
Dur = duration; LC = lethal concentration; CI = confidence interval; -h = hour; -d = day; NR = Not Reported. A The toxicity test endpoint corresponding to the lowest normalized LC50 is reported.

79
for algae and aquatic plants showed that the derived short-term maximum WQG would
be protective of these groups.
The primary and secondary studies generated 101 defined LC50 values for species
resident in BC. These effect concentrations were normalized to a standard hardness of 50
mg/L CaCO3 using the equation reported in Section 9.3.2. These normalized values were
then plotted to show the distribution of effect values by species (Figure 6). The lowest
Figure 6. Distribution of LC50 valuesA from the primary and secondary studies
used to determine the short-term toxicity of cadmium in freshwater environments.
A. All values are normalized to a hardness of 50 mg/L CaCO3.
effect value from a primary study (0.576 µg/L; LC50 for rainbow trout fry; Hansen et al.
2002a) was selected to support the derivation of a short-term maximum WQG.
LC50
Primary Study Secondary Study
Min
imu
m L
C50 (P
rim
ary
Stu
dy)
Sh
ort
-te
rm W
ate
r Q
ua
lity G
uid
elin
e (
0.2
88 µ
g/L
at
50 m
g/L
CaC
O3 H
ard
ne
ss)
Baetis tricaudatusRhithrogena sp.
Rhithrogena hageni
Chironomus riparius
Chironomus dilutusGammarus pulexHyalella azteca
Ceriodaphnia dubiaDaphnia ambigua
Daphnia magna
Daphnia pulex
Simocephalus serrulatus
Orconectes virilisHydra viridissima
Hydra vulgaris
Pimephales promelas
Cottus bairdi
Cottus confususMorone saxatilis
Thymallus arcticus
Salmo trutta
Salvelinus confluentusOncorhynchus tshawytscha
Oncorhynchus kisutch
Oncorhynchus clarkii lewisiProsopium williamsoni
Oncorhynchus mykiss
Ambystoma gracile
Invertebrates
Fish (Non-salmonids)
Fish (Salmonids)
Amphibians
0.1 1 10 100 1,000 10,000 100,000

80
In order to derive a WQG that is protective of the most sensitive species and life stage in
BC, uncertainty around the lowest effect value was taken into account. The minimum
uncertainty factor of 2 was applied to the selected effect value to derive the WQG. As
stated in BC MOE (2012), sources of uncertainty in the protectiveness of a lowest effect
level from a laboratory study include:
Laboratory to field differences;
Interactive effects of multiple contaminants;
Toxicity of metabolites;
Intra-specific and inter-specific differences in sensitivity;
Indirect effects (e.g., associated with bioaccumulation);
Duration of exposure, relative to the life-cycle of the species;
Delayed effects;
Presence of other stressors (e.g., habitat loss); and,
Impacts of climate change.
The minimum uncertainty factor of 2 for the short-term maximum guideline is supported
by the mean ratio of the LC50 to the LC10 from a short-term exposure study using rainbow
trout (the most sensitive species; Mebane 2012). The results of the toxicity tests
conducted by Mebane (2012) and used to calculate the ratios (in parentheses) are:
Test 9; LC50: 0.48 µg/L Cd, LC10: 0.38 µg/L Cd (1.26);
Test 10; LC50: 0.99 µg/L Cd, LC10: 0.66 µg/L Cd (1.50);
Test 11; LC50: 1.30 µg/L Cd, LC10: 0.92 µg/L Cd (1.41);
Test 13; LC50: 0.93 µg/L Cd, LC10: 0.57 µg/L Cd (1.63);
Test 14; LC50: 0.83 µg/L Cd, LC10: 0.58 µg/L Cd (1.43); and,
Test 15; LC50: 0.34 µg/L Cd, LC10: 0.11 µg/L Cd (3.09).

81
Based on the results of 6 tests, the ratio of the LC50 to the LC10 ranged from 1.26 to 3.09
(geometric mean = 1.64). Therefore, the minimum uncertainty factor of 2 was considered
to be protective of the most sensitive species against short-term effects on survival (i.e., <
10% mortality). The resultant WQG of 0.288 µg/L at 50 mg/L CaCO3 is also protective
against adverse effects on behaviour in rainbow trout (e.g., Sloman et al. 2003).
The recommended short-term maximum WQG for Cd (0.288 μg/L) is directly applicable
to waters with a hardness of 50 mg/L CaCO3. The following equation is recommended to
calculate short-term maximum WQGs for other waters:
WQGSHORT-TERM = e[1.03 * ln(Hss) - 5.274]
Where: HSS = site-specific water hardness (mg/L CaCO3)
The short-term maximum WQGs derived using this equation were evaluated against the
raw toxicological data presented in the primary and secondary studies (Figure 7).
Because none of the reported effect values for Cd were less than the short-term WQG, it
was concluded that the recommended short-term WQG was protective of a diverse range
of organisms and water quality conditions (i.e., as indicated by water hardness).
As the range of water hardness in the water-only toxicity tests used to derive the
relationship between short-term toxicity and hardness was limited to between 7 and 455
mg/L CaCO3, the site-specific WQG should be bounded to this range. In waters with
water hardness below 7 mg/L CaCO3, the guideline should be calculated with a water
hardness of 7 mg/L CaCO3. In conditions with water hardness above 455 mg/L CaCO3, a
site-specific assessment may be required.

82
Figure 7. Distribution of responses from water-only toxicity tests classified as
primary and secondary studies relative to the short-term maximum guideline for
cadmium.
9.4.2 Long-Term Average Water Quality Guidelines
The 28 primary long-term studies contained data on 1 BC resident aquatic plant species,
1 resident algal species, 13 resident fish species (including 8 salmonid species), 11
resident invertebrate species, and 1 resident amphibian species (Table 10). These data
were considered sufficient to meet the minimum data requirements for the development
of a long-term average WQG. In addition, a total of 15 studies provided secondary long-
term data that were used to support the development of the guideline.
The primary and secondary studies were used to compile 394 effect values for species
resident in BC. These results were normalized to a hardness of 50 mg/L CaCO3 using
Hardness (mg/L CaCO3 )
LC
50
0.1 1 10 100 1,000
0.01
0.1
1
10
100
1,000
10,000
Amphibian
Fish (Non-salmonid)
Fish (Salmonid)
Invertebrate (Aquatic Life Stage)
Invertebrate (Amphipod)
Invertebrate (Cladoceran)
Invertebrate (Decapod)
Invertebrate (Hydra)
Minimum Primary Study
Water Quality Guideline

83
Table 10. Studies used to meet the data requirements for developing a long-term water
quality guideline.
Receptor Group / Species (all
resident in BC)
Selected Toxicity
Test EndpointA Dur.
Normalized Effect
Value (µg/L; CI) Reference
Fish – Non-Salmonid Species
Catostomus commersoni LOEC; bio 40-d 13 Eaton et al. (1978)
Cottus bairdi LOEC; bio 21-d 0.764 Besser et al. (2007)
Esox lucius LOEC; bio 35-d 13.9 Eaton et al. (1978)
Pimephales promelas LOEC; gro 7-d 2.18 Castillo & Longley (2001)
Pimephales promelas LC50 10-d 3.54 (2.88 - 4.42) Suedel et al. (1997)
Acipenser transmontanus LC20 27-d 6.79 (6.17 - 7.42) Vardy et al. (2011) Fish – Salmonid Species
Oncorhynchus kisutch LOEC; bio 27-d 3.67 Eaton et al. (1978)
Oncorhynchus mykiss LOEC; bio 28-d 1.59 Besser et al. (2007)
Oncorhynchus mykiss LC10 200-h 1.24 (1.06 - 1.42) Chapman (1978)
Oncorhynchus mykiss LC50 7-d 2.43 (2.09 - 2.78) Cusimano et al. (1986)
Oncorhynchus mykiss LOEC; mor 30-d 4.69 Hollis et al. (1999)
Oncorhynchus mykiss LOEC; mor 30-d 3.19 Hollis et al. (2000b)
Oncorhynchus mykiss LOEC; gro 62-d 0.237 Mebane et al. (2008)
Oncorhynchus tshawytscha LC10 200-h 2.13 (1.59 - 2.48) Chapman (1978)
Oncorhynchus tshawytscha LOEC; mor 120-d 3.13 Chapman (1982)
Prosopium williamsoni IC20; bio 90-d 1.33 (NR) Brinkman & Vieira (2008)
Salmo trutta IC20; bio 30-d 1.29 (NR) Brinkman & Hansen (2007)
Salmo trutta LOEC; bio 63-d 4.00 Eaton et al. (1978)
Salvelinus confluentus LOEC; gro 55-d 1.13 Hansen et al. (2002b)
Salvelinus fontinalis LOEC; bio 150-d 4.11 Eaton et al. (1978)
Salvelinus fontinalis LOEC; gro 60-d 4.53 Sauter et al. (1976)
Salvelinus namaycush LOEC; bio 74-d 13.3 Eaton et al. (1978) Invertebrates
Baetis rhodani LC50 120-h 1000 (NR) Gerhardt (1992)
Chironomus riparius LC50 10-d 382 (273 - 545) Watts & Pascoe (2000)
Chironomus dilutus LOEC; gro 14-d 221 Suedel et al. (1997)
Chironomus dilutus LC50 10-d 403 (273 - 600) Watts & Pascoe (2000)
Leptophlebia marginata LC50 120-h 3600 (NR) Gerhardt (1992)
Rhithrogena hageni LOEC; mor 10-d 3,630 Brinkman & Johnston (2008)
Gammarus pulex LOEC; mor 120-h 2.29 Felten et al. (2008)
Hyalella azteca IC20; bio 28-d 0.253 (0.0 - 1.11) CEC, Inc. (2004)
Hyalella azteca LOEC; mor 14-d 0.553 Suedel et al. (1997)
Ceriodaphnia dubia LOEC; rep 14-d 8.85 Suedel et al. (1997)
Daphnia magna IC20; rep 21-d 1.35 (1.16 - 1.73) CEC, Inc. (2004)
Daphnia magna LC50 14-d 6.20 (5.48 - 6.92) Suedel et al. (1997)
Daphnia pulex IC20; mor 18-d 1.41 (0.358 - NC) CEC, Inc. (2004)
Daphnia pulex LOEC; mor 60-d 5.75 Ingersoll & Winner (1982)
Orconectes virilis LC50 14-d 1,130 (809 - 1,590) Mirenda (1986) Plants/Algae
Lemna minor EC50; gro rate 7-d 88.5 (NR) Drost et al. (2007)
Pseudokirchneriella subcapitata EC20; gro rate 72-h 23.3 (15.9 - 35.0) Källqvist 2009 Amphibians
Ambystoma gracile LOEC; gro 24-d 209 Nebeker et al. (1995)
CI = confidence interval; Dur. = duration; CEC, Inc. = Chadwick Ecological Consultants, Inc.; EC = effective concentration;
IC = inhibitory concentration; LC = lethal concentration; LOEC = lowest observed effect concentration; bio = biomass; gro = growth;
mor = mortality; rep = reproduction; NR = not reported; NC = not calculable. A The toxicity test endpoint corresponding to the lowest normalized effect value is reported.

84
the equation described in Section 9.3.3. These data included multiple endpoints and
effect levels for the same species, life-stage, and test duration; therefore the data were
sorted and only the endpoint-effect combinations that yielded the lowest effects
thresholds (i.e., most sensitive) from each study were selected for further use in the
guideline derivation. From this process, 116 low effect values were selected for deriving
the WQG (Table A2.6). These values were plotted to show the distribution of effect
values by species (Figure 8). The minimum effect value from a primary study (0.253
Figure 8. Distribution of low-effects threshold valuesA,B
from the primary and
secondary studies used to determine the long-term toxicity of cadmium in
freshwater environments.
A. All values are normalized to a hardness of 50 mg/L CaCO3.
B. All low−effect thresholds used in the analysis are presented in Table A2.6.
µg/L; IC20 for H. azteca biomass; Chadwick Ecological Consultants, Inc. 2004) was used
to support the derivation of the long-term average WQG. Similarly, a LOEC of 0.237 was
Low-Effect ThresholdB
Primary Study Secondary Study
Min
imu
m L
ow
-Eff
ect
Th
resh
old
(P
rim
ary
Stu
dy)
Lon
g-t
erm
Wa
ter
Qu
alit
y G
uid
elin
e (
0.1
27 µ
g/L
at
50 m
g/L
Ca
CO
3 H
ard
ness)
Pseudokirchneriella subcapitataLemna minor
Baetis rhodaniLeptophlebia marginataRhithrogena hageniChironomus ripariusChironomus dilutusEchinogammarus meridionalisGammarus pulexHyalella aztecaCeriodaphnia dubiaCeriodaphnia reticulataDaphnia magnaDaphnia pulexOrconectes virilisHydra viridissimaHydra vulgaris
Pimephales promelasCottus bairdiEsox luciusAcipenser transmontanusCatostomus commersoni
Salvelinus fontinalisSalmo truttaSalvelinus confluentusOncorhynchus tshawytschaOncorhynchus kisutchSalvelinus namaycushProsopium williamsoniOncorhynchus mykiss
Ambystoma gracile
Plants and Algae
Invertebrates
Fish (Non-salmonids)
Fish (Salmonids)
Amphibians
0.01 0.1 1 10 100 1,000 10,000

85
reported for O. mykiss growth (Mebane et al. 2008); however, the authors reported that a
clear dose-response relationship was not apparent and suggested that the endpoint was
not a robust estimate of an effects threshold.
Sufficient data were not available in the literature to quantitatively evaluate the
uncertainty associated with the lowest effect levels that were selected to support
derivation of the long-term average WQG (0.253 μg/L Cd at 50 mg/L CaCO3 hardness;
Chadwick Ecological Consultants, Inc. 2004). However, data from a secondary study on
cladocerans indicated that the reproduction of D. pulex in 14-d exposures or of C.
reticulata in 7-d exposures has the potential to be adversely affected at Cd concentrations
of 0.122 and 0.0675 μg/L Cd at 50 mg/L CaCO3 hardness, respectively (Elnabaraway et
al. 1986). However, there is a high level of uncertainty in the results of the Elnabaraway
study (i.e., only nominal concentrations were reported and there were typographical
errors in the form of Cd reported). In addition, data from a study that did not report all of
the information required to receive a primary or secondary classification indicated that no
adverse effects on the feeding rates or brood mass of D. magna were observed at 0.081
μg/L Cd at 50 mg/L CaCO3 (Barata and Baird 2000). In another secondary study,
Ingersoll and Kemble reported an IC25 for H. azteca biomass of 0.144 µg/L Cd at 50
mg/L CaCO3; however, a clear dose-response relationship was not observed in the
underlying data. When considered together with the other information contained in the
toxicological data set, these data suggest that application of the minimum uncertainty
factor of 2 to the selected lowest effect level is likely to result in a long-term average
WQG that would protect the most sensitive life-stages of the most sensitive species of
aquatic organisms in BC waters. Therefore, a long-term average WQG of 0.127 μg/L is
recommended for Cd at a water hardness of 50 mg/L CaCO3.
It is recommended that the long-term (30-d) average WQG for Cd to protect the most
sensitive life-stage of the most sensitive species be adjusted to the site-specific water
hardness using the following equation:

86
WQGLONG-TERM = e[0.736 * ln(Hss) - 4.943]
Where: HSS = site-specific water hardness (mg/L CaCO3)
The derived long-term average WQG was evaluated against the raw toxicological data
presented in the primary and secondary studies (Figure 9). It was determined that the
recommended long-term WQG was protective of aquatic life across the full range of
organisms and water quality conditions tested.
Figure 9. Distribution of responses from water-only toxicity tests classified as
primary and secondary studies relative to the long-term average guideline for
cadmium.
A. All low−effect thresholds used in the analysis are presented in Table A2.6.
As the range of water hardness in the water-only toxicity tests used to derive the
relationship between long-term toxicity and hardness was limited to between 3.4 and 285
mg/L CaCO3, the site-specific application of the WQG should be bounded to this range.
In waters with water hardness below 3.4 mg/L CaCO3, the guideline should be calculated
Hardness (mg/L CaCO3 )
Low
-Effect T
hre
shold
A
0.1 1 10 100 1,000
0.01
0.1
1
10
100
1,000
10,000
Results fromElnabaraway et al.
(1986; Secondary
Study)
Algae
Amphibian
Aquatic Plant
Fish (Non-salmonid)
Fish (Salmonid)
Invertebrate (Aquatic Life Stage)
Invertebrate (Amphipod)
Invertebrate (Cladoceran)
Invertebrate (Decapod)
Invertebrate (Hydra)
Minimum Primary Study
Water Quality Guideline

87
with a water hardness of 3.4 mg/L CaCO3. In conditions with water hardness above 285
mg/L CaCO3, a site-specific assessment may be required.
9.4.3 Evaluation of Uncertainty in the Water Quality Guidelines for Cadmium
The toxicological data that were used to establish the preliminary short-term maximum
and 30-day average WQGs for Cd (i.e., the minimum effect values from the key primary
studies) were both derived from regression-based estimates of the relationship between
the concentration of Cd and organism response. As such, these regression-based effect
values have an associated source of error around the parameter estimate. Specifically, the
95% confidence interval around the selected LC50 for rainbow trout fry of 0.36 μg/L Cd
(at a hardness of 31.7 mg/L CaCO3; 0.576 μg/L Cd when normalized to 50 mg/L CaCO3)
was calculated to be 0.33 to 0.40 μg/L Cd. The error around the selected LC50 is minimal
and not expected to be a major source of uncertainty in the short-term maximum WQG.
However, the error associated with the IC20 for the amphipod (H. azteca) of 0.5 μg/L Cd
(at a hardness of 126 mg/L CaCO3; 0.253 µg/L Cd when normalized to 50 mg/L CaCO3)
was reported to be between 0 and 1.11 μg/L Cd (normalized to 50 mg/L CaCO3) in
Chadwick Ecological Consultants, Inc. (2004). While the confidence interval around the
endpoint estimate is relatively large, additional tests conducted by Chadwick Ecological
Consultants, Inc. (2004) reported similar IC20 estimates, normalized to 50 mg/L CaCO3
(IC20 for survival of 0.265 (0.143 – 0.499) μg/L Cd, IC20 for growth 0.335 (0.150 –
0.623) μg/L Cd, and an IC20 for survival of 0.400 (0.0878 – 0.505) μg/L Cd). An
uncertainty factor of 2 has been applied to the long-term guideline and is expected to
produce a conservative guideline.
The toxicological data compiled to develop the short-term maximum and long-term
average WQG for Cd were normalized to a standard hardness of 50 mg/L CaCO3 using
an approach consistent with methods used by USEPA (2001) and Mebane (2010). As the
estimated slopes of the relationship between water hardness and Cd toxicity were
developed using a regression-based approach, the error associated with the slope estimate
could be ascertained. The 95% confidence interval around the estimated slope of 1.03

88
used in this study was calculated to be 0.61 to 1.45. The error associated with this slope
estimate was not expected to greatly influence the result of the WQG derivation for two
reasons. First, the predicted slope established by Meyer (1999) for a mid-range of water
hardness (20 to 200 mg/L CaCO3) was determined to be 1.0, based on modelling of the
competitive binding of cations in fish gills. Second, USEPA has developed a similar
slope estimate (1.02; 0.975 - 1.06), that is consistent with the results of this analysis.
However, using the 95% confidence interval derived from our slope to determine the
bounds for the LC50 selected to support WQG development (i.e., 0.576 μg/L Cd at a
hardness of 50 mg/L CaCO3) results in a predicted range of 0.475 to 0.697 μg/L Cd; this
is above the short-term maximum WQG of 0.288 μg/L Cd (at a hardness of 50 mg/L
CaCO3). Therefore, the error associated with the slope estimate for the short-term
toxicological data is not expected to introduce potential risks to aquatic life.
Similarly, the 95% confidence interval around the estimated slope for normalizing the
long-term data of 0.736 was calculated to be 0.546 to 0.926. This slope is similar to that
calculated by USEPA (2001) and Mebane (2010), and is not expected to greatly influence
the results of the WQG derivation. Application of the 95% confidence interval derived
from the slope estimate to establish estimated bounds for the effect value selected to
support long-term WQG development (0.253 μg/L Cd at a hardness of 50 mg/L CaCO3)
results in a predicted range of 0.212 to 0.302 μg/L Cd, which is above the final guideline
of 0.127 μg/L Cd (at a hardness of 50 mg/L CaCO3). Therefore, the error associated with
the slope estimate for the long-term toxicological data is not expected to introduce
potential risks to aquatic life.
The process used to derive the slope estimates for normalizing the toxicological data to a
standard hardness involved transforming the raw toxicological data and water hardness
using a natural log transformation. The calculation of a slope estimate and back-
calculating a predicted effect value may introduce bias into the estimated effect value
(Newman 1991). To determine the potential influence on the predicted effect value, the
bias was calculated using the method provided in Newman (1991) for the pooled slope

89
estimates. It was found that the slope estimate could bias the predicted effect value
downward (i.e., lower) by 34% for the short-term data, and 16% for the long-term data.
However, the bias would not influence the relative position of the normalized effect
values and therefore will not affect the derived short-term maximum and long-term
average guidelines.
The short-term maximum and long-term average guidelines developed in this document
were not derived using information that allows for the direct evaluation of the toxic
effects of Cd in combination with other stressors (e.g., the possible synergistic or
antagonistic interactions with other contaminants). Rather, the application of an
uncertainty factor is meant to account for various uncertainties (including multiple
stressors). Additional investigation may be needed at sites with multiple contaminants to
ensure the protection of aquatic life. Importantly, the interactions and therefore, toxicity,
of other metals that have similar modes of toxicity (e.g., copper, lead, and zinc) is not
considered in this guideline. Therefore, site-specific assessments of water quality
conditions should utilize toxic units models or similar approaches to evaluate the joint
effects of multiple contaminants for substances that have similar modes of toxicity (e.g.,
USEPA 2005).
The short-term maximum and long-term average guidelines have been developed using
the results of toxicity tests in water-only exposures using dissolved Cd salts, which are
highly bioavailable under laboratory conditions (i.e., under neutral pH and low DOM).
While the short-term maximum and long-term average guidelines have been developed
by accounting for the ameliorating effects of hardness, site-specific water-quality
conditions can further affect the toxicity of Cd to freshwater organisms. For example,
acidic or alkaline systems are expected to affect the uptake and bioavailability of Cd.
Furthermore, systems with elevated levels of DOM, especially ligands that readily bind
with Cd, may reduce the bioavailability and therefore toxicity of Cd. Site-specific
assessments may be conducted for water bodies with naturally high levels of DOM or
atypical pH to account for their potential influence on Cd toxicity (BC MOE 2013).

90
The WQGs for Cd were developed based on the results of toxicity tests in water-only
exposures under laboratory conditions. While there is some evidence indicating that
bioaccumulation of Cd (i.e., through the ingestion of contaminated prey and direct
contact with water) contributes to the overall body burden in some species and/or trophic
levels, the mechanism for bioaccumulation and conditions under which bioaccumulation
is a primary factor in Cd body burden have not been clearly established. Therefore, Cd
body burden in systems that favour the bioaccumulation of Cd in freshwater aquatic
organisms may be higher than expected based on direct exposure to water alone.
9.4.4 Application of Water Quality Guidelines for Cadmium
The WQGs for the protection of aquatic life represent levels that are meant to be
protective of the most sensitive life-stage of the most sensitive species to either short-
term or long-term exposure to Cd. The short-term maximum guideline represents a level
that should not be exceeded at any given time (i.e., instantaneous maximum), whereas the
long-term average guideline represents a level that the 30-day average concentration
(calculated as the mean of 5 weekly samples within 30 days) should not exceed. In order
to generate data with a high level of precision and accuracy for the evaluation of water
quality conditions relative to the WQGs, it is recommended that MDLs should be, at
minimum, five times below the ambient WQG to ensure this higher level of precision and
accuracy. However, in cases where laboratories have defined PQLs, is recommended
that the PQL be at or below the ambient WQG.
The WQGs for Cd have been developed as equations that take into account the water
hardness of the system. Generally, the WQGs for Cd can be directly applied to water
bodies in the province. However, as the ameliorating effects of hardness are tightly
linked to the pH and alkalinity of the system in natural surface waters, due care should be
taken in systems in which the ratio of ions that make up water hardness is significantly
altered by anthropogenic discharge. In these systems, the recommended WQG may or
may not be protective of all freshwater aquatic species. Furthermore, the recommended
WQGs for Cd may or may not be suitable in waters that exhibit elevated levels of DOM,

91
elevated levels of total dissolved solids (TDS), atypical pH, or saltwater intrusion. In
these cases, a site-specific assessment may be required.
The short-term maximum and long-term average WQGs were developed using toxicity
results generated from laboratory studies in which aquatic organisms were exposed to
water spiked with Cd salts that are highly bioavailable and exist in the exposure chambers
in the dissolved fraction. Thus, the derived short-term maximum and long-term average
WQGs apply to the measured dissolved Cd fraction in environmental samples. While
consideration of dissolved metals does neglect the potential toxicity of particulate-
associated metals, most studies indicate that the particulate fraction is substantially less
toxic than the dissolved fraction. In addition, sediment quality guidelines (e.g., BC MOE
2006; CCME 2014b) provide a basis for evaluating the toxicity of particulate-associated
metals directly (i.e., when metal-contaminated particulates settle out of the water column
and become associated with bottom sediments). Tissue residue guidelines provide a basis
for evaluating the significance of tissue-associated metals. As the concentrations of total
Cd and other metals in BC waters are highly variable, depending in large measure on
flow regime and associated changes in the levels of suspended sediments in the water, the
application of WQGs (generated using toxicological data reflecting dissolved metal
concentrations) to measured concentrations of total metals is likely to result in overly
conservative evaluations of water quality conditions. Accordingly, the short-term
maximum and long-term average WQGs derived herein are intended to be applied to the
dissolved fraction of Cd in environmental samples.
9.4.5 Research and Development Needs
The majority of research on the toxicity of Cd has been completed on fish and aquatic
invertebrates, and to a lesser degree, algae and aquatic plants. To better understand the
impacts of exposure to Cd on aquatic species, more research is needed on the toxicity of
metals (including Cd) on amphibians, especially species that are resident in BC.
Amphibians are declining in number around the world (Wake and Vredenburg 2008),

92
making it especially important to better understand how contaminants like Cd affect
them.
An important component in the evaluation of potential risks to aquatic life is the routine
generation of reliable and usable data. As such, appropriate MDLs need to be achieved
for monitoring programs that are designed to evaluate water quality conditions relative to
ambient WQGs. Therefore, there is a need for establishing analytical methods that
generate data with a high level of precision and accuracy. MDLs used should be, at
minimum, five times below the ambient WQG to ensure this higher level of precision and
accuracy. However, in cases where laboratories have defined PQLs, it is recommended
that the PQL be at or below the ambient WQG.
While some research on the toxicity of chemical mixtures has been conducted (e.g.,
Mebane et al. 2012), the cumulative effects of multiple contaminants and the associated
effects on aquatic life are not completely understood and are difficult to regulate without
site-specific assessments of the chemical mixture. Interactions (including synergistic and
antagonistic) between these chemicals may increase or decrease their toxicity. In
addition, multiple contaminants have the potential to become multiple stressors to aquatic
organisms. As such, research on the integration of WQGs in the context of stressor
identification and evaluation in a mixture at a site is an area that requires further research.
Finally, the development and application of a biotic-ligand model for Cd have the
potential to provide tools that more accurately predict the effects of ambient water quality
on metal toxicity in fish, considered to be the most sensitive organisms to short-term
exposure to Cd. The integration of the concentrations of metals, cations, and ligands into
the assessment of metals toxicity is an important factor in determining how site-specific
conditions influence the toxicity of the metals in the system, the cumulative effects of
metals contamination, and the impacts on the aquatic life of the system.

93
10.0 References Cited
Alberta Environment. 1999. Surface water quality guidelines for use in Alberta.
Environmental Assurance Division, Science and Standards Branch. Pub. No.: T/483.
ISBN: 0-7785-0897-8.
Alonso, A., H.J. De Lange, and E.T.H.M. Peeters. 2010. Contrasting sensitivities to
toxicants of freshwater amphipods Gammarus pulex and G. fossarum. Ecotoxicology
19:133-140.
Alsop, D.H. and C.M. Wood. 2011. Metal uptake and acute toxicity in zebrafish:
common mechanisms across multiple metals. Aquatic Toxicology 105(385):385-393.
ANZECC (Australia and New Zealand Environment and Conservation Council). 2000a.
National Water Quality Management Strategy. Paper No. 4. Australian and New
Zealand Guidelines for Fresh and Marine Water Quality. Volume 1: The Guidelines,
Chapter 3.
ANZECC (Australia and New Zealand Environment and Conservation Council). 2000b.
National Water Quality Management Strategy. Paper No. 4. Australian and New
Zealand Guidelines for Fresh and Marine Water Quality. Volume 2: Aquatic
Ecosystems - Rationale and Background Information.
Arnot, J.A. and F.A.P.C. Gobas 2006. A review of bioconcentration factor (BCF) and
bioaccumulation factor (BAF) assessments for organic chemicals in aquatic
organisms. Environmental Reviews 14:257-297.
ASTM (American Society for Testing and Materials). 2012a. Standard guide for
conducting bioconcentration tests with fishes and saltwater bivalve mollusks: ASTM
E1022-94 (2007). Annual Book of ASTM Standards Volume 11.06. West
Conshohocken, Pennsylvania.
ASTM (American Society for Testing and Materials). 2012b. Standard guide for
conducting acute toxicity tests on test materials with fishes, macroinvertebrates, and
amphibians: ASTM E729-96 (2007). Annual Book of ASTM Standards Volume
11.06. West Conshohocken, Pennsylvania.
ASTM (American Society for Testing and Materials). 2012c. Standard guide for
conducting early life-stage toxicity tests with fishes: ASTM E1241-05. Annual Book
of ASTM Standards Volume 11.06. West Conshohocken, Pennsylvania.
ATSDR (Agency for Toxic Substances and Disease Registry). 2012. Toxicological
profile for cadmium: Update. United States Department of Health and Human
Services. Public Health Service. Atlanta, Georgia.

94
Baer, K.N., M.C. Ziegenfuss, D. Banks, and Z. Ling. 1999. Suitability of high-hardness
COMBO medium for ecotoxicity testing using algae, daphnids, and fish. Bulletin of
Environmental Contamination and Toxicology 63:289-296.
Barata, C. and D.J. Baird. 2000. Determining the ecotoxicological mode of action of
chemicals from measurements made on individuals: Results from instar-based tests
with Daphnia magna Straus. Aquatic Toxicology 48:195-209.
Barata, C., D.J. Baird, A. Miñarro, and A.M.V.M. Soares. 2000. Do genotype responses
always converge from lethal to nonlethal toxicant exposure levels? Hypothesis tested
using clones of Daphnia magna Straus. Environmental Toxicology and Chemistry
9:2314-2322.
Barron, M.G. 1990. Bioconcentration. Environmental Science and Technology 24:1612-
1618.
BC MOE (British Columbia Ministry of Environment). 2006. A compendium of working
water quality guidelines for British Columbia. Science and Information Branch.
British Columbia Ministry of Environment. Accessed 15 October 2014 from:
http://www.env.gov.bc.ca/wat/wq/BCguidelines/working.html#table2.
BC MOE (British Columbia Ministry of Environment). 2012. Derivation of water quality
guidelines to protect aquatic life in British Columbia. Water Protection and
Sustainability Branch, Environmental Sustainability and Strategic Policy Division,
British Columbia Ministry of Environment. 34 p.
BC MOE (British Columbia Ministry of Environment). 2013. Guidance for the
derivation and application of water quality objectives in British Columbia. Water
Protection and Sustainability Branch, Environmental Sustainability and Strategic
Policy Division, British Columbia Ministry of Environment. 146 p.
Beach, M.J. and D. Pascoe. 1998. The role of Hydra vulgaris (Pallas) in assessing the
toxicity of freshwater pollutants. Water Research 32:101-106.
Béchard, K.M., P.L. Gillis, and C.M. Wood. 2008. Acute toxicity of waterborne Cd, Cu,
Pb, Ni and Zn to first-instar Chironomus riparius larvae. Archives of Environmental
Contamination and Toxicology 54:454-459.
Benhra, A., C.M. Radetski, and J.F. Férard. 1997. Cryoalgotox: Use of cryopreserved
alga in a semistatic microplate test. Environmental Toxicology and Chemistry
16:505-508.
Benoit, D.A., E.N. Leanard, G.M. Christensen, and J.T. Fiandt. 1976. Toxic effects of
cadmium on three generations of brook trout (Salvelinus fontinalis). Transactions of
the American Fisheries Society 105:550-560.
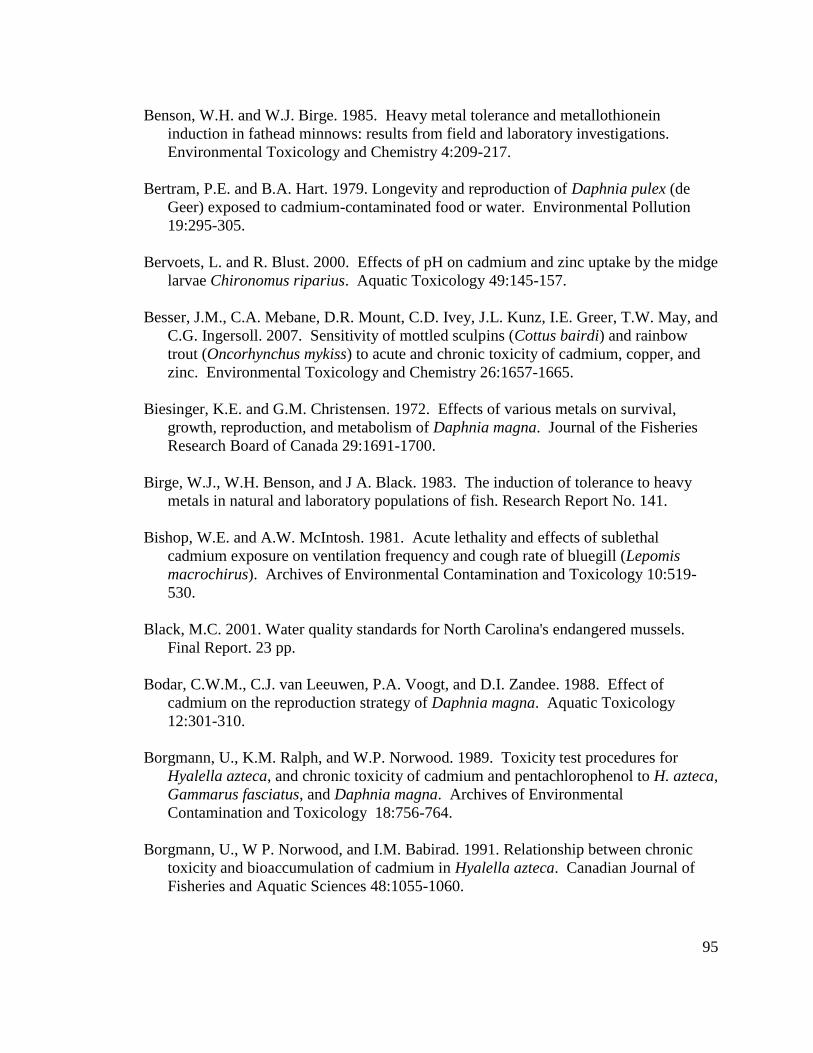
95
Benson, W.H. and W.J. Birge. 1985. Heavy metal tolerance and metallothionein
induction in fathead minnows: results from field and laboratory investigations.
Environmental Toxicology and Chemistry 4:209-217.
Bertram, P.E. and B.A. Hart. 1979. Longevity and reproduction of Daphnia pulex (de
Geer) exposed to cadmium-contaminated food or water. Environmental Pollution
19:295-305.
Bervoets, L. and R. Blust. 2000. Effects of pH on cadmium and zinc uptake by the midge
larvae Chironomus riparius. Aquatic Toxicology 49:145-157.
Besser, J.M., C.A. Mebane, D.R. Mount, C.D. Ivey, J.L. Kunz, I.E. Greer, T.W. May, and
C.G. Ingersoll. 2007. Sensitivity of mottled sculpins (Cottus bairdi) and rainbow
trout (Oncorhynchus mykiss) to acute and chronic toxicity of cadmium, copper, and
zinc. Environmental Toxicology and Chemistry 26:1657-1665.
Biesinger, K.E. and G.M. Christensen. 1972. Effects of various metals on survival,
growth, reproduction, and metabolism of Daphnia magna. Journal of the Fisheries
Research Board of Canada 29:1691-1700.
Birge, W.J., W.H. Benson, and J A. Black. 1983. The induction of tolerance to heavy
metals in natural and laboratory populations of fish. Research Report No. 141.
Bishop, W.E. and A.W. McIntosh. 1981. Acute lethality and effects of sublethal
cadmium exposure on ventilation frequency and cough rate of bluegill (Lepomis
macrochirus). Archives of Environmental Contamination and Toxicology 10:519-
530.
Black, M.C. 2001. Water quality standards for North Carolina's endangered mussels.
Final Report. 23 pp.
Bodar, C.W.M., C.J. van Leeuwen, P.A. Voogt, and D.I. Zandee. 1988. Effect of
cadmium on the reproduction strategy of Daphnia magna. Aquatic Toxicology
12:301-310.
Borgmann, U., K.M. Ralph, and W.P. Norwood. 1989. Toxicity test procedures for
Hyalella azteca, and chronic toxicity of cadmium and pentachlorophenol to H. azteca,
Gammarus fasciatus, and Daphnia magna. Archives of Environmental
Contamination and Toxicology 18:756-764.
Borgmann, U., W P. Norwood, and I.M. Babirad. 1991. Relationship between chronic
toxicity and bioaccumulation of cadmium in Hyalella azteca. Canadian Journal of
Fisheries and Aquatic Sciences 48:1055-1060.

96
Borgmann, U., Y. Couillard, P. Doyle, and D.G. Dixon. 2005. Toxicity of sixty-three
metals and metalloids to Hyalella azteca at two levels of water hardness.
Environmental Toxicology and Chemistry 24:641-652.
Brinkman, S.F.,and D.L. Hansen. 2007. Toxicity of cadmium to early life stages of
brown trout (Salmo trutta) at multiple water hardnesses. Environmental Toxicology
and Chemistry 26:1666-1671.
Brinkman, S.F. and W.D. Johnston. 2008. Acute toxicity of aqueous copper, cadmium
and zinc to the mayfly Rhithrogena hageni. Archives of Environmental
Contamination and Toxicology 54:466-472.
Brinkman, S. and N. Vieira. 2008. Water pollution studies: federal aid project F-243-R15.
38 pp.
Brown, V., D. Shurben, W. Miller, and M. Crane. 1994. Cadmium toxicity to rainbow
trout Oncorhynchus mykiss Walbaum and brown trout Salmo trutta L. over extended
exposure periods. Ecotoxicology and Environmental Safety 29:38-46.
Budavari, S., M.J. O'Neil, A. Smith, and P.E. Heckelman (Eds.). 1989. The Merck
Index: An encyclopedia of chemicals, drugs, and biologicals. Eleventh Edition.
Merck and Company, Inc. Rahway, New Jersey.
Buhl, K. J. and S. J. Hamilton. 1991. Relative sensitivity of early life stages of Arctic
grayling, coho salmon, and rainbow trout to nine inorganics. Ecotoxicology and
Environmental Safety 22:184-197.
Burke, B.E. and R.M. Pfister. 1988. The removal of cadmium from lake water by lake
sediment bacteria. In: Proceedings of the Annual Meeting of the American Society
for Microbiology, Miami Beach, Florida, USA, May 8-13, 1988. (As cited in ATSDR
2012).
Cain, J.R., D.C. Paschal, and C.M. Hayden. 1980. Toxicity and bioaccumulation of
cadmium in the colonial green alga Scenedesmus obliquus. Archives of
Environmental Contamination and Toxicology 9:9-16.
Cairns, J., Jr., A.G. Heath, and B.C. Parker. 1975. The effects of temperature upon the
toxicity of chemicals to aquatic organisms. Hydrobiolgia 47:135-171.
Campbell, P.G.C. 1995. Interaction between trace metals and aquatic organisms: A
critique of the free-ion activity model. In: Tessier, A., Turner, D.R. (Eds.), Metal
Speciation and Bioavailability in Aquatic Systems. John Wiley & Sons Ltd.,
Chichester, England, pp. 45-102. (As cited in Gueguen et al. 2003).

97
Campbell, P.G.C. and P.M. Stokes. 1985. Acidification and toxicity of metals to aquatic
biota. Canadian Journal of Fisheries and Aquatic Sciences 42:2034-2049.
Canton, J. W. and W. Slooff. 1982. Toxicity and Accumulation studies of cadmium (Cd 2+
) with freshwater organisms of different trophic levels. Ecotoxicology and
Environmental Safety 6:113-128.
Carrier, R. and T.L. Bettinger. 1988. Resistance of temperature tolerance ability of green
sunfish to cadmium exposure. Bulletin of Environmental Contamination and
Toxicology 40:475-480.
Castillo, V., III and G. Longley. 2001. Comparison of EPA target toxicity aquatic test
organisms to the fountain darter: 7 day chronic toxicity test using cadmium chloride,
performed 11/12/99-3/6/00 (5 parts). Federal Assistance Agreement No. X-986345-
01.
Caux, P.Y., D.R.J. Moore, and D.D. MacDonald. 1997. Ambient water quality
guidelines (criteria) for turbidity, suspended and benthic sediments (technical
appendix). Prepared for B.C. Ministry of Environment, Lands and Parks. Prepared by
Cadmus Group Inc., Ottawa, Ontario and MacDonald Environmental Sciences Ltd.,
Nanaimo, British Columbia.
CCME (Canadian Council of Ministers of the Environment). 1999. Canadian water
quality guidelines for the protection of aquatic life: Cadmium. In: Canadian
Environmental Quality Guidelines, 1999, Canadian Council of Ministers of the
Environment, Winnipeg, Manitoba.
CCME (Canadian Council of Ministers of the Environment). 2007. A protocol for the
derivation of water quality guidelines for the protection of aquatic life 2007. In:
Canadian environmental quality guidelines, 1999, Canadian Council of Ministers of
the Environment, 1999, Winnipeg, Manitoba.
CCME (Canadian Council of Ministers of the Environment). 2014a. Canadian Water
Quality Guidelines: Cadmium. Scientific Criteria Document. Winnipeg, Manitoba.
Accessed 19 March 2014 from:
http://www.ccme.ca/files/Resources/supporting_scientific_documents/pn_1515_cwqg
_cadmium_scd.pdf.
CCME (Canadian Council of Ministers of the Environment). 2014b. Canadian
Environmental Quality Guidelines: Summary Table. Accessed 15 October 2014 from:
http://st-ts.ccme.ca.

98
Cearley, J.E. and R.L. Coleman. 1974. Cadmium toxicity and bioconcentration in
largemouth bass and bluegill. Bulletin of Environmental Contamination and
Toxicology 11:146-151.
CFR (Code of Federal Regulations). 2011. Appendix B to Part 136 – Definition and
procedure for the determination of the method detection limit – Revision 1.11.
Chadwick Ecological Consultants, Inc. 2004. Chronic toxicity of cadmium to freshwater
crustaceans at different water hardness concentrations. Chadwick Ecological
Consultants, Incorporated 1-64.
Chapman, G.A. 1978. Toxicities of cadmium, copper, and zinc to four juvenile stages of
chinook salmon and steelhead. Transactions of the American Fisheries Society
107:841-847.
Chapman, G.A. 1982. Chinook salmon early life stage tests with cadmium, copper, and
zinc. Letter of December 6, 1982 to Charles Stephan, U.S. EPA Environmental
Research Laboratory, Duluth, Corvallis, Oregon.4 pp.
Chapman, G.A., S. Ota, and F. Recht. 1980. Effects of water hardness on the toxicity of
metals to Daphnia magna (Status report - January 1980).
Chapman, G.A., M.A. Farrell, and R.O. Brinkhurst. 1982. Relative tolerances of selected
aquatic oligochaetes to individual pollutants and environmental factors. Aquatic
Toxicology 2:47-67.
Clem, S.A. 1998. Complexities in early lifestage testing of freshwater mussels to
selected metals. Department of Biological Sciences, Arkansas State University.
Jonesboro, Arkansas.
Coeurdassier, M., A. de Vaufleury, and P.M. Badot. 2003. Bioconcentration of cadmium
and toxic effects on life-history traits of pond snails (Lymnaea palustris and Lymnaea
stagnalis) in laboratory bioassays. Archives of Environmental Contamination and
Toxicology 45:102-109.
Conway, H.L. and S.C. Williams. 1979. Sorption of cadmium and its effect on growth
and the utilization of inorganic carbon and phosphorus of two freshwater diatoms.
Journal of the Fisheries Research Board of Canada 36:579-586.
Cossa, D. 1976. Sorption of cadmium by a population of the diatom Phaeodactylum
tricornutum in culture. Marine Biology 34:163-167.
Croteau, M-N. and S.N. Luoma. 2007. Characterizing dissolved Cu and Cd uptake in
terms of the biotic ligand and biodynamics using enriched stable isotopes.
Environmental Science and Technology 41:3140-3145.

99
Cusimano, R.F., D.F. Brakke, and G.A. Chapman. 1986. Effects of pH on the toxicities
of cadmium, copper, and zinc to steelhead trout (Salmo gairdneri). Canadian Journal
of Fisheries and Aquatic Sciences 43:1497-1503.
Davies, P.H., W.C. Gorman, C.A. Carlson, and S.F. Brinkman. 1993. Effect of hardness
on bioavailablity and toxicity of cadmium to rainbow trout. Chemical Speciation and
Bioavailability 5(2):67-77.
Diamond, J.M., D.E. Koplish, J. McMahon, and R. Rost. 1997. Evaluation of the water-
effect ratio procedure for metals in a riverine system. Environmental Toxicology and
Chemistry 16:509-520.
Dickson, G.W., J.P. Giesy, and L.A. Briese. 1982. The effect of chronic cadmium
exposure on phosphoadenylate concentrations and adenylate energy charge of gills
and dorsal muscle tissue of crayfish. Environmental Toxicology and Chemistry
1:147-156.
Donker, M.H., H.M. Abdel-Lateif, M.A. Khalil, B.M. Bayoumi, and N.M. van Straalen.
1998. Temperature, physiological time, and zinc toxicity in the isopod Porcellio
scaber. Environmental Toxicology and Chemistry 17:1558-1563.
Drost, W., M. Matzke, and T. Backhaus. 2007. Heavy metal toxicity to Lemna minor:
Studies on the time dependence of growth inhibition and the recovery after exposure.
Chemosphere 67:36-43.
Duncan, D.A. and J.F. Klaverkamp.1983. Tolerance and resistance to cadmium in white
suckers (Catostomus commersoni) previously exposed to cadmium, mercury, zinc, or
selenium. Canadian Journal of Fisheries and Aquatic Sciences 40:128-138.
Eaton, J. G., J. M. McKim, and G. W. Holcombe. 1978. Metal toxicity to embryos and
larvae of seven freshwater fish species - I. Cadmium. Bulletin of Environmental
Contamination and Toxicology 19:95-103.
Edgren, M. and M. Notter. 1980. Cadmium uptake by fingerlings of perch (Perca
fluviatilis) studied by Cd-115m at two different temperatures. Bulletin of
Environmental Contamination and Toxicology 24:647-651.
Elnabarawy, M.T., A.N. Welter, and R.R. Robideau. 1986. Relative sensitivity of three
daphnid species to selected organic and inorganic chemicals. Environmental
Toxicology and Chemistry 5(393):393-398.
Environment Canada. 2012. Cadmium Releases to Water [online]. Government of
Canada. Accessed 3 January 2013 from: http://www.ec.gc.ca/indicateurs-indicators/
default.asp?lang=en&n=7F04A6AB-1.

100
Errécalde, O. and P.G.C. Campbell. 2000. Cadmium and zinc bioavailability to
Selenastrum capricornutum (Chlorophyceae): accidental metal uptake and toxicity in
the presence of citrate. Journal of Psychology 36:473-483.
EU (European Union). 2008. Directive 2008/105/EC of the European Parliament and of
the Council of 16 December 2008. Official Journal of the European Union. L 348.
Accessed 14 January 2013 from: http://eur-
lex.europa.eu/LexUriServ/LexUriServ.do?uri=OJ:L:2008:348:0084:0097:EN:PDF
Faller, P., K. Kienzler, and A. Krieger-Liszkay. 2005. Mechanism of Cd2+
toxicity: Cd2+
inhibits photoactivation of Photosystem II by competitive binding to the essential
Ca2+
site. Biochimica et Biophysica Acta 1706:158-164.
Farag, A.M., C.J. Boese, D.F. Woodward, and H.L. Bergman. 1994. Physiological
changes and tissue metal accumulation in rainbow trout exposed to foodborne and
waterborne metals. Environmental Toxicology and Chemistry 13:2021-2029.
Felten, V., G. Charmantier, R. Mons, A. Geffard, P. Rousselle, and M. Coquery. 2008.
Physiological and behavioural responses of Gammarus pulex (Crustacea Amphipoda)
exposed to cadmium. Aquatic Toxicology 86:413-425.
Ferard, J.F., J.M. Jouany, R. Truhaut, and P. Vasseur. 1983. Accumulation of cadmium
in a freshwater food chain experimental model. Ecotoxicology and Environmental
Safety 7:43-52.
Ferrari, L., A. Salibián, and C.V. Muiño. 1993. Selective protection of temperature
against cadmium acute toxicity in Bufo arenarum tadpoles. Bulletin of Environmental
Contamination and Toxicology 50:212-218.
Ferreira, A.L.G., S. Loureiro, and A.M.V.M. Soares. 2008. Toxicity prediction of binary
combinations of cadmium, carbendazim and low dissolved oxygen on Daphnia
magna. Aquatic Toxicology 89:28-39.
Finlayson, B. J. and K. M. Verrue. 1982. Toxicities of copper, zinc, and cadmium
mixtures to juvenile chinook salmon. Transactions of the American Fisheries Society
111:645-650.
Gagnon, C., G. Vaillancourt, and L. Pazdernik. 1998. Influence of water hardness on
accumulation and elimination of cadmium in two aquatic mosses under laboratory
conditions. Archives of Environmental Contamination and Toxicology 34:12-20.
Gagnon, C., F. Gagne, P. Turcotte, I. Saulnier, C. Blaise, M.H. Salazar, and S.M. Salazar.
2006. Exposure of caged mussels to metals in a primary-treated municipal
wastewater plume. Chemosphere 62:998-1010.

101
Gallagher, K. 2013. Personal communication. Update on Aquatic Life Criteria
Development. Presentation at the North American Metals Council Se Working
Group meeting. Nashville, TN. November 22, 2013.
Garcia-Santos, S., A. Fontainhas-Fernandes, and J.M. Wilson. 2006. Cadmium tolerance
in the Nile tilapia (Oreochromis niloticus) following acute exposure: Assessment of
some ionoregulatory parameters. Environmental Toxicology 21:33-46.
Gauthier, C., P. Couture, and G.G. Pyle. 2006. Metal effects on fathead minnows
(Pimephales promelas) under field and laboratory conditions. Ecotoxicology and
Environmental Safety 63:353-364.
Gerhardt, A. 1990. Effects of subacute doses of cadmium on pH-stressed Leptophlebia
marginata (L.) and Baetis rhodani Pictet (Insecta: Ephemeroptera). Environmental
Pollution 67:29-42.
Gerhardt, A. 1992. Acute toxicity of Cd in stream invertebrates in relation to pH and test
design. Hydrobiologia 239:93-100.
Gholami, M., S.M.R. Fatemi, A. Esmaili, and A. Mashinchiyan. 2010. Effects of heavy
metals (copper and cadmium) and detergent (LAS) on white fish fry Rutilus frisii
Kutum. Research Journal of Environmental Toxicology 4(4):231-236.
Giesy, J. P., G. J. Leversee, Jr. and D. R. Williams. 1977. Effects of naturally occurring
aquatic organic fractions on cadmium toxicity to Simocephalus cerrulatus
(Daphnidae) and Gambusia affinis (Poeciliidae).Water Research 11:1013-1020.
Giesy, J.P., J.W. Bowling, H.J. Kania, R.L. Knight, and S. Mashburn. 1981. Fates of
cadmium introduced into channels microcosm. Environment International 5:159-175.
Giles, M.A. 1988. Accumulation of cadmium by rainbow trout, Salmo gairdneri, during
extended exposure. Canadian Journal of Fisheries and Aquatic Sciences 45:1045-
1053.
Graney, R.L., Jr., D.S. Cherry, and J. Cairns, Jr. 1984. The influence of substrate, pH,
diet and temperature upon cadmium accumulation in the Asiatic clam (Corbicula
fluminea) in laboratory artificial streams. Water Research 18:833-842.
Grill, E., E-L. Winnacker, and M.H. Zenk. 1985. Phytochelatins: the principal heavy-
metal complexing peptides of higher plants. Science 230:674-676.
Guan, R. and W-X. Wang. 2004. Cd and Zn uptake kinetics in Daphnia magna in
relation to Cd exposure history. Environmental Science and Technology 38:6051-
6058.

102
Gueguen, C., B. Koukal, J. Dominik, and M. Pardos. 2003. Competition between alga
(Pseudokirchneriella subcapitata), humic substances and EDTA for Cd and Zn
control in the algal assay procedure (AAP) medium. Chemosphere 53:927-934.
Ha, M.H. and J. Choi. 2008. Chemical-induced alteration of hemoglobin expression in
the 4th instar larvae of Chironomus tentans Mg. (Diptera: Chironomidae).
Environmental Toxicology and Pharmacology 25:393-398.
Hahne, H.C.H. and W. Kroontje. 1973. Significance of pH and chloride concentration on
behavior of heavy metal pollutants: mercury (II), cadmium (II), zinc (II), and lead
(II). Journal of Environmental Quality 2:444-450.
Hall, W. S., R. L. Paulson, L. W. Hall, and D. S. Burton. 1986. Acute toxicity of
cadmium and sodium pentachlorophenate to daphnids and fish. Bulletin of
Environmental Contamination and Toxicology 37:308-316.
Hamilton, S.J. and K.J. Buhl. 1990. Safety assessment of selected inorganic elements to
fry of Chinook salmon (Oncorhynchus tshawytscha). Ecotoxicology and
Environmental Safety 20:307-324.
Hansen, J. A., P.G. Welsh, J. Lipton, D. Cacela, and A.D. Dailey. 2002a. Relative
sensitivity of bull trout (Salvelinus confluentus) and rainbow trout (Oncorhynchus
mykiss) to acute exposures of cadmium and zinc. Environmental Toxicology and
Chemistry 21:67-75.
Hansen, J.A., P.G. Welsh, J. Lipton, and M.J. Suedkamp. 2002b. The effects of long-
term cadmium exposure on the growth and survival of juvenile bull trout (Salvelinus
confluentus). Aquatic Toxicology 58:165-174.
Hatakeyama, S. and M. Yasuno. 1982. Accumulation and effects of cadmium on guppy
(Poecilia reticulata) fed cadmium-dosed cladocera (Moina macrocopa). Bulletin of
Environmental Contamination and Toxicology 29:159-166.
Herwig, H.J., F. Brands, E. Kruitwagen, and D.I. Zandee. 1989. Bioaccumulation and
histochemical localization of cadmium in Dreissena polymorpha exposed to cadmium
chloride. Aquatic Toxicology 15:269-286.
Heugens, E.H.W., T. Jager, R. Creyghton, M.H.S. Kraak, A.J. Hendriks, N.M. van
Straalen, and W. Admiraal. 2003. Temperature-dependent effects of cadmium on
Daphnia magna: accumulation versus sensitivity. Environmental Science and
Technology 37:2145-2151.
Holdway, D.A., K. Lok, and M. Semaan. 2001. The acute and chronic toxicity of
cadmium and zinc to two Hydra species. Environmental Toxicology 16:557-565.

103
Hollis, L., K. Burnison, and R.C. Playle. 1996. Does the age of metal-dissolved organic
carbon complexes influence binding of metals to fish gills? Aquatic Toxicology
35:253-264.
Hollis, L., J.C. McGeer, D.G. McDonald, and C.M. Wood. 1999. Cadmium
accumulation, gill Cd binding, acclimation, and physiological effects during long-
term sublethal Cd exposure in rainbow trout. Aquatic Toxicology 46:101-119.
Hollis, L., J.C. McGeer, D.G. McDonald, and C.M. Wood. 2000a. Effects of long term
sublethal Cd exposure in rainbow trout during soft water exposure: Implications for
biotic ligand modelling. Aquatic Toxicology 51:93-105.
Hollis, L., J.C. McGeer, D.G. McDonald, and C.M. Wood. 2000b. Protective effects of
calcium against chronic waterborne cadmium exposure to juvenile rainbow trout.
Environmental Toxicology and Chemistry 19:2725-2734.
Hughes, J. S. 1973. Acute toxicity to thirty chemicals to striped bass (Morone saxitilis).
Louisiana Wild Life and Fisheries Commission. Project F-15.6
Huston, C. and E. Juarez-Colunga. 2009. Guidelines for computing summary statistics
for data-sets containing non-detects. Prepared for the Bulkley Valley Research
Center with assistance from the B.C. Ministry of Environment. 178 pp.
Hutchinson, T.C. 1973. Comparative studies of the toxicity of heavy metals to
phytoplankton and their synergistic interactions. Water Quality Research Journal of
Canada 8:68-90.
Ingersoll, C.G. and R.W. Winner. 1982. Effect on Daphnia pulex (de Geer) of daily
pulse exposures to copper and cadmium. Environmental Toxicology and Chemistry
1:321-327.
Ingersoll, C. and N. Kemble. 2001. Revised description of toxicity data on cadmium:
Chronic water-only exposures with the amphipod Hyalella azteca and the midge
Chironomus tentans. Memo from United States Department of the Interior, U.S.
Geological Survey, to Cindy Roberts, U.S. Environmental Protection Agency, Health
and Ecological Criteria Division. 11 January 2001.
Irving, E.C., D.J. Baird, and J.M. Culp. 2003. Ecotoxicological responses of the mayfly
Baetis tricaudatus to dietary and waterborne cadmium: implications for toxicity
testing. Environmental Toxicology and Chemistry 22(5):1058-1064.
Jackson, B.P., P.J. Lasier, W.P. Miller, and P.W. Winger. 2000. Effects of calcium,
magnesium and sodium on alleviating cadmium toxicity to Hyalella azteca. Bulletin
of Environmental Contamination and Toxicology 64:279-286.

104
Juarez-Franco, M. F., S.S.S. Sarma, and S. Nandini. 2007. Effect of cadmium and zinc
on the population growth of Brachionus havanaensis. Journal of Environmental
Science and Health Part A 42.1489-1493.
Källqvist, T. 2009. Effect of water hardness on the toxicity of cadmium to the green alga
Pseudokirchneriella subcapitata in an artificial growth medium and nutrient-spiked
natural lake waters. Journal of Toxicology and Environmental Health, Part A 72:277-
283.
Keller, A.E. and S.G. Zam.1991. The acute toxicity of selected metals to the freshwater
mussel, Anodonta imbecilis. Environmental Toxicology and Chemistry 10:539-546.
Klass, E., D.W. Rowe, and E.J. Massaro. 1974. The effect of cadmium on population
growth of the green alga Scenedesmus quadracauda. Bulletin of Environmental
Contamination and Toxicology 12:442-445.
Klerks, P.L. and J.S. Weis. 1987. Genetic adaptation to heavy metals in aquatic
organisms: a review. Environmental Pollution 45:173-205.
Klinck, J.S., W.W. Green, R.S. Mirza, S.R. Nadella, M.J. Chowdhury, C.M. Wood, and
G.G. Pyle. 2007. Branchial cadmium and copper binding and intestinal cadmium
uptake in wild yellow perch (Perca flavescens) from clean and metal-contaminated
lakes. Aquatic Toxicology 84:198-207.
Kobayashi, I., S. Fujiwara, H. Saegusa, M. Inouhe, H. Matsumoto, and M. Tsuzuki. 2006.
Relief of arsenate toxicity by Cd-stimulated phytochelatin synthesis in the green alga
Chlamydomonas reinhardtii. Marine Biotechnology 8:94-101.
Koukal, B., C. Gueguen, M. Pardos, and J. Dominik. 2003. Influence of humic
substances on the toxic effects of cadmium and zinc to the green alga
Pseudokirchneriella subcapitata. Chemosphere 53:953-961.
Kraemer, L.D., P.G.C. Campbell, L. Hare, and J-C. Auclair. 2006. A field study
examining the relative importance of food and water as sources of cadmium for
juvenile yellow perch (Perca flavescens). Canadian Journal of Fisheries and Aquatic
Sciences 63:549-557.
Kühn, R., M. Pattard, K.D. Pernak, and A. Winter. 1989. Results of the harmful effects of
water pollutants to Dapnia magna in the 21 day reproduction test. Water Research
23:501-510.
Kumada, H., S. Kimura, and M. Yokote. 1980. Accumulation and biological effects of
cadmium in rainbow trout. Bulletin of the Japanese Society of Scientific Fisheries
46:97-103.

105
Kwan, K.H.M. and S. Smith. 1991. Some aspects of the kinetics of cadmium and
thallium uptake by fronds of Lemna minor L. New Phytologist 117:91 - 102.
Kwong, R.W.M. and S. Niyogi. 2009. The interactions of iron with other divalent metals
in the intestinal tract of a freshwater teleost, rainbow trout (Oncorhynchus mykiss).
Comparative Biochemistry and Physiology C 150:442-449.
Lasee, B.A. 1991. Histological and ultrastructural studies of larval and juvenile
Lampsilis (Bivalva) from the Upper Mississippi River. PhD Dissertation. 145 pp.
Lewis, P.A. and W.B. Horning II. 1991. Differences in acute toxicity test results of three
reference toxicants on Daphnia at two temperatures. Environmental Toxicology and
Chemistry 10:1351-1357.
MacKay, D., L. McCarty, and M. MacLeod. 2001. On the validity of classifying
chemicals for persistence, bioaccumulation, toxicity, and potential for long-range
transport. Environmental Toxicology and Chemistry 20(7):1491-1498.
Mackie, G.L. 1989. Tolerances of five benthic invertebrates to hydrogen ions and metals
(Cd, Pb, Al). Archives of Environmental Contamination and Toxicology 18:215-223.
Madoni, P., G. Esteban, and G. Gorbi. 1992. Acute toxicity of cadmium, copper,
mercury and zinc to ciliates from activated sludge plants. Bulletin of Environmental
Contamination and Toxicology 49:900-905.
Maestre, Z., M. Martinez-Madrid, and P. Rodriguez. 2009. Monitoring the sensitivity of
the oligochaete Tubifex tubifex in laboratory cultures using three toxicants.
Ecotoxicology and Environmental Safety 72:2083-2089.
Marshall, J.S. 1978. Population dynamics of Daphnia galeata mendotae as modified by
chronic cadmium stress. Journal of the Fisheries Research Board of Canada 35:461-
469.
McCahon, C.P. and D. Pascoe. 1988. Increased sensitivity to cadmium of the freshwater
amphipod Gammarus pulex (L.) during the reproductive period. Aquatic Toxicology
13:183-194.
McCarty, L.S., J.A.C. Henry, and A.H. Houston. 1978. Toxicity of cadmium to goldfish,
Carassius auratus, in hard and soft water. Journal of Fisheries Research Board of
Canada 35:35-42.
MDDEFP (Ministère du Développement durable, Environnement, Faune et Parcs). 2002.
Critères de qualité de l’eau de surface [Quality criteria for surface water]: cadmium.
Province du Québec. Accessed 11 January 2013 from:
http://www.mddep.gouv.qc.ca/ eau/criteres_eau/details.asp?code=S0088

106
Mebane, C.A. 2010. Cadmium risks to freshwater life: derivation and validation of low-
effect criteria values using laboratory and field studies. Scientific Investigations
Report 2006-5245. Version 1.2. 130 99.
Mebane, C.A., D.P. Hennessy, and F.S. Dillon. 2008. Developing acute-to-chronic
toxicity ratios for lead, cadmium, and zinc using rainbow trout, a mayfly, and a
midge. Water, Air, and Soil Pollution 188:41-66.
Mebane, C.A., F.S. Dillon, and D.O. Hennessy. 2012. Acute toxicity of cadmium, lead,
zinc, and their mixtures to stream-resident fish and invertebrates. Environmental
Toxicology and Chemistry 31:1334-1348.
Meinelt, T., R.C. Playle, M. Pietrock, B.K. Burnison, A. Wienke, and C.E.W. Steinberg.
2001. Interaction of cadmium toxicity in embryos and larvae of zebrafish (Danio
rerio) with calcium and humic substances. Aquatic Toxicology 54:205-215.
Mendez, N. and C. Green-Ruiz. 2006. Cadmium and copper effects on larval
development and mortality of the polychaete Capitella sp. Y from Estero del Yugo,
Mazatlan, Mexico. Water, Air and Soil Pollution 171:291-299.
Meylan, W.M., P.H. Howard, R.S. Boethling, D. Aronson, H. Printup, and S. Gouchie.
1999. Improved method for estimating bioconcentration/bioaccumulation factor from
octanol/water partition coefficient. Environmental Toxicology and Chemistry
18:664-672.
Meyer, J. 1999. A mechanistic explanation for the ln(LC50) vs ln(Hardness) adjustment
equation for metals. Environmental Science and Technology 33:908-912.
Mirenda, R.J. 1986. Toxicity and accumulation of cadmium in the crayfish, Orconectes
virilis (Hagen). Archives of Environmental Contamination and Toxicology 15:401-
407.
Moller, V., V.E. Forbes, and M.H. Depledge. 1996. Population responses to acute and
chronic cadmium in sexual and asexual estuarine gastropods. Ecotoxicology 5:313-
326.
Moore, J.W. and S. Ramamoorthy. 1984. Heavy Metals in Natural Waters. Applied
Monitoring and Impact Assessment, pp. 28-57. Springer-Verlag, New York. (As
cited in Kwan and Smith 1991).
Musko, I.B., W. Meinel, R. Krause, and M. Barlas. 1990. The impact of Cd and different
pH on the amphipod Gammarus fossarum Koch (Crustacea: Amphipoda).
Comparative Biochemistry and Physiology C 96:11-16.

107
Nebeker, A.V., G.S. Schuytema, and S.L. Ott. 1995. Effects of cadmium on growth and
bioaccumulation in the Northwestern salamander Ambystoma gracile. Archives of
Environmental Contamination and Toxicology 29:492-499.
Newman, M.C. 1991. A statistical bias in the derivation of hardness-dependent metals
criteria. Environmental Toxicology and Chemistry. 10:1295-1297.
Nfon, E., I.T. Cousins, and D. Broman. 2008. Biomagnification of organic pollutants in
benthic and pelagic marine food chains from the Baltic Sea. Science of the Total
Environment 397:190-204.
Nfon, E., I.T. Cousins, O. Jarvinen, A.B. Mukherjee, M. Verta, and D. Broman. 2009.
Trophodynamics of mercury and other trace elements in a pelagic food chain from the
Baltic Sea. Science of the Total Environment 407:6267-6274.
Niederlehner, B.R., A.L. Buikema Jr., C.A. Pittinger, and J. Cairns Jr. 1984. Effects of
cadmium on the population growth of benthic invertebrate Aelosoma headleyi
(Oligochaeta). Environmental Toxicology and Chemistry 3:255-262.
Niyogi, A. and C.M. Wood. 2004. Biotic ligand model, a flexible tool for developing
site-specific water quality guidelines for metals. Environmental Science and
Technology. 38(24):6177-6192.
Niyogi, S., P. Couture, G. Pyle, D.G. McDonald, and C.M. Wood. 2004. Acute cadmium
biotic ligand model characteristics of laboratory-reared and wild yellow perch (Perca
flavescens) relative to rainbow trout (Oncorhynchus mykiss). Canadian Journal of
Fisheries and Aquatic Sciences 61:942-953.
NJDHSS (New Jersey Department of Health and Senior Services). 2008. Right to Know
Hazardous Substance Fact Sheet - Cadmium nitrate. Trenton, New Jersey. Accessed
22 January 2013 from http://nj.gov/health/eoh/rtkweb/documents/fs/4088.pdf
NRCC (National Research Council of Canada). 1979. Effects of Cadmium in the
Environment. NRCC No 16743.
Nriagu, J.O. 1980. Production, uses, and properties of cadmium. In: Cadmium in the
environment. Part 1. Ecological cycling, J.O. Nriagu, (Ed.) John Wiley and Sons,
Toronto. (As cited in CCME 1999).
Oikari, A., J. Kukkonen, and V. Virtanen. 1992. Acute toxicity of chemicals to Daphnia
magna in humic waters. The Science of the Total Environment 117/118:367-377.
OMOEE (Ontario Ministry of Environment and Energy). 1994. Water Management,
Policies, Guidelines: Provincial Water Quality Objectives of the Ministry of
Environment and Energy. Reprinted February 1999. ISBN: 0-7778-8473-9 rev. PIBS
(Publication Number): 3303E.

108
Palawski, D., J. B. Hunn, and F. J. Dwyer. 1985. Sensitivity of young striped bass to
organic and inorganic contaminants in fresh and saline waters. Transactions of the
American Fisheries Society 114:748-753.
Pascoe, D., K. A. Williams, and D. W. J. Green. 1989. Chronic toxicity of cadmium to
Chironomus riparius Meigen - Effects upon larval development and adult emergence.
Hydrobiologia 175:109-115.
Paquin, P.R., J.W. Gorsuch, S. Apte, G.E. Batley, K.C. Bowles, P.G.C. Campbell, C.G.
Delos, D.M. Di Toro, R.L. Dwyer, F. Galvez, R.W. Gensemer, G.G. Goss, C.
Hogstrand, C.R. Janssen, J.C. McGeer, R.B. Naddy, R.C. Playle, R.C. Santore, U.
Schneider, W.A. Stubblefield, C.M. Wood, and K.B Wu. 2002. The biotic ligand
model: a historical overview. Comparative Biochemistry and Physiology C 133:3-35.
Pestana, J.L.T., A. Ré, A.J.A. Nogueira, and A.M.V.M. Soares. 2007. Effects of
cadmium and zinc on the feeding behaviour of two freshwater crustaceans:
Atyaephyra desmarestii (Decapoda) and Echinogammarus meridionalis
(Amphipoda). Chemosphere 68:1556-1562.
Penttinen, S., A. Kostamo, and J.V.K. Kukkonen. 1998. Combined effects of dissolved
organic material and water hardness on toxicity of cadmium to Daphnia magna.
Environmental Toxicology and Chemistry 17:2498-2503.
Phipps, G.L. and G.W. Holcombe. 1985. A method for aquatic multiple species toxicant
testing: Acute toxicity of 10 chemicals to 5 vertebrates and 2 invertebrates.
Environmental Pollution (Series A) 38:141-157.
Pickering, Q.H. and C. Henderson. 1966. Acute toxicity of some heavy metals to
different species of warmwater fishes. Air and Water Pollution International Journal
10:453-463.
Pickering, Q.H. and M.H. Gast. 1972. Acute and chronic toxicity of cadmium to fathead
minnow (Pimephales promelas). Journal of the Fisheries Research Board of Canada
29(8):1099-1106.
Playle, R.C., D.G. Dixon, K. Burnison, 1993a. Copper and cadmium binding to fish gills:
modifications by dissolved organic carbon and synthetic ligands. Canadian Journal of
Fisheries and Aquatic Sciences. 50: 2667-2677.
Playle, R.C., D.G. Dixon, K. Burnison, 1993b. Copper and cadmium binding to fish gills:
estimates of metal-gill stabilityconstants and modelling of metal accumulation.
Canadian Journal of Fisheries and Aquatic Sciences. 50: 2678-2687.

109
Playle, R.C. 1998. Modelling metal interactions at fish gills. Science of the Total
Environment. 219: 147-163.
Postma, J.F., P. van Nugteren, and M.B. Buckert-de Jong. 1996. Increased cadmium
excretion in metal-adapted populations of the midge Chironomus riparius (Diptera).
Environmental Toxicology and Chemistry 15:332-339.
Redeker, E. S. and R. Blust. 2004. Accumulation and toxicity of cadmium in the aquatic
oligochaete Tubifex tubifex: A kinetic modeling approach. Environmental Science
and Technology 38:537-543.
Reid, S.D. and D.G. McDonald. 1988. Effects of cadmium, copper, and low pH on ion
fluxes in the rainbow trout, Salmo gairdneri. Canadian Journal of Fisheries and
Aquatic Sciences 45:244-253.
Reynoldson, T.B., P. Rodriguez, and M. Martinez-Madrid. 1986. A comparison of
reproduction, growth and acute toxicity in two populations of Tubifex tubifex (Müller,
1774) from the North American Great Lakes and Northern Spain. Hydrobiologia
334:199-206.
Richards, J.G., P.J. Curtis, B.K. Burnison, and R.C. Playle. 2001. Effects of natural
organic matter source on reducing metal toxicity to rainbow trout (Oncorhynchus
mykiss) and on metal binding to their gills. Environmental Toxicology and Chemistry
20:1159-1166.
Rombough, P.J. and E.T. Garside. 1982. Cadmium toxicity and accumulation in eggs
and alevins of Atlantic salmon Salmo salar. Canadian Journal of Zoology 60:2006-
2014.
Roux, D.J., P.L. Kempster, E. Truter, and L. van der Merwe. 1993. Effect of cadmium
and copper on survival and reproduction of Daphnia pulex. Water South Africa
19:269-274.
Saskatchewan Environment. 2006. Surface Water Quality Objectives - Interim Edition.
EPB 356.
Sauter, S., K. S. Buxton, K. J. Macek, and S. R. Petrocelli. 1976. Effects of exposure to
heavy metals on selected fresh water fish: Toxicity of copper, cadmium, chromium
and lead to eggs and fry of seven fish species. Environmental Research Laboratory,
Office of Research and Development, U.S. Environmental Protection Agency. EPA-
600/3-76-105.
Scherer, E., R.E. McNicol, and R.E. Evans. 1997. Impairment of lake trout foraging by
chronic exposure to cadmium: a black-box experiment. Aquatic Toxicology 37:1-7.

110
Schubauer-Berigan, M.K., J.R. Dierkes, P.D. Monson, and G.T. Ankley. 1993. pH-
dependent toxicity of Cd, Cu, Ni, Pb and Zn to Ceriodaphnia dubia, Pimphales
promelas, Hyalella azteca and Lumbriculus variegatus. Environmental Toxicology
and Chemistry 12(7):1261-1266.
Schuytema, G. S., P. O. Nelson, K. W. Malueg, A. V. Nebeker, D. F. Krawczyk, A. K.
Ratcliff, and J.H. Gakstatter. 1984. Toxicity of cadmium in water and sediment
slurries to Daphnia magna. Environmental Toxicology and Chemistry 3:293-308.
Scott, G.R., K.A. Sloman, C. Rouleau, and C.M. Wood. 2003. Cadmium disrupts
behavioural and physiological responses to alarm substance in juvenile rainbow trout
(Oncorhynchus mykiss). Journal of Experimental Biology 206:1779-1790.
Shaw, J.R., T.D. Dempsey, C.Y. Chen, J.W. Hamilton, and C.L Folt. 2006. Comparative
toxicity of cadmium, zinc, and mixtures of cadmium and zinc to daphnids.
Environmental Toxicology and Chemistry 25:182-189.
Sherman, R.E., S.P. Gloss, and L.W. Lion. 1987. A comparison of toxicity tests
conducted in the laboratory and in experimental ponds using cadmium and the
fathead minnow (Pimephales promelas). Water Research 21(3):317-323.
Sikorska, J. and J. Wolnicki. 2010. Cadmium and copper toxicity to tench Tinca tinca
(L.) larvae after a short-term exposure. Reviews in Fish Biology and Fisheries
20:417-423.
Skowronski, T. 1986a. Adsorption of cadmium on green microalga Stichococcus
bacillaris. Chemosphere 15:69-76.
Skowronski, T. 1986b. Influence of some physico-chemical factors on cadmium uptake
by the green alga Stichococcus bacillaris. Applied Microbiology and Biotechnology
24:423-425.
Skowronski, T., S. Szubinska, B. Pawlik, and M. Jakubowski. 1991. The influence of pH
on cadmium toxicity to the green alga Stichococcus bacillaris and on the cadmium
forms present in the culture medium. Environmental Pollution 74:89-100.
Sloman, K.A., G.R. Scott, Z. Diao, C. Rouleau, C.M. Wood, and D.G. McDonald. 2003.
Cadmium affects the social behaviour of rainbow trout, Oncorhynchus mykiss.
Aquatic Toxicology 65:171-185.
Soegianto, A., M. Charmantier-Daures, J.-P. Trilles, G. Charmantier. 1999. Impact of
cadmium on the structure of gills and epipodites of the shrimp Penaeus japonicus
(Crustacea: Decapoda). Aquatic Living Resource 12:57-70.
Spehar, R.L. and A.R. Carlson. 1984. Derivation of site-specific water quality criteria for
cadmium and the St. Louis River basin, Duluth, Minnesota. Environmental
Toxicology and Chemistry 3:651-665.

111
Spehar, R.L. and J.T. Fiandt. 1986. Acute and chronic effects of water quality criteria-
based metal mixtures on three aquatic species. Environmental Toxicology and
Chemistry 5:917-931.
Spehar, R.L, R.L. Anderson, and J.T. Fiandt. 1978. Toxicity and bioaccumulation of
cadmium and lead in aquatic invertebrates. Environmental Pollution 15:195-208.
Stackhouse, R.A. and W.H. Benson. 1988. The influence of humic acid on the toxicity
and bioavailability of selected trace metals. Aquatic Toxicology 13:99-108.
Stackhouse, R.A. and W.H. Benson. 1989. Interaction of humic acid with selected trace
metals: influence on bioaccumulation in daphnids. Environmental Toxicology and
Chemistry 8 639-644.
Stanley, J.K., B.W. Brooks, and T.W. La Point. 2005. A comparison of chronic cadmium
effects on Hyalella azteca in effluent-dominated stream mesocosms to similar
laboratory exposures in effluent and reconstituted hard water. Environmental
Toxicology and Chemistry 24:902-908.
Stubblefield, W.A., B.L. Steadman, T.W. La Point, and H.L. Bergman. 1999.
Acclimation-induced changes in the toxicity of zinc and cadmium to rainbow trout.
Environmental Toxicology and Chemistry 18:2875-2881.
Stuhlbacher, A. and L. Maltby. 1992. Cadmium resistance in Gammarus pulex (L.).
Archives of Environmental Contamination and Toxicology 22:319-324.
Suedel, B.C., J.H. Rodgers Jr., and E. Deaver. 1997. Experimental factors that may
affect toxicity of cadmium to freshwater organisms. Archives of Environmental
Contamination and Toxicology 33:188-193.
Sullivan, J.F., B.R. Murphy, G.J. Atchison, and A.W. McIntosh. 1978. Time dependent
cadmium uptake by fathead minnows (Pimephales promelas) during field and
laboratory exposure. Hydrobiologia 57:65-68.
Thermo Elemental. 2001. AAS, GFAAS, ICP or ICP-MS? Which technique should I
use? An elementary overview of elemental analysis. S002B Rev. 02/01.
Thompson, P-A. and P. Couture. 1990. Aspects of carbon metabolism in the recovery of
Selenastrum capricornutum populations exposed to cadmium. Aquatic Toxicology
17:1-14.
Thorp, J.H., J.P. Giesy, and S.A. Wineriter. 1979. Effects of chronic cadmium exposure
on crayfish survival, growth, and tolerance to elevated temperatures. Archives of
Environmental Contamination and Toxicology 8:449-456.

112
Tollett, V.D., E.L. Benvenutti, L.A. Deer, and T.M. Rice. 2009. Differential toxicity to
Cd, Pb, and Cu in dragonfly larvae (Insecta: Odonata). Archives of Environmental
Contamination and Toxicology 56:77-84.
USEPA (United States Environmental Protection Agency). 1979. Water-related fate of
129 priority pollutants. Washington, DC: U.S. Environmental Protection Agency,
Office of Water Planning and Standards. EPA 440479029a. (As cited in ATSDR
2012).
USEPA (United States Environmental Protection Agency). 1985a. National Primary
Drinking Water Regulations; Volatile Synthetic Organic Chemicals; Final Rule and
Proposed Rule. Federal Register. Vol. 50, No 219, page 46902. November 13, 1985.
USEPA (United States Environmental Protection Agency). 1985b. Ambient water
quality criteria for cadmium. EPA-440/5-84-032. National Technical Information
Service, Springfield, Virginia.
USEPA (United States Environmental Protection Agency). 2001. 2001 update of ambient
water quality criteria for cadmium. EPA-822-R-01-001.
USEPA (United States Environmental Protection Agency). 2005. Procedures for the
derivation of equilibrium partitioning sediment benchmarks (ESBs) for the protection
of benthic organisms: metal mixtures (cadmium, copper, lead, nickel, silver, zinc).
EPA-600-R-02-011. Office of Research and Development. Washington, District of
Columbia. 121 pp.
USEPA (United States Environmental Protection Agency). 2013. National
Recommended Water Quality Criteria. Accessed 11 January 2013 from
http://water.epa.gov/ scitech/swguidance/standards/criteria/current/index.cfm#D
van Hattum, B., P. de Voogt, L. van den Bosch, N.M. van Straalen, and E.N.G. Joosse.
1989. Bioaccumulation of cadmium by the freshwater isopod Asellus aquaticus (L.)
from aqueous and dietary sources. Environmental Pollution 62:129-151.
Vardy, D.W., A.R. Tompsett, J. L. Sigurdson, J.A. Doering, X. Zhang, J.P. Giesy, and M.
Hecker. 2011. Effects of sub-chronic exposure of early life stages of white sturgeon
(Acipenser transmontanus) to copper, cadmium, and zinc. Environmental Toxicology
and Chemistry 30:2497-2505.
Vedamanikam, V.J. and N.A.M. Shazilli. 2008a. Comparative toxicity of nine metals to
two Malaysian aquatic Dipterian larvae with reference to temperature variation.
Bulletin of Environmental Contamination and Toxicology 80:516-520.
Vedamanikam, V.J. and N.A.M. Shazilli. 2008b. The effect of multi-generational
exposure to metals and resultant change in median lethal toxicity tests values over
subsequent generations. Bulletin of Environmental Contamination and Toxicology
80:63-67.

113
Vedamanikam, V.J. and N.A.M. Shazilli. 2009. The chironomid larval tube, a
mechanism to protect the organism from environmental disturbances? Toxicology
and Environmental Chemistry 91(1):171-176.
Verbost, P.M., G. Flik, R.A.C. Lock, and S.E.W. Bonga. 1987. Cadmium inhibition of
Ca2+
uptake in rainbow trout gills. American Journal of Physiology 253:R216-R221.
Verbost, P.M., J. van Rooij, G. Flik, R.A.C. Lock, and S.E.W. Bonga. 1989. The
movement of cadmium through freshwater trout branchial epithelium and its
interference with calcium transport. Journal of Experimental Biology 145:185-197.
Wake, D.B. and V.T. Vredenburg. 2008. Are we in the midst of the sixth mass
extinction? A view from the world of amphibians. Proceedings of the National
Academy of Sciences 105(Supplement 1):11466-11473.
Wang, N., C.G. Ingersoll, C.D. Ivey, D.K. Hardesty, and T.W. May. 2010. Sensitivity of
early life stages of freshwater mussels (Unionidae) to acute and chronic toxicity of
lead, cadmium and zinc in water. Environmental Toxicology and Chemistry
29(9):2053-2063.
Ward, T.J. and W.E. Robinson. 2005. Evolution of cadmium resistance in Daphnia
magna. Environmental Toxicology and Chemistry 24:2341-2349.
Watts, M.M. and D. Pascoe. 2000. A comparative study of Chironomus riparius Meigen
and Chironomus tentans Fabricius (Diptera: Chironomidae) in aquatic toxicity tests.
Archives of Environmental Contamination and Toxicology 39:299-306.
Wester, R.C., H.I. Maibach, L. Sedik, J. Melendres, S. DiZio, and M. Wade. 1992. In
vitro percutaneous absorption of cadmium from water and soil into human skin.
Fundamental and Applied Toxicology 19:1-5.
WHO (World Health Organization). 1992. Environmental Health Criteria 135: Cadmium
- Environmental Aspects. Geneva, Switzerland. Accessed 22 January 2013 from
http://www.inchem.org/documents/ehc/ehc/ehc135.htm#PartNumber:2
Wigginton, A.J. and W.J. Birge. 2007. Toxicity of cadmium to six species in two genera
of crayfish and the effect of cadmium on molting success. Environmental Toxicology
and Chemistry 26:548-554.
Wildgust, M.A. and M.B. Jones. 1998. Salinity change and the toxicity of the free
cadmium ion [Cd 2+
] to Neomysis integer (Crustacea: Mysidacea). Aquatic
Toxicology 41:187-192.

114
Williams, D.R. and J.P. Giesy Jr. 1978. Relative importance of food and water sources to
cadmium uptake by Gambusia affinis (Poeciliidae). Environmental Research 16:326-
332.
Windward Environmental. 2002. Development of site-specific water quality criteria for
the South Fork Coeur d'Alene River, Idaho: Derivation of acute and chronic criteria
for lead and zinc. Prepared for the Idaho Department of Environmental Quality.
Winner, R.W. 1984. The toxicity and bioaccumulation of cadmium and copper as
affected by humic acid. Aquatic Toxicology 5:267-274.
Winner, R.W. 1986. Interactive effects of water hardness and humic acid on the chronic
toxicity of cadmium to Daphnia pulex. Aquatic Toxicology 8:281-293.
Winner, R.W. 1988. Evaluation of the relative sensitivities of 7-d Daphnia magna and
Ceriodaphnia dubia toxicity tests for cadmium and sodium pentachlorophenate.
Environmental Toxicology and Chemistry 7:153-159.
Winner, R.W. and J.D. Gauss. 1986. Relationship between chronic toxicity and
bioaccumulation of copper, cadmium and zinc as affected by water hardness and
humic acid. Aquatic Toxicology 8:149-161.
Woodward, D.F., A.M. Farag, H.L. Bergman, A.J. DeLonay, E.E. Little, C.E. Smith, and
F.T. Barrows. 1995. Metals-contaminated benthic invertebrates in the Clark Fork
River, Montana: effects on age-0 brown trout and rainbow trout. Canadian Journal of
Fisheries and Aquatic Sciences 52:1994-2004.
Yang, H.-N. and H.-C. Chen. 1996. Uptake and elimination of cadmium by Japanese eel,
Anguilla japonica, at various temperatures. Bulletin of Environmental Contamination
and Toxicology 56:670-676.
Yorulmazlar, E. and A. Gül. 2003. Investigation of acute toxicity of cadmium sulfate
(CdSO4.H2O) and behavioral changes of grass carp (Ctenopharyngodon idellus Val.,
1844). Chemosphere 53:1005-1010.
Zar, J.H. 1999. Biostatistical Analysis, 4th
Edition. Prentice Hall, Upper Saddle River,
New Jersey.


![01 Carmichael[1]](https://img.dokumen.tips/doc/110x75/577ce53c1a28abf1039025a4/01-carmichael1.jpg)