Embed Size (px)
Citation preview
Alternative Carbon Sources for Biological
Denitrification at Upper Blackstone Water Pollution
Abatement District
A Major Qualifying Project Report
Submitted to the Faculty of
WORCESTER POLYTECHNIC INSTITUTE
In partial fulfillment of the requirements for the Degree of Bachelor of Science
Submitted on April 25, 2016 by
Deanna Clark
Mikayla Filippone
Kelsey Ouellette
Hannah Reinertsen
Advisors: Professor Bergendahl, Professor Kmiotek and Professor Bates
This report is the product of an education program, and is intended to serve as partial
documentation for the evaluation of academic achievement. The report should not be construed as a working document by the reader.
i
Professional Licensure Statement Earning a Professional Engineering license (PE) is important to obtain for an engineering
professional and is an important step in an engineer's career. Engineers are responsible for work
they undertake. A PE license ensures the engineer has exceptional skills according to National
Council of Examinations for Engineering and Surveying (NCEES). Before gaining a PE, one
must pass the Fundamentals of Engineering exam (FE) to receive an Engineer-In-Training (EIT)
license. The FE exam is a 6-hour test given in two sessions.
Each state varies in the amount of time needed working as an EIT before being eligible to
take the PE exam. Each PE is required to demonstrate 15 professional development hours per
year in some states. Professional development hours can be in the form of taking courses,
attending seminars, publishing articles, or receiving a patent. A license can be revoked by a state
if one does not abide by the code of ethics. Having a PE license revoked becomes a public
record. The purpose of a PE license is to protect the public and hold engineers accountable for
their work.
Every person accepts a code of ethics when entering a profession or an organization.
Engineers abide by three types of codes of ethics: employer code of ethics, code of ethics for
technical work with social conscience, and government code of ethics are determined through
laws, codes, and regulations set by US government that must be followed in designs. Engineers
need to ensure they do not have any conflicts of interest when making decisions according to the
code of ethics. Having a PE license requires engineers to take personal responsibility for their
work. When approving designs, the PE is ensuring the design is ethical in terms of the technical
design and the effects on the people. State and federal laws do take precedence over professional
ethics when it comes to making final decisions on designs. 1
To maintain trust within the community, integrity, honor, and dignity, all members of the
engineering community must abide by the principles set in the code of ethics. A PE license gives
each individual engineer more responsibility and proves competence in their field of engineering.
The alternative carbon source for denitrification design would require a PE to sign off on
the final design. The current design developed for Upper Blackstone Water Pollution Abatement
District is preliminary and would need to be approved by a PE. Ethics were taken into
consideration for the health and safety of the design.
1 Turton, Richard. Analysis, Synthesis, and Design of Chemical Processes. Upper Saddle River, N.J: Prentice Hall, 2003. Print.
ii
Design Capstone
All kinetic reactor tests were run in a 2-liter Erlenmeyer flasks with nitrogen gas released
through a sparger. The nitrogen gas was sparged at a flowrate to ensure no oxygen would enter
the flask and the wastewater was well mixed. A piece of Parafilm covered the top of
the Erlenmeyer flask. The Parafilm had holes in it to allow nitrogen gas to be released from the
system and not build up pressure. For more information on the kinetics procedure, refer to
Section 3.1.
Preliminary testing consisted of a 2-hour reactor test using the set up explained prior.
Temperature, pH, COD, and nitrate were measured and recorded before the carbon source was
added to the reactor and again after the two hours. The preliminary test was used to determine the
carbon sources that produced over 70% denitrification within two hours. The process developed
was modified from the Water Environment Research Foundation (WERF).
Final testing consisted of a 3-hour reactor tests using the previously explained set up.
Temperature, pH, COD, and nitrate were measured and recorded before the carbon source was
added to the reactor and again after each hour. Samples for COD measurements were taken and
nitrate measurements recorded every ten minutes for the first hour. After the first hour, samples
were taken every half an hour. The final samples were analyzed to find the reaction rate for
denitrification of the wastewater. The first slope of the data collected represents the denitrification
reactions involving readily biodegradable COD. The second slope represents the slowly
biodegradable COD reactions. The reactions are zero order reactions; this explains the need for a
linear evaluation of the data. Final testing was modified from the procedures developed by
WERF.
Based on the results from the secondary testing, a scaled-up design was developed for
Upper Blackstone Water Pollution Abatement District (UBWPAD). The design can be seen in
Figure 1. The biodiesel production waste was selected as the carbon source for the design.

iii
Figure 1: P&ID for Carbon Source Addition for Denitrification Design
The pipe increases ten feet in elevation before passing over the tanks and then decreasing
twelve feet in elevation down to the middle of the existing biological treatment tank. The pipe
outlet does not enter the wastewater in the existing tanks to avoid any blockage in the pipes. All
pipes are ½ inch nominal pipe size. All valves used in the design are ball valves as they are
used for on/off purposes. The piping is Schedule 40 CPVC. The pump is designed to produce a
flowrate of 4.5 gal/h with a velocity of 3 m/min in the piping. The LMI Chemical Metering Pump
C73 was selected based on durability, ability to pump viscous fluids, and the ability to produce
the flowrate needed.
The final scaled-up design proposed minor health and safety concerns that can be easily
mitigated. Over time leaking in pipes and corrosion may occur. Biodiesel production waste
contains potassium hydroxide (KOH) and glycerol; these chemicals may cause some corrosion in
some components over time. The pipe at the end of the system is open to the atmosphere and
some off gases may enter the air when leaving the pipes. Overall, the design does not call for any
special hazard precautions to be set in place.
iv
Abstract The purpose of this project was to determine alternative carbon sources for biological
denitrification at Upper Blackstone Water Pollution Abatement District (UBWPAD). Carbon
sources tested consisted of various wastes: Micro-C, beverage waste, unrefined biodiesel
production waste, sugar production waste, Dow Chemical waste, Elite Chemical waste, and
deicer fluid. The carbon sources were evaluated for their denitrification rate in a kinetic reactor
tests; those reaching 70% or more in denitrification extent were subjected for final testing. A
design for the addition of the alternative carbon sources to the denitrification process was
developed for UBWPAD.
v
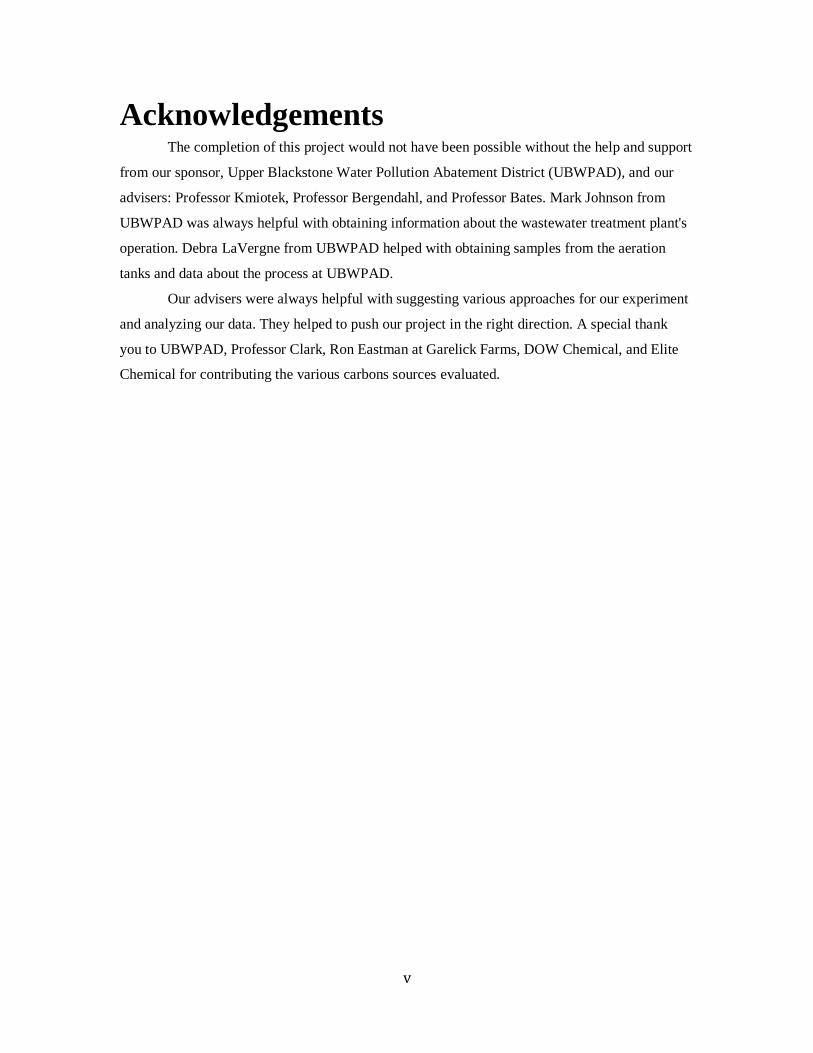
Acknowledgements
The completion of this project would not have been possible without the help and support
from our sponsor, Upper Blackstone Water Pollution Abatement District (UBWPAD), and our
advisers: Professor Kmiotek, Professor Bergendahl, and Professor Bates. Mark Johnson from
UBWPAD was always helpful with obtaining information about the wastewater treatment plant's
operation. Debra LaVergne from UBWPAD helped with obtaining samples from the aeration
tanks and data about the process at UBWPAD.
Our advisers were always helpful with suggesting various approaches for our experiment
and analyzing our data. They helped to push our project in the right direction. A special thank
you to UBWPAD, Professor Clark, Ron Eastman at Garelick Farms, DOW Chemical, and Elite
Chemical for contributing the various carbons sources evaluated.
vi
Executive Summary
The research discussed in this report is to assist Upper Blackstone Water Pollution
Abatement District (UBWPAD) in the selection of a new carbon source for denitrification of
wastewater. Ammonification and nitrification are both common processes in the environment.
Bacteria converts ammonium to nitrates, causing nitrates to form in wastewater. Denitrification
occurs under anoxic conditions to remove nitrates from water by forming nitrogen gas.
Wastewater needs to be treated before releasing it back into a water source such as a river, lake,
or ocean to prevent any harmful substances from reentering the water source. Wastewater
undergoes primary and secondary treatment before being released into a water source. Biological
denitrification in secondary treatment was the main focus of the study presented in this report.
To ensure the wastewater meets regulations when returned to the environment, the
wastewater needs to undergo effective treatment including denitrification. Various organics have
been known to efficiently function as carbon sources for biologically reducing total nitrogen
concentration in wastewater. UBWPAD seasonally uses Micro-C 2000A as the carbon source for
denitrification. Micro-C is a glycerin based chemical. Other carbon sources investigated included
various industrial wastes. Repurposing organic industrial waste for use as a carbon source is both
a sustainable and cost effective opportunity.
Micro-C was tested as a baseline in these experiments to compare with other potential
sources. Alternative carbon sources initially considered for experimentation included wastes from
the production of beverages, breweries, dairy products, wine and alcoholic beverages, biodiesel
production, sugar, municipal solid waste landfill leachate, and chemical manufacturing. Not all of
these potential organics were able to be obtained or reproduced and could not be studied in
further detail. The carbon sources not obtained or reproduced were as follows: brewery waste,
winery and alcoholic beverage waste, and waste from a municipal solid waste landfill.
Each carbon source was tested for its chemical oxygen demand (COD), nitrate levels,
temperature, and pH and further evaluated in a kinetic reactor test. New samples of wastewater
were filtered and then dried at 105 degrees Celsius to determine the mass of mixed liquor
suspended solids (MLSS). These values were used to calculate the denitrification rates of each
carbon source. The COD test used standard COD vials reading up to 900 mg/L. Samples were
diluted to obtain a COD reading of less than 900 mg/L. Nitrate concentrations were measured
with a nitrate probe. The temperature was measured with a thermometer and pH was measured
with a pH probe and meter. The kinetic reactor test approach consisted of a preliminary test and a
final test. The preliminary test was a 2-hour test where samples were taken at the beginning and

vii
end of the two hours. The reactor was anoxic and well mixed using nitrogen gas. The final test
had the same reactor set up and was a 3-hour long test with samples taken throughout the
duration.
Each carbon source was evaluated in the preliminary test except for the dairy waste.
Dairy waste was found to be not easily obtainable, variable in COD and content, and would lead
to more odor control needed at UBWPAD. Corn syrup was suggested by UBWPAD after our
initial tests were completed. The percent of nitrogen removal for corn syrup, a beverage waste,
was determined after the first two hours of the final test. Nitrogen removal for Micro-C, beverage
waste, unrefined biodiesel production waste, sugar production waste, Dow Chemical waste, Elite
Chemical windshield wiper fluid waste, and deicer fluid were 80.6%, 79.8, 83.1%, 86.2%, 79.8%,
52%, and 43.4%, respectively.
Carbon sources were selected to be tested in the final test if the source managed to reduce
nitrogen by 70% in the denitrification kinetics test. The final test consisted of taking the same
readings from samples as in the first test. Samples were taken in the beginning, every ten minutes
for the first hour, and every half an hour for the last two hours. For all final tests, the initial COD
of the carbon source did not fluctuate more than 650 mg/L. The changes in the source COD
should not pose any issues for UBWPAD, though UBWPAD will need to determine how this
will affect the treatment processes post denitrification.
Temperature in all of the final test reactors did not surpass room temperature. No
significant increases in temperature occurred throughout the experiment. The pH for the Micro-C
test was 6.90-7.34 from beginning to end of the final test. The ideal range for wastewater pH is
between 7-7.5. The next three tests began at a pH greater than the ideal pH for a system: corn
syrup ranged from 7.53-7.98; biodiesel waste ranged from 7.63-8.4; the sugar solution's pH
ranged from 7.54-8.08. Glycerin did surpass the ideal pH range as well with a pH change from
6.66-7.66. UBWPAD would need to decide whether or not these pH changes are acceptable on a
day to day basis of running the plant.
UBWPAD was recently operating with 30 minute detention times in the anaerobic tanks.
All final batch reactor experiments produced nitrate concentrations below 2 ppm within a half
hour. This illustrated all carbon sources as effective for denitrification. The carbon sources with
the greatest denitrification rates, above –0.050 kgN/kgVSS/d, were considered for design and cost
analysis.
Micro-C had a reaction rate of –0.053 kgN/kgVSS/d for the first 50 minutes of the reactor
test. Beverage production waste, corn syrup, had a denitrification rate of -0.057 kgN/kgVSS/d
over 40 minutes. Corn syrup denitrifies faster than Micro-C; the tank size is not of concern for

viii
this source. Biodiesel production waste had the fastest reaction rate of -0.103 kgN/kgVSS/d. The
denitrification process occurred in 20 minutes. Sugar solution had the slowest reaction rate of
-0.039 kgN/kgVSS/d occur over 80 minutes. The reaction time for sugar was the slowest and
further tests would have to be done to ensure higher levels of nitrate can be depleted within the
detention time. DOW Chemical, glycerin, had a reaction rate of -0.052 kgN/kgVSS/d, similar to
Micro-C. The reaction completed within the first 40 minutes of the kinetic reactor experiment.
Potential injection system designs utilizing these alternative carbon source for
denitrification were considered assuming an average 30MGD wastewater flow and year round
influent concentration of 8 ppm nitrate. The carbon sources with denitrification rates over –0.05
kgN/kgVSS/d were corn syrup, DOW chemical, sugar solution, and biodiesel production waste.
This is a longer time period and higher nitrate concentration than UBWPAD generally
experiences. The general design consists of a storage vessel, pumps, and piping to each anaerobic
tank. Biodiesel production waste was chosen as the final and most effective carbon source to
recommend. The design of corn syrup, sugar solution, and glycerin called for significantly higher
volumes for storage, larger pumps to operate, and more frequent and larger shipments. Biodiesel
production waste required about 3,000 gal/month which can be stored in vessels UBWPAD
already has on-site. The design incorporating of biodiesel production waste was more feasible
than the other potential carbon sources.
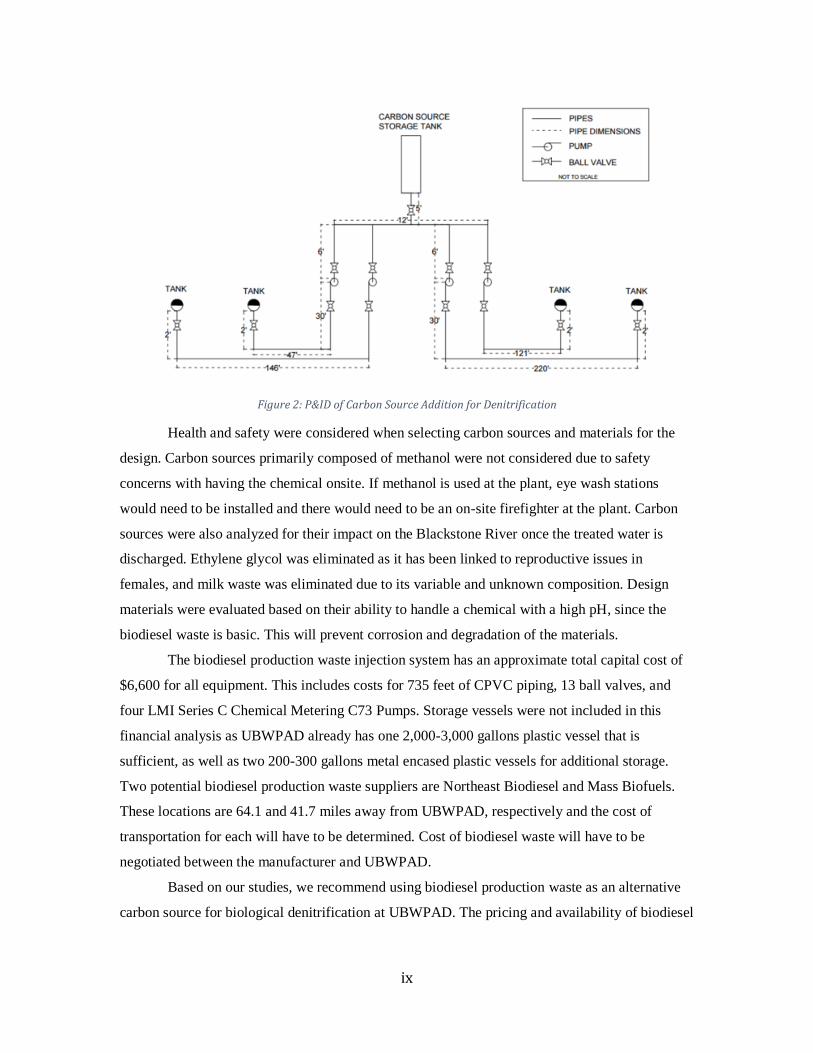
The LMI Series C Chemical Metering Pump C73 was selected for the design because it is
durable and can handle high viscosity fluids. The C73 model can handle a flow rates up to
8 GPH; the required biodiesel waste flow rate is within this range, averaging around 4 GPH. The
average input power at max speed is 44 watts.
Chlorinated polyvinyl chloride (CPVC) was selected for the piping material because
CPVC is not affected by changes in outside temperature or corrosive solutions. The piping will
exit the chemical holding tank, flow through a series of valves and enter the pump. There will be
four pumps, one for each anaerobic tank with one pipe coming from each. The flow will exit each
pump and the pipes will run at an elevation increase of ten feet to clear the walk area and then
will reduce elevation back down twelve feet. Each pipe stops in the middle of the beginning of an
anaerobic tank and hangs two feet into the tank, above the wastewater level to release the
biodiesel production waste. The pipe design has a negligible pressure drop of 0.17 ft. due to the
material of the pipe and low flow rate. All pipes in the system are 0.5" in nominal pipe size. The
overall design can be seen in Figure 2.
ix
Figure 2: P&ID of Carbon Source Addition for Denitrification
Health and safety were considered when selecting carbon sources and materials for the
design. Carbon sources primarily composed of methanol were not considered due to safety
concerns with having the chemical onsite. If methanol is used at the plant, eye wash stations
would need to be installed and there would need to be an on-site firefighter at the plant. Carbon
sources were also analyzed for their impact on the Blackstone River once the treated water is
discharged. Ethylene glycol was eliminated as it has been linked to reproductive issues in
females, and milk waste was eliminated due to its variable and unknown composition. Design
materials were evaluated based on their ability to handle a chemical with a high pH, since the
biodiesel waste is basic. This will prevent corrosion and degradation of the materials.
The biodiesel production waste injection system has an approximate total capital cost of
$6,600 for all equipment. This includes costs for 735 feet of CPVC piping, 13 ball valves, and
four LMI Series C Chemical Metering C73 Pumps. Storage vessels were not included in this
financial analysis as UBWPAD already has one 2,000-3,000 gallons plastic vessel that is
sufficient, as well as two 200-300 gallons metal encased plastic vessels for additional storage.
Two potential biodiesel production waste suppliers are Northeast Biodiesel and Mass Biofuels.
These locations are 64.1 and 41.7 miles away from UBWPAD, respectively and the cost of
transportation for each will have to be determined. Cost of biodiesel waste will have to be
negotiated between the manufacturer and UBWPAD.
Based on our studies, we recommend using biodiesel production waste as an alternative
carbon source for biological denitrification at UBWPAD. The pricing and availability of biodiesel

x
waste will need to be negotiated between the company and UBWPAD. Companies in the area
producing biodiesel waste are Northeast Biodiesel and Mass Biofuels.
xi
Table of Contents
Professional Licensure Statement ..................................................................................................... i
Design Capstone ............................................................................................................................... ii
Abstract ........................................................................................................................................... iv
Acknowledgements .......................................................................................................................... v
Executive Summary ........................................................................................................................ vi
Table of Contents ............................................................................................................................ xi
Table of Figures ............................................................................................................................ xiv
Table of Tables ............................................................................................................................... xv
Table of Equations ......................................................................................................................... xv
1. Background .................................................................................................................................. 1
1.1. Wastewater Treatment........................................................................................................... 1
1.2. Nitrogen in Wastewater ......................................................................................................... 2
1.3. Denitrification of Wastewater ............................................................................................... 3
1.4. Wastewater Treatment at Blackstone .................................................................................... 4
1.4.1. Denitrification Process at Blackstone ............................................................................ 5
1.5. Alternative Carbon Sources .................................................................................................. 6
1.5.1. Micro-C .......................................................................................................................... 6
1.5.2. Beverage Waste .............................................................................................................. 7
1.5.3. Brewery Waste ............................................................................................................... 7
1.5.4. Dairy Waste .................................................................................................................... 8
1.5.5. Winery and Alcoholic Beverages Waste ........................................................................ 9
1.5.6. Biodiesel Production Waste ........................................................................................... 9
1.5.7. Sugar Production Waste ............................................................................................... 10
1.5.8. Municipal Solid Waste Landfill Leachate .................................................................... 10
1.5.9. Chemical Manufacturing Waste ................................................................................... 10
xii
1.6. Experimental Background ................................................................................................... 13
1.6.1. COD Testing ................................................................................................................ 13
1.6.2. Nitrate Testing .............................................................................................................. 13
1.6.3. Reactor Kinetics ........................................................................................................... 14
2. Methods ...................................................................................................................................... 16
2.1. COD Testing ....................................................................................................................... 16
2.1.1. COD Calibration Curve Procedure .............................................................................. 17
2.1.2. COD Procedure ............................................................................................................ 17
2.2. Nitrate Testing ..................................................................................................................... 18
2.3. Reactor Kinetics Experiments ............................................................................................. 19
3.0. Results and Discussion ............................................................................................................ 24
3.1. Results of Procedure Development ..................................................................................... 24
3.2. MLVSS (MLSS) Tests ........................................................................................................ 25
3.3. Results of Preliminary Tests ............................................................................................... 25
3.2.1. Micro-C ........................................................................................................................ 27
3.2.2. Beverage Waste ............................................................................................................ 28
3.2.3. Brewery Waste ............................................................................................................. 29
3.2.4. Dairy Waste .................................................................................................................. 29
3.2.5. Winery and Alcoholic Beverages Waste ...................................................................... 29
3.2.6. Biodiesel Production Waste ......................................................................................... 30
3.2.7 Sugar Production Waste ................................................................................................ 30
3.2.8. Municipal Solid Waste Landfill ................................................................................... 31
3.2.9. Chemical Manufacturing Wastes ................................................................................. 31
3.2.10. Airport Deicer Waste ................................................................................................. 33
3.3. Results of Final Tests .......................................................................................................... 34
3.3.1. Micro-C ........................................................................................................................ 35
3.3.2. Beverage Production Waste: Corn Syrup .................................................................... 36

xiii
3.3.3. Biodiesel Production Waste ......................................................................................... 38
3.3.4. Sugar Production Waste ............................................................................................... 39
3.3.5. Chemical Manufacturing Waste: DOW Chemical (Glycerin) ..................................... 41
3.4. Design ................................................................................................................................. 42
3.5 Cost Analysis ....................................................................................................................... 45
4.0 Conclusions and Recommendations ........................................................................................ 47
Reference List ................................................................................................................................ 48
Appendices ..................................................................................................................................... 52
Appendix A: Calculations .......................................................................................................... 52
Appendix B: Raw Data .............................................................................................................. 59
Appendix C: COD Standard Curve ............................................................................................ 62
Appendix D: Nitrate Calibration Curve ..................................................................................... 63
Appendix E: C Series Pump Data Sheet .................................................................................... 64
Appendix F: UBWPAD Schematic ............................................................................................ 66
Appendix G: Typical Wastewater Treatment Schematic ........................................................... 67
Appendix H: Informal Interview with Bobby Young ................................................................ 68
xiv
Table of Figures
Figure 1: P&ID for Carbon Source Addition for Denitrification Design ....................................... iii
Figure 2: P&ID of Carbon Source Addition for Denitrification ..................................................... ix
Figure 3: COD Spectrophotometer and SimpleReads Computer Software ................................... 18
Figure 4: Nitrate Probe and Display ............................................................................................... 19
Figure 5: Kinetic Reactor Foam ..................................................................................................... 27
Figure 6: Micro-C 2000A Sample .................................................................................................. 27
Figure 7: Corn Syrup Sample ......................................................................................................... 28
Figure 8: Garelick Farm Waste Sample ......................................................................................... 29
Figure 9: WPI Biodiesel Production Waste Sample ...................................................................... 30
Figure 10: Sugar Sample ................................................................................................................ 31
Figure 11: DOW Chemical Sample ............................................................................................... 32
Figure 12: Elite Chemical Windshield Wiper Fluid Sample ......................................................... 33
Figure 13: Deicer Sample ............................................................................................................... 34
Figure 14: Micro-C Reactor Test Results ...................................................................................... 35
Figure 15: COD over Time for Micro-C ........................................................................................ 36
Figure 16: Corn Syrup Reactor Test Results .................................................................................. 37
Figure 17: COD over Time for Corn Syrup ................................................................................... 37
Figure 18: Biodiesel Production Waste Reactor Test Results ....................................................... 38
Figure 19: COD over Time for Biodiesel Production Waste ......................................................... 39
Figure 20: Sugar Waste Reactor Test Results ................................................................................ 40
Figure 21: COD over Time for Sugar Waste ................................................................................. 40
Figure 22: DOW Chemical Waste Reactor Test Results ............................................................... 41
Figure 23: COD over Time for DOW Chemical Waste ................................................................. 42
Figure 24: A P&ID of the Schematic of the Carbon Byproduct Design ........................................ 43
Figure 25: CAD Drawing of the Biodiesel Waste Design for UBWPAB ..................................... 45
Figure 26: COD Standard Curve .................................................................................................... 62
Figure 27: Nitrate Calibration Curve ............................................................................................. 63

xv
Table of Tables
Table 1: Properties of Micro-C ........................................................................................................ 5
Table 2: Establishing Alternative Carbon Sources ........................................................................ 16
Table 3: Values Used to Develop the Nitrate Standard Curve ....................................................... 18
Table 4: Average COD of Waste Samples and Preliminary Reactor Percent Decrease Nitrate .... 26
Table 5: SDNR and Lowest and Highest CODs from Final Tests ................................................. 34
Table 6: The Hourly Temperature and pH of the Final Micro-C Test ........................................... 36
Table 7: The Hourly Temperature and pH of the Final Corn Syrup Test ...................................... 38
Table 8: The Hourly Temperature and pH of the Biodiesel Production Waste Test ..................... 39
Table 9: The Hourly Temperature and pH of the Sugar Test......................................................... 40
Table 10: The Hourly Temperature and pH of the DOW Chemical Waste Test ........................... 42
Table 11: The Cost Analysis for the Design Equipment ................................................................ 45
Table of Equations
Equation 1: The Chemical Equation of Ammonification................................................................. 2
Equation 2: The Chemical Equation of Nitrification ....................................................................... 3
Equation 3: The Chemical Equation of Denitrification ................................................................... 3
Equation 4: COD Calculation from Absorbance............................................................................ 17
Equation 5: MLSS Equation .......................................................................................................... 20
Equation 6: MLVSS Volatile Solids Equation ............................................................................... 21
Equation 7: Determining Amount of Carbon Source to Add to Reactor ....................................... 21
Equation 8: SDNR Equation .......................................................................................................... 23
Equation 9: The equation used to calculate the desired volume of each carbon source for
denitrification in the reactor ........................................................................................................... 52
1
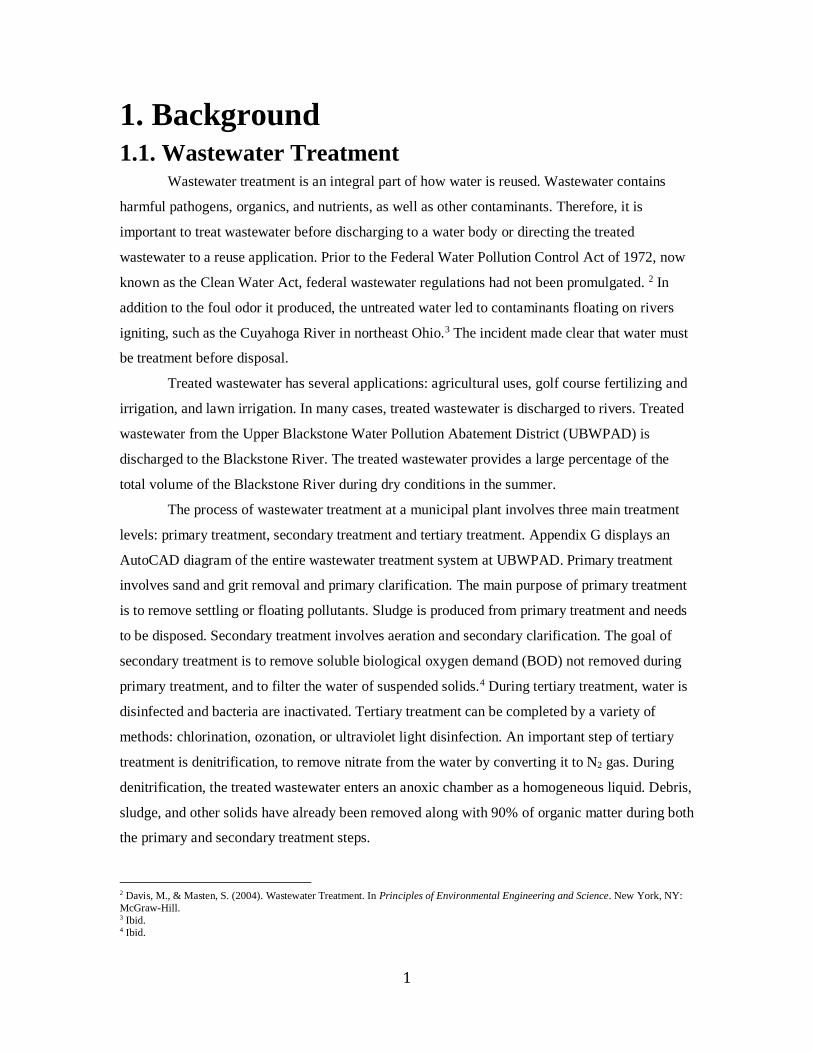
1. Background 1.1. Wastewater Treatment Wastewater treatment is an integral part of how water is reused. Wastewater contains
harmful pathogens, organics, and nutrients, as well as other contaminants. Therefore, it is
important to treat wastewater before discharging to a water body or directing the treated
wastewater to a reuse application. Prior to the Federal Water Pollution Control Act of 1972, now
known as the Clean Water Act, federal wastewater regulations had not been promulgated. 2 In
addition to the foul odor it produced, the untreated water led to contaminants floating on rivers
igniting, such as the Cuyahoga River in northeast Ohio.3 The incident made clear that water must
be treatment before disposal.
Treated wastewater has several applications: agricultural uses, golf course fertilizing and
irrigation, and lawn irrigation. In many cases, treated wastewater is discharged to rivers. Treated
wastewater from the Upper Blackstone Water Pollution Abatement District (UBWPAD) is
discharged to the Blackstone River. The treated wastewater provides a large percentage of the
total volume of the Blackstone River during dry conditions in the summer.
The process of wastewater treatment at a municipal plant involves three main treatment
levels: primary treatment, secondary treatment and tertiary treatment. Appendix G displays an
AutoCAD diagram of the entire wastewater treatment system at UBWPAD. Primary treatment
involves sand and grit removal and primary clarification. The main purpose of primary treatment
is to remove settling or floating pollutants. Sludge is produced from primary treatment and needs
to be disposed. Secondary treatment involves aeration and secondary clarification. The goal of
secondary treatment is to remove soluble biological oxygen demand (BOD) not removed during
primary treatment, and to filter the water of suspended solids.4 During tertiary treatment, water is
disinfected and bacteria are inactivated. Tertiary treatment can be completed by a variety of
methods: chlorination, ozonation, or ultraviolet light disinfection. An important step of tertiary
treatment is denitrification, to remove nitrate from the water by converting it to N2 gas. During
denitrification, the treated wastewater enters an anoxic chamber as a homogeneous liquid. Debris,
sludge, and other solids have already been removed along with 90% of organic matter during both
the primary and secondary treatment steps.
2 Davis, M., & Masten, S. (2004). Wastewater Treatment. In Principles of Environmental Engineering and Science. New York, NY:
McGraw-Hill. 3 Ibid. 4 Ibid.

2
Nitrogen generally takes the form of nitrate or nitrite in secondary-treated wastewater. It
is important to remove excess nitrogen in water; if it is not removed, it can have harmful effects
on both human and aquatic life. High concentrations of nitrogen in water are associated with
formation of algae blooms, which deplete the water body of oxygen and form dead zones.5
Additionally, in the case of a cyanobacteria (blue-green algae) bloom, when the cells die, they
may release harmful toxins into the water that can disrupt humans’ nervous systems, kidneys and
livers if ingested.6 Furthermore, high nitrate levels in water are associated with blue baby
syndrome.7 Nitrogen removal in wastewater is especially important if wastewater is discharged
into a salt water body, since nitrogen is the limiting nutrient in salt water. For fresh water bodies
phosphorus is the limiting nutrient. In the case of the UBWPAD, the Blackstone River eventually
discharges to Narragansett Bay, thus nitrogen and phosphorus removal is imperative.8
1.2. Nitrogen in Wastewater Nitrogen is a common element found in atmospheric, terrestrial, and aquatic
environments. Nitrogen is often found in wastewater because of two chemical processes:
ammonification and nitrification. Ammonification is the conversion of reactive, organic nitrogen
to ammonia and reactive hydroxide. Equation 1 displays the chemical equation of
ammonification. 9
Equation 1: The Chemical Equation of Ammonification
𝑅𝑁𝐻2 + 𝐻2𝑂 + 𝐻+ → 𝑅𝑂𝐻 + 𝑁𝐻4+
Nitrates (NO3-) are formed through the process of nitrification. Ammonium (NH4
+) is
oxidized and then converted to NO3- by a group of bacteria, known as ammonium oxidizing
bacteria (AOB). AOB are aerobic chemoautotrophs, meaning that they extract energy from the
oxidation of inorganic compounds and use inorganic carbon for cell synthesis. Other byproducts
5 Constantine, T. (2008, February 19). An Overview of Ammonia and Nitrogen Removal in Wastewater Treatment. Retrieved September 16, 2015. 6 Ibid. 7 Ibid. 8 Upper Blackstone Water Pollution Abatement District versus United States Environmental Protection Agency (United States Court of Appeals For the First Circuit August 03, 2012) (Dist. file). 9 Theis, T. & Hicks, A. (2012) Methanol Use in Wastewater Denitrification. Exponent, Inc. Retrieved from
<http://www.methanol.org/getdoc/74efb789-8095-4313-be84-38f6ae0df142/Exponent-Methanol-Denitrification-Report-July-
2012.aspx>
3
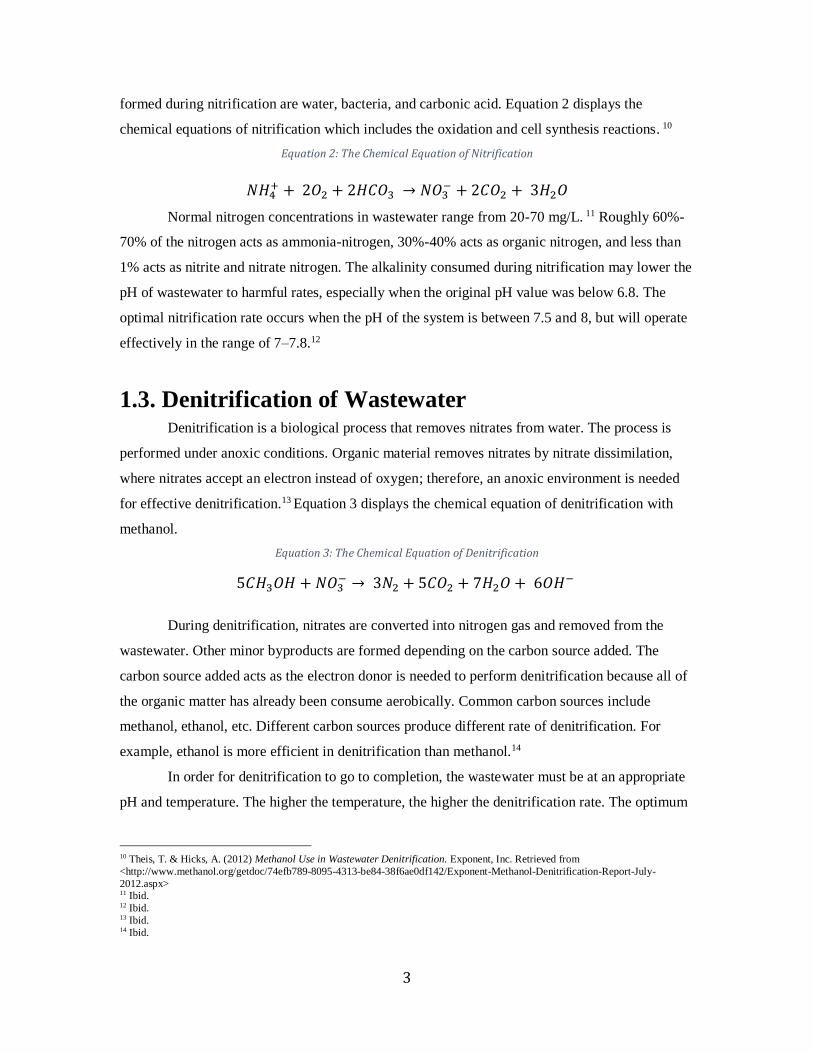
formed during nitrification are water, bacteria, and carbonic acid. Equation 2 displays the
chemical equations of nitrification which includes the oxidation and cell synthesis reactions. 10
Equation 2: The Chemical Equation of Nitrification
𝑁𝐻4+ + 2𝑂2 + 2𝐻𝐶𝑂3 → 𝑁𝑂3
− + 2𝐶𝑂2 + 3𝐻2𝑂
Normal nitrogen concentrations in wastewater range from 20-70 mg/L. 11 Roughly 60%-
70% of the nitrogen acts as ammonia-nitrogen, 30%-40% acts as organic nitrogen, and less than
1% acts as nitrite and nitrate nitrogen. The alkalinity consumed during nitrification may lower the
pH of wastewater to harmful rates, especially when the original pH value was below 6.8. The
optimal nitrification rate occurs when the pH of the system is between 7.5 and 8, but will operate
effectively in the range of 7–7.8.12
1.3. Denitrification of Wastewater Denitrification is a biological process that removes nitrates from water. The process is
performed under anoxic conditions. Organic material removes nitrates by nitrate dissimilation,
where nitrates accept an electron instead of oxygen; therefore, an anoxic environment is needed
for effective denitrification.13 Equation 3 displays the chemical equation of denitrification with
methanol.
Equation 3: The Chemical Equation of Denitrification
5𝐶𝐻3𝑂𝐻 + 𝑁𝑂3− → 3𝑁2 + 5𝐶𝑂2 + 7𝐻2𝑂 + 6𝑂𝐻−
During denitrification, nitrates are converted into nitrogen gas and removed from the
wastewater. Other minor byproducts are formed depending on the carbon source added. The
carbon source added acts as the electron donor is needed to perform denitrification because all of
the organic matter has already been consume aerobically. Common carbon sources include
methanol, ethanol, etc. Different carbon sources produce different rate of denitrification. For
example, ethanol is more efficient in denitrification than methanol.14
In order for denitrification to go to completion, the wastewater must be at an appropriate
pH and temperature. The higher the temperature, the higher the denitrification rate. The optimum
10 Theis, T. & Hicks, A. (2012) Methanol Use in Wastewater Denitrification. Exponent, Inc. Retrieved from
<http://www.methanol.org/getdoc/74efb789-8095-4313-be84-38f6ae0df142/Exponent-Methanol-Denitrification-Report-July-
2012.aspx> 11 Ibid. 12 Ibid. 13 Ibid. 14 Ibid.
4
denitrification rate occurs at 40 degrees Celsius and the preferred pH of wastewater is between 7
and 8.15
1.4. Wastewater Treatment at Blackstone The UBWPAD is a large wastewater treatment plant in Massachusetts servicing the
greater Worcester communities along with fourteen others.16 The plant’s permitted average
monthly flow is 56 million gallons per day (MGD) and the plant was designed for an average daily
flow of 45 MGD. The system is carbon limited at certain times of the day. The treatment plant
bypasses some carbon from the beginning of the system to the denitrification process during the
higher carbon content periods of the day. Low flow and high temperatures also limit the system. If
the flow of wastewater is too low, a lower dosage of carbon is needed. Furthermore, denitrification
is a seasonal procedure. Additional bacteria is present in the summer and spring seasons because
bacteria thrive in high temperatures. For this reason, more carbon is needed in spring and summer
seasons for complete denitrification compared to winter and fall seasons. 17
The untreated water enters the plant at its headworks facility and continues on to the
primary settling tanks. After the primary settling tanks, the wastewater continues on to open tanks
and undergoes an anaerobic process. The denitrification process and phosphorus removal is
performed in the aeration tanks before entering the final settling tanks. UBWPAD does not favor
the phosphorus or nitrogen removal because they are both important to the treatment process. The
treated water enters the river and the remaining organics are sent to the incinerator to burn in the
thickening building, where all the sludge is processed. Some of the microorganisms from the
settling tank are returned to the beginning of the anaerobic process to consume more
microorganisms. The process can be seen in Appendix F.18
The UBWPAD has a dynamic system that can be run in multiple ways; the most common
system used there is the biological nutrient removal (BNR) process and when there are occasions
of high flow rates the step feed mode is then temporarily used. The primary tanks are used to
settle sand and grit, and the flow measurement is taken for supercritical and subcritical flows.
Activated sludge is also present in the primary tanks to begin phosphorous removal. The activated
15 Wastewater handbook. Conditions for denitrification. Retrieved on October 29, 2015.
<http://www.wastewaterhandbook.com/documents/nitrogen_removal/431_NR_denitrification_prerequisites.pdf? 16 Upper Blackstone Water Pollution Abatement District. (n.d.). Home. Retrieved from Upper Blackstone Water Pollution Abatement
District: http://www.ubwpad.org/ 17 Mark Johnson, Personal Correspondence, September 4, 2015. 18 Ibid.
5
sludge is found within the four tanks seen above to transform nitrate into nitrogen gas. The
transformation occurs by going through the anaerobic, aerobic, and oxygenated processes.19
1.4.1. Denitrification Process at Blackstone Currently, UBWPAD uses Micro-CTM 2000-A as its source of carbon in denitrification.
Micro-CTM 2000-A is a glycerin-based liquid chemical that donates the necessary electron to
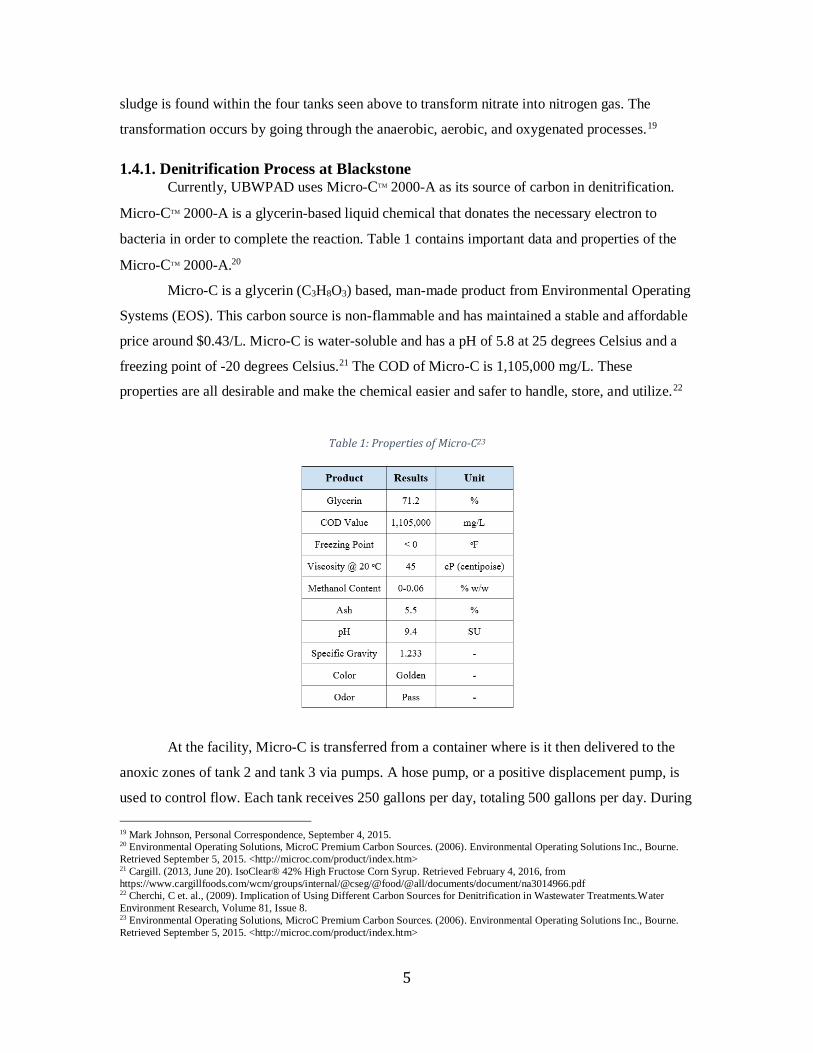
bacteria in order to complete the reaction. Table 1 contains important data and properties of the
Micro-CTM 2000-A.20
Micro-C is a glycerin (C3H8O3) based, man-made product from Environmental Operating
Systems (EOS). This carbon source is non-flammable and has maintained a stable and affordable
price around $0.43/L. Micro-C is water-soluble and has a pH of 5.8 at 25 degrees Celsius and a
freezing point of -20 degrees Celsius.21 The COD of Micro-C is 1,105,000 mg/L. These
properties are all desirable and make the chemical easier and safer to handle, store, and utilize.22
Table 1: Properties of Micro-C23
At the facility, Micro-C is transferred from a container where is it then delivered to the
anoxic zones of tank 2 and tank 3 via pumps. A hose pump, or a positive displacement pump, is
used to control flow. Each tank receives 250 gallons per day, totaling 500 gallons per day. During
19 Mark Johnson, Personal Correspondence, September 4, 2015. 20 Environmental Operating Solutions, MicroC Premium Carbon Sources. (2006). Environmental Operating Solutions Inc., Bourne.
Retrieved September 5, 2015. <http://microc.com/product/index.htm> 21 Cargill. (2013, June 20). IsoClear® 42% High Fructose Corn Syrup. Retrieved February 4, 2016, from
https://www.cargillfoods.com/wcm/groups/internal/@cseg/@food/@all/documents/document/na3014966.pdf 22 Cherchi, C et. al., (2009). Implication of Using Different Carbon Sources for Denitrification in Wastewater Treatments.Water
Environment Research, Volume 81, Issue 8. 23 Environmental Operating Solutions, MicroC Premium Carbon Sources. (2006). Environmental Operating Solutions Inc., Bourne.
Retrieved September 5, 2015. <http://microc.com/product/index.htm>
6
certain periods of the year, bypassed carbon from the inlet stream may be used. A different
carbon source is needed because a denitrification rate of 5 mg/L is not desirable.
A full-scale pilot study with Micro-C for denitrification is in place and may be
substituted with other carbon sources as well. Micro-C is currently used because it does not
require explosion-proof buildings, flammable storage tanks, or other safety requirements. Using
Micro-C saves a significant amount of money. Micro-C is an efficient electron donor and is
derived from renewable resource in the United States. Compounds with more electronegativity
are usually better electron donors. The Micro-C used at UBWPAD has a glycerol base. The
methanol compound is less complex and is less polar than the Micro-C.24
There are many safety concerns to consider before selecting new a carbon source. For
example, methanol has several hazardous risks associated with handling it. According to the
methanol MSDS, this chemical is an irritant when in contact with the skin, eyes, inhaled, or
ingested. Prolonged overexposure may result in death. Methanol is also highly flammable in
liquid or soluble form as well as explosive in vapor form. Protective storage and handling
equipment is required.25 To use methanol at UBWPAD, an on-site firefighter must constantly be
on standby and eyewash stations must be readily available. This can be very expensive for the
facility. This makes Micro-C a better much fit for aiding in denitrification of wastewater than
methanol.
1.5. Alternative Carbon Sources The following carbon sources were assessed for their effectiveness at removing nitrate
from wastewater at UBWPAD. Each carbon source was analyzed based on the composition,
COD, cost, freezing and boiling temperatures and pH.
1.5.1. Micro-C UBWPAD currently uses the chemical Micro-C 2000A as an additional carbon source for
denitrification. The cost of this source is higher than desired to produce the desired results,
therefore, other potential sources are being sought. The opportunity to use waste from other
companies is expected to be the most beneficial option for economic and environmental reasons.
24 Environmental Operating Solutions, MicroC Premium Carbon Sources. (2006). Environmental Operating Solutions Inc., Bourne.
Retrieved September 5, 2015. <http://microc.com/product/index.htm> 25 Material Safety Data Sheet Methyl alcohol MSDS. (2013, May 21). Retrieved October 27, 2015.
7
1.5.2. Beverage Waste The beverage industry produces sodas and seltzer waters. Beverage waste is primarily
composed of corn syrup and high fructose corn syrup diluted by water. High fructose corn syrup
(HFCS) is composed of fructose, glucose, sugars and polysaccharides (glucose chains).26 The pH
of corn syrup ranges from 3.3 to 4.5 and it has a theoretical COD (TCOD) value of 1.067 g
TCOD/ g substrate. A 1000 kg tote of corn syrup can cost from $733.15-$845.71 depending on
the concentration. HFCS syrup must be stored at higher temperatures between 27-32 degrees
Celsius to prevent crystallization. Thus, pipes used for transporting high concentrations of
beverage waste such as HFCS must be heated so the syrup does not solidify.27
The Water Environment Foundation tested HFCS as a carbon source for denitrification.
The study concluded that HFCS is an effective denitrifying agent, and saw decreases in nitrate as
nitrogen from 8.8 mg/L to 2.7 mg/L. However, the Water Environment Foundation identified
three main challenges to using HFCS for denitrification:28
1. Storage at an elevated temperature to maintain relatively low viscosity and prevent
crystallization.
2. The viscous liquid must be pumped such that is mixes with the effluent.
3. The mixing must be sufficient enough to fully dissolve the syrup in the effluent.
1.5.3. Brewery Waste The waste effluent of breweries is mainly composed of ethanol and sucrose in various
concentrations and dilutions. These two constituents have different properties as a carbon source.
Ethanol (C2H6O) is a highly flammable, clear liquid most often used as an additive to
motor fuel. Many alcoholic beverages contain ethanol. Denatured ethanol can be purchased for
$8.93 per liter and must be stored in flammable liquid storage areas away from oxidizers, high
temperatures, and flames. The boiling point of ethanol is 78.5 degrees Celsius, the freezing point
is -115 degrees Celsius, and its pH is approximately 7.29 Ethanol is often used in denitrification
and is known to have a high denitrification rate of 9.6 mg NO3-N/ (g VSS-h), along with a low
sludge yield of 0.42 m MLSS/ g COD.30
26 Corn Naturally. (n.d.). HFCS COMPOSITION. Retrieved February 04, 2016, from http://www.cornnaturally.com/hfcs-scientific-
data/HFCS-Nutritional-Equivalencies/Composition 27 deBarbadillo, C. et. al.,(2008). Got Carbon? Widespread biological nutrient removal is increasing the demand for supplemental
sources. Water Environment Federation http://www.webpages.uidaho.edu/ce432/WET-Got%20Carbon.pdf 28 Pretorius, C., Kilian, R., & Jannone, J. (2006). GIVE YOUR DENITRIFICATION BUGS A SUGAR HIGH [Scholarly project]. In
Water Environment Foundation. Retrieved February 3, 2016. 29 Nutrients Review. (2015). Alcohol (Ethanol) Chemical and Physical Properties. Retrieved February 04, 2016, from
http://www.nutrientsreview.com/alcohol/definition-physical-chemical-properties.html 30 Ma, Y. Peng, Y. Wang S. (2007). Denitrification potential enhancement by addition of external carbon sources in a pre-
denitrification process. Journal of Environmental Sciences 19(2007) 284-289. Retrieved October 2, 2015.
8
Sucrose (C12H22O11), also known as sugar, is a molecule comprised of glucose and
fructose. Sucrose is found in waste effluents from industrial beverage manufacturing, breweries
and sugar production facilities. Sucrose has a melting point of 185.5 degrees Celsius and a neutral
pH.31 The TCOD of sucrose is 1.1 g O2/ g sucrose.32
A study completed by the Italian Association of Chemical Engineering (IACE) tested
sucrose as an external carbon source for denitrification of wastewater from explosive and
ammunition industries, whose wastewater generally contains high nitrate concentrations. With an
appropriate set up, the IACE discovered that sucrose could achieve high denitrification rates in
the wastewater. However, two reactors in series had to be set up to achieve a pH that did not
cause inhibiting effects of nitrites, and this was not the case with methanol or acetic acid.
Furthermore, complete nitrate removal was only found with methanol in their study.33
Sucrose is combustible and finely dispersed particles can form explosive mixtures in air,
but is not considered flammable in solid state. If sucrose comes in contact with strong oxidants,
there may be a reaction, creating a fire hazard. Sucrose may cause skin, eye, and lung irritation,
but is not a known human carcinogen.34
1.5.4. Dairy Waste Dairy products include milk, yogurt, cheese, and more. Their production creates wastes
and byproducts in the process. Dairy byproducts have potential to be effective carbon sources
with the main components found in the waste being lactose and lactate.35
Lactose is a waste product generated through the production of dairy products. Lactose’s
chemical formula is C12H22O11, similar to the structure and formula of sugar.36 This compound is
non-flammable, but emits toxic fumes under fire conditions. Lactose is not a carcinogen and does
not have any known chronic effects. Protection is necessary when handling lactose in case of
irritation to skin and eyes. Lactose should be stored in ambient temperature and a tightly closed
container to ensure an unlimited shelf life.37 In dairy waste, 1.00 kg of lactose produces 1.13 kg of
COD, but COD can vary in dairy waste depending on the concentration of contents. Lactose’s
31 PubChem. (2004, September 16). Sucrose. Retrieved February 04, 2016, from http://pubchem.ncbi.nlm.nih.gov/compound/sucrose 32 Langeland, W. E., & Filipiak, D. J. (2016, February 4). Food Processing Wastewater Treatment Design. Lecture. 33 De Filippis, P., Di Palma, L., Scarsella, M., & Verdone, N. (2013). Biological Denitrification of High-Nitrate Wastewaters: A
Comparison Between Three Electron Donors. Chemical Engineering Transactions, 32, 319-324. Retrieved February 4, 2016, from http://www.aidic.it/cet/13/32/054.pdf 34 "Sucrose." PubChem OPEN CHEMISTRY DATABASE. National Center for Biotechnology Information, 30 Jan. 2016. Web. 04 Feb.
2016. 35 Znanstveni, Izvorni Rad. "The Potential of Dairy Wastewater for Denitrification." Faculty of Food Technology and Biotechnology, University of Zagreb (n.d.): n. pag. Web. 8 Feb. 2016. 36 Bursey, Robert G. "New Industrial Uses of Dairy Products." National Agricultural Library. United States Department of
Agriculture. 37 "MSDS Lactose." Hummelcroton.com. Hummel Croton. Web. 04 Feb. 2016.
9
melting point is 203.5°C. The price of lactose is $3.99 per pound and the pH of lactose is mostly
neutral, but can range from 6-10.38
Lactate is another byproduct of dairy product production. Lactate, or the chemical name
lactic acid (C3H6O3), is very dangerous and can burn the eyes, skin, and digestive and respiratory
tracts. Lactate is also dangerous in proximity to fire, moisture, or water.39 The boiling point of
lactate is 200°C and the melting point is 17°C.40 Lactate is acidic, with a pH of 2.4 and a COD of
1.07 mg COD per mg of lactic acid. The price of lactic acid is $2.98 for a 5-ounce of an 88%
solution.41
Dairy wastewater has been proven to be an alternative carbon source for the
denitrification process with concentrations of lactose, lactate, or both. During one experiment, a
maximum nitrate reduction rate was 5.75 mg NO3-N/Lh. The concentrations of lactose and lactate
were unknown during the experiment because the compositions in the wastewater vary from day
to day.42
1.5.5. Winery and Alcoholic Beverages Waste Wine and alcohol production creates a waste stream that is mainly composed of ethanol
in various concentrations of water. Ethanol as a carbon source was previously discussed in
section 1.5.3 concerning waste of breweries.
1.5.6. Biodiesel Production Waste As described in earlier sections, glycerol is the main byproduct of biodiesel production.
Glycerol (C3H8O3) is a sugar alcohol compound most commonly found in pharmaceutical
products. The cost of pure glycerol is approximately $7.50 per liter. Glycerol must be stored in a
sealed container in a cool environment, although the chemical is not explosive. Experiments have
been run involving glycerol in denitrification of wastewater. Results have shown that glycerol is
successful in the denitrification process. During one experiment, sludge concentration had to be
regulated because there was an overproduction of biomass. However, this ended up being
desirable because the relationship between the amount of biomass and nitrogen removal is a
positive linear trend.43
38 World Bank Group. “Dairy Industry”. Pollution Prevention Control, 1998. Retrieved from
<http://www.ifc.org/wps/wcm/connect/2668f38048855c0e8adcda6a6515bb18/dairy_PPAH.pdf?MOD=AJPERES> 39 Material Safety Data Sheet Lactic Acid." Trade-chem.com. Chemtrade International. 40 “Lactic Acid”. Corbion Purac, 2014. Retrieved from <http://www.lactic-acid.com/physical_properties.html> 41 “The activated sludge system”. The Wastewater Handbook, 2013. Retrieved from
<http://www.wastewaterhandbook.com/documents/organic_material_metabolism/211_OMBM_COD.pdf> 42 Dragicevic, Tibela. “The potential of dairy wastewater for denitrification”. University of Zagreb, 2010. Retrieved from
<file:///C:/Users/Dallen/Downloads/Mljekarstvo_29_9_2010_191_197%20(1).pdf> 43 Grabinska-Loniewska, A. Slomczynski T. Kanska Z. Denitrification Studies with Glycerol as a Carbon Source. Institute of
Environmental Engineering, Warsaw Technical University. Retrieved October 6, 2015.
10
Glycerol has a freezing and boiling point of 18 and 290°C respectively. The COD of
glycerol has been reported as 1160 mg/g substance and the pH at 7.2.44
1.5.7. Sugar Production Waste Sugar is made through a process that results in wastes with high concentrations of sugars
and ethanol. Both of these components’ performances as a potential carbon source have been
previously discussed in section 1.5.3 brewery waste.
1.5.8. Municipal Solid Waste Landfill Leachate Methane (CH4) is a potent greenhouse gas produced by solid waste landfills. Low in cost
and common at many wastewater treatment plants, methane is viewed as a valid option to use in
denitrification. Only aerobes are able to metabolize methane. Aerobes only survive in aerobic
environments, and denitrification must be performed under anoxic conditions. Methane has been
experimentally proven to perform denitrification in wastewater. However, denitrification only
occurred at 8-13%, or 3.5-4.0 mg/L. Instead methane can be converted into methanol and used as
the source of the electron donor.
Methane is known to be a highly flammable material requiring special storage units.
Special training would be needed with any employees who are required to handle methane. Safety
training would be required of employees in case of methane leaks. The boiling point of methane
is -162°C and the freezing point is -182.5°C.45 COD of methane is 4 g COD/g CH4.46 Cost and pH
of methane could not be accurately reported.
1.5.9. Chemical Manufacturing Waste Many industries within chemical manufacturing include production and use of antifreeze,
windshield washer fluids, and raw chemicals. Each industry produces a different composition and
concentration of waste.
The production of windshield washer fluid is one chemical manufacturing source that
leads to a waste product of diluted methanol. Methanol (CH3OH) is an alcohol that acts as an
effective electron donor and is commonly used in wastewater denitrification. UBWPAD
employees have specifically declared that they do not want to use methanol at their facilities
because of safety concerns. Storing methanol onsite requires a local firefighter to constantly be in
contact with UBWPAD employees. Methanol requires special storage units and areas because of
its flammability. Safety training on handling and emergency procedures would be required for all
44 Robertson, Steve. "Glycerol." Inchem.org. National Centre for Ecotoxicology & Hazardous Substances, Mar. 2002. Web. 45 Boyle, Richard, and Peter Witherington. "Guidance on Evaluation of Development Proposals on Sites Where Methane and Carbon
Dioxide Are Present." Nhbc.co.uk. National House-Building Council, Mar. 2007. Web. 46 "Anaerobic Digestion." Waste Water Handbook. Web.
11
employees, which could be very expensive.47 Methanol is priced at $1.13 per gallon.48 The
freezing point of methanol is -97.8°C and the boiling point is 64.5°C. Methanol does not have a
specific pH because pH is associated with water solutions. Methanol contains 4.00mg COD/mg
TOC.49
Another chemical produced as a waste product by some chemical manufacturers is
isopropyl alcohol (IPA) with the IUPAC name 2-propanol and the chemical formula
CH3CHOHCH3. This is an organic compound which can be used in aiding the denitrification
process.50 According to the MSDS, some precautions should be taken when working with this
highly flammable compound. IPA is a skin and eye irritant and should not be ingested or inhaled.
IPA is also highly flammable and potentially explosive and must be contained in a separate area,
where ventilation is available. The freezing point of IPA is -88.5°C and the boiling point is
82.5°C. The pH of IPA is not available because pH is associated with water solutions.51 The COD
of this compound is 2.23 grams of oxygen per gram of chemical.52 One gallon of 99.5% IPA is
$25.00/gallon from ULINE, but can be found cheaper on eBay. Sources were not found on the
performance of IPA in denitrification of wastewater.
Acetone is a chemical that can be found in manufacturing wastes and may be utilized for
denitrification of wastewater.53 The chemical should not come in contact with eyes or skin and
should not be ingested or inhaled. Acetone is flammable in the presence of open flames and can
be explosive and must be stored in cooled containers in a separate and well-ventilated area. The
area where acetone is worked with must be well ventilated. Acetone’s freezing point is -95.35°C
and the boiling point is 56.2°C.54 The pH and use within denitrification is not available for
acetone. The COD of acetone is 1.92g COD/g acetone.55 Sigma Aldrich sells acetone for $495.00
for 4×4L.
An additional waste product of chemical manufacturers is acetate which is a commonly
used alternative carbon source for denitrification.56 In some cases, acetate has been found to be a
47 Mark Johnson. Personal Correspondence. 2015. 48 Ridge, Tom, and Mary E. Peters. "The Methanol Alternative to Gasoline." The New York Times. The New York Times, 23 Feb. 2012. Web. 08 Feb. 2016. 49 “The activated sludge system”. The Wastewater Handbook, 2013. Retrieved from
<http://www.wastewaterhandbook.com/documents/organic_material_metabolism/211_OMBM_COD.pdf> 50 "Wastewater Treatment Fact Sheet: External Carbon Sources for Nitrogen Removal." United States Environmental Protection
Agency, 1 Aug. 2013 51 "Isopropyl Alcohol MSDS." Sciencelab.com, Inc. 52 Bridie´, A., Wolff, C., & Winter, M. (1979). BOD and COD of some petrochemicals. Water Research, 13(7), 627-630. 53 Gu, A., & Onnis-Hayden, A. (2010). PROTOCOL TO EVALUATE ALTERNATIVE EXTERNAL CARBON SOURCES FOR
DENITRIFICATION AT FULL-SCALE WASTEWATER TREATMENT PLANTS. Water Environment Research Foundation. Retrieved August 31, 2015. 54 Acetone MSDS. Sciencelab.com. 55 Bridie´, A., Wolff, C., & Winter, M. (1979). BOD and COD of some petrochemicals. Water Research, 13(7), 627-630. 56 Wastewater Treatment Fact Sheet: External Carbon Sources for Nitrogen Removal. (2013). USEPA.
12
more effective source of denitrification when compared to methanol and ethanol, two other
common alternative carbon sources.57 Acetate is the ion derived from acetic acid.58 Acetic acid is
also commonly used an alternative carbon source for denitrification.59 Dilute solutions must be
used to prevent flammability and specialty storage is needed to prevent freezing. The freezing
point of acetate is 17°C and a boiling point of 118°C. The pH of acetate is 2.4.60 The COD and
cost was not found.
One form of antifreeze is used for de-icing air crafts and airports and is mainly composed
of propylene glycol (CH3CHOHCH2OH). Propylene glycol is a readily biodegradable organic
compound. Solutions of both ethylene glycol and propylene glycol have been studied for potential
use as an alternative carbon source for denitrification. Waste run off from airport deicing is rich
in organics with a 4.7-10gCOD/gNO3N ratio. Studies demonstrate deicing waste is an effective
denitrification source that can be more beneficial than methanol.61 Propylene glycol has a low risk
in handling and storage. According to the MSDS for this chemical, it only has a flammability
rating of one, making it a fairly safe chemical to handle. The freezing point of propylene glycol is
-59°C and the boiling point is 188°C. The pH is not available for propylene glycol.62 The COD is
reported to be 1.63g COD/g propylene glycol.63 Propylene glycol is $16.49 per gallon at Sears,
but industrial quotes may vary.
Chemical manufacturers sometimes produce glycerin as a byproduct. Micro-C,
UBWPAD's current carbon source, is mainly composed of glycerin as mentioned previously.
Glycerin can expected to be a potentially effective source as Micro-C. Glycerin is also known as
1,2,3-Propanetriol with the chemical formula C3H5(OH)3. The hazards of working with glycerin
are low with little to no risk of physical contact or inflammation. The boiling point of glycerin is
290°C and the melting point is 19°C.64 An approximate price for this chemical is $1.34/lb.65 The
COD for glycerin could not be determined.
57 Cormier, M., Suchecki Jr., R., Pertuit, R., Brown, D., & Cormier, T. (2010). Compound for denitrifying wastewater. United States Patent and Trademark Office. 58 Acetate. (2015, October 1). Retrieved November 6, 2015, from
http://pubchem.ncbi.nlm.nih.gov/compound/acetate#section=Related-Compounds-with-
Annotatiohttp://pubchem.ncbi.nlm.nih.gov/compound/acetate#section=Related-Compounds-with-Annotationn 59 ScienceLab. (2013). Acetic acid MSDS. Sciencelab.com. 60 deBarbadillo, C. et. al.,(2008). Got Carbon? Widespread biological nutrient removal is increasing the demand for supplemental
sources. Water Environment Federation http://www.webpages.uidaho.edu/ce432/WET-Got%20Carbon.pdf 61 Liang, W. (2013). Evaluation of an Industrial By-product Glycol Mixture as a Carbon Source for Denitrification. Blacksburg,
Virginia: Virginia Polytechnic Institute. 62 ScienceLab. (2013). Propylene Glycol MSDS. Sciencelab.com. 63 Bridie´, A., Wolff, C., & Winter, M. (1979). BOD and COD of some petrochemicals. Water Research, 13(7), 627-630. 64 ScienceLab. (2013). Glycerin MSDS. Sciencelab.com. 65 "Glycerin." Bulk Apothecary. Web. 06 Apr. 2016.
13
1.6. Experimental Background Various tests were performed on the wastewater samples in order to evaluate the potential
of the various carbon sources for denitrification at the plant. The tests performed determined the
values of COD, and nitrate content, and evaluated reaction kinetics. COD is “a measure of the
capacity of water to consume oxygen during the decomposition of organic matter and the
oxidation of inorganic chemicals such as ammonia and nitrite.” In wastewater applications, COD
and BOD are commonly used to indirectly measure organic content. It is important for organic
content in wastewater to be low as it leaves the treatment plant, thus BOD and COD levels are
monitored to ensure this happens. However, only COD tests were performed for this project.
COD tests can be completed in a couple of hours while BOD tests take several days. As stated
previously in the background chapter, it is important to keep nitrogen levels low as high nitrogen
concentrations can lead to several deleterious effects. Therefore, tests were run to determine the
nitrate concentration in the wastewater. Lastly, studying the kinetics within a reactor assisted in
the design of the process flow and reaction rates to deduce if a higher flow rate or more contact
time is needed. Methods for these experiments are further described in the second chapter.
1.6.1. COD Testing COD is a measure of the organic content in wastewater. Typically, COD tests are used to
test wastewater or contaminated natural waters. The tests are standard; a sample is taken,
transferred to a test vial with the necessary reactants, and put into an incubator for 2 hours at
150°C. Chemicals found in wastewater include various organics and inorganics; therefore,
potassium dichromate is ordinarily used in combination with sulfuric acid to create a strong
oxidizing environment.66
1.6.2. Nitrate Testing According to the United States Environmental Protection Agency (USEPA), nitrates are a
form of nitrogen found in land and water environments. They are necessary nutrients for plants,
but in excess, they can be harmful to water ecosystems and can decrease water quality. An
increase of nitrates in water causes low levels of dissolved oxygen (DO). Low levels of oxygen in
the water create a toxic environment to aquatic lifeforms. To gain perspective, the amount of
nitrates, such as ammonia (NH3) and nitrate (NO3), in the effluent are typically less than 1 mg/L
66 Net Industries. (2015). Chemical Oxygen Demand. Retrieved from Net Industries: http://science.jrank.org/pages/1388/Chemical-
Oxygen-Demand.html
14
while the influent in wastewater treatment plants can reach up to 30 mg/L.67 Testing for nitrates
can be done with a cadmium reduction method or a nitrate electrode method.
The cadmium reduction method is a colorimetric method. Cadmium in particulate form
are mixed with the nitrate, creating nitrites. If the concentrations of nitrite are greater than
1 mg/L, then a color wheel should be used to select the concentrations; otherwise, a
spectrophotometer should be used. Since part of the test is subjective, results may vary from lab
to lab.68
The nitrate electrode method is another common test to measure the amount of nitrates in
the water. The nitrate concentration is tested with a probe measuring the amount of nitrate activity
in the water. The probe measures the nitrate concentration by transferring the electric signal from
the probe to a scale read in millivolts. Readings can be affected by high concentrations of
chloride or bicarbonate ions in the sample and by changes in temperature.69
1.6.3. Reactor Kinetics In industry, bench scale reactors are utilized to collect kinetics data before developing a
large-scale process. They are used to examine various ranges of pressures, temperatures, and
ratios of reactants or catalysts. The rates of the various reactions are dependent upon the kinetic
processes, physical, chemical, and biological. Chemical kinetic processes refer to the interaction
between molecules, whereas the physical kinetic processes refer to mixing and changing the
pressure or the temperature of a system. A basis for comparison is typically selected when
designing an experiment. Comparisons between results of the bench scale reactor experiments
can be compared to typical reactions.70
In order to complete this experiment, the amount of alternative carbon source to add to
the batch reactor had to be determined. Several factors impact the amount of sample added to the
system including COD, substrate to biomass ratio (F/M), and mixed liquor volatile suspended
solids (MLVSS). COD has been previously discussed and explained prior. The F/M represents
the food, carbon substrate, to microorganism ratio.71 MLVSS are the volatile suspended solids
that are present in the wastewater being treated. In order to find the MLVSS, first the mixed
67 Environmental Protection Agency. (2012, March 6). Water: Monitoring and Assessment: 5.7 Nitrates. Retrieved from EPA: United States Environmental Protection Agency: http://water.epa.gov/type/rsl/monitoring/vms57.cfm 68 Environmental Protection Agency. (2012, March 6). Water: Monitoring and Assessment: 5.7 Nitrates. Retrieved from EPA: United
States Environmental Protection Agency: https://www.epa.gov/sites/production/files/2015-06/documents/stream.pdf 69 Ibid. 70 Snyder, J. R., Hagerty, P. F., & Molstad, M. C. (1957, April). Operation and Performance of Bench Scale Reactors. Retrieved from
ACS Publications: http://pubs.acs.org/doi/pdf/10.1021/ie50568a033 71 Gu, A. and Hayden, A. (2010). Protocol to Evaluate Alternative External Carbon Sources for Denitrification at Full-Scale
Wastewater Treatment Plants. WERF.

15
liquor suspended solids (MLSS) must be found.72 The two are interrelated and the procedure for
finding them is described in the sections below.
72 "Mixed Liquor Volatile Suspended Solids (MLVSS) & (MLSS) - EBS - Wastewater Training and Consulting." EBS Wastewater
Training and Consulting RSS. Wastewater Training and Consulting, 2016. Web. 21 Apr. 2016.
<https://www.ebsbiowizard.com/2011/01/mixed-liquor-volatile-suspended-solids-mlvss-mlss/>.
16
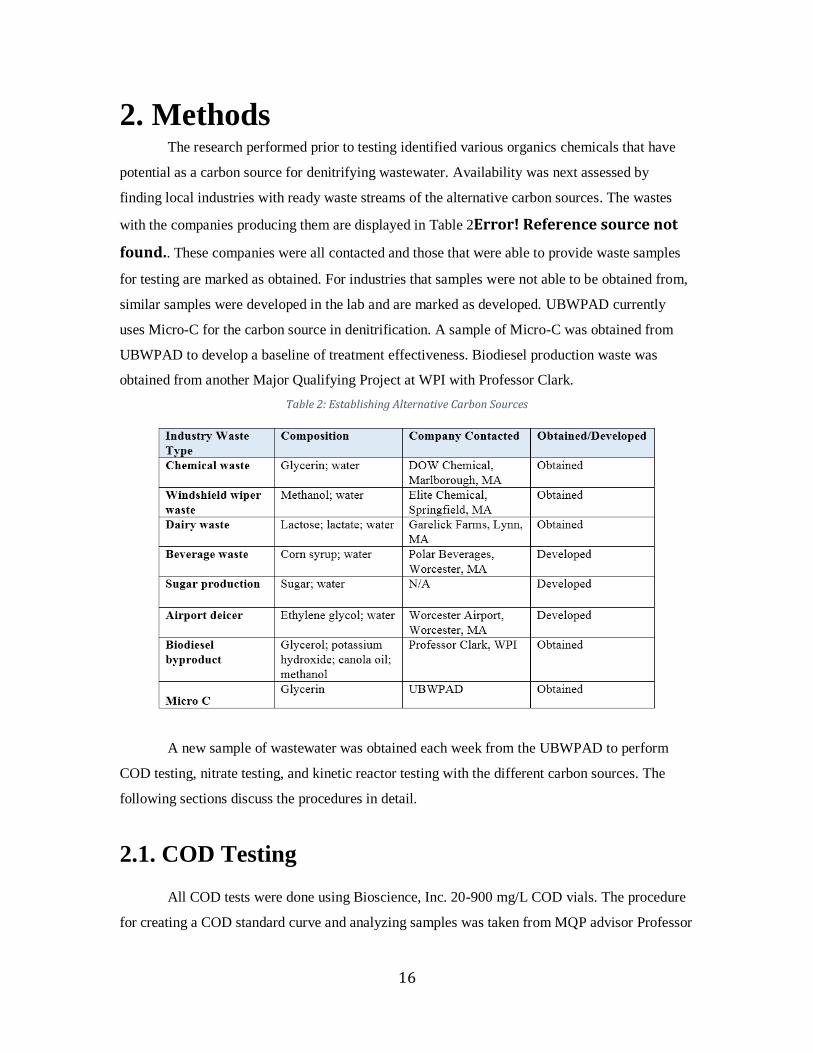
2. Methods The research performed prior to testing identified various organics chemicals that have
potential as a carbon source for denitrifying wastewater. Availability was next assessed by
finding local industries with ready waste streams of the alternative carbon sources. The wastes
with the companies producing them are displayed in Table 2Error! Reference source not
found.. These companies were all contacted and those that were able to provide waste samples
for testing are marked as obtained. For industries that samples were not able to be obtained from,
similar samples were developed in the lab and are marked as developed. UBWPAD currently
uses Micro-C for the carbon source in denitrification. A sample of Micro-C was obtained from
UBWPAD to develop a baseline of treatment effectiveness. Biodiesel production waste was
obtained from another Major Qualifying Project at WPI with Professor Clark.
Table 2: Establishing Alternative Carbon Sources
A new sample of wastewater was obtained each week from the UBWPAD to perform
COD testing, nitrate testing, and kinetic reactor testing with the different carbon sources. The
following sections discuss the procedures in detail.
2.1. COD Testing
All COD tests were done using Bioscience, Inc. 20-900 mg/L COD vials. The procedure
for creating a COD standard curve and analyzing samples was taken from MQP advisor Professor
17
Bergendahl, the 19th edition of the "Standard Methods for the Examination of Water and
Wastewater", and the Bioscience, Inc. COD methods.
2.1.1. COD Calibration Curve Procedure Three different dilutions of potassium hydrogen phthalate (KHP) and distilled water were
created and then 2.5 mL of each solution were added to the COD vials. The dilutions created
were 170 mg/L, 425 mg/L and 680 mg/L. Next, the vials were shaken to mix the solution, and
each vial was heated for two hours at 150°C to allow for digestion. After heating, the samples
were removed from the incubator, agitated and then allowed to settle for ten minutes. This step is
required to avoid diffraction with the light beam. Following settling, the samples were transferred
to the spectrophotometer cuvettes, and readings were taken at a wavelength of 600 nm after
zeroing to a blank.
A plot was made with COD values of the standards on the x-axis and absorbance of the
dilutions on the y-axis. A line of best fit was found and the slope of this line was found to be
0.0004. COD values of the other samples were found using Equation 4.
Equation 4: COD Calculation from Absorbance
𝐶𝑂𝐷 𝑆𝑎𝑚𝑝𝑙𝑒 [𝑚𝑔
𝐿] = 1 + 𝑎𝑏𝑠𝑜𝑟𝑏𝑎𝑛𝑐𝑒[𝑛𝑚] × 0.0004
2.1.2. COD Procedure Samples to be tested were diluted as needed and 2.5 mL of the sample added to the COD
vial. Next, the vials were shaken to mix the solution, and each vial was heated for two hours at
150°C to allow for digestion. After heating, the samples were removed from the incubator,
agitated and then allowed to settle for ten minutes. This step is required to avoid diffraction with
the light beam. A spectrophotometer was used to analyze each sample through SimpleReads
software program shown in Figure 3. Following settling, the samples were transferred to the
spectrophotometer cuvettes, and readings were taken at a wavelength of 600 nm after zeroing to a
blank. The COD standard curve was used to convert the readings from absorbance to mg/L COD.

18
Figure 3: COD Spectrophotometer and SimpleReads Computer Software
2.2. Nitrate Testing To complete the nitrate testing, the electrode operation was tested first. This procedure
measured the slope of the electrode, which in return checked the electrode operation. The slope
was measured as the change in millivolts (mV) over the change in concentration. Once the nitrate
electrode was properly set up and running, the electrode was connected to a meter and set to
millivolts (mV) mode, shown in Figure 4. The standard procedure for low level calibration was
used as some denitrification produced nitrate concentrations below 1.4 ppm. To begin this
method the procedure calls for 100 mL of distilled water and 1 mL ionic strength adjuster Cat.
No. 930711 (ISA). However, ISA was not provided and was substituted with nitrate interference
suppressor solution (NISS) Cat. No 930710 for this procedure and all future procedures needing
ISA. When testing samples a ratio of 1:1 is needed between sample and NISS. For the standard
curve there is 10.1 mL of NISS required for every 90.9 mL distilled water. In a 200 mL beaker
100 mL of distilled water was mixed with 11.1 mL NISS. 100 ppm nitrate standard was used for
the procedure. The following Table 3 displays the amount of 100 ppm nitrate standard added to
the distilled water and NISS mixture and the nitrate concentrations of the resulting solutions.
Table 3: Values Used to Develop the Nitrate Standard Curve
The concentration of nitrate and the corresponding mV reading from the electrode could
then be used to produce a standard curve. This curve could then be used to convert mV readings

19
into nitrate concentrations. The nitrate electrode readings are sensitive to temperature and so
temperature was recorded with every nitrate electrode reading to account for any discrepancies.
Figure 4: Nitrate Probe and Display
First, regular wastewater was tested to conclude what the normal concentration of nitrate
was in wastewater. The amount of nitrate in regular wastewater was then used to compare with
other wastewater solutions once a carbon source was added. The carbon source was mixed with
the wastewater and then a 20 mL sample was removed and mixed with 20 mL of NISS for one
minute. The nitrate probe was then placed into the solution for thirty seconds and the meter
reading was recorded and used to determine the concentration of nitrate in the solution using the
standard curve. This procedure was used in the reactor kinetic experiment to measure the
difference in nitrate concentrations for regular wastewater and wastewater with an added carbon
source. The readings were taken and analyzed to conclude which carbon sources caused the
concentration of nitrate in wastewater to decrease the most.
2.3. Reactor Kinetics Experiments The following procedure was modified from “Protocol to Evaluate Alternative External
Carbon Sources for Denitrification at Full-Scale Wastewater Treatment Plants” by Gu and
Hayden.73 A nitrate utilization rate experiment was performed using a small batch reactor to
analyze the reaction kinetics of the alternative carbon sources. This was achieved by measuring
nitrate and COD readings over time to analyze the specific denitrification rate and the COD/N
ratio. Nitrate levels were low, less than 1 ppm, due to cold seasonal operation of the wastewater
73 Gu, A. and Hayden, A. (2010). Protocol to Evaluate Alternative External Carbon Sources for Denitrification at Full-Scale
Wastewater Treatment Plants. WERF.
20
treatment plant, therefore an additional source of nitrate was added to the reactor to ensure nitrate
could be observed. Adding additional nitrate produced more dependable results as the lowest
limits of the probe would not be reached. Approximately 10 mg of sodium nitrate was added to
each reactor at the start of every test. This number was decided upon because research showed
that nitrate levels at treatment plants typically begin at about 8 ppm.74 After measuring the nitrate
readings in our wastewater samples a mass balance was calculated and determined that
approximately 10 mg of sodium nitrate would be needed to achieve near to an 8 ppm nitrate
starting point for each test.
In order to find the best candidates most efficiently, a shorter test was first performed on
all potential sources in order to select the top candidates to study closer. Short tests were two
hours long with less samples taken, and more extensive tests were four hours with more samples
taken. The exact procedures are below.
Before completing any reactor tests, the MLVSS of the wastewater from UBWPAD were
measured in order to decide the amount of carbon source to add to the reactor test. This was done
by vacuum filtering 50 mL of wastewater through 1.5 μm nominal pore size glass fiber filters
that had previously been dried for 24 hours in an 105°C oven and then weighed. The wet filters
were left in the oven for 24 hours. Once removed, the filters were weighed to determine the total
suspended solids in the wastewater using Equation 5.
Equation 5: MLSS Equation
𝑡𝑜𝑡𝑎𝑙 𝑠𝑢𝑠𝑝𝑒𝑛𝑑𝑒𝑑 𝑠𝑜𝑙𝑖𝑑𝑠[𝑚𝑔]
[𝐿]=
(𝐴 − 𝐵) × 1,000
𝐶
𝐴 = 𝑤𝑒𝑖𝑔ℎ𝑡 𝑜𝑓 𝑓𝑖𝑙𝑡𝑒𝑟 + 𝑑𝑟𝑖𝑒𝑑 𝑟𝑒𝑠𝑖𝑑𝑢𝑒 [𝑚𝑔]
𝐵 = 𝑤𝑒𝑖𝑔ℎ𝑡 𝑜𝑓 𝑓𝑖𝑙𝑡𝑒𝑟 [𝑚𝑔]
𝐶 = 𝑠𝑎𝑚𝑝𝑙𝑒 𝑣𝑜𝑙𝑢𝑚𝑒 [𝑚𝐿]
The dried filters with residue were then put in a 500 degree Celsius oven for one hour
before being removed and weighed. The MLVSS were then calculated using Equation 6.
74 Leverage, E. (2015). All wastewater foam is not alike. Retrieved from
http://www.environmentalleverage.com/All_foam_is_not_alike.htm
21
Equation 6: MLVSS Volatile Solids Equation
𝑣𝑜𝑙𝑎𝑡𝑖𝑙𝑒 𝑠𝑜𝑙𝑖𝑑𝑠[𝑚𝑔]
[𝐿]=
(𝐴 − 𝐵) × 1,000
𝐶
𝐴 = 𝑤𝑒𝑖𝑔ℎ𝑡 𝑜𝑓 𝑟𝑒𝑠𝑖𝑑𝑢𝑒 + 𝑓𝑖𝑙𝑡𝑒𝑟 𝑏𝑒𝑓𝑜𝑟𝑒 𝑖𝑔𝑛𝑖𝑡𝑖𝑜𝑛[𝑚𝑔]
𝐵 = 𝑤𝑒𝑖𝑔ℎ𝑡 𝑜𝑓 𝑟𝑒𝑠𝑖𝑑𝑢𝑒 𝑎𝑛𝑑 𝑓𝑖𝑙𝑡𝑒𝑟 𝑎𝑓𝑡𝑒𝑟 𝑖𝑔𝑛𝑖𝑡𝑖𝑜𝑛 [𝑚𝑔]
𝐶 = 𝑠𝑎𝑚𝑝𝑙𝑒 𝑣𝑜𝑙𝑢𝑚𝑒 [𝑚𝐿]
The total suspended solids were tested and recorded for each wastewater sample taken
from UBWPAD. It was assumed that a consistent MLSS would yield a consistent MLVSS,
resulting in little to no change in MLVSS values throughout testing.75 Samples of wastewater
from the UBWPAD were taken weekly to provide consistently fresh water for testing.
Once the MLVSS had been determined the amount of alternative carbon source to be
added to the reactor was calculated using Equation 7.
Equation 7: Determining Amount of Carbon Source to Add to Reactor
𝐹
𝑀=
(𝑉𝑐𝑠 × 𝐶𝑂𝐷)
𝑉𝑀𝐿 × 𝑋
VCS: volume of alternative carbon source added to the test in liters.
COD: the tested Chemical Oxygen Demand of the alternative carbon source in mg/L
VML: volume of the mixed liquor in the test in liters
X: concentration of mixed liquor volatile suspended solids (MLVSS) in test in mg
VSS/L
A substrate to biomass ratio (F/M ratio) must be chosen and experimented with and must
not be unrealistically high or ineffectively low. The determination must be made by trial and error
but for most situations a value between 0.02 and 0.05 mg COD/mg VSS should lead to desirable
results. Therefore, for the reactor tests an F/M ratio of 0.035 mg COD/mg VSS was used for all
samples.
A 2 liter Erlenmeyer beaker was used as the batch reactor with 1.6 liters of wastewater
added inside. Nitrogen gas from a gas tank was added to the beaker from a tube with a sparger at
the end. Enough nitrogen gas was added to stir the wastewater continuously. Parafilm was used to
cover the top of the flask with air holes cut into to release pressure. This is the procedure to set up
the reactor, the short and long test of each sample are explained below.
75 "MLVSS/MLSS Ratio." MLVSS/MLSS Ratio. Wastewaterinfo.com, n.d. Web. 27 Jan. 2016.
<http://waterfacts.net/Treatment/Activated_Sludge/MLVSS-MLSS_Ratio/mlvss-mlss_ratio.html>.
22
To begin the short test a 2.5 mL sample was taken from the reactor for COD analysis.
Additionally, 20 mL was taken for pH and nitrate analysis and temperature was recorded. After
this, the calculated amount of carbon source was added to the reactor and allowed to mix for two
hours. At the end of the two hours the same tests performed in the beginning were performed at
the end.
The long test was set up with the same procedure as the short test. Samples were taken
before adding the carbon source and then every 10 minutes for the first hour and every 30
minutes for the following 2 hours. The analysis for the samples was the same as the short test.
The desired pH was 7-7.5 as it is for wastewater plants to maintain a nearly neutral pH. At the
end of the test, a 50 mL sample was removed from the reactor for MLSS analysis.
The data collected were used to analyze the COD over time and the specific
denitrification rate (SDNR) of the carbon source in the wastewater. COD during the final test was
plotted versus time to observe the changes more easily. Little to no change in COD was desired,
but slight decreases and fluctuations were expected from consumption during denitrification.
Large decreases and fluctuations were undesirable to the wastewater treatment process.
To calculate the denitrification rate, a graph of the nitrate concentration versus time was
made. The graph can produce up to three slopes: the first and steepest representing consumption
of readily biodegradable COD (rbCOD), the second steepest representing consumption of slowly
biodegradable COD (sbCOD), and the last and least steep representing the endogenous decay and
consumption of nitrate by cells. It was assumed the rbCOD would be the applicable data used for
denitrification. The line representing denitrification was determined by taking the linear line of
best fit of the initial decrease in nitrate concentration until the nitrate concentration stabilized or
began to rise again. Taking the slope of the initial decrease allowed a linear relationship to be
applied to the SDNR equation. Equation 8 is used to calculate the SDNR. The value of 1,440
accounts for converting minutes to days. MLVSS was calculated by taking the MLSS of the
wastewater sample and the MLSS at the end of the final reactor test and averaging the two. The
averaged value was then multiplied by 0.8 to estimate the respective MLVSS.76 The more
negative the value of SDNR, the more rapidly denitrification occurred with the carbon source
used.
76 Gu, A. and Hayden, A. (2010). Protocol to Evaluate Alternative External Carbon Sources for Denitrification at Full-Scale
Wastewater Treatment Plants. WERF.
23
Equation 8: SDNR Equation
𝑆𝐷𝑁𝑅 = 1,440 ×
𝑑𝑁1𝑑𝑡𝑋
SDNR= the specific denitrification rate [kgN/kgVSS/d]
dN1/dt= the first slope of the nitrate versus time graph [mg N/L*min]
X= MLVSS concentration during reactor test [mg/L]
24
3.0. Results and Discussion The results from the preliminary and final tests are discussed for each carbon source. For
the preliminary tests, the change in pH, COD, and nitrate concentrations from the beginning and
conclusion of the tests were analyzed. The results from Micro-C preliminary test were used as a
standard to compare with other carbon sources. Carbon sources were selected to undergo final
testing based on their results from the preliminary test. For final testing, multiple samples of
COD, pH, and nitrate concentration were taken throughout the test. With the results of the test,
the SDNR was calculated for each carbon source, based on the data received from the MLVSS
test for each wastewater sample. Sample calculations and raw data for these calculations are
located in Appendix A and B, respectively.
During the preliminary testing of methanol, ethylene glycol, and glycerin, some foaming
occurred in the wastewater. The foam was caused by a low F/M ratio in the aeration basin at
UBWPAD due to insufficient sludge wasting, resulting in excess solids in the tank.77 UBWPAD
said that this may be caused by an increase of RAS in the wastewater. Foam in the wastewater
could possibly cause error in our testing if foam was in our COD, pH, or nitrate samples. If foam
was present in the wastewater, we would carefully take samples out of the batch reactor and make
sure that there was no foam present.
3.1. Results of Procedure Development All reactor tests were originally run in a 2-liter Erlenmeyer flask, on a mixer with a stir
bar, and a nitrogen gas sparger turned on until the wastewater was lightly bubbling. Our results
gave us an increase of nitrogen in some cases where the carbon sources added did not contain any
known compounds that may form nitrates. Based on our initial results, we hypothesized the
kinetic reactor may not be anoxic. To enhance nitrogen removal performance, we changed the
procedure. The new procedure consisted of removing the stir bar and utilizing the nitrogen
sparger to mix the wastewater without developing foam. We covered the reactor with Parafilm to
ensure oxygen was not entering the system. The Parafilm had holes, allowing nitrogen gas to
leave and not build up pressure within the system.
77 Leverage, E. (2015). All wastewater foam is not alike. Retrieved from
http://www.environmentalleverage.com/All_foam_is_not_alike.htm

25
The nitrate levels measured within the reactor were still low. We believe the nitrate levels
were low because the tests were performed in winter and there is little to no fertilizer runoff
entering the plant and bacteria are not as active in colder weather. We used deionized water with
the sodium nitrate to find a standard amount to add to the wastewater before testing. Our goal was
to create wastewater samples with nitrate concentrations between 5-8 ppm. We were unable to
achieve our goal every test because of the variability in the wastewater samples. The final process
consisted of using a nitrate level between 3-6 ppm. The amount of nitrate to add was difficult to
measure accurately and we lost some samples from sharp increases in nitrate concentration
exceeding 8 ppm. The results of the new tests were performed and the data collected was
analyzed in the following sections.
3.2. MLVSS (MLSS) Tests Mixed liquor suspended solid (MLSS) tests were performed on every sample of
wastewater and mixed liquor volatile suspended solids (MLVSS) tests were performed once. We
assumed MLVSS and MLSS would remain proportional by a ratio of 0.80 as proved accurate by
the test we performed. The MLSS averaged 2100 mg/L throughout the preliminary tests
performed. The average MLVSS was 1700 mg/L and this value determined the amount of carbon
source to add throughout preliminary testing. MLSS of all wastewater samples was measured to
ensure there was no significant change to this average and for calculations from final tests. MLSS
was measured at the end of final tests. The average of the final MLSS and the MLSS of the
wastewater sample was multiplied by 0.80 for the approximate MLVSS to determine the specific
denitrification rate.
3.3. Results of Preliminary Tests A COD test was completed for each carbon source. The preliminary COD test results
were utilized to determine the amount of waste sample needed in the kinetic reactor test. Table 4
displays the average COD for each waste sample. The starting and ending nitrate values for each
carbon source were also measured in the preliminary tests, and the percent decreases of nitrate are
also shown in Table 4.
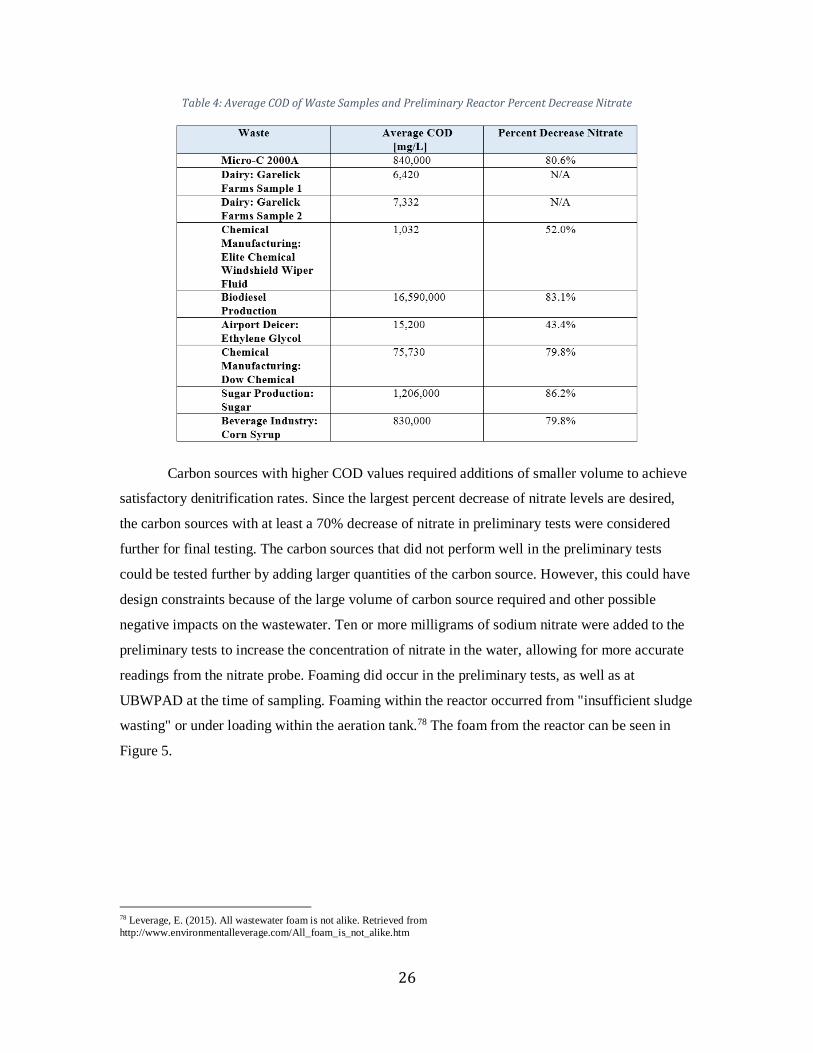
26
Table 4: Average COD of Waste Samples and Preliminary Reactor Percent Decrease Nitrate
Carbon sources with higher COD values required additions of smaller volume to achieve
satisfactory denitrification rates. Since the largest percent decrease of nitrate levels are desired,
the carbon sources with at least a 70% decrease of nitrate in preliminary tests were considered
further for final testing. The carbon sources that did not perform well in the preliminary tests
could be tested further by adding larger quantities of the carbon source. However, this could have
design constraints because of the large volume of carbon source required and other possible
negative impacts on the wastewater. Ten or more milligrams of sodium nitrate were added to the
preliminary tests to increase the concentration of nitrate in the water, allowing for more accurate
readings from the nitrate probe. Foaming did occur in the preliminary tests, as well as at
UBWPAD at the time of sampling. Foaming within the reactor occurred from "insufficient sludge
wasting" or under loading within the aeration tank.78 The foam from the reactor can be seen in
Figure 5.
78 Leverage, E. (2015). All wastewater foam is not alike. Retrieved from
http://www.environmentalleverage.com/All_foam_is_not_alike.htm
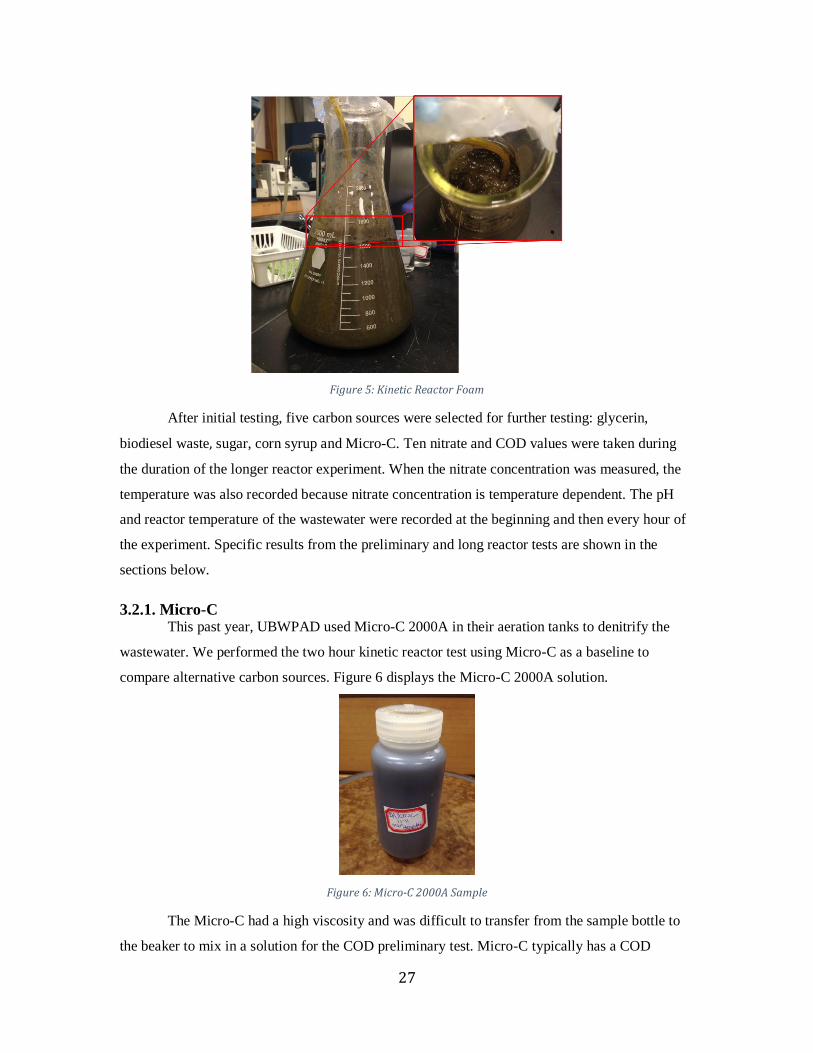
27
Figure 5: Kinetic Reactor Foam
After initial testing, five carbon sources were selected for further testing: glycerin,
biodiesel waste, sugar, corn syrup and Micro-C. Ten nitrate and COD values were taken during
the duration of the longer reactor experiment. When the nitrate concentration was measured, the
temperature was also recorded because nitrate concentration is temperature dependent. The pH
and reactor temperature of the wastewater were recorded at the beginning and then every hour of
the experiment. Specific results from the preliminary and long reactor tests are shown in the
sections below.
3.2.1. Micro-C This past year, UBWPAD used Micro-C 2000A in their aeration tanks to denitrify the
wastewater. We performed the two hour kinetic reactor test using Micro-C as a baseline to
compare alternative carbon sources. Figure 6 displays the Micro-C 2000A solution.
Figure 6: Micro-C 2000A Sample
The Micro-C had a high viscosity and was difficult to transfer from the sample bottle to
the beaker to mix in a solution for the COD preliminary test. Micro-C typically has a COD
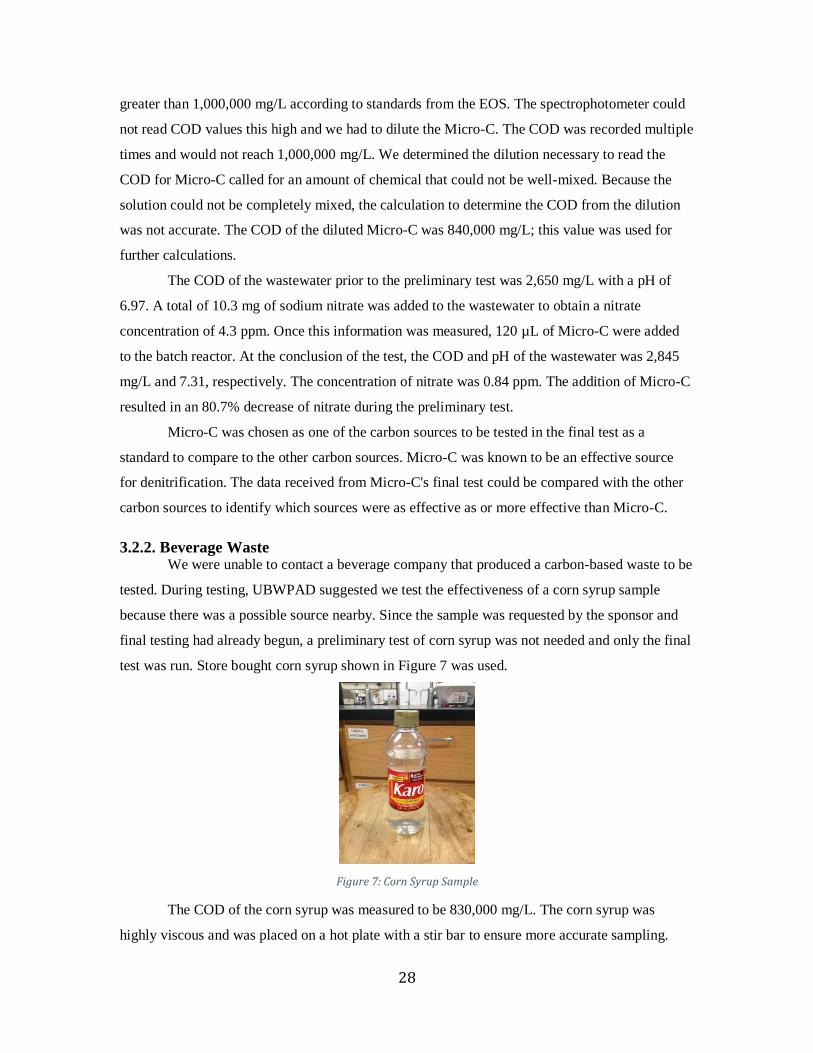
28
greater than 1,000,000 mg/L according to standards from the EOS. The spectrophotometer could
not read COD values this high and we had to dilute the Micro-C. The COD was recorded multiple
times and would not reach 1,000,000 mg/L. We determined the dilution necessary to read the
COD for Micro-C called for an amount of chemical that could not be well-mixed. Because the
solution could not be completely mixed, the calculation to determine the COD from the dilution
was not accurate. The COD of the diluted Micro-C was 840,000 mg/L; this value was used for
further calculations.
The COD of the wastewater prior to the preliminary test was 2,650 mg/L with a pH of
6.97. A total of 10.3 mg of sodium nitrate was added to the wastewater to obtain a nitrate
concentration of 4.3 ppm. Once this information was measured, 120 µL of Micro-C were added
to the batch reactor. At the conclusion of the test, the COD and pH of the wastewater was 2,845
mg/L and 7.31, respectively. The concentration of nitrate was 0.84 ppm. The addition of Micro-C
resulted in an 80.7% decrease of nitrate during the preliminary test.
Micro-C was chosen as one of the carbon sources to be tested in the final test as a
standard to compare to the other carbon sources. Micro-C was known to be an effective source
for denitrification. The data received from Micro-C's final test could be compared with the other
carbon sources to identify which sources were as effective as or more effective than Micro-C.
3.2.2. Beverage Waste We were unable to contact a beverage company that produced a carbon-based waste to be
tested. During testing, UBWPAD suggested we test the effectiveness of a corn syrup sample
because there was a possible source nearby. Since the sample was requested by the sponsor and
final testing had already begun, a preliminary test of corn syrup was not needed and only the final
test was run. Store bought corn syrup shown in Figure 7 was used.
Figure 7: Corn Syrup Sample
The COD of the corn syrup was measured to be 830,000 mg/L. The corn syrup was
highly viscous and was placed on a hot plate with a stir bar to ensure more accurate sampling.
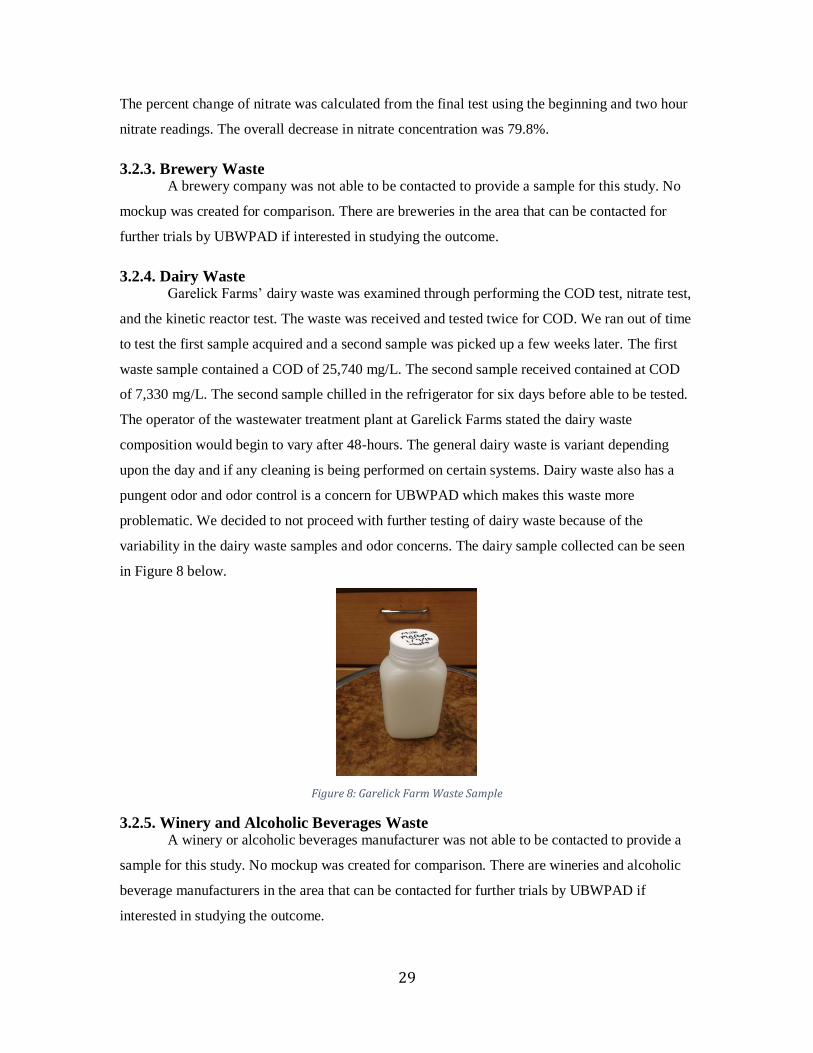
29
The percent change of nitrate was calculated from the final test using the beginning and two hour
nitrate readings. The overall decrease in nitrate concentration was 79.8%.
3.2.3. Brewery Waste A brewery company was not able to be contacted to provide a sample for this study. No
mockup was created for comparison. There are breweries in the area that can be contacted for
further trials by UBWPAD if interested in studying the outcome.
3.2.4. Dairy Waste Garelick Farms’ dairy waste was examined through performing the COD test, nitrate test,
and the kinetic reactor test. The waste was received and tested twice for COD. We ran out of time
to test the first sample acquired and a second sample was picked up a few weeks later. The first
waste sample contained a COD of 25,740 mg/L. The second sample received contained at COD
of 7,330 mg/L. The second sample chilled in the refrigerator for six days before able to be tested.
The operator of the wastewater treatment plant at Garelick Farms stated the dairy waste
composition would begin to vary after 48-hours. The general dairy waste is variant depending
upon the day and if any cleaning is being performed on certain systems. Dairy waste also has a
pungent odor and odor control is a concern for UBWPAD which makes this waste more
problematic. We decided to not proceed with further testing of dairy waste because of the
variability in the dairy waste samples and odor concerns. The dairy sample collected can be seen
in Figure 8 below.
Figure 8: Garelick Farm Waste Sample
3.2.5. Winery and Alcoholic Beverages Waste A winery or alcoholic beverages manufacturer was not able to be contacted to provide a
sample for this study. No mockup was created for comparison. There are wineries and alcoholic
beverage manufacturers in the area that can be contacted for further trials by UBWPAD if
interested in studying the outcome.
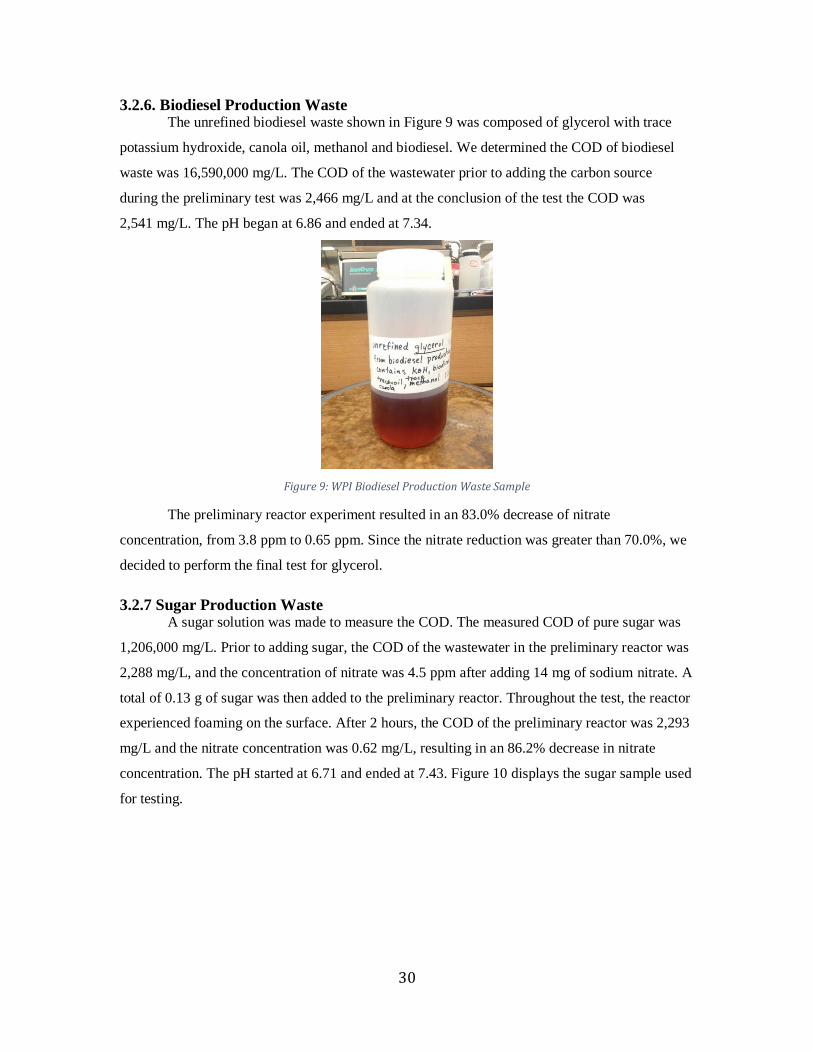
30
3.2.6. Biodiesel Production Waste The unrefined biodiesel waste shown in Figure 9 was composed of glycerol with trace
potassium hydroxide, canola oil, methanol and biodiesel. We determined the COD of biodiesel
waste was 16,590,000 mg/L. The COD of the wastewater prior to adding the carbon source
during the preliminary test was 2,466 mg/L and at the conclusion of the test the COD was
2,541 mg/L. The pH began at 6.86 and ended at 7.34.
Figure 9: WPI Biodiesel Production Waste Sample
The preliminary reactor experiment resulted in an 83.0% decrease of nitrate
concentration, from 3.8 ppm to 0.65 ppm. Since the nitrate reduction was greater than 70.0%, we
decided to perform the final test for glycerol.
3.2.7 Sugar Production Waste A sugar solution was made to measure the COD. The measured COD of pure sugar was
1,206,000 mg/L. Prior to adding sugar, the COD of the wastewater in the preliminary reactor was
2,288 mg/L, and the concentration of nitrate was 4.5 ppm after adding 14 mg of sodium nitrate. A
total of 0.13 g of sugar was then added to the preliminary reactor. Throughout the test, the reactor
experienced foaming on the surface. After 2 hours, the COD of the preliminary reactor was 2,293
mg/L and the nitrate concentration was 0.62 mg/L, resulting in an 86.2% decrease in nitrate
concentration. The pH started at 6.71 and ended at 7.43. Figure 10 displays the sugar sample used
for testing.
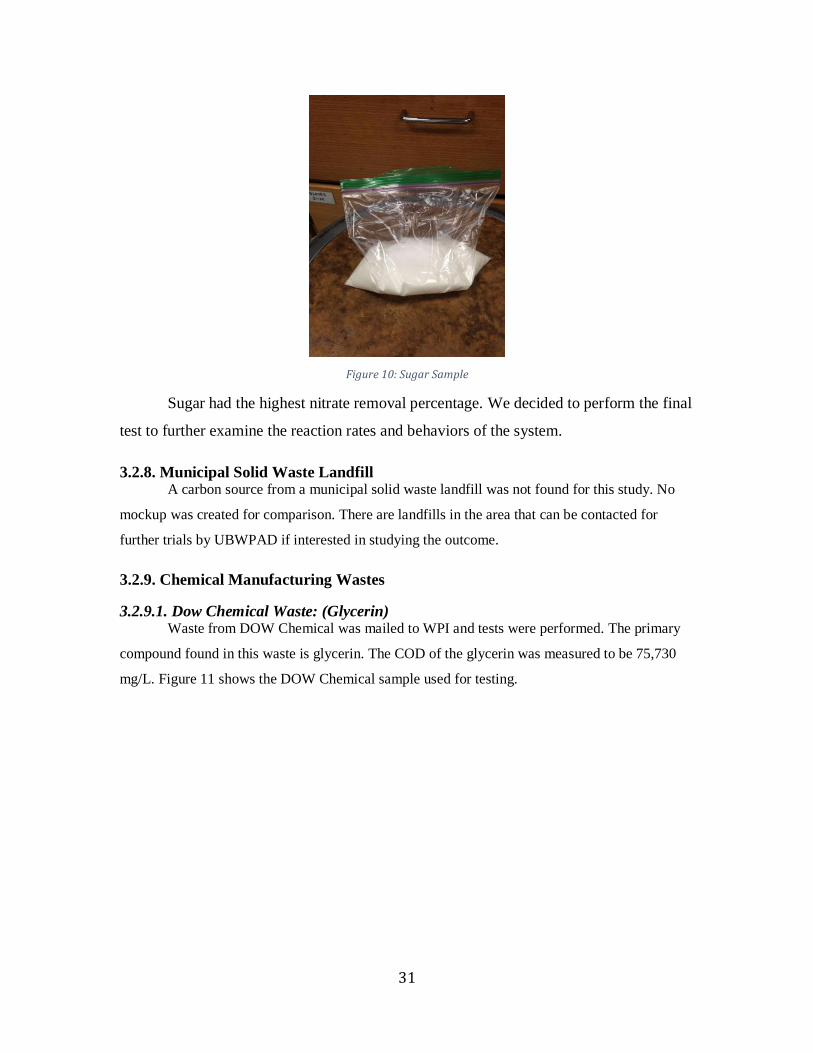
31
Figure 10: Sugar Sample
Sugar had the highest nitrate removal percentage. We decided to perform the final
test to further examine the reaction rates and behaviors of the system.
3.2.8. Municipal Solid Waste Landfill A carbon source from a municipal solid waste landfill was not found for this study. No
mockup was created for comparison. There are landfills in the area that can be contacted for
further trials by UBWPAD if interested in studying the outcome.
3.2.9. Chemical Manufacturing Wastes
3.2.9.1. Dow Chemical Waste: (Glycerin) Waste from DOW Chemical was mailed to WPI and tests were performed. The primary
compound found in this waste is glycerin. The COD of the glycerin was measured to be 75,730
mg/L. Figure 11 shows the DOW Chemical sample used for testing.
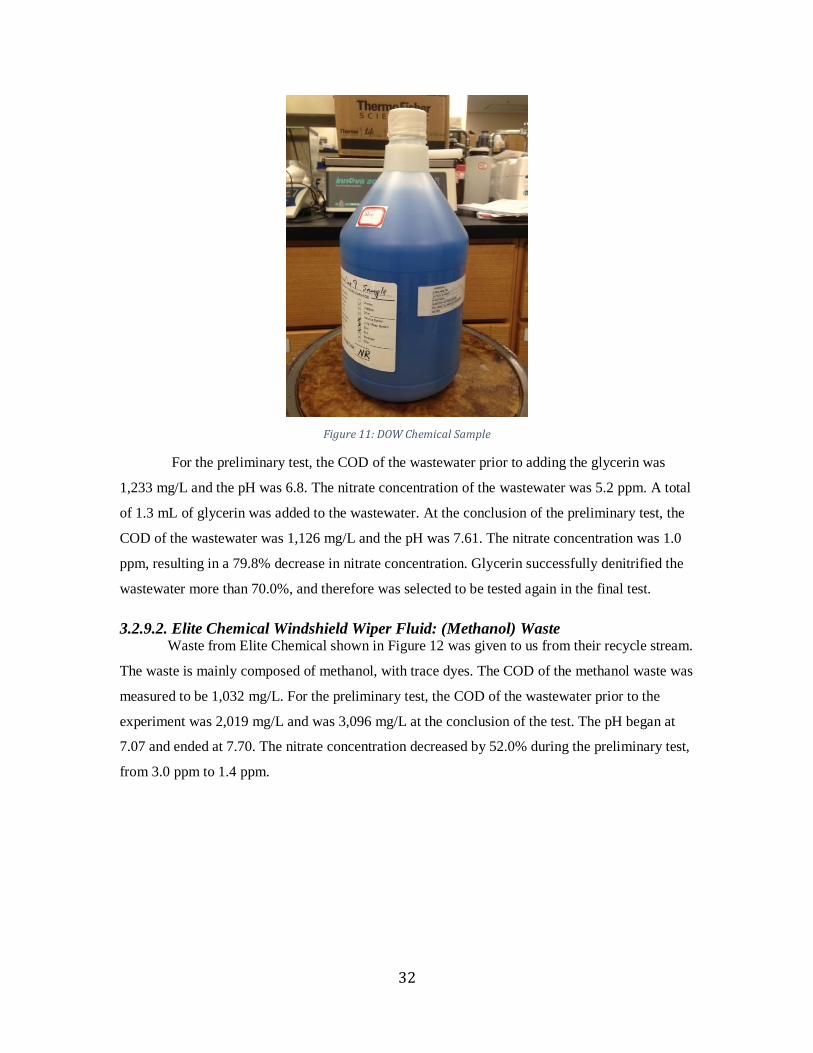
32
Figure 11: DOW Chemical Sample
For the preliminary test, the COD of the wastewater prior to adding the glycerin was
1,233 mg/L and the pH was 6.8. The nitrate concentration of the wastewater was 5.2 ppm. A total
of 1.3 mL of glycerin was added to the wastewater. At the conclusion of the preliminary test, the
COD of the wastewater was 1,126 mg/L and the pH was 7.61. The nitrate concentration was 1.0
ppm, resulting in a 79.8% decrease in nitrate concentration. Glycerin successfully denitrified the
wastewater more than 70.0%, and therefore was selected to be tested again in the final test.
3.2.9.2. Elite Chemical Windshield Wiper Fluid: (Methanol) Waste Waste from Elite Chemical shown in Figure 12 was given to us from their recycle stream.
The waste is mainly composed of methanol, with trace dyes. The COD of the methanol waste was
measured to be 1,032 mg/L. For the preliminary test, the COD of the wastewater prior to the
experiment was 2,019 mg/L and was 3,096 mg/L at the conclusion of the test. The pH began at
7.07 and ended at 7.70. The nitrate concentration decreased by 52.0% during the preliminary test,
from 3.0 ppm to 1.4 ppm.
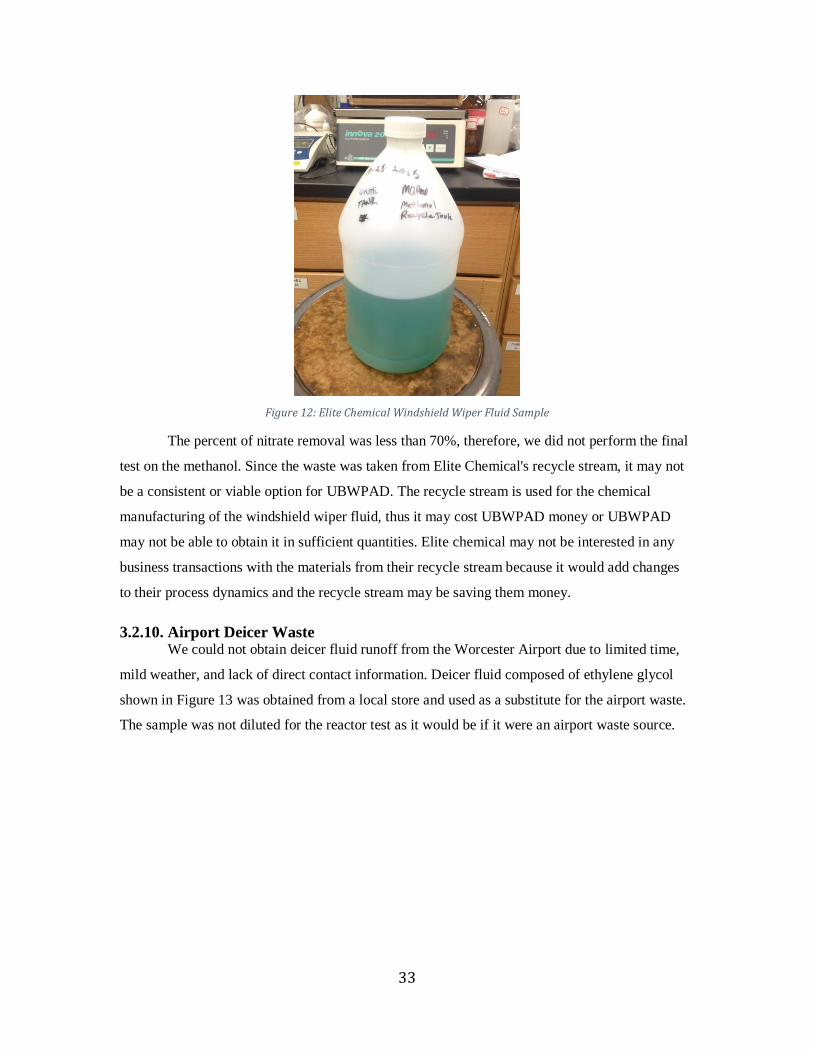
33
Figure 12: Elite Chemical Windshield Wiper Fluid Sample
The percent of nitrate removal was less than 70%, therefore, we did not perform the final
test on the methanol. Since the waste was taken from Elite Chemical's recycle stream, it may not
be a consistent or viable option for UBWPAD. The recycle stream is used for the chemical
manufacturing of the windshield wiper fluid, thus it may cost UBWPAD money or UBWPAD
may not be able to obtain it in sufficient quantities. Elite chemical may not be interested in any
business transactions with the materials from their recycle stream because it would add changes
to their process dynamics and the recycle stream may be saving them money.
3.2.10. Airport Deicer Waste We could not obtain deicer fluid runoff from the Worcester Airport due to limited time,
mild weather, and lack of direct contact information. Deicer fluid composed of ethylene glycol
shown in Figure 13 was obtained from a local store and used as a substitute for the airport waste.
The sample was not diluted for the reactor test as it would be if it were an airport waste source.
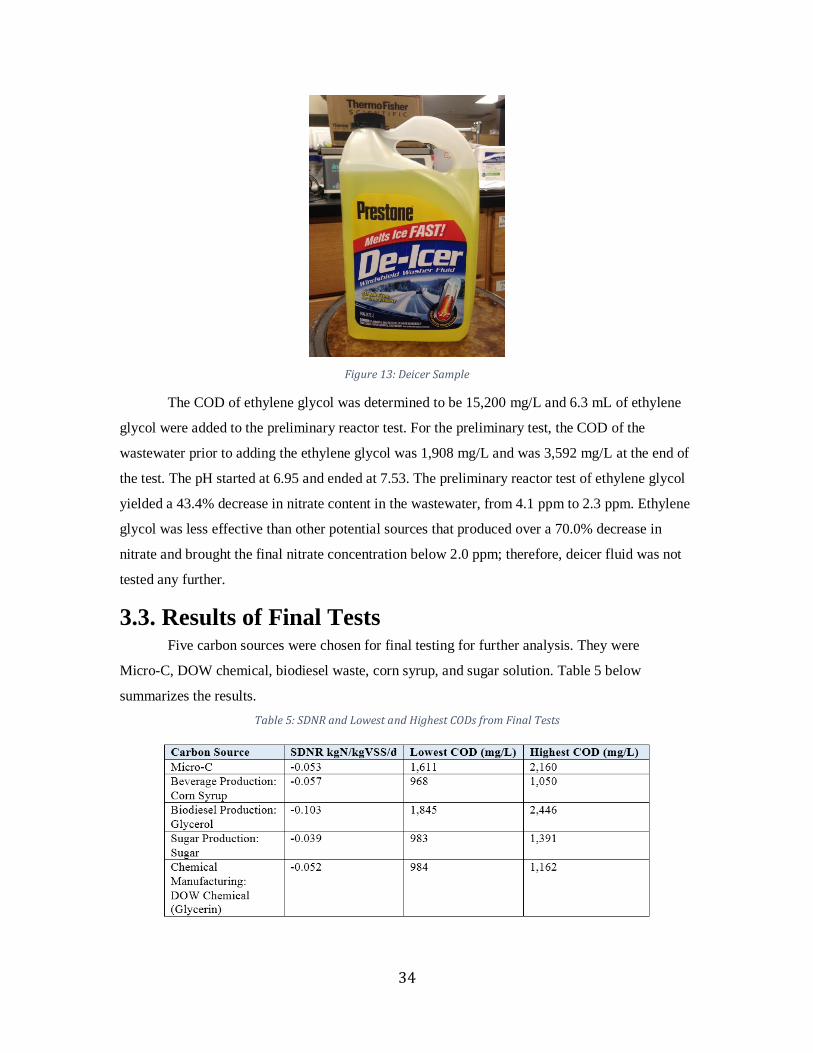
34
Figure 13: Deicer Sample
The COD of ethylene glycol was determined to be 15,200 mg/L and 6.3 mL of ethylene
glycol were added to the preliminary reactor test. For the preliminary test, the COD of the
wastewater prior to adding the ethylene glycol was 1,908 mg/L and was 3,592 mg/L at the end of
the test. The pH started at 6.95 and ended at 7.53. The preliminary reactor test of ethylene glycol
yielded a 43.4% decrease in nitrate content in the wastewater, from 4.1 ppm to 2.3 ppm. Ethylene
glycol was less effective than other potential sources that produced over a 70.0% decrease in
nitrate and brought the final nitrate concentration below 2.0 ppm; therefore, deicer fluid was not
tested any further.
3.3. Results of Final Tests Five carbon sources were chosen for final testing for further analysis. They were
Micro-C, DOW chemical, biodiesel waste, corn syrup, and sugar solution. Table 5 below
summarizes the results.
Table 5: SDNR and Lowest and Highest CODs from Final Tests

35
Sugar had the slowest denitrifying rate, followed by glycerin, Micro-C, and corn syrup as
seen in the SDNR comparison. Biodiesel waste had the fastest denitrification rate of
-0.103 kgN/kgVSS/d. The graphs showing the nitrate concentration over time are presented in the
following sections. SDNR was determined using the linear line of best fit of the initial decrease in
nitrate concentration until the nitrate concentration stabilized or began to rise again. This linear
line represented the consumption of rbCOD for denitrification and allowed a linear interpretation
to be applied to the SDNR equation.
Large fluctuations or decreases in COD are undesirable in wastewater treatment. As seen
in Table 5, all of the COD ranges do not change more than 650 mg/L. The fluctuation in COD
throughout the reaction time would not create any significant issues overall. UBWPAD would
need to determine whether or not these variations in COD would affect their system overall. The
COD data is presented and discussed more in depth below.
3.3.1. Micro-C The final three-hour test was performed with Micro-C to compare with the performance
of the other carbon sources. Figure 14 shows the nitrate concentrations during the final test of
Micro-C.
Figure 14: Micro-C Reactor Test Results
The concentration of nitrate starts at 3.97 ppm and the end of the three-hour test the
concentration of nitrates decreased to 1.2 ppm. The nitrate concentration is lowest after two
hours, where it is 0.70 ppm. The first line depicts the readily biodegradable COD being
consumed. The denitrification rate for Micro-C was determined to be –0.053 kgN/kgVSS/d from
y = 0.0031x + 0.6769R² = 0.2643
y = -0.0543x + 3.2154R² = 0.8096
0
0.5
1
1.5
2
2.5
3
3.5
4
4.5
0 50 100 150 200
Nit
rate
as N
[p
pm
]
Time [min]
Micro-CReactionPart 2
Micro-CReactionPart 1
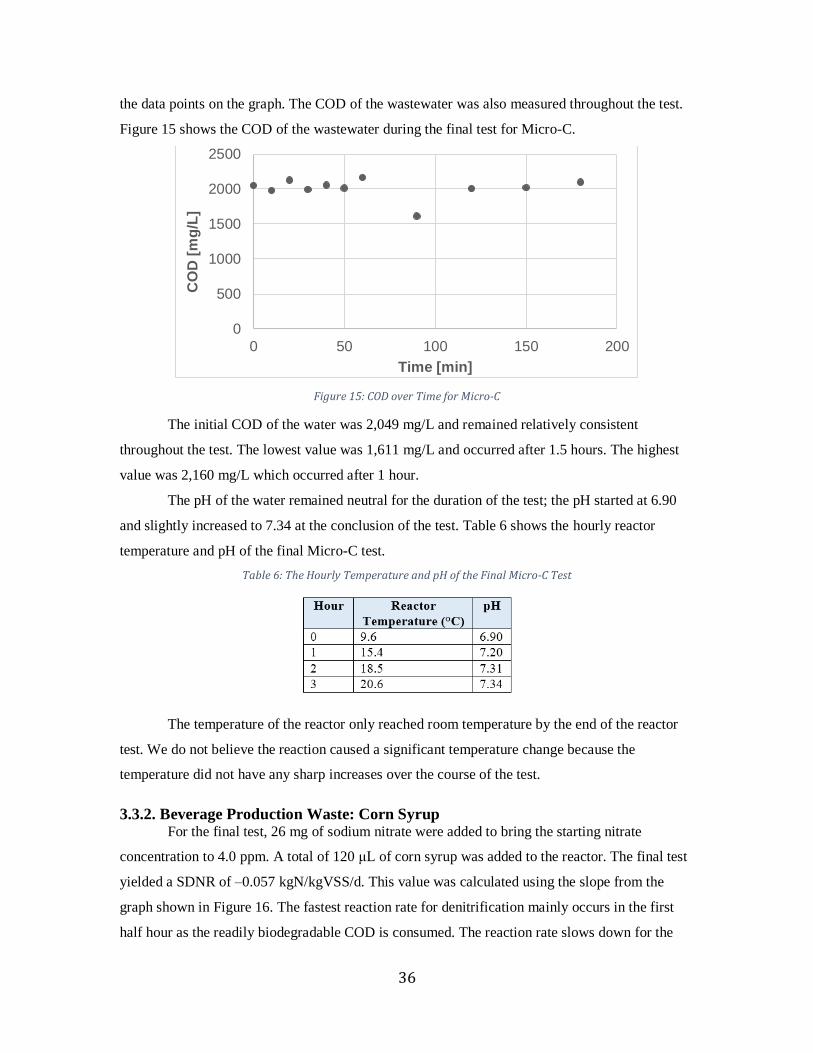
36
the data points on the graph. The COD of the wastewater was also measured throughout the test.
Figure 15 shows the COD of the wastewater during the final test for Micro-C.
Figure 15: COD over Time for Micro-C
The initial COD of the water was 2,049 mg/L and remained relatively consistent
throughout the test. The lowest value was 1,611 mg/L and occurred after 1.5 hours. The highest
value was 2,160 mg/L which occurred after 1 hour.
The pH of the water remained neutral for the duration of the test; the pH started at 6.90
and slightly increased to 7.34 at the conclusion of the test. Table 6 shows the hourly reactor
temperature and pH of the final Micro-C test.
Table 6: The Hourly Temperature and pH of the Final Micro-C Test
The temperature of the reactor only reached room temperature by the end of the reactor
test. We do not believe the reaction caused a significant temperature change because the
temperature did not have any sharp increases over the course of the test.
3.3.2. Beverage Production Waste: Corn Syrup For the final test, 26 mg of sodium nitrate were added to bring the starting nitrate
concentration to 4.0 ppm. A total of 120 μL of corn syrup was added to the reactor. The final test
yielded a SDNR of –0.057 kgN/kgVSS/d. This value was calculated using the slope from the
graph shown in Figure 16. The fastest reaction rate for denitrification mainly occurs in the first
half hour as the readily biodegradable COD is consumed. The reaction rate slows down for the
0
500
1000
1500
2000
2500
0 50 100 150 200
CO
D [
mg
/L]
Time [min]
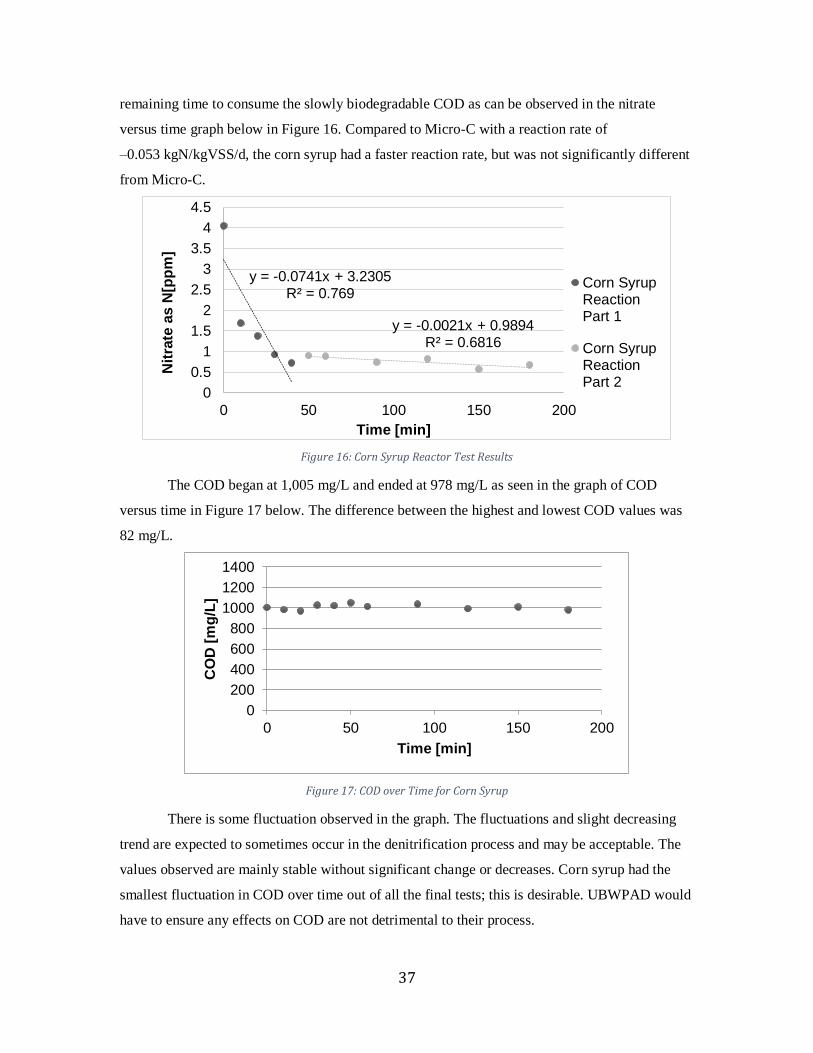
37
remaining time to consume the slowly biodegradable COD as can be observed in the nitrate
versus time graph below in Figure 16. Compared to Micro-C with a reaction rate of
–0.053 kgN/kgVSS/d, the corn syrup had a faster reaction rate, but was not significantly different
from Micro-C.
Figure 16: Corn Syrup Reactor Test Results
The COD began at 1,005 mg/L and ended at 978 mg/L as seen in the graph of COD
versus time in Figure 17 below. The difference between the highest and lowest COD values was
82 mg/L.
Figure 17: COD over Time for Corn Syrup
There is some fluctuation observed in the graph. The fluctuations and slight decreasing
trend are expected to sometimes occur in the denitrification process and may be acceptable. The
values observed are mainly stable without significant change or decreases. Corn syrup had the
smallest fluctuation in COD over time out of all the final tests; this is desirable. UBWPAD would
have to ensure any effects on COD are not detrimental to their process.
y = -0.0741x + 3.2305R² = 0.769
y = -0.0021x + 0.9894R² = 0.6816
0
0.5
1
1.5
2
2.5
3
3.5
4
4.5
0 50 100 150 200
Nit
rate
as N
[pp
m]
Time [min]
Corn SyrupReactionPart 1
Corn SyrupReactionPart 2
0
200
400
600
800
1000
1200
1400
0 50 100 150 200
CO
D [
mg
/L]
Time [min]
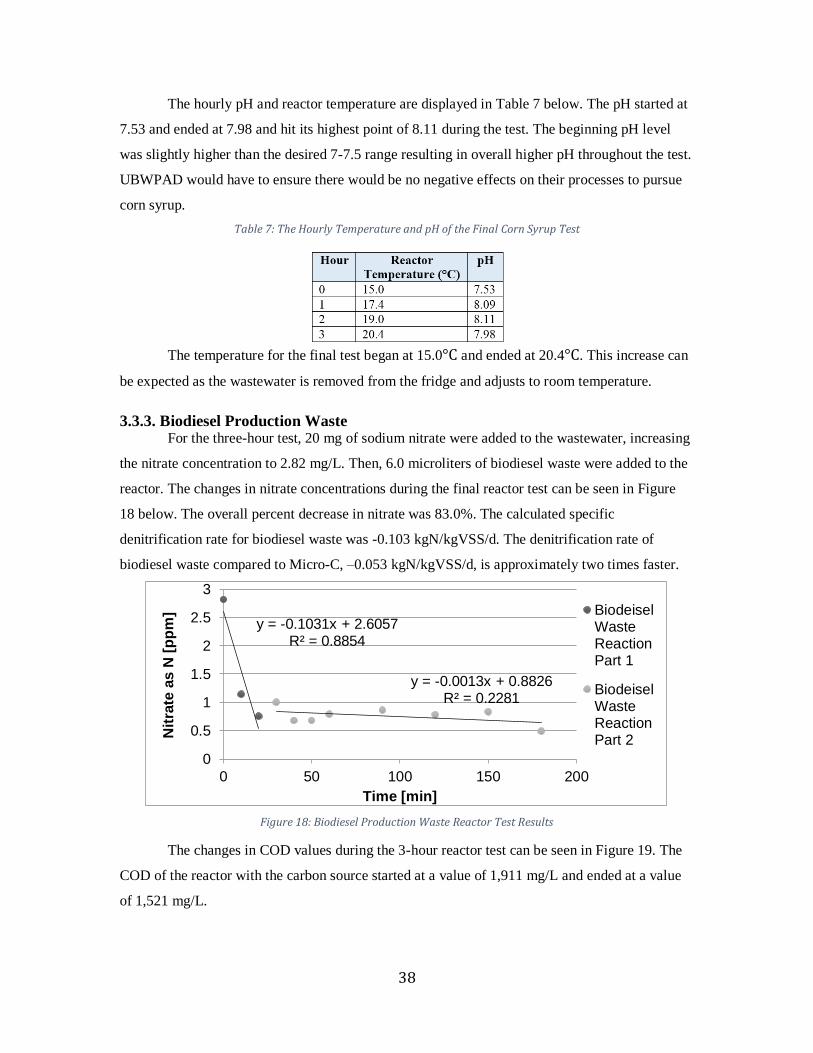
38
The hourly pH and reactor temperature are displayed in Table 7 below. The pH started at
7.53 and ended at 7.98 and hit its highest point of 8.11 during the test. The beginning pH level
was slightly higher than the desired 7-7.5 range resulting in overall higher pH throughout the test.
UBWPAD would have to ensure there would be no negative effects on their processes to pursue
corn syrup.
Table 7: The Hourly Temperature and pH of the Final Corn Syrup Test
The temperature for the final test began at 15.0°C and ended at 20.4°C. This increase can
be expected as the wastewater is removed from the fridge and adjusts to room temperature.
3.3.3. Biodiesel Production Waste For the three-hour test, 20 mg of sodium nitrate were added to the wastewater, increasing
the nitrate concentration to 2.82 mg/L. Then, 6.0 microliters of biodiesel waste were added to the
reactor. The changes in nitrate concentrations during the final reactor test can be seen in Figure
18 below. The overall percent decrease in nitrate was 83.0%. The calculated specific
denitrification rate for biodiesel waste was -0.103 kgN/kgVSS/d. The denitrification rate of
biodiesel waste compared to Micro-C, –0.053 kgN/kgVSS/d, is approximately two times faster.
Figure 18: Biodiesel Production Waste Reactor Test Results
The changes in COD values during the 3-hour reactor test can be seen in Figure 19. The
COD of the reactor with the carbon source started at a value of 1,911 mg/L and ended at a value
of 1,521 mg/L.
y = -0.1031x + 2.6057R² = 0.8854
y = -0.0013x + 0.8826R² = 0.2281
0
0.5
1
1.5
2
2.5
3
0 50 100 150 200
Nit
rate
as N
[p
pm
]
Time [min]
BiodeiselWasteReactionPart 1
BiodeiselWasteReactionPart 2
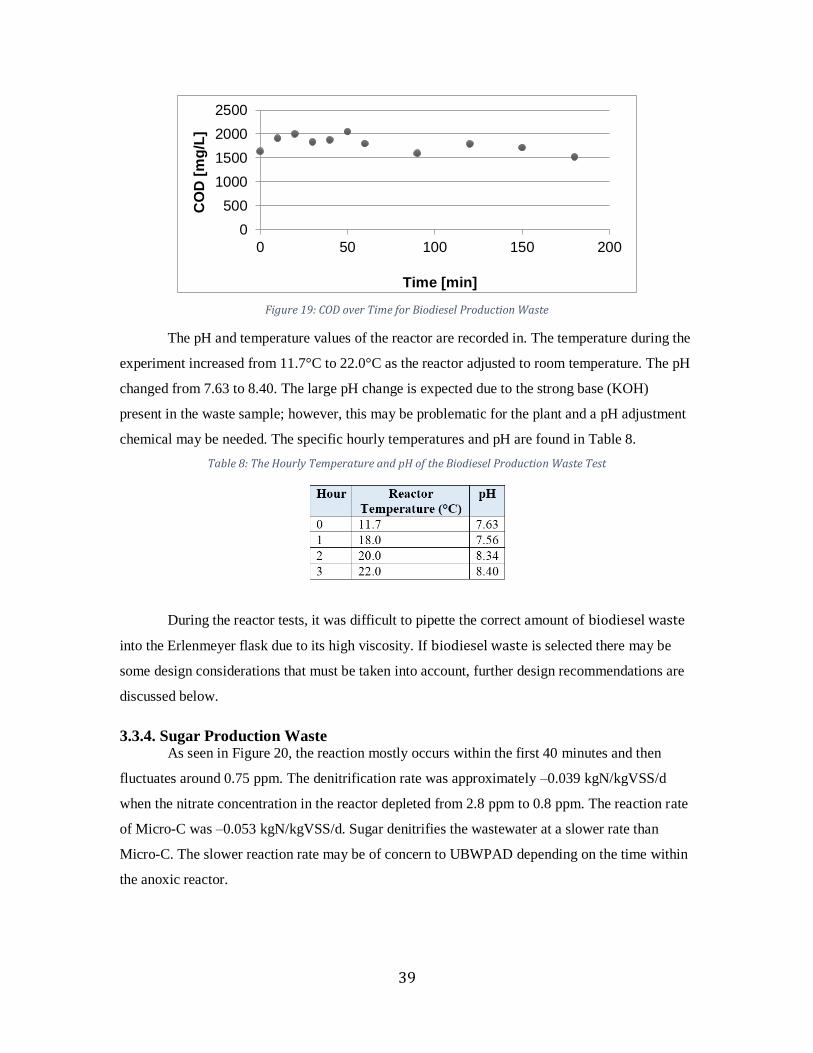
39
Figure 19: COD over Time for Biodiesel Production Waste
The pH and temperature values of the reactor are recorded in. The temperature during the
experiment increased from 11.7°C to 22.0°C as the reactor adjusted to room temperature. The pH
changed from 7.63 to 8.40. The large pH change is expected due to the strong base (KOH)
present in the waste sample; however, this may be problematic for the plant and a pH adjustment
chemical may be needed. The specific hourly temperatures and pH are found in Table 8.
Table 8: The Hourly Temperature and pH of the Biodiesel Production Waste Test
During the reactor tests, it was difficult to pipette the correct amount of biodiesel waste
into the Erlenmeyer flask due to its high viscosity. If biodiesel waste is selected there may be
some design considerations that must be taken into account, further design recommendations are
discussed below.
3.3.4. Sugar Production Waste As seen in Figure 20, the reaction mostly occurs within the first 40 minutes and then
fluctuates around 0.75 ppm. The denitrification rate was approximately –0.039 kgN/kgVSS/d
when the nitrate concentration in the reactor depleted from 2.8 ppm to 0.8 ppm. The reaction rate
of Micro-C was –0.053 kgN/kgVSS/d. Sugar denitrifies the wastewater at a slower rate than
Micro-C. The slower reaction rate may be of concern to UBWPAD depending on the time within
the anoxic reactor.
0
500
1000
1500
2000
2500
0 50 100 150 200
CO
D [
mg
/L]
Time [min]

40
Figure 20: Sugar Waste Reactor Test Results
The COD stayed within a range between 980.0-1020 mg/L as seen in Figure 21.
Figure 21: COD over Time for Sugar Waste
The pH and temperature of the reactor were examined. The temperature changed from
15.2°C to 22.0°C throughout the test. The change occurred because the wastewater was taken out
of the refrigerator and reached room temperature as time moved on. The pH increased by 0.54.
UBWPAD will need to examine the changes in both the temperature and pH to see if the reaction
could be problematic for the plant. Table 9 contains the data collected for the change in reactor
temperature and pH.
Table 9: The Hourly Temperature and pH of the Sugar Test
y = -0.0424x + 2.1936R² = 0.6634
y = -0.0003x + 0.6814R² = 0.0278
0
0.5
1
1.5
2
2.5
3
0 50 100 150 200
Nit
rate
as N
[p
pm
]
Time [min]
SugarReactionPart 1
SugarReactionPart 2
0
500
1000
1500
0 50 100 150 200
CO
D [
mg
/L]
Time [min]
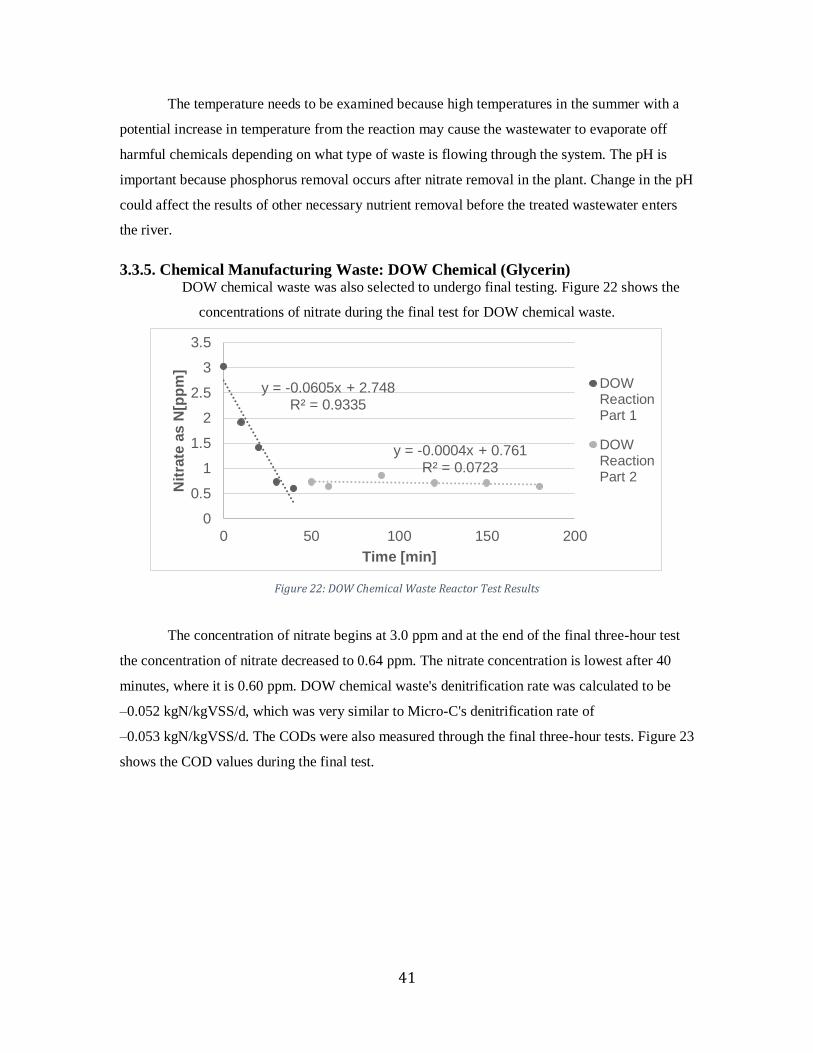
41
The temperature needs to be examined because high temperatures in the summer with a
potential increase in temperature from the reaction may cause the wastewater to evaporate off
harmful chemicals depending on what type of waste is flowing through the system. The pH is
important because phosphorus removal occurs after nitrate removal in the plant. Change in the pH
could affect the results of other necessary nutrient removal before the treated wastewater enters
the river.
3.3.5. Chemical Manufacturing Waste: DOW Chemical (Glycerin) DOW chemical waste was also selected to undergo final testing. Figure 22 shows the
concentrations of nitrate during the final test for DOW chemical waste.
Figure 22: DOW Chemical Waste Reactor Test Results
The concentration of nitrate begins at 3.0 ppm and at the end of the final three-hour test
the concentration of nitrate decreased to 0.64 ppm. The nitrate concentration is lowest after 40
minutes, where it is 0.60 ppm. DOW chemical waste's denitrification rate was calculated to be
–0.052 kgN/kgVSS/d, which was very similar to Micro-C's denitrification rate of
–0.053 kgN/kgVSS/d. The CODs were also measured through the final three-hour tests. Figure 23
shows the COD values during the final test.
y = -0.0605x + 2.748R² = 0.9335
y = -0.0004x + 0.761R² = 0.0723
0
0.5
1
1.5
2
2.5
3
3.5
0 50 100 150 200
Nit
rate
as N
[pp
m]
Time [min]
DOWReactionPart 1
DOWReactionPart 2
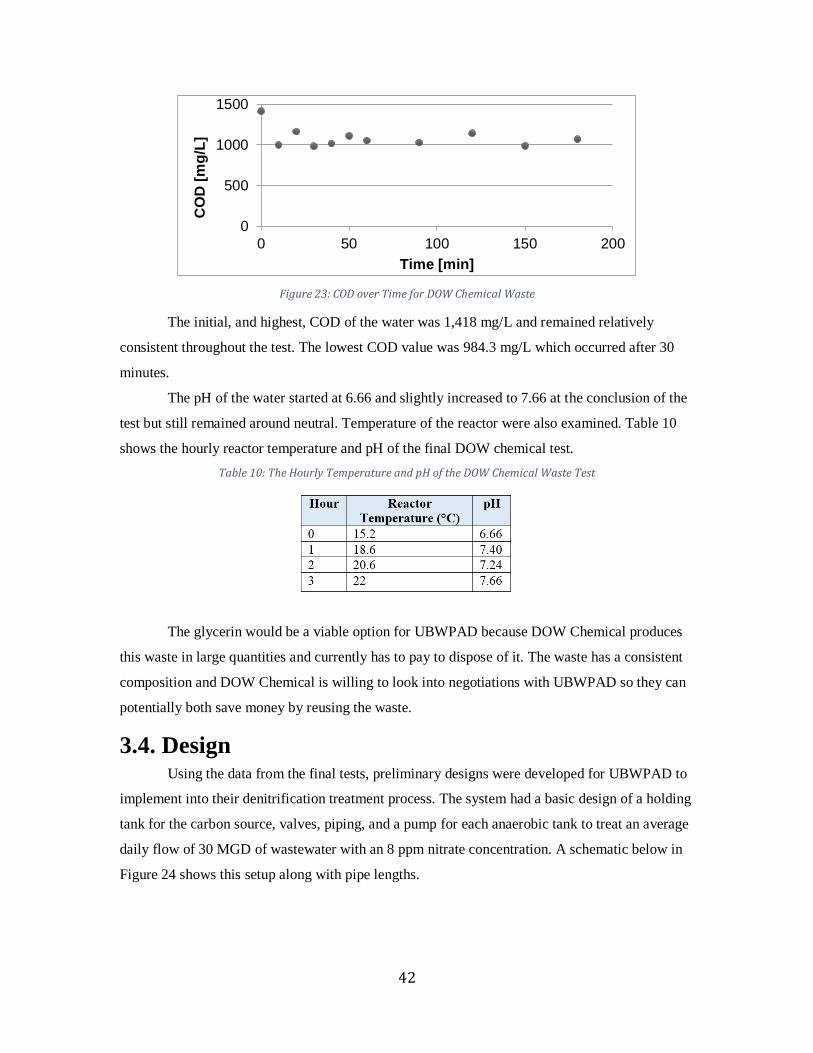
42
Figure 23: COD over Time for DOW Chemical Waste
The initial, and highest, COD of the water was 1,418 mg/L and remained relatively
consistent throughout the test. The lowest COD value was 984.3 mg/L which occurred after 30
minutes.
The pH of the water started at 6.66 and slightly increased to 7.66 at the conclusion of the
test but still remained around neutral. Temperature of the reactor were also examined. Table 10
shows the hourly reactor temperature and pH of the final DOW chemical test.
Table 10: The Hourly Temperature and pH of the DOW Chemical Waste Test
The glycerin would be a viable option for UBWPAD because DOW Chemical produces
this waste in large quantities and currently has to pay to dispose of it. The waste has a consistent
composition and DOW Chemical is willing to look into negotiations with UBWPAD so they can
potentially both save money by reusing the waste.
3.4. Design
Using the data from the final tests, preliminary designs were developed for UBWPAD to
implement into their denitrification treatment process. The system had a basic design of a holding
tank for the carbon source, valves, piping, and a pump for each anaerobic tank to treat an average
daily flow of 30 MGD of wastewater with an 8 ppm nitrate concentration. A schematic below in
Figure 24 shows this setup along with pipe lengths.
0
500
1000
1500
0 50 100 150 200
CO
D [
mg
/L]
Time [min]
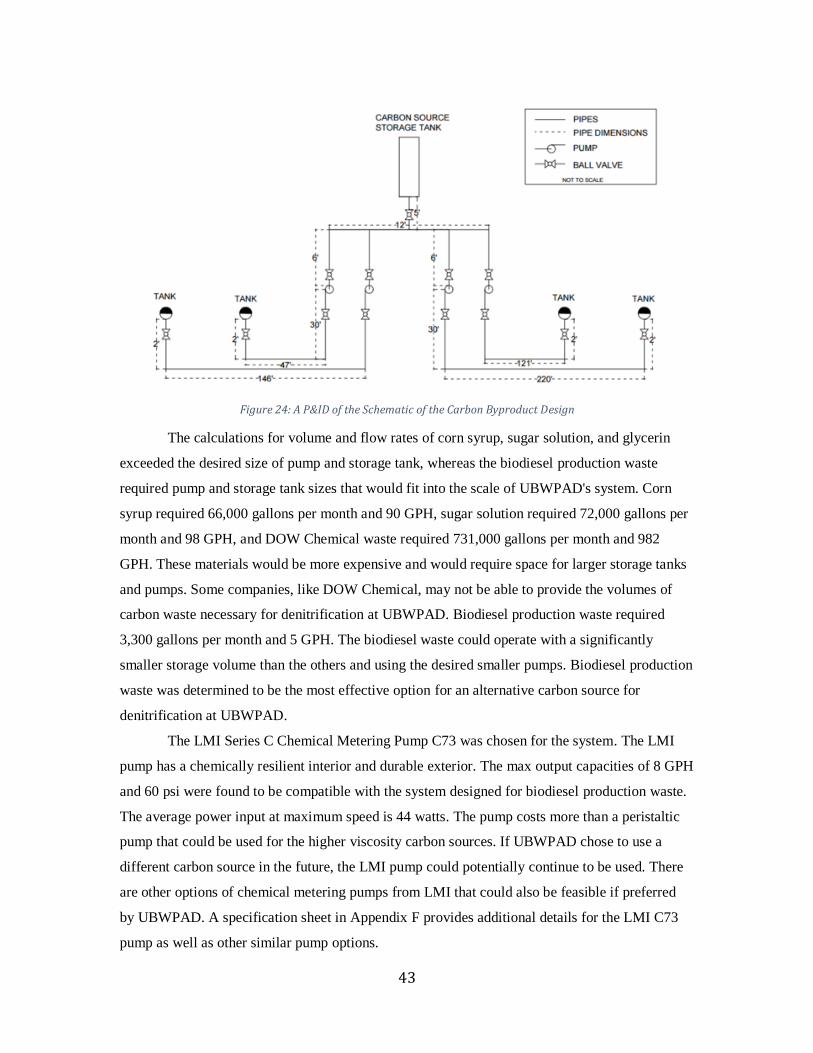
43
Figure 24: A P&ID of the Schematic of the Carbon Byproduct Design
The calculations for volume and flow rates of corn syrup, sugar solution, and glycerin
exceeded the desired size of pump and storage tank, whereas the biodiesel production waste
required pump and storage tank sizes that would fit into the scale of UBWPAD's system. Corn
syrup required 66,000 gallons per month and 90 GPH, sugar solution required 72,000 gallons per
month and 98 GPH, and DOW Chemical waste required 731,000 gallons per month and 982
GPH. These materials would be more expensive and would require space for larger storage tanks
and pumps. Some companies, like DOW Chemical, may not be able to provide the volumes of
carbon waste necessary for denitrification at UBWPAD. Biodiesel production waste required
3,300 gallons per month and 5 GPH. The biodiesel waste could operate with a significantly
smaller storage volume than the others and using the desired smaller pumps. Biodiesel production
waste was determined to be the most effective option for an alternative carbon source for
denitrification at UBWPAD.
The LMI Series C Chemical Metering Pump C73 was chosen for the system. The LMI
pump has a chemically resilient interior and durable exterior. The max output capacities of 8 GPH
and 60 psi were found to be compatible with the system designed for biodiesel production waste.
The average power input at maximum speed is 44 watts. The pump costs more than a peristaltic
pump that could be used for the higher viscosity carbon sources. If UBWPAD chose to use a
different carbon source in the future, the LMI pump could potentially continue to be used. There
are other options of chemical metering pumps from LMI that could also be feasible if preferred
by UBWPAD. A specification sheet in Appendix F provides additional details for the LMI C73
pump as well as other similar pump options.

44
We selected chlorinated polyvinyl chloride (CPVC) to be used for all piping. CPVC was
selected because it will not be affected by interaction with the solutions. Schedule 40 pipe was
chosen because a higher schedule wall thickness was not needed. The pipes sizes were
determined from the required flowrate and allowable pressure drop in the system. One pipe flows
from the chemical storage tank to a splitter. The system then tees into four pipelines, each
entering a LMI Series C Chemical Metering Pump C73, and exiting out to one of the four
anaerobic tanks. The flow will discharge from each pump and the pipes will run at a ten feet
increase in elevation above the walkway area and then drop back down twelve feet to the
denitrification tanks. Each pipe discharges to the middle of each denitrification tank and
discharges two feet into the tank, above the wastewater surface level. The pipes discharged above
the wastewater to avoid any complications with clogging or interference and keep a steady
injection flow. The total piping needed was 735 feet, the dimensions of the system can be
observed in Figure 24.
Pipe diameter was determined to be one half inch for all piping throughout the system for
biodiesel production waste at a velocity of 3 meters per minute. The pressure drop over the entire
pipe length from friction loss was estimated to be 0.17 feet using the Hazen-Williams equation.
According to CPVC pipe manufacturer Georg Fischer Harvel, this is the most commonly used
method and 150 is a widely accepted constant value for the internal pipe roughness of CPVC
pipes. Static head for the pump to overcome was estimated to be 10 feet.
UBWPAD currently has one 2,000-3,000 gallon tank and two 200-300 gallon tanks. Both
are made of plastic and the smaller are encased in metal. This is more than adequate storage for
the 750 gallons of biodiesel waste needed per week. We decided a new vessel for the design was
not necessary.
Ball valves are used throughout the system. In total, eight ball valves were placed before
and after each pump, to shut off if unneeded and potentially replace when necessary. One ball
valve was placed before entering each of the four anaerobic tanks. One additional ball valve was
placed at the exit of the biodiesel holding tank to stop and start flow of the carbon source. The
ball valves had a 0.5 inch diameter to fit to the piping and are made of CPVC. These valves are
available at Home Depot as well as from additional manufacturers.
The final design for biodiesel waste as a carbon source is presented in Figure 25. A
Computer Aided Design (CAD) drawing was produced to display the setup. This design was a
preliminary design for UBWPAD to use and adjust as needed.
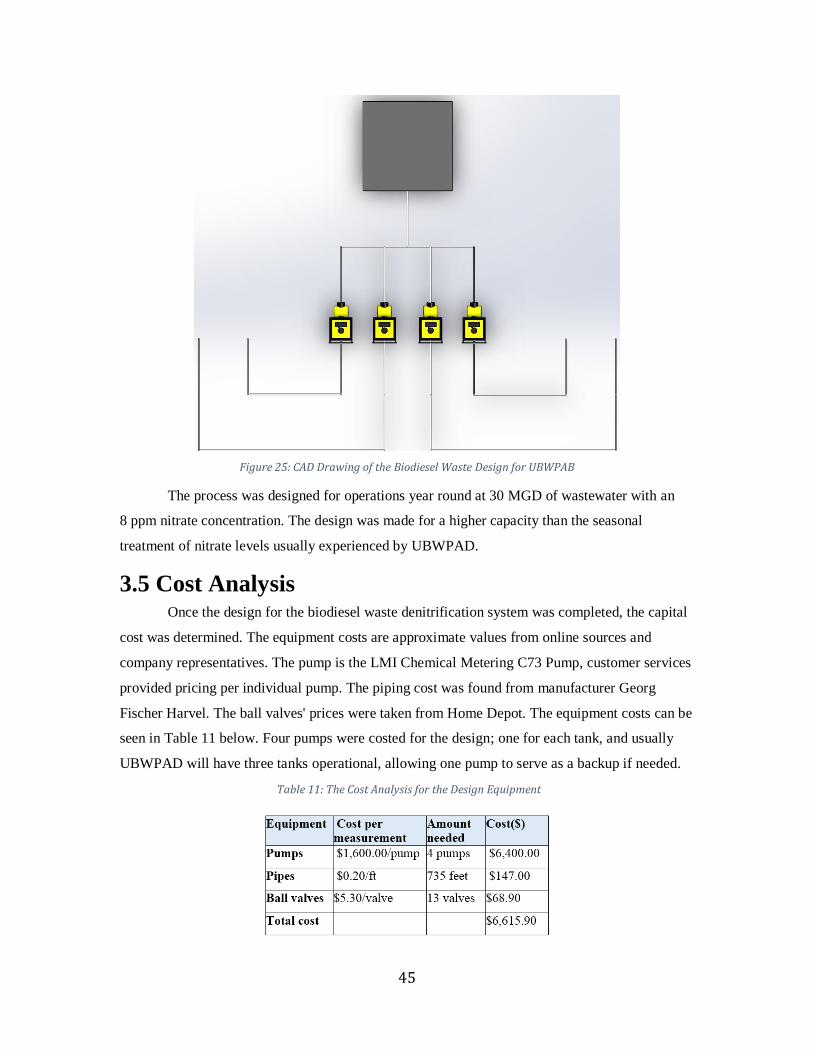
45
Figure 25: CAD Drawing of the Biodiesel Waste Design for UBWPAB
The process was designed for operations year round at 30 MGD of wastewater with an
8 ppm nitrate concentration. The design was made for a higher capacity than the seasonal
treatment of nitrate levels usually experienced by UBWPAD.
3.5 Cost Analysis Once the design for the biodiesel waste denitrification system was completed, the capital
cost was determined. The equipment costs are approximate values from online sources and
company representatives. The pump is the LMI Chemical Metering C73 Pump, customer services
provided pricing per individual pump. The piping cost was found from manufacturer Georg
Fischer Harvel. The ball valves' prices were taken from Home Depot. The equipment costs can be
seen in Table 11 below. Four pumps were costed for the design; one for each tank, and usually
UBWPAD will have three tanks operational, allowing one pump to serve as a backup if needed.
Table 11: The Cost Analysis for the Design Equipment
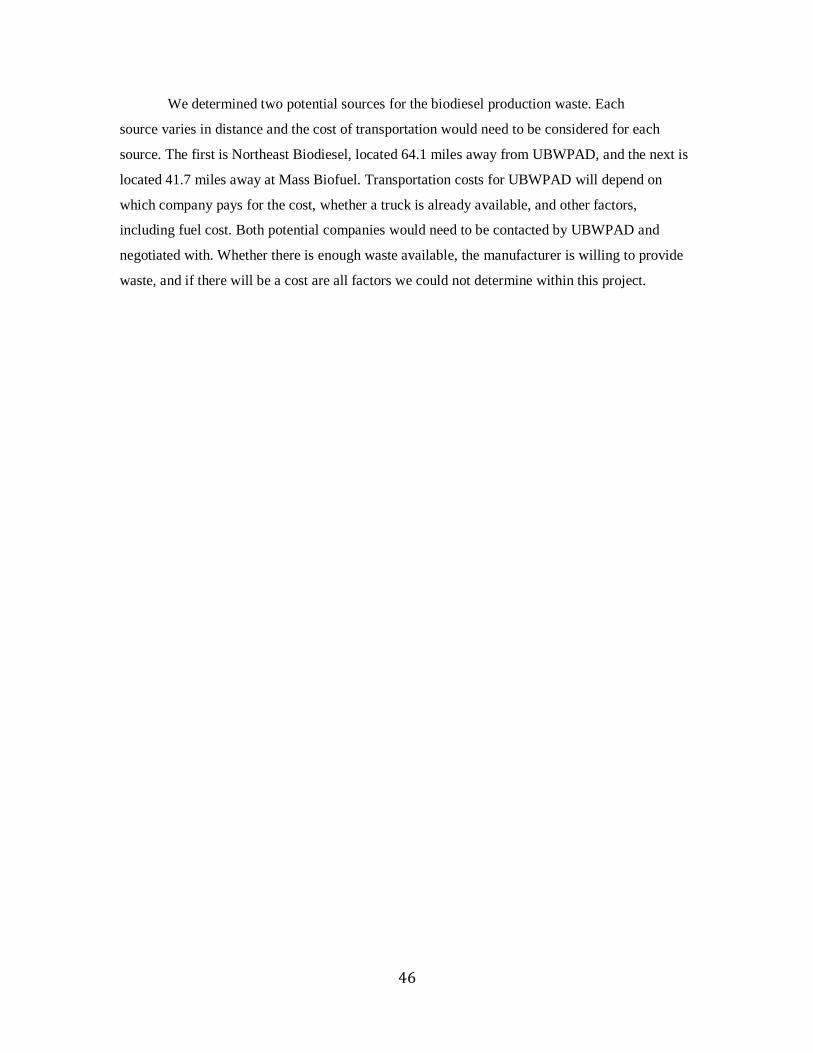
46
We determined two potential sources for the biodiesel production waste. Each
source varies in distance and the cost of transportation would need to be considered for each
source. The first is Northeast Biodiesel, located 64.1 miles away from UBWPAD, and the next is
located 41.7 miles away at Mass Biofuel. Transportation costs for UBWPAD will depend on
which company pays for the cost, whether a truck is already available, and other factors,
including fuel cost. Both potential companies would need to be contacted by UBWPAD and
negotiated with. Whether there is enough waste available, the manufacturer is willing to provide
waste, and if there will be a cost are all factors we could not determine within this project.
47
4.0 Conclusions and Recommendations Unrefined biodiesel production waste is recommended as the most effective carbon
source for denitrification at UBWPAD. We recommend that UBWPAD perform additional
batch reactor testing with larger volumes of wastewater and contact the desired companies that
produce a biodiesel waste byproduct. Some potential biodiesel manufacturers include Northeast
Biodiesel, located in Greenfield, Massachusetts and Mass Biofuel, located in Dedham,
Massachusetts. We recommend contacting companies located in the state of Massachusetts to
avoid the time consuming process of state approval and recycling permits. We advise UBWPAD
to perform a scaled-up test on the carbon byproduct to ensure effectiveness. Compliance with
Department of Transportation (DOT) regulations for transportation of the byproduct is
important for UBWPAD to take into account.
If the scaled-up tests have continuous success, then a full-scale pilot test could be
performed at UBWPAD. A negotiation between UBWPAD and the company of choice is
necessary for a total cost. Negotiations may need to consider various factors: method
of transportation, costing of carbon source and transportation, general disposal costs, and a
delivery schedule. Once negotiations are reached a formal contract can be drafted and agreed
upon by both parties. Refer to Appendix H for additional suggestions and advice. We developed a
preliminary design that we recommend UBWPAD consider for further development.
48
Reference List Acetate. (2015, October 1). Retrieved November 6, 2015, from
http://pubchem.ncbi.nlm.nih.gov/compound/acetate#section=Related-Compounds-with-
Annotatiohttp://pubchem.ncbi.nlm.nih.gov/compound/acetate#section=Related-Compounds-with-
Annotationn
Acetone MSDS. Sciencelab.com.
"Anaerobic Digestion." Waste Water Handbook. Web.
Barnstable County Department of Health and Environment, Basic Constituents of Wastewater.
(2015). Barnstable County Department of Health and Environment, Barnstable. Retrieved on
September 8, 2015.
<http://www.barnstablecountyhealth.org/resources/publications/compendium-of-information-on-
alternative-onsite-septic-system-technology/basics-of-wastewater-treatment>
Boyle, Richard, and Peter Witherington. "Guidance on Evaluation of Development Proposals on
Sites Where Methane and Carbon Dioxide Are Present." Nhbc.co.uk. National House-Building
Council, Mar. 2007. Web.
Bridie´, A., Wolff, C., & Winter, M. (1979). BOD and COD of some petrochemicals. Water
Research, 13(7), 627-630.
Bursey, Robert G. "New Industrial Uses of Dairy Products." National Agricultural Library.
United States Department of Agriculture.
Cargill. (2013, June 20). IsoClear® 42% High Fructose Corn Syrup. Retrieved February 4, 2016,
from
https://www.cargillfoods.com/wcm/groups/internal/@cseg/@food/@all/documents/document/na3
014966.pdf
Cherchi, C et. al., (2009). Implication of Using Different Carbon Sources for Denitrification in
Wastewater Treatments.Water Environment Research, Volume 81, Issue 8.
Constantine, T. (2008, February 19). An Overview of Ammonia and Nitrogen Removal in
Wastewater Treatment. Retrieved September 16, 2015.
Cormier, M., Suchecki Jr., R., Pertuit, R., Brown, D., & Cormier, T. (2010). Compound for denitrifying wastewater. United States Patent and Trademark Office.
Corn Naturally. (n.d.). HFCS COMPOSITION. Retrieved February 04, 2016, from
http://www.cornnaturally.com/hfcs-scientific-data/HFCS-Nutritional-Equivalencies/Composition
Davis, M., & Masten, S. (2004). Wastewater Treatment. In Principles of Environmental
Engineering and Science. New York, NY: McGraw-Hill
deBarbadillo, C. et. al.,(2008). Got Carbon? Widespread biological nutrient removal is increasing
the demand for supplemental sources. Water Environment Federation
http://www.webpages.uidaho.edu/ce432/WET-Got%20Carbon.pdf
49
De Filippis, P., Di Palma, L., Scarsella, M., & Verdone, N. (2013). Biological Denitrification of
High-Nitrate Wastewaters: A Comparison Between Three Electron Donors. Chemical Engineering Transactions, 32, 319-324. Retrieved February 4, 2016, from
http://www.aidic.it/cet/13/32/054.pdf
Dragicevic, Tibela. “The potential of dairy wastewater for denitrification”. University of Zagreb,
2010. Retrieved from
<file:///C:/Users/Dallen/Downloads/Mljekarstvo_29_9_2010_191_197%20(1).pdf>
Environmental Operating Solutions, MicroC Premium Carbon Sources. (2006). Environmental
Operating Solutions Inc., Bourne. Retrieved September 5, 2015.
http://microc.com/product/index.htmhttp://microc.com/product/index.htm
http://microc.com/product/index.htm
Environmental Protection Agency. (2012, March 6). Water: Monitoring and Assessment: 5.7
Nitrates. Retrieved from EPA: United States Environmental Protection Agency:
http://water.epa.gov/type/rsl/monitoring/vms57.cfm
Grabinska-Loniewska, A. Slomczynski T. Kanska Z. Denitrification Studies with Glycerol as a
Carbon Source. Institute of Environmental Engineering, Warsaw Technical University. Retrieved
October 6, 2015.
Gu, A., & Onnis-Hayden, A. (2010). PROTOCOL TO EVALUATE ALTERNATIVE
EXTERNAL CARBON SOURCES FOR DENITRIFICATION AT FULL-SCALE
WASTEWATER TREATMENT PLANTS. Water Environment Research Foundation. Retrieved
August 31, 2015.
"Isopropyl Alcohol MSDS." Sciencelab.com, Inc.
“Lactic Acid”. Corbion Purac, 2014. Retrieved from <http://www.lactic-
acid.com/physical_properties.html>
Langeland, W. E., & Filipiak, D. J. (2016, February 4). Food Processing Wastewater Treatment Design. Lecture.
Liang, W. (2013). Evaluation of an Industrial By-product Glycol Mixture as a Carbon Source for
Denitrification. Blacksburg, Virginia: Virginia Polytechnic Institute.
Ma, Y. Peng, Y. Wang S. (2007). Denitrification potential enhancement by addition of external
carbon sources in a pre-denitrification process. Journal of Environmental Sciences 19(2007) 284-
289. Retrieved October 2, 2015.
Mark Johnson, Personal Correspondence, September 4, 2015.
"Material Safety Data Sheet Lactic Acid." Trade-chem.com. Chemtrade International. Web.
MSDS Lactose." Hummelcroton.com. Hummel Croton. Web. 04 Feb. 2016.
Net Industries. (2015). Chemical Oxygen Demand. Retrieved from Net Industries:
http://science.jrank.org/pages/1388/Chemical-Oxygen-Demand.html
50
Nutrients Review. (2015). Alcohol (Ethanol) Chemical and Physical Properties. Retrieved
February 04, 2016, from http://www.nutrientsreview.com/alcohol/definition-physical-chemical-
properties.html
Pretorius, C., Kilian, R., & Jannone, J. (2006). GIVE YOUR DENITRIFICATION BUGS A
SUGAR HIGH [Scholarly project]. In Water Environment Foundation. Retrieved February 3,
2016.
PubChem. (2004, September 16). Sucrose. Retrieved February 04, 2016, from
http://pubchem.ncbi.nlm.nih.gov/compound/sucrose#section=Color
Ridge, Tom, and Mary E. Peters. "The Methanol Alternative to Gasoline." The New York Times.
The New York Times, 23 Feb. 2012. Web. 08 Feb. 2016.
Robertson, Steve. "Glycerol." Inchem.org. National Centre for Ecotoxicology & Hazardous
Substances, Mar. 2002. Web.
ScienceLab. (2013). Acetic acid MSDS.
Sciencelab.com.http://science.jrank.org/pages/1388/Chemical-Oxygen-Demand.html
ScienceLab. (2013). Propylene Glycol MSDS. Sciencelab.com.
http://science.jrank.org/pages/1388/Chemical-Oxygen-Demand.html
Snyder, J. R., Hagerty, P. F., & Molstad, M. C. (1957, April). Operation and Performance of Bench Scale Reactors. Retrieved from ACS Publications:
http://pubs.acs.org/doi/pdf/10.1021/ie50568a033
"Sucrose." PubChem OPEN CHEMISTRY DATABASE. National Center for Biotechnology
Information, 30 Jan. 2016. Web. 04 Feb. 2016.
“The activated sludge system”. The Wastewater Handbook, 2013. Retrieved from
<http://www.wastewaterhandbook.com/documents/organic_material_metabolism/211_OMBM_C
OD.pdf>
Turton, Richard. Analysis, Synthesis, and Design of Chemical Processes. Upper Saddle River,
N.J: Prentice Hall, 2003. Print.
Upper Blackstone Water Pollution Abatement District. (n.d.). Home. Retrieved from Upper
Blackstone Water Pollution Abatement District: http://www.ubwpad.org/
"Wastewater Treatment Fact Sheet: External Carbon Sources for Nitrogen Removal." United
States Environmental Protection Agency, 1 Aug. 2013
World Bank Group. “Dairy Industry”. Pollution Prevention Control, 1998. Retrieved from
<http://www.ifc.org/wps/wcm/connect/2668f38048855c0e8adcda6a6515bb18/dairy_PPAH.pdf?
MOD=AJPERES>
Y. Fernández-Nava, E. Marañón, J. Soons, L. Castrillón, Denitrification of high nitrate
concentration wastewater using alternative carbon sources, Journal of Hazardous Materials,
Volume 173, Issues 1–3, 15 January 2010, Pages 682-688, ISSN 0304-3894,
http://dx.doi.org/10.1016/j.jhazmat.2009.08.140.
51
Znanstveni, Izvorni Rad. "The Potential of Dairy Wastewater for Denitrification." Faculty of Food Technology and Biotechnology, University of Zagreb (n.d.): n. pag. Web. 8 Feb. 2016.

52
Appendices Appendix A: Calculations
Nitrate Conversion Calculations
Standard Curve Equation: The standard curve equation was used to convert readings from the
nitrate probe in millivolts to concentration of nitrate as nitrogen in parts per million. An example
calculation with biodiesel waste is shown below.
𝑦 = −11.12 ln(𝑥) + 129.32 Nitrate probe reading = 141.3 mV
𝑦 = −11.12 ln(𝑥) + 129.32 Solve for x (nitrate as N):
𝑥 = 𝑒[(𝑦−129.32)
−11.12]
𝑥 = 𝑒[(141.3−129.32)
−11.12 ]
𝑥 = 0.341 𝑝𝑝𝑚 𝑁𝑖𝑡𝑟𝑎𝑡𝑒 𝑎𝑠 𝑁 Dilution = 50% NISS to wastewater
𝒙 = 𝟎. 𝟔𝟖𝟏 𝒑𝒑𝒎 𝑵𝒊𝒕𝒓𝒂𝒕𝒆 𝒂𝒔 𝑵
Equation 9 was used to calculate the volume of each carbon source needed for complete
denitrification in the reactor tests.
Equation 9: The equation used to calculate the desired volume of each carbon source for denitrification in the reactor
𝑉𝑜𝑙𝑢𝑚𝑒 𝑜𝑓 𝑐𝑎𝑟𝑏𝑜𝑛 𝑠𝑜𝑢𝑟𝑐𝑒 𝑛𝑒𝑒𝑑𝑒𝑑 =(
𝐹𝑀
) (𝑉𝑜𝑙𝑢𝑚𝑒 𝑜𝑓 𝑤𝑎𝑠𝑡𝑒𝑤𝑎𝑡𝑒𝑟) (𝑀𝐿𝑉𝑆𝑆 (𝑚𝑔
𝐿))
𝐶𝑂𝐷 (𝑚𝑔
𝐿 )
The following table contains data used to calculate the volume of each carbon source
needed for the reactor tests. Using the data, the volume of DOW needed was calculated.
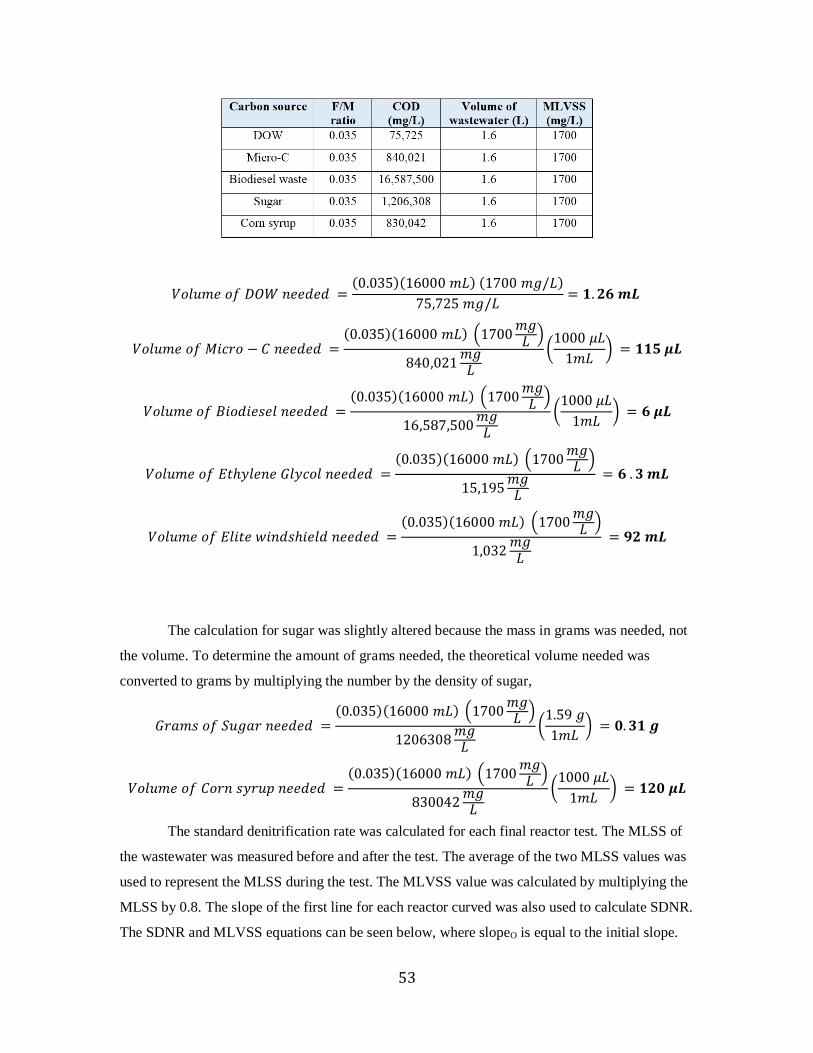
53
𝑉𝑜𝑙𝑢𝑚𝑒 𝑜𝑓 𝐷𝑂𝑊 𝑛𝑒𝑒𝑑𝑒𝑑 =(0.035)(16000 𝑚𝐿) (1700 𝑚𝑔/𝐿)
75,725 𝑚𝑔/𝐿= 𝟏. 𝟐𝟔 𝒎𝑳
𝑉𝑜𝑙𝑢𝑚𝑒 𝑜𝑓 𝑀𝑖𝑐𝑟𝑜 − 𝐶 𝑛𝑒𝑒𝑑𝑒𝑑 =(0.035)(16000 𝑚𝐿) (1700
𝑚𝑔𝐿 )
840,021𝑚𝑔
𝐿
(1000 𝜇𝐿
1𝑚𝐿) = 𝟏𝟏𝟓 𝝁𝑳
𝑉𝑜𝑙𝑢𝑚𝑒 𝑜𝑓 𝐵𝑖𝑜𝑑𝑖𝑒𝑠𝑒𝑙 𝑛𝑒𝑒𝑑𝑒𝑑 =(0.035)(16000 𝑚𝐿) (1700
𝑚𝑔𝐿 )
16,587,500𝑚𝑔
𝐿
(1000 𝜇𝐿
1𝑚𝐿) = 𝟔 𝝁𝑳
𝑉𝑜𝑙𝑢𝑚𝑒 𝑜𝑓 𝐸𝑡ℎ𝑦𝑙𝑒𝑛𝑒 𝐺𝑙𝑦𝑐𝑜𝑙 𝑛𝑒𝑒𝑑𝑒𝑑 =(0.035)(16000 𝑚𝐿) (1700
𝑚𝑔𝐿 )
15,195𝑚𝑔
𝐿
= 𝟔 . 𝟑 𝒎𝑳
𝑉𝑜𝑙𝑢𝑚𝑒 𝑜𝑓 𝐸𝑙𝑖𝑡𝑒 𝑤𝑖𝑛𝑑𝑠ℎ𝑖𝑒𝑙𝑑 𝑛𝑒𝑒𝑑𝑒𝑑 =(0.035)(16000 𝑚𝐿) (1700
𝑚𝑔𝐿 )
1,032𝑚𝑔
𝐿
= 𝟗𝟐 𝒎𝑳
The calculation for sugar was slightly altered because the mass in grams was needed, not
the volume. To determine the amount of grams needed, the theoretical volume needed was
converted to grams by multiplying the number by the density of sugar,
𝐺𝑟𝑎𝑚𝑠 𝑜𝑓 𝑆𝑢𝑔𝑎𝑟 𝑛𝑒𝑒𝑑𝑒𝑑 =(0.035)(16000 𝑚𝐿) (1700
𝑚𝑔𝐿 )
1206308𝑚𝑔
𝐿
(1.59 𝑔
1𝑚𝐿) = 𝟎. 𝟑𝟏 𝒈
𝑉𝑜𝑙𝑢𝑚𝑒 𝑜𝑓 𝐶𝑜𝑟𝑛 𝑠𝑦𝑟𝑢𝑝 𝑛𝑒𝑒𝑑𝑒𝑑 =(0.035)(16000 𝑚𝐿) (1700
𝑚𝑔𝐿 )
830042𝑚𝑔
𝐿
(1000 𝜇𝐿
1𝑚𝐿) = 𝟏𝟐𝟎 𝝁𝑳
The standard denitrification rate was calculated for each final reactor test. The MLSS of
the wastewater was measured before and after the test. The average of the two MLSS values was
used to represent the MLSS during the test. The MLVSS value was calculated by multiplying the
MLSS by 0.8. The slope of the first line for each reactor curved was also used to calculate SDNR.
The SDNR and MLVSS equations can be seen below, where slopeO is equal to the initial slope.

54
𝑀𝐿𝑉𝑆𝑆 = [(𝑀𝐿𝑆𝑆𝑂 − 𝑀𝐿𝑆𝑆𝐹
2) (0.8)]
𝑆𝐷𝑁𝑅 = (1440min
day)𝑆𝑙𝑜𝑝𝑒𝑂/𝑀𝐿𝑉𝑆𝑆
The SDNR and MLVSS calculations for each carbon source that underwent final testing
can be seen below.
𝑀𝐿𝑉𝑆𝑆 𝐷𝑂𝑊 = [(2754
𝑚𝑔𝐿 − 1400
𝑚𝑔𝐿
2) (0.8)] = 𝟏𝟔𝟔𝟏. 𝟔
𝒎𝒈
𝑳 𝑽𝑺𝑺
𝑆𝐷𝑁𝑅 𝐷𝑂𝑊 = 1440
𝑚𝑖𝑛𝑑𝑎𝑦
(−.0741 𝑚𝑔𝑁
𝑚𝑖𝑛)
1,661.6𝑚𝑔
𝐿 𝑉𝑆𝑆=
−. 𝟎𝟔𝟒𝟐𝟐 𝒎𝒈 𝑵
𝒎𝒈 𝑽𝑺𝑺 ∗ 𝒅𝒂𝒚
𝑀𝐿𝑉𝑆𝑆 𝐵𝑖𝑜𝑑𝑖𝑒𝑠𝑒𝑙 𝑤𝑎𝑠𝑡𝑒 = [(2168
𝑚𝑔𝐿 − 1430
𝑚𝑔𝐿
2) (0.8)] = 𝟏𝟕𝟗𝟗
𝒎𝒈
𝑳 𝑽𝑺𝑺
𝑆𝐷𝑁𝑅 𝐵𝑖𝑜𝑑𝑖𝑒𝑠𝑒𝑙 𝑤𝑎𝑠𝑡𝑒 = 1440
𝑚𝑖𝑛𝑑𝑎𝑦
(−.1031 𝑚𝑔𝑁
𝑚𝑖𝑛)
1,799𝑚𝑔
𝐿 𝑉𝑆𝑆=
−. 𝟏𝟎𝟑𝟏𝟔 𝒎𝒈 𝑵
𝒎𝒈 𝑽𝑺𝑺 ∗ 𝒅𝒂𝒚
𝑀𝐿𝑉𝑆𝑆 𝑆𝑢𝑔𝑎𝑟 = [(2502
𝑚𝑔𝐿 − 1396
𝑚𝑔𝐿
2) (0.8)] = 𝟏𝟓𝟓𝟗. 𝟐
𝒎𝒈
𝑳 𝑽𝑺𝑺
𝑆𝐷𝑁𝑅 𝑆𝑢𝑔𝑎𝑟 = 1440
𝑚𝑖𝑛𝑑𝑎𝑦
(−.0424 𝑚𝑔𝑁
𝑚𝑖𝑛)
1,559.2𝑚𝑔
𝐿 𝑉𝑆𝑆=
−. 𝟎𝟑𝟗𝟏𝟔 𝒎𝒈 𝑵
𝒎𝒈 𝑽𝑺𝑺 ∗ 𝒅𝒂𝒚
𝑀𝐿𝑉𝑆𝑆 𝑀𝑖𝑐𝑟𝑜 − 𝐶 [(2502
𝑚𝑔𝐿 − 1202
𝑚𝑔𝐿
2) (0.8)] = 𝟏𝟒𝟖𝟏. 𝟔
𝒎𝒈
𝑳 𝑽𝑺𝑺
𝑆𝐷𝑁𝑅 𝑀𝑖𝑐𝑟𝑜 − 𝐶 = 1440
𝑚𝑖𝑛𝑑𝑎𝑦
(−.1155 𝑚𝑔𝑁
𝑚𝑖𝑛)
1,481.6𝑚𝑔
𝐿 𝑉𝑆𝑆=
−. 𝟏𝟏𝟐𝟐𝟔 𝒎𝒈 𝑵
𝒎𝒈 𝑽𝑺𝑺 ∗ 𝒅𝒂𝒚
𝑀𝐿𝑉𝑆𝑆 𝐶𝑜𝑟𝑛 𝑠𝑦𝑟𝑢𝑝 [(2502
𝑚𝑔𝐿 − 1224
𝑚𝑔𝐿
2) (0.8)] = 𝟏𝟖𝟔𝟑
𝒎𝒈
𝑳 𝑽𝑺𝑺
𝑆𝐷𝑁𝑅 𝐶𝑜𝑟𝑛 𝑠𝑦𝑟𝑢𝑝 1440
𝑚𝑖𝑛𝑑𝑎𝑦
(−.1333 𝑚𝑔𝑁
𝑚𝑖𝑛)
1,863𝑚𝑔
𝐿 𝑉𝑆𝑆=
−. 𝟏𝟎𝟑𝟎𝟑 𝒎𝒈 𝑵
𝒎𝒈 𝑽𝑺𝑺 ∗ 𝒅𝒂𝒚
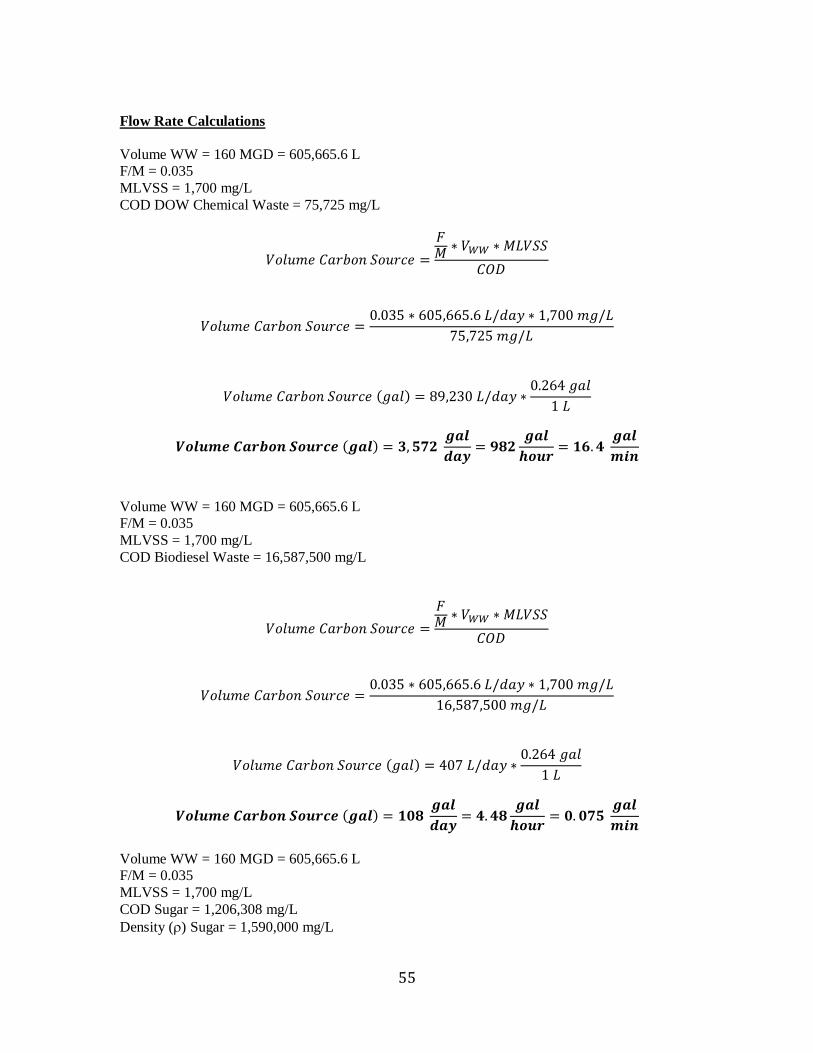
55
Flow Rate Calculations
Volume WW = 160 MGD = 605,665.6 L
F/M = 0.035
MLVSS = 1,700 mg/L
COD DOW Chemical Waste = 75,725 mg/L
𝑉𝑜𝑙𝑢𝑚𝑒 𝐶𝑎𝑟𝑏𝑜𝑛 𝑆𝑜𝑢𝑟𝑐𝑒 =
𝐹𝑀 ∗ 𝑉𝑊𝑊 ∗ 𝑀𝐿𝑉𝑆𝑆
𝐶𝑂𝐷
𝑉𝑜𝑙𝑢𝑚𝑒 𝐶𝑎𝑟𝑏𝑜𝑛 𝑆𝑜𝑢𝑟𝑐𝑒 =0.035 ∗ 605,665.6 𝐿/𝑑𝑎𝑦 ∗ 1,700 𝑚𝑔/𝐿
75,725 𝑚𝑔/𝐿
𝑉𝑜𝑙𝑢𝑚𝑒 𝐶𝑎𝑟𝑏𝑜𝑛 𝑆𝑜𝑢𝑟𝑐𝑒 (𝑔𝑎𝑙) = 89,230 𝐿/𝑑𝑎𝑦 ∗0.264 𝑔𝑎𝑙
1 𝐿
𝑽𝒐𝒍𝒖𝒎𝒆 𝑪𝒂𝒓𝒃𝒐𝒏 𝑺𝒐𝒖𝒓𝒄𝒆 (𝒈𝒂𝒍) = 𝟑, 𝟓𝟕𝟐 𝒈𝒂𝒍
𝒅𝒂𝒚= 𝟗𝟖𝟐
𝒈𝒂𝒍
𝒉𝒐𝒖𝒓= 𝟏𝟔. 𝟒
𝒈𝒂𝒍
𝒎𝒊𝒏
Volume WW = 160 MGD = 605,665.6 L
F/M = 0.035
MLVSS = 1,700 mg/L
COD Biodiesel Waste = 16,587,500 mg/L
𝑉𝑜𝑙𝑢𝑚𝑒 𝐶𝑎𝑟𝑏𝑜𝑛 𝑆𝑜𝑢𝑟𝑐𝑒 =
𝐹𝑀 ∗ 𝑉𝑊𝑊 ∗ 𝑀𝐿𝑉𝑆𝑆
𝐶𝑂𝐷
𝑉𝑜𝑙𝑢𝑚𝑒 𝐶𝑎𝑟𝑏𝑜𝑛 𝑆𝑜𝑢𝑟𝑐𝑒 =0.035 ∗ 605,665.6 𝐿/𝑑𝑎𝑦 ∗ 1,700 𝑚𝑔/𝐿
16,587,500 𝑚𝑔/𝐿
𝑉𝑜𝑙𝑢𝑚𝑒 𝐶𝑎𝑟𝑏𝑜𝑛 𝑆𝑜𝑢𝑟𝑐𝑒 (𝑔𝑎𝑙) = 407 𝐿/𝑑𝑎𝑦 ∗0.264 𝑔𝑎𝑙
1 𝐿
𝑽𝒐𝒍𝒖𝒎𝒆 𝑪𝒂𝒓𝒃𝒐𝒏 𝑺𝒐𝒖𝒓𝒄𝒆 (𝒈𝒂𝒍) = 𝟏𝟎𝟖 𝒈𝒂𝒍
𝒅𝒂𝒚= 𝟒. 𝟒𝟖
𝒈𝒂𝒍
𝒉𝒐𝒖𝒓= 𝟎. 𝟎𝟕𝟓
𝒈𝒂𝒍
𝒎𝒊𝒏
Volume WW = 160 MGD = 605,665.6 L
F/M = 0.035
MLVSS = 1,700 mg/L
COD Sugar = 1,206,308 mg/L
Density () Sugar = 1,590,000 mg/L
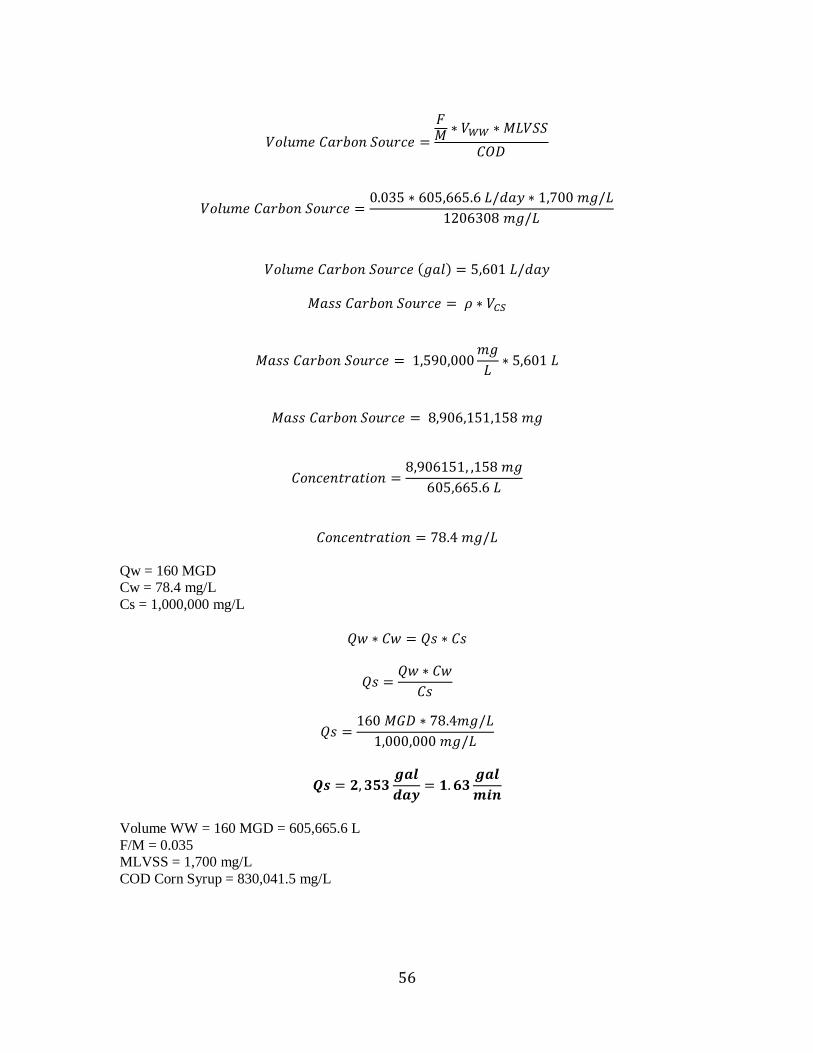
56
𝑉𝑜𝑙𝑢𝑚𝑒 𝐶𝑎𝑟𝑏𝑜𝑛 𝑆𝑜𝑢𝑟𝑐𝑒 =
𝐹𝑀 ∗ 𝑉𝑊𝑊 ∗ 𝑀𝐿𝑉𝑆𝑆
𝐶𝑂𝐷
𝑉𝑜𝑙𝑢𝑚𝑒 𝐶𝑎𝑟𝑏𝑜𝑛 𝑆𝑜𝑢𝑟𝑐𝑒 =0.035 ∗ 605,665.6 𝐿/𝑑𝑎𝑦 ∗ 1,700 𝑚𝑔/𝐿
1206308 𝑚𝑔/𝐿
𝑉𝑜𝑙𝑢𝑚𝑒 𝐶𝑎𝑟𝑏𝑜𝑛 𝑆𝑜𝑢𝑟𝑐𝑒 (𝑔𝑎𝑙) = 5,601 𝐿/𝑑𝑎𝑦
𝑀𝑎𝑠𝑠 𝐶𝑎𝑟𝑏𝑜𝑛 𝑆𝑜𝑢𝑟𝑐𝑒 = 𝜌 ∗ 𝑉𝐶𝑆
𝑀𝑎𝑠𝑠 𝐶𝑎𝑟𝑏𝑜𝑛 𝑆𝑜𝑢𝑟𝑐𝑒 = 1,590,000𝑚𝑔
𝐿∗ 5,601 𝐿
𝑀𝑎𝑠𝑠 𝐶𝑎𝑟𝑏𝑜𝑛 𝑆𝑜𝑢𝑟𝑐𝑒 = 8,906,151,158 𝑚𝑔
𝐶𝑜𝑛𝑐𝑒𝑛𝑡𝑟𝑎𝑡𝑖𝑜𝑛 =8,906151, ,158 𝑚𝑔
605,665.6 𝐿
𝐶𝑜𝑛𝑐𝑒𝑛𝑡𝑟𝑎𝑡𝑖𝑜𝑛 = 78.4 𝑚𝑔/𝐿
Qw = 160 MGD
Cw = 78.4 mg/L
Cs = 1,000,000 mg/L
𝑄𝑤 ∗ 𝐶𝑤 = 𝑄𝑠 ∗ 𝐶𝑠
𝑄𝑠 =𝑄𝑤 ∗ 𝐶𝑤
𝐶𝑠
𝑄𝑠 =160 𝑀𝐺𝐷 ∗ 78.4𝑚𝑔/𝐿
1,000,000 𝑚𝑔/𝐿
𝑸𝒔 = 𝟐, 𝟑𝟓𝟑𝒈𝒂𝒍
𝒅𝒂𝒚= 𝟏. 𝟔𝟑
𝒈𝒂𝒍
𝒎𝒊𝒏
Volume WW = 160 MGD = 605,665.6 L
F/M = 0.035
MLVSS = 1,700 mg/L
COD Corn Syrup = 830,041.5 mg/L
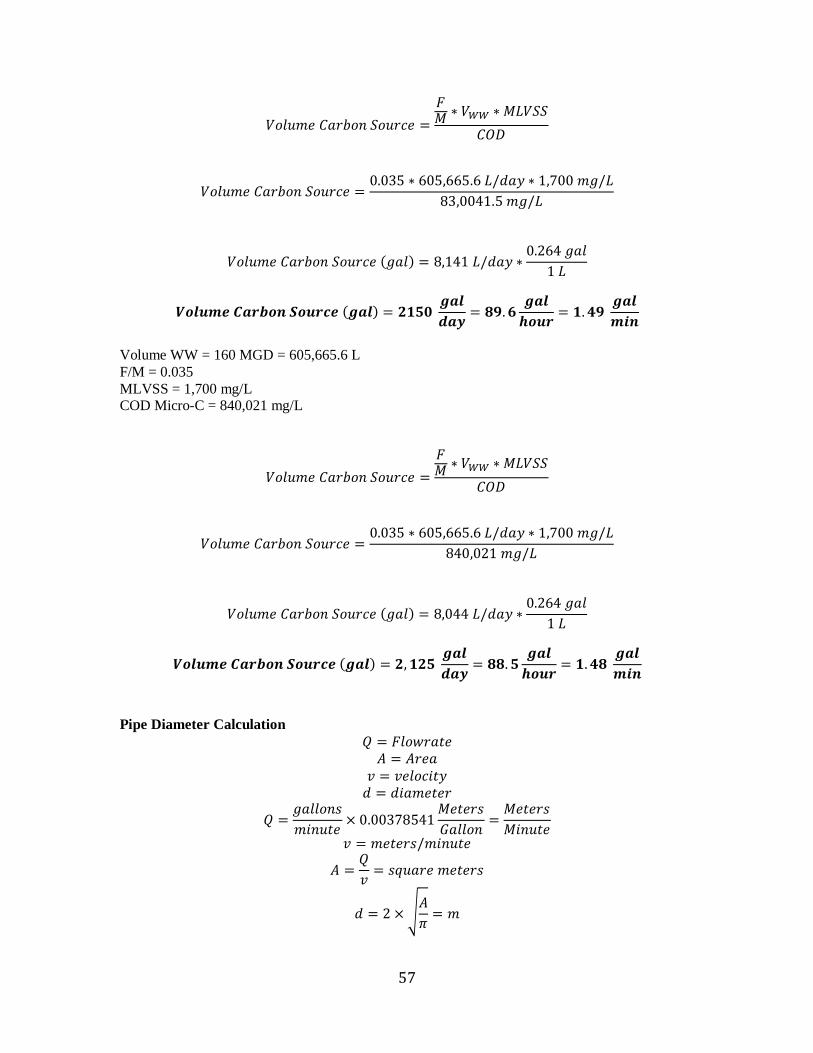
57
𝑉𝑜𝑙𝑢𝑚𝑒 𝐶𝑎𝑟𝑏𝑜𝑛 𝑆𝑜𝑢𝑟𝑐𝑒 =
𝐹𝑀 ∗ 𝑉𝑊𝑊 ∗ 𝑀𝐿𝑉𝑆𝑆
𝐶𝑂𝐷
𝑉𝑜𝑙𝑢𝑚𝑒 𝐶𝑎𝑟𝑏𝑜𝑛 𝑆𝑜𝑢𝑟𝑐𝑒 =0.035 ∗ 605,665.6 𝐿/𝑑𝑎𝑦 ∗ 1,700 𝑚𝑔/𝐿
83,0041.5 𝑚𝑔/𝐿
𝑉𝑜𝑙𝑢𝑚𝑒 𝐶𝑎𝑟𝑏𝑜𝑛 𝑆𝑜𝑢𝑟𝑐𝑒 (𝑔𝑎𝑙) = 8,141 𝐿/𝑑𝑎𝑦 ∗0.264 𝑔𝑎𝑙
1 𝐿
𝑽𝒐𝒍𝒖𝒎𝒆 𝑪𝒂𝒓𝒃𝒐𝒏 𝑺𝒐𝒖𝒓𝒄𝒆 (𝒈𝒂𝒍) = 𝟐𝟏𝟓𝟎 𝒈𝒂𝒍
𝒅𝒂𝒚= 𝟖𝟗. 𝟔
𝒈𝒂𝒍
𝒉𝒐𝒖𝒓= 𝟏. 𝟒𝟗
𝒈𝒂𝒍
𝒎𝒊𝒏
Volume WW = 160 MGD = 605,665.6 L
F/M = 0.035
MLVSS = 1,700 mg/L
COD Micro-C = 840,021 mg/L
𝑉𝑜𝑙𝑢𝑚𝑒 𝐶𝑎𝑟𝑏𝑜𝑛 𝑆𝑜𝑢𝑟𝑐𝑒 =
𝐹𝑀
∗ 𝑉𝑊𝑊 ∗ 𝑀𝐿𝑉𝑆𝑆
𝐶𝑂𝐷
𝑉𝑜𝑙𝑢𝑚𝑒 𝐶𝑎𝑟𝑏𝑜𝑛 𝑆𝑜𝑢𝑟𝑐𝑒 =0.035 ∗ 605,665.6 𝐿/𝑑𝑎𝑦 ∗ 1,700 𝑚𝑔/𝐿
840,021 𝑚𝑔/𝐿
𝑉𝑜𝑙𝑢𝑚𝑒 𝐶𝑎𝑟𝑏𝑜𝑛 𝑆𝑜𝑢𝑟𝑐𝑒 (𝑔𝑎𝑙) = 8,044 𝐿/𝑑𝑎𝑦 ∗0.264 𝑔𝑎𝑙
1 𝐿
𝑽𝒐𝒍𝒖𝒎𝒆 𝑪𝒂𝒓𝒃𝒐𝒏 𝑺𝒐𝒖𝒓𝒄𝒆 (𝒈𝒂𝒍) = 𝟐, 𝟏𝟐𝟓 𝒈𝒂𝒍
𝒅𝒂𝒚= 𝟖𝟖. 𝟓
𝒈𝒂𝒍
𝒉𝒐𝒖𝒓= 𝟏. 𝟒𝟖
𝒈𝒂𝒍
𝒎𝒊𝒏
Pipe Diameter Calculation
𝑄 = 𝐹𝑙𝑜𝑤𝑟𝑎𝑡𝑒
𝐴 = 𝐴𝑟𝑒𝑎
𝑣 = 𝑣𝑒𝑙𝑜𝑐𝑖𝑡𝑦
𝑑 = 𝑑𝑖𝑎𝑚𝑒𝑡𝑒𝑟
𝑄 =𝑔𝑎𝑙𝑙𝑜𝑛𝑠
𝑚𝑖𝑛𝑢𝑡𝑒× 0.00378541
𝑀𝑒𝑡𝑒𝑟𝑠
𝐺𝑎𝑙𝑙𝑜𝑛=
𝑀𝑒𝑡𝑒𝑟𝑠
𝑀𝑖𝑛𝑢𝑡𝑒
𝑣 = 𝑚𝑒𝑡𝑒𝑟𝑠/𝑚𝑖𝑛𝑢𝑡𝑒
𝐴 =𝑄
𝑣= 𝑠𝑞𝑢𝑎𝑟𝑒 𝑚𝑒𝑡𝑒𝑟𝑠
𝑑 = 2 × √𝐴
𝜋= 𝑚
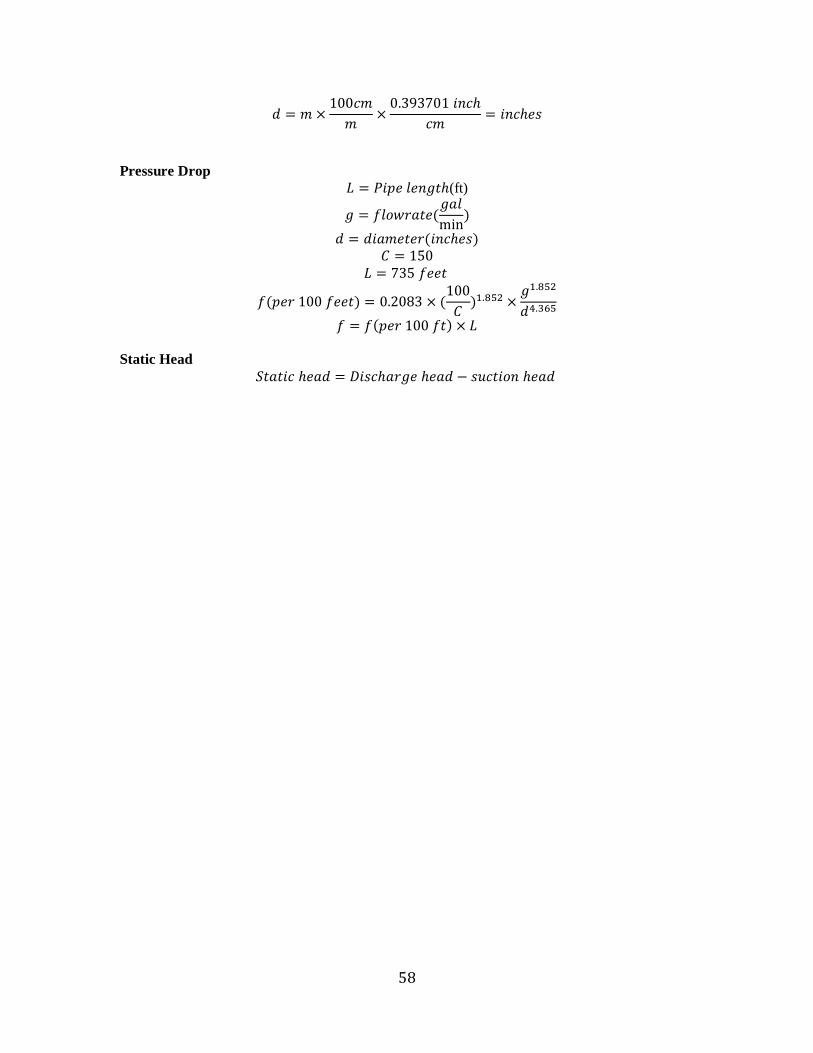
58
𝑑 = 𝑚 ×100𝑐𝑚
𝑚×
0.393701 𝑖𝑛𝑐ℎ
𝑐𝑚= 𝑖𝑛𝑐ℎ𝑒𝑠
Pressure Drop
𝐿 = 𝑃𝑖𝑝𝑒 𝑙𝑒𝑛𝑔𝑡ℎ(ft)
𝑔 = 𝑓𝑙𝑜𝑤𝑟𝑎𝑡𝑒(𝑔𝑎𝑙
min)
𝑑 = 𝑑𝑖𝑎𝑚𝑒𝑡𝑒𝑟(𝑖𝑛𝑐ℎ𝑒𝑠)
𝐶 = 150
𝐿 = 735 𝑓𝑒𝑒𝑡
𝑓(𝑝𝑒𝑟 100 𝑓𝑒𝑒𝑡) = 0.2083 × (100
𝐶)1.852 ×
𝑔1.852
𝑑4.365
𝑓 = 𝑓(𝑝𝑒𝑟 100 𝑓𝑡) × 𝐿
Static Head
𝑆𝑡𝑎𝑡𝑖𝑐 ℎ𝑒𝑎𝑑 = 𝐷𝑖𝑠𝑐ℎ𝑎𝑟𝑔𝑒 ℎ𝑒𝑎𝑑 − 𝑠𝑢𝑐𝑡𝑖𝑜𝑛 ℎ𝑒𝑎𝑑
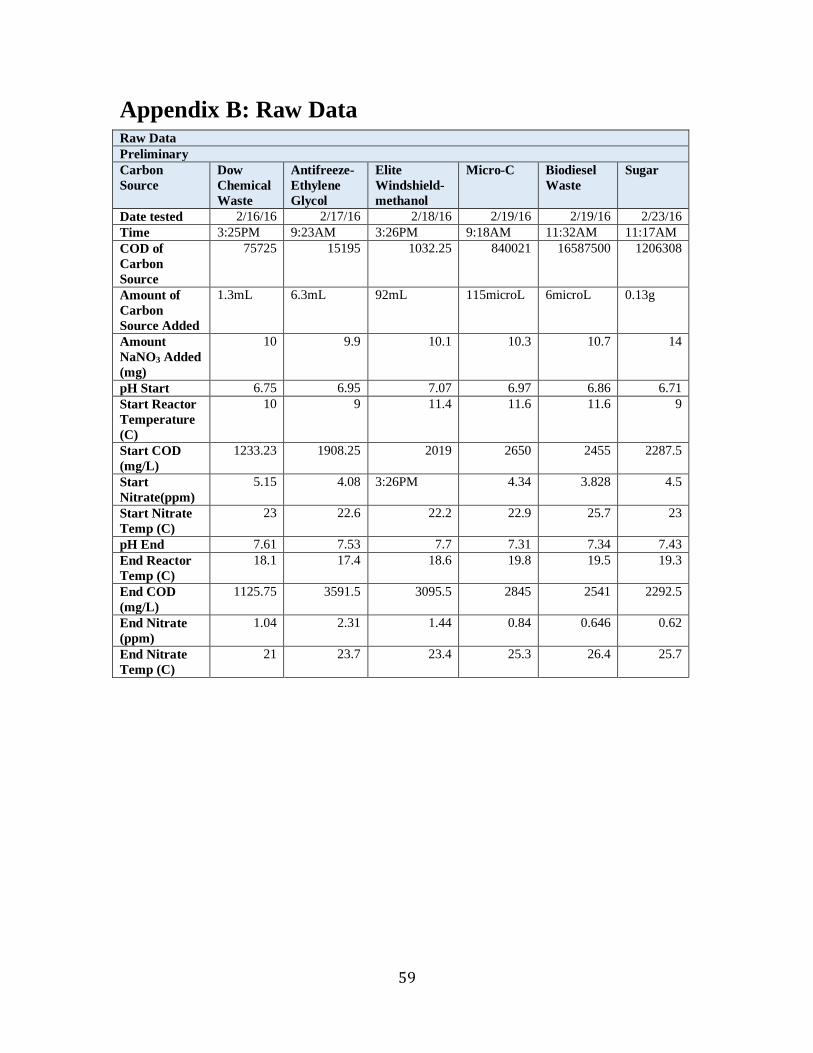
59
Appendix B: Raw Data Raw Data
Preliminary
Carbon
Source
Dow
Chemical
Waste
Antifreeze-
Ethylene
Glycol
Elite
Windshield-
methanol
Micro-C Biodiesel
Waste
Sugar
Date tested 2/16/16 2/17/16 2/18/16 2/19/16 2/19/16 2/23/16
Time 3:25PM 9:23AM 3:26PM 9:18AM 11:32AM 11:17AM
COD of
Carbon
Source
75725 15195 1032.25 840021 16587500 1206308
Amount of
Carbon
Source Added
1.3mL 6.3mL 92mL 115microL 6microL 0.13g
Amount
NaNO3 Added
(mg)
10 9.9 10.1 10.3 10.7 14
pH Start 6.75 6.95 7.07 6.97 6.86 6.71
Start Reactor
Temperature
(C)
10 9 11.4 11.6 11.6 9
Start COD
(mg/L)
1233.23 1908.25 2019 2650 2455 2287.5
Start
Nitrate(ppm)
5.15 4.08 3:26PM 4.34 3.828 4.5
Start Nitrate
Temp (C)
23 22.6 22.2 22.9 25.7 23
pH End 7.61 7.53 7.7 7.31 7.34 7.43
End Reactor
Temp (C)
18.1 17.4 18.6 19.8 19.5 19.3
End COD
(mg/L)
1125.75 3591.5 3095.5 2845 2541 2292.5
End Nitrate
(ppm)
1.04 2.31 1.44 0.84 0.646 0.62
End Nitrate
Temp (C)
21 23.7 23.4 25.3 26.4 25.7
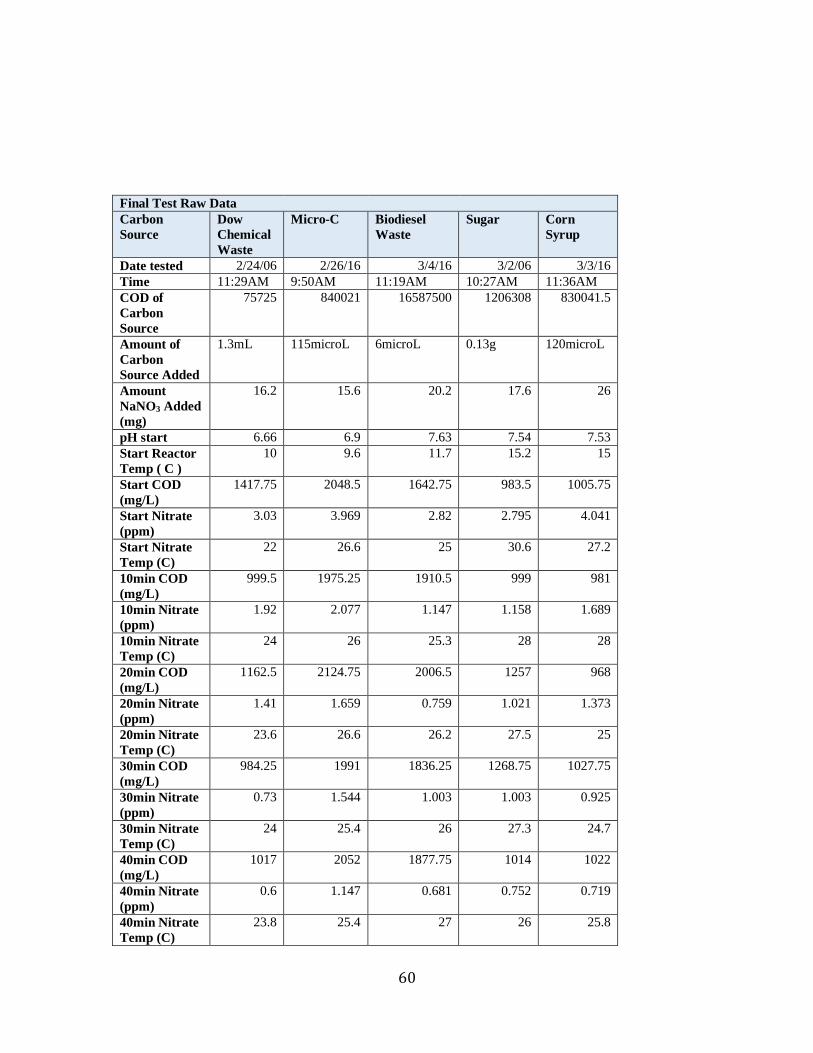
60
Final Test Raw Data
Carbon
Source
Dow
Chemical
Waste
Micro-C Biodiesel
Waste
Sugar Corn
Syrup
Date tested 2/24/06 2/26/16 3/4/16 3/2/06 3/3/16
Time 11:29AM 9:50AM 11:19AM 10:27AM 11:36AM
COD of
Carbon
Source
75725 840021 16587500 1206308 830041.5
Amount of
Carbon
Source Added
1.3mL 115microL 6microL 0.13g 120microL
Amount
NaNO3 Added
(mg)
16.2 15.6 20.2 17.6 26
pH start 6.66 6.9 7.63 7.54 7.53
Start Reactor
Temp ( C )
10 9.6 11.7 15.2 15
Start COD
(mg/L)
1417.75 2048.5 1642.75 983.5 1005.75
Start Nitrate
(ppm)
3.03 3.969 2.82 2.795 4.041
Start Nitrate
Temp (C)
22 26.6 25 30.6 27.2
10min COD
(mg/L)
999.5 1975.25 1910.5 999 981
10min Nitrate
(ppm)
1.92 2.077 1.147 1.158 1.689
10min Nitrate
Temp (C)
24 26 25.3 28 28
20min COD
(mg/L)
1162.5 2124.75 2006.5 1257 968
20min Nitrate
(ppm)
1.41 1.659 0.759 1.021 1.373
20min Nitrate
Temp (C)
23.6 26.6 26.2 27.5 25
30min COD
(mg/L)
984.25 1991 1836.25 1268.75 1027.75
30min Nitrate
(ppm)
0.73 1.544 1.003 1.003 0.925
30min Nitrate
Temp (C)
24 25.4 26 27.3 24.7
40min COD
(mg/L)
1017 2052 1877.75 1014 1022
40min Nitrate
(ppm)
0.6 1.147 0.681 0.752 0.719
40min Nitrate
Temp (C)
23.8 25.4 27 26 25.8
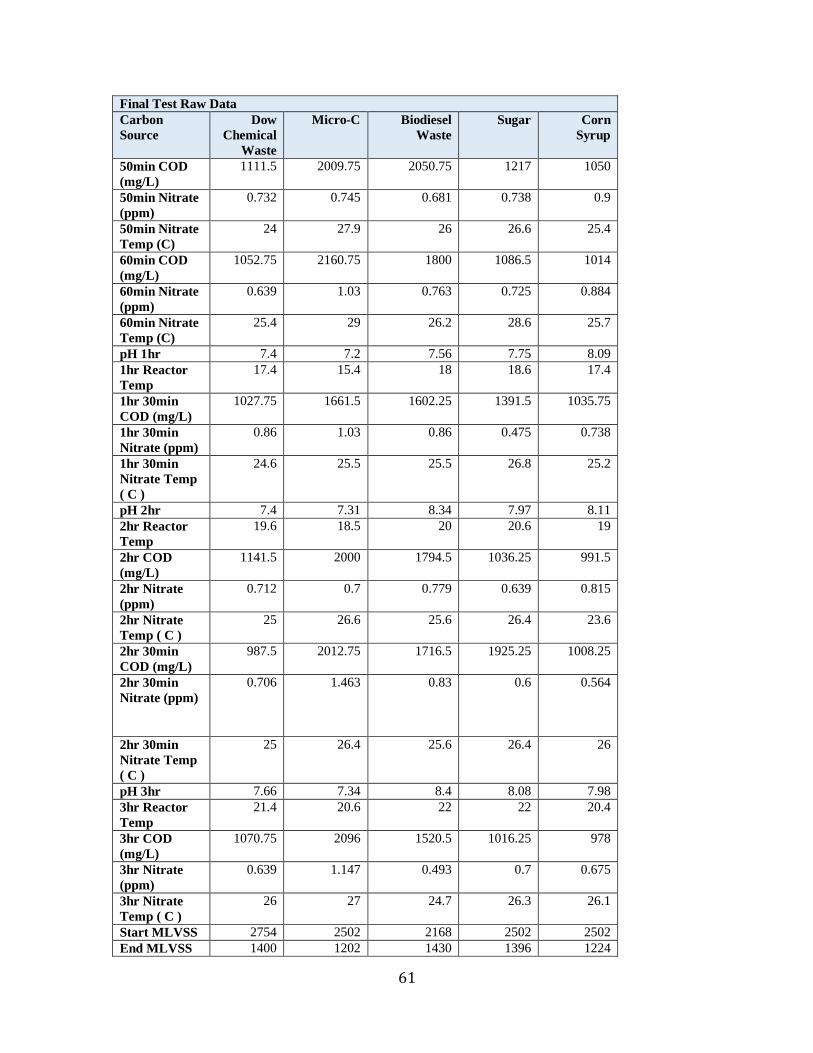
61
Final Test Raw Data
Carbon
Source
Dow
Chemical
Waste
Micro-C Biodiesel
Waste
Sugar Corn
Syrup
50min COD
(mg/L)
1111.5 2009.75 2050.75 1217 1050
50min Nitrate
(ppm)
0.732 0.745 0.681 0.738 0.9
50min Nitrate
Temp (C)
24 27.9 26 26.6 25.4
60min COD
(mg/L)
1052.75 2160.75 1800 1086.5 1014
60min Nitrate
(ppm)
0.639 1.03 0.763 0.725 0.884
60min Nitrate
Temp (C)
25.4 29 26.2 28.6 25.7
pH 1hr 7.4 7.2 7.56 7.75 8.09
1hr Reactor
Temp
17.4 15.4 18 18.6 17.4
1hr 30min
COD (mg/L)
1027.75 1661.5 1602.25 1391.5 1035.75
1hr 30min
Nitrate (ppm)
0.86 1.03 0.86 0.475 0.738
1hr 30min
Nitrate Temp
( C )
24.6 25.5 25.5 26.8 25.2
pH 2hr 7.4 7.31 8.34 7.97 8.11
2hr Reactor
Temp
19.6 18.5 20 20.6 19
2hr COD
(mg/L)
1141.5 2000 1794.5 1036.25 991.5
2hr Nitrate
(ppm)
0.712 0.7 0.779 0.639 0.815
2hr Nitrate
Temp ( C )
25 26.6 25.6 26.4 23.6
2hr 30min
COD (mg/L)
987.5 2012.75 1716.5 1925.25 1008.25
2hr 30min
Nitrate (ppm)
0.706 1.463 0.83 0.6 0.564
2hr 30min
Nitrate Temp
( C )
25 26.4 25.6 26.4 26
pH 3hr 7.66 7.34 8.4 8.08 7.98
3hr Reactor
Temp
21.4 20.6 22 22 20.4
3hr COD
(mg/L)
1070.75 2096 1520.5 1016.25 978
3hr Nitrate
(ppm)
0.639 1.147 0.493 0.7 0.675
3hr Nitrate
Temp ( C )
26 27 24.7 26.3 26.1
Start MLVSS 2754 2502 2168 2502 2502
End MLVSS 1400 1202 1430 1396 1224
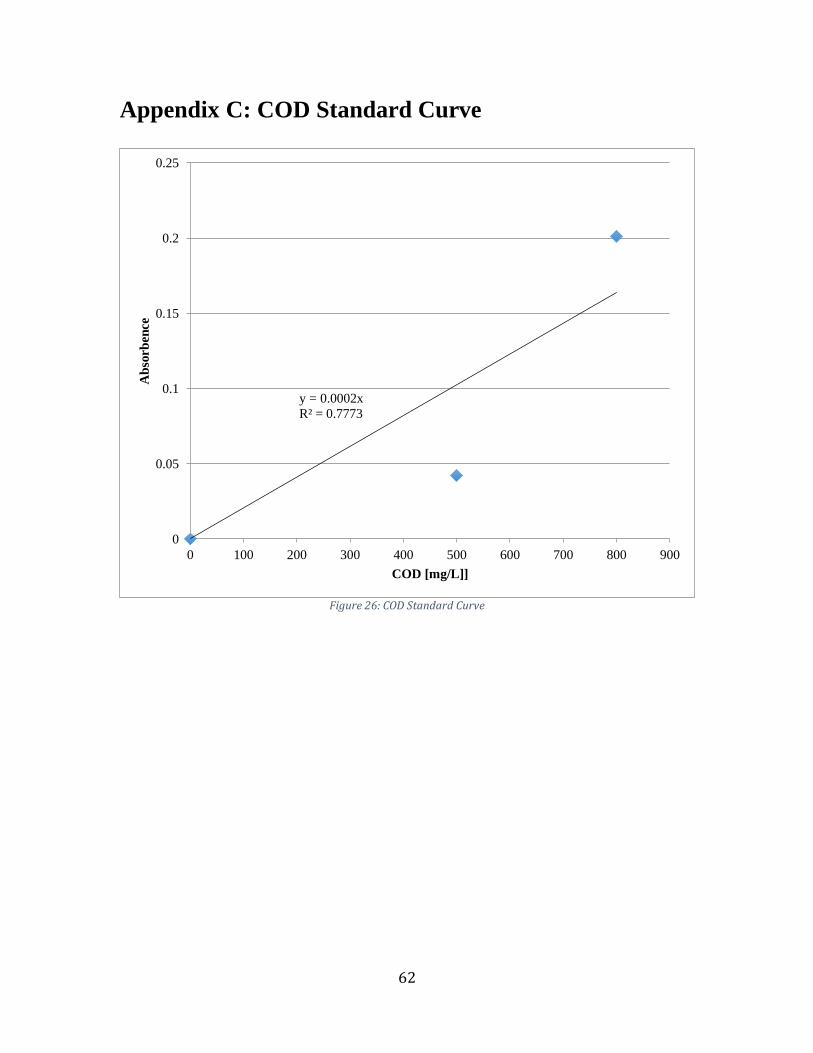
62
Appendix C: COD Standard Curve
Figure 26: COD Standard Curve
y = 0.0002x
R² = 0.7773
0
0.05
0.1
0.15
0.2
0.25
0 100 200 300 400 500 600 700 800 900
Ab
sorb
en
ce
COD [mg/L]]
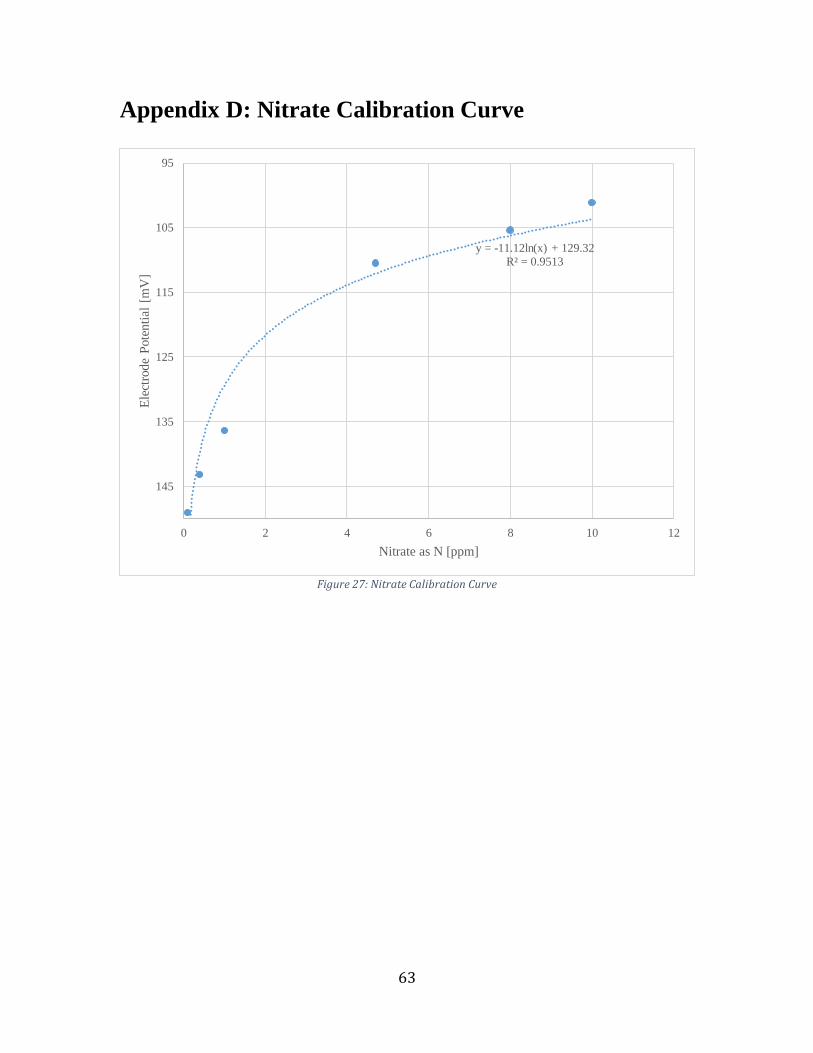
63
Appendix D: Nitrate Calibration Curve
Figure 27: Nitrate Calibration Curve
y = -11.12ln(x) + 129.32
R² = 0.9513
95
105
115
125
135
145
0 2 4 6 8 10 12
Ele
ctro
de
Pote
nti
al [
mV
]
Nitrate as N [ppm]
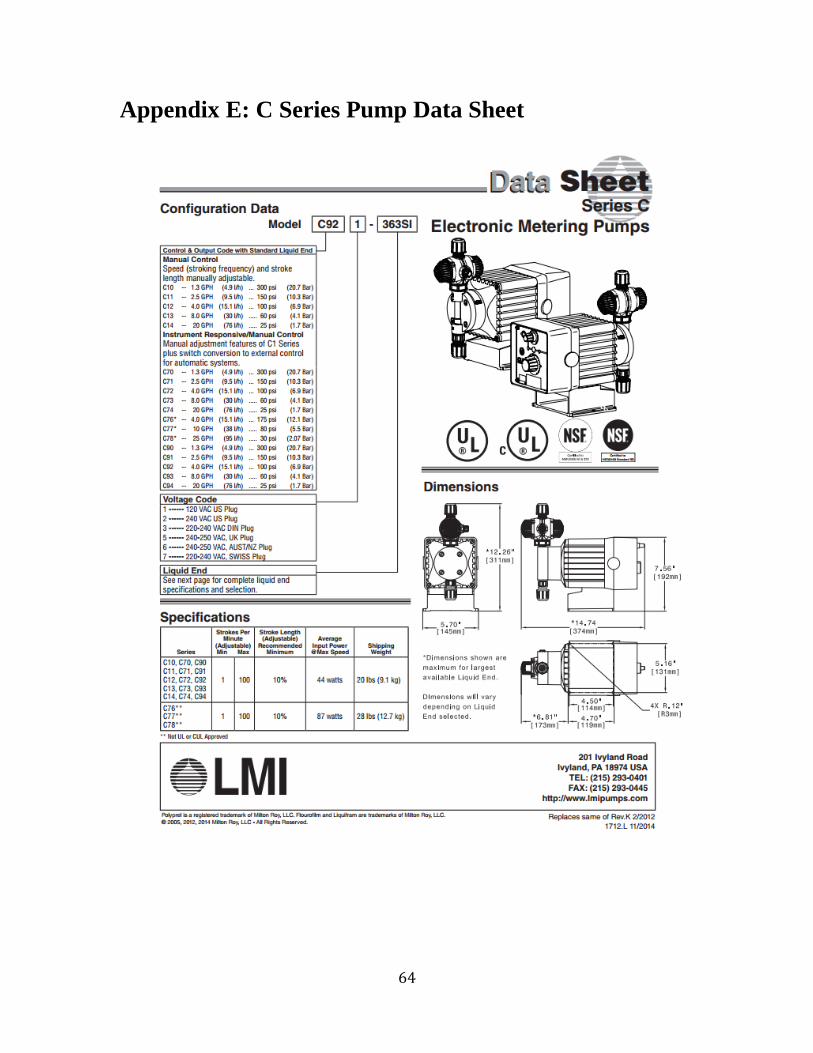
64
Appendix E: C Series Pump Data Sheet
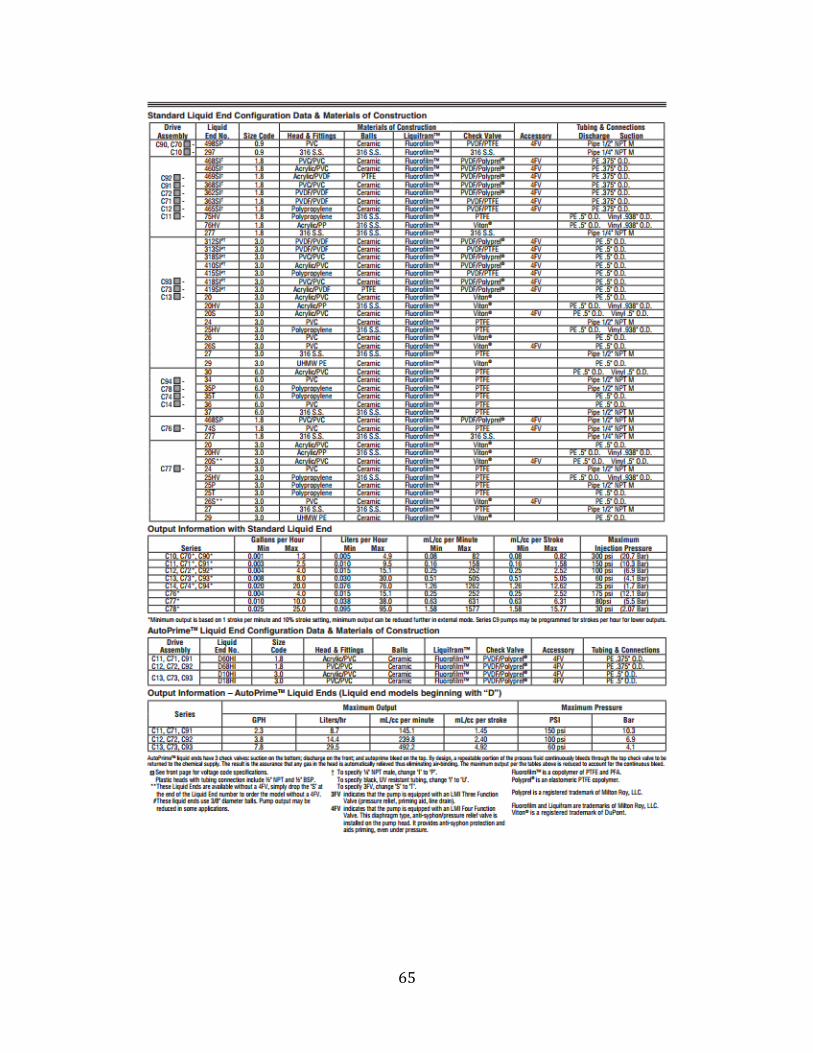
65
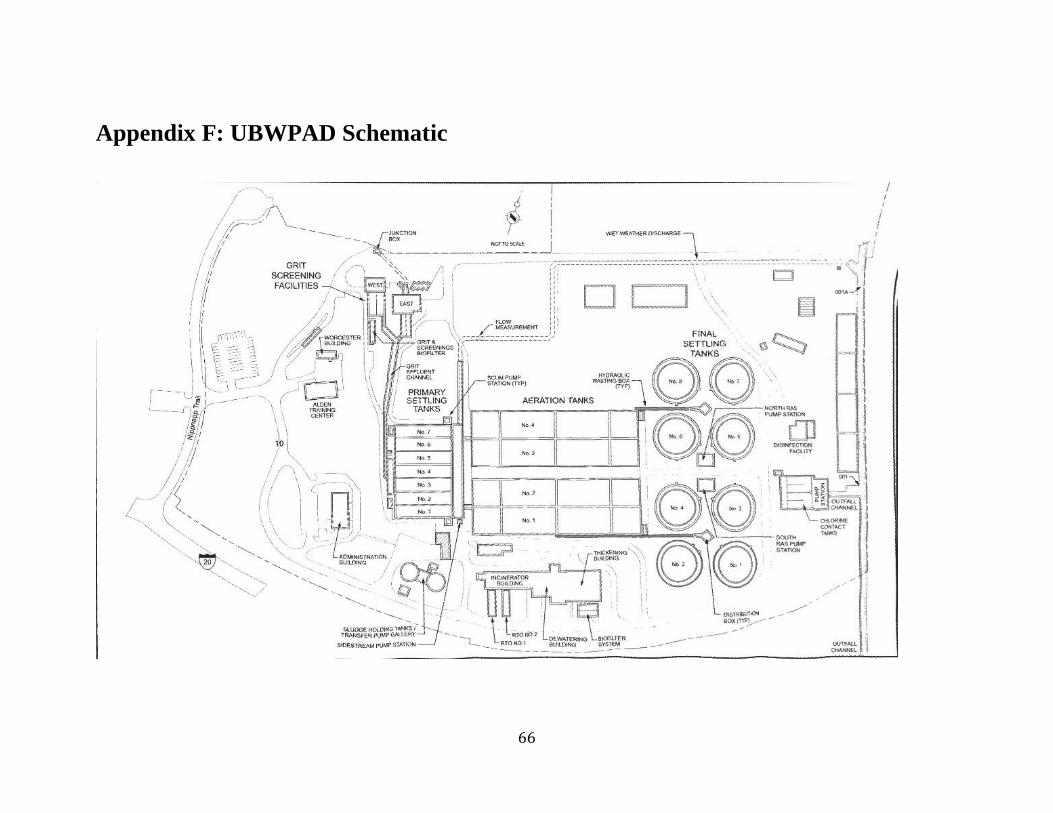
66
Appendix F: UBWPAD Schematic
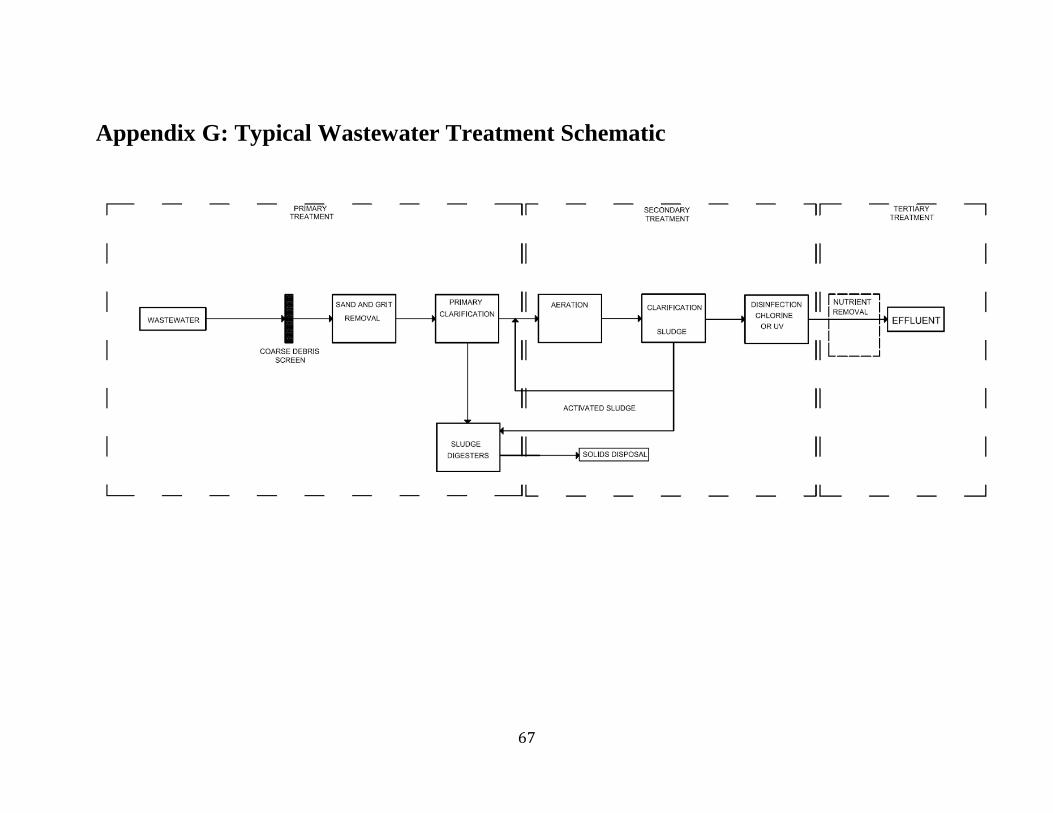
67
Appendix G: Typical Wastewater Treatment Schematic
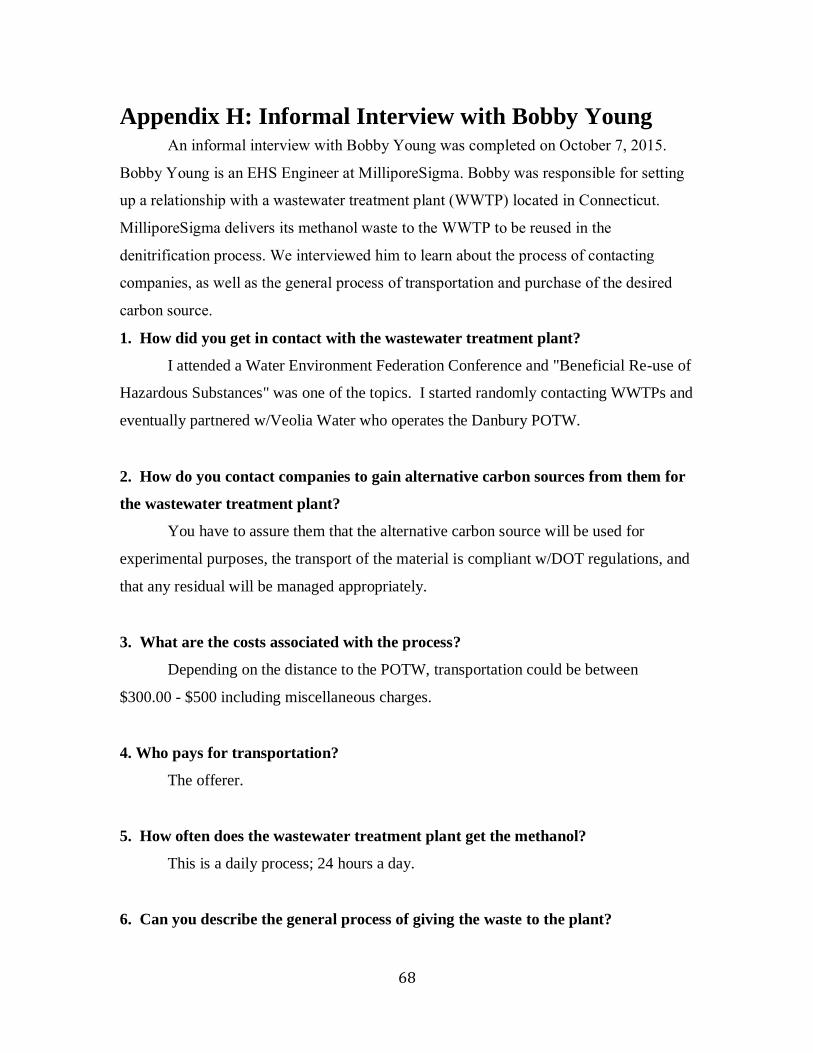
68
Appendix H: Informal Interview with Bobby Young An informal interview with Bobby Young was completed on October 7, 2015.
Bobby Young is an EHS Engineer at MilliporeSigma. Bobby was responsible for setting
up a relationship with a wastewater treatment plant (WWTP) located in Connecticut.
MilliporeSigma delivers its methanol waste to the WWTP to be reused in the
denitrification process. We interviewed him to learn about the process of contacting
companies, as well as the general process of transportation and purchase of the desired
carbon source.
1. How did you get in contact with the wastewater treatment plant?
I attended a Water Environment Federation Conference and "Beneficial Re-use of
Hazardous Substances" was one of the topics. I started randomly contacting WWTPs and
eventually partnered w/Veolia Water who operates the Danbury POTW.
2. How do you contact companies to gain alternative carbon sources from them for
the wastewater treatment plant?
You have to assure them that the alternative carbon source will be used for
experimental purposes, the transport of the material is compliant w/DOT regulations, and
that any residual will be managed appropriately.
3. What are the costs associated with the process?
Depending on the distance to the POTW, transportation could be between
$300.00 - $500 including miscellaneous charges.
4. Who pays for transportation?
The offerer.
5. How often does the wastewater treatment plant get the methanol?
This is a daily process; 24 hours a day.
6. Can you describe the general process of giving the waste to the plant?
69
First there is bench top study, the WWTP or their contractors will pay for or
complete the study. They will benefit economically from the use of the material. There
are recycling permits that have to be completed w/the State you ship from and approval
to receive by the State you ship to (if out of state).
7. Did you encounter any obstacles when setting this up?
Out of state approval; long process...
8. Do you have any advice for us when setting up a similar system with the Upper
Blackstone wastewater treatment plant?
Do as much research as possible to determine cost of virgin carbons sources, cost
for hazardous waste disposal, etc., volume generated, cost savings for WWTP and
Generator of Hazardous Waste, and negotiate fair credit to Generator compared to cost
savings by WWTP.