Embed Size (px)
Citation preview
1
All in the Family
State Capture in Tunisia
Bob Rijkers1 Caroline Freund2 Antonio Nucifora1
Abstract: We examine the relationship between entry regulation and the business interests of
President Ben Ali’s family, using firm-level data from Tunisia for 1994–2010. Connected firms
outperform their competitors in employment, output, market share, profits, and growth. Sectors in
which they are active are disproportionately subject to authorization requirements and foreign direct
investment restrictions. Performance differences between connected firms and their peers are
significantly larger in regulated sectors. New entry regulations are introduced at a higher frequency in
Ben Ali dominated sectors and when connected firms enter. The results show that Tunisia’s
investment code was abused to enrich the ruling family.
Key words: Regulation, Cronyism, Corruption, Rent-Seeking, Firms
JEL Codes: L25, L50, L51, O25
1 The World Bank, 2 Peterson Institute for International Economics. Disclaimer: The findings, interpretations, and conclusions expressed in this paper are entirely those of the authors. They do not necessarily represent the views of the International Bank for Reconstruction and Development/World Bank and its affiliated organizations, or those of the Executive Directors of the World Bank or the governments they represent. We would like to thank Leila Baghdadi, Caroline Duclos and Mirvat Sewadeh for exceptional research assistance and the Tunisian Institut National de la Statistique for their help creating the dataset on which this paper was based, as well as for their generous hospitality to host us for many months. We owe gratitude to Rebekka Grün and Melise Jaude for helping negotiate data access. We also thank Leila Baghdadi, Shanta Devarajan, Simeon Djankov, Ishac Diwan, Ray Fisman, Phil Keefer, Ann Harrison, Stuti Khemani, Mustapha Nabli, Mustapha Rouis, and seminar participants at the World Bank and the International Monetary Fund for useful comments.
2
1 Introduction
The potential for regulatory abuse is well known. Countries with more cumbersome entry
regulations have higher levels of corruption and lower levels of development, yet do not have better
public goods (Djankov et al., 2001, Aedes and di Tella, 2007). While these patterns may in part be
explained by limited administrative capacity in developing countries (Harrison and Rodriguez-Clare,
2010), they might also be the product of political processes susceptible to capture by special
interests. Consistent with this conjecture, political connections account for significant market value
in traded firms (Fisman, 2001) and are especially prevalent in countries with weak rule of law (Faccio
et al., 2006). Nonetheless, direct empirical testing of the hypothesis that capture and manipulation of
investment laws is a mechanism for rent creation remains elusive in spite of in-depth theoretical
analysis of the nexus between corruption, rents, and regulation (see e.g. Stigler 1971, Shleifer and
Vishny, 1993, 1994, Bliss and Di Tella, 1997, Ades and Di Tella, 1999, Acemoglu and Verdier,
2000).
This paper examines the relationship between the business interests of President Ben Ali and
his family and the evolution of regulations on business entry in the Tunisian Investment Incentives
Code, Code d’Incitations aux Investissements (hereafter referred to as the investment code), during the
last decade and a half of Ben Ali’s tenure. The investment code is the main investment legislation
governing economic activity in virtually all sectors of the economy with the exception of mining,
finance and domestic commerce. Two clauses in the code restrict investment in some sectors,
notably (i) authorization requirements obliging investors to obtain permission from the government
to run a business, and (ii) restrictions on Foreign Direct Investment (FDI). These regulations are
susceptible to abuse, as they can create market power by stifling competition both from prospective
entrants and incumbents, and/or steer foreign funds to particular incumbents.
To assess the relationship between entry regulations and potential state capture, this paper
assembles a unique database on political connections, firm performance and entry regulation. To
characterize the Ben Ali family’s business interests, we identify in the Tunisian firm census 220 firms
owned by the Ben Ali family that were confiscated in the aftermath of the Jasmin revolution.1 We
merge these data with administrative data from the tax authorities, containing balance sheet
1 As the firms are directly linked to the Ben Ali family, we use “Ben Ali firms” and “connected firms” interchangeably to refer to these 220 firms.

3
information, which allow us to assess firm performance. To examine how firm performance relates
to regulation, we create a database documenting the presence and evolution of entry restrictions
ordained in the Investment Incentives code between 1993 and 2010, the last full year of Ben Ali’s
tenure, which we merge with the firm-level data.
The resulting dataset enables us to test the hypothesis that entry regulation is used to
generate rents, which are reaped by politicians themselves, as public choice theory predicts (Stigler,
1971, Peltzman, 1976, McChesney, 1987, De Soto, 1990, Shleifer and Vishny, 1993, 1998). We do
this in three steps. First, we pinpoint the sectors in which Ben Ali firms were active and assess
whether they were more likely to be subjected to (i) authorization requirements and (ii) restrictions
on foreign direct investment. Second, we document performance differentials between firms owned
by the Ben Ali family and their competitors, and examine to what extent these are explained by
regulatory restrictions limiting entry. Finally, we assess whether sectors in which Ben Ali firms were
active were significantly more likely to be subjected to new restrictions, effectively testing the
endogeneity of regulations, i.e. state capture. Decision-making authority over investment laws can be
attributed to Ben Ali since changes to the Investment Code were made by decrees signed by the
President himself. Thus, we not only examine whether regulations invite rent seeking, but also
whether rent seeking is associated with the proliferation of regulation.
Tunisia provides a pertinent case study to assess the link between regulation and state-
business relationships. It resembles many other developing countries in having a development
strategy predicated on relatively extensive state intervention. The Ben Ali family’s involvement in
the economy was well known, and Tunisia’s investment promotion agency advertised his close
interactions with the business community as enhancing public welfare. In part because Tunisia
registered stable positive growth rates hovering around 4–5% per annum, Ben Ali also had a fairly
favorable external image. The World Economic Forum repeatedly ranked Tunisia as the most
competitive economy in Africa and the IMF as well as the World Bank heralded Tunisia as a role
model for other developing countries. Yet, the Tunisian model had serious flaws; unemployment
and corruption were high over the period studied, and contributed to Ben Ali’s downfall. Last but
not least, Tunisia has a high-quality firm census, and authorities willing to grant access to data on
both firm performance and political connections.
The first step in the analysis is showing the importance of Ben Ali firms in the Tunisian
economy and the link with entry regulations. Connected firms appropriated 21% of all net private
4
sector profits and accounted for approximately 3% of private sector output.2 Connected firms were
more likely to operate in sectors subject to prior authorization by the government and to restrictions
on foreign investment.
Second and related, Ben Ali firms outperformed their competitors in terms of employment,
output, market share, and profits, as well as growth in these variables and did so especially in sectors
that were subject to stringent entry regulation. Specifically, controlling for firm characteristics, such
as size and age, broad industry fixed effects, connections, and entry regulation, we find that the
interaction between Ben Ali connections and entry regulation is associated with higher employment,
output, market share and profits. If Ben Ali family members were better managers or took over
firms that performed better, but did not abuse regulatory control, the interaction terms would not be
significant. The effects are economically meaningful. Even after controlling for its superior size, the
market share of a typical Ben Ali firm was 6.3 percentage points higher than the average non-
connected firm, and this conditional differential is entirely due to Ben Ali firms sorting into sectors
in which entry is regulated. The superior performance of connected firms is suggestive of state
capture (Stigler, 1971).
Finally, we present evidence consistent with the hypothesis that the Ben Ali clan
manipulated investment laws to further its own business interests. Although the number of
observations is limited, the correlation between the presence of connected firms, entry restrictions
and protectionism was present in the original code enacted in 1993. In addition, the probability of
reforms to investment laws promulgating in additional restrictions on entry is significantly higher
when Ben Ali firms are present, and the null hypothesis of no correlation between Ben Ali presence
and the introduction of authorization requirements and FDI restrictions is strongly rejected.
Moreover, the start-up of new Ben Ali firms is significantly correlated with the imposition of new
authorization requirements and FDI restrictions.
2 Since we identify only firms with direct links to the Ben Ali family, as opposed to all firms with cultivated connections,
this number is probably best interpreted as a lower bound on the importance of political connections. These estimates
are in line with previous studies of the economic significance of connected firms. For example, in his study of firms with
connections to the Suharto regime, Fisman (2001) observes that the 25 business groups he identifies account for
approximately a third of Indonesian GDP. Similarly, Ferguson and Voth (2008) argue that firms with ties to the Nazi
regime accounted for three quarters of stock market capitalization in Nazi Germany. A key difference with these studies,
which have focused on publicly listed firms, is that we focus on the universe of firms and exclusively on firms with
family ties to the Ben Ali regime.
.

5
These findings contribute to the literature in a number of ways. To start with, to the best of
our knowledge this is the first paper to document micro-economic evidence demonstrating how
entry regulations can be a vehicle for state capture, thereby supporting earlier theoretical work on
the nexus between regulation and corruption (Schleifer and Vishny 1993, 1998, Helmann et al.,
2000) and complementing cross-country studies of the relation between regulation, corruption, and
economic performance cited above. Second and closely related, it contributes to the growing
literature on the political economy of reform by furthering our understanding of the emergence and
persistence of suboptimal policies (see the discussion in Rodrik, 1996), and suggesting these may be
endogenous to cronyism. Third, by focusing on the relationship between regulations and political
connections, our results help explain why political connections have been so highly valued (see e.g.
Fisman, 2001, Faccio, 2006, Ferguson et al, 2008). We assess empirically the importance of the
creation of market power as a mechanism through which they may impact macroeconomic
performance.3 Fourth, the paper aids our understanding of the causes of the Arab Spring. Among
the complaints common to all Arab Spring protests are the established system of cronyism, which
rewarded an elite few, and a demand for social justice. While media reports abound, very little
quantitative information exists on the prevalence and economic significance of state-business
relationships in the region with the notable exception of Chekir and Diwan, (2012), who study listed
firms with political connections in Egypt.
The remainder of this paper is organized as follows. The next section describes our data and
briefly reviews Tunisian investment law. A description of the economic activities of the Ben Ali
family is provided in section three. It also presents descriptive statistics demonstrating that firms
owned by the Ben Ali family much larger and produced much more output per worker than their
competitors, and that they were more likely to operate in sectors subject to authorization
requirements and FDI restrictions. Section 4 shows that these performance differences were
especially pronounced in sectors where such entry regulations were present. Section 5 shows
evidence that suggests that Ben Ali manipulated the investment laws to benefit his business interests.
Conclusions and policy implications are discussed in section 6.
3 Connected firms have been demonstrated to benefit from privileged access to finance (Claesens et al., 2008) including
bailouts (Faccio et al., 2006), as well as capital controls (Johson and Mitton, 2001) and licensing arrangements (Mobaraq and Purbasari, 2006) limiting competition.
6
2 Data
2.1 Identifying the Business Interests of the Ben Ali Family
In the aftermath of the Tunisian revolution, assets of the Ben Ali clan were confiscated. The
confiscation process, ordained by the new government by means of a decree (notably Décret-loi n°
2011-13), involved 114 individuals, including Ben Ali himself, his relatives and his in-laws, and
concerned the period from 1987 until the outbreak of the revolution. The seized assets included
some 550 properties, 48 boats and yachts, 40 stock portfolios, 367 bank accounts, and
approximately 400 enterprises (not all of which operate in Tunisia). The confiscation commission
estimates that the total value of these assets combined is approximately 13 billion USD, or more
than one-quarter of Tunisian GDP in 2011.
We obtained a list of 252 of the most important confiscated firms from the Tunisian
authorities and use this list to identify the Ben Ali family’s business interests. The list covers firms
confiscated up until December 2012, including a number of very prominent firms such as Orange
Tunisia, Tunisiana, Carthage Cement, ENAKL auto-industries, and the International School of
Carthage. We were able to identify 220 firms as being politically connected in the Tunisian Business
Register, the Repertoire National des Enterprises (RNE), an annual census containing information on the
size, age, location and legal form of all private-non-agricultural registered firms in Tunisia, including
one-person firms without paid employees. For 202 firms the identification of firms in the Repertoire
was based on their tax identification number. For an additional 18 firms whose tax identification
numbers we did not obtain, identification was based on their name. Among the 220 firms identified
in the RNE, for six firms data were missing altogether, such that the effective sample is 214, but
many of these firms are very small. For example, 100 connected firms did not hire wage workers
during the period under consideration. A major advantage of using data from the confiscation
commission is that there is no ambiguity as to whether these firms were indeed politically connected
to the president.
As is depicted in Figure 1, which presents an aggregated family tree of the Ben Ali family and
its business interests, the confiscated firms we identify can be crudely classified as belonging to Ben
7
Ali’s children and their in-laws, Ben Ali’s siblings and their children, as well as the siblings of his
second wife, Leila Trabelsi, and their children.4 Ben Ali’s children and their in-laws, particularly from
his marriage with Leila Trabelsi, had extensive business interests. His daughter Nesrine and her
husband Sakhr El Matri had ownership connections to 34 of the confiscated firms we obtained data
on, including car dealership ENAKL, radio station Radio Zitouna and telecommunications company
Zitouna Telecom. The Trabelsi family members jointly owned more than half of all the confiscated
properties in our database. The list illustrates that the Ben Ali clan’s business interests were
extensive, diverse and concentrated in the hands of a relatively small group of entrepreneurs.
2.2 The Firm-level Data
To assess the macroeconomic significance of Ben Ali’s business interests and performance
differences between connected and non-connected firms, the Tunisian firm census for the period
1996–2010 was merged with confidential data from the tax authorities that contain information on
gross output and profits, which we obtained from the Ministry of Finance for the period 2000–
2010.5 While these administrative data contain information on a limited set of firm characteristics
only, lacking inter alia data on capital and investment, their coverage is comprehensive: A unique
aspect of the Tunisian firm census (RNE) is that it spans the universe of private sector firms. In
2010, the RNE contained information on 102,660 firms with employees and an additional 501,746
firms without paid employees (e.g. the registered self-employed). This enables us to pinpoint which
sectors connected entrepreneurs sorted into and how they performed relative to their competitors.
In addition, the database enables us to follow the same firms over time, track entry and exit, and
avert survivor bias. Moreover, the quality of the employment data is high.6 By contrast, data on
turnover and profits are missing for approximately a third of all firms. Officials confirmed that the
data at our disposal covered all firms for which such information is available. The majority of firms
4 The dataset we assembled at the Institut National de la Statistique to analyze performance differences between
connected and non-connected firms was anonymized; political connectedness was identified using a binary dummy variable indicating whether firms were on the list of firms we obtained from the Tunisian authorities; the anonymized data provide information on conventional firm characteristics such as size, age and sector, but do not contain the names and locations of firms in order not to violate laws governing dissemination of statistics. 5 Data for earlier years were not available since by law the Tunisian ministry of Finance is required to delete data more than ten years old. 6 For example, a comparison of the employment numbers obtained from the RNE with those documented in the labor force survey suggest that underreporting of labor is quite low, typically on the order of 10-15% (Rijkers et al., 2014).
8
for which information is lacking are operating in the so-called ‘regime totalement exportatrice’,
commonly referred to as the offshore sector. Firms in this tax regime do not have to pay output tax,
provided they export at least 70% of their output. As a consequence, tax inspectors have limited
incentives to verify the accuracy of their declarations. We thus have to be cognizant of the
limitations of administrative data.7
2.3 Data on Entry Regulation
To examine the relationship between regulation and the performance of politically connected firms,
a data set documenting the evolution of Tunisian investment law was created, which we merge with
the firm-level data. More specifically, we code entry regulations proclaimed by the Tunisian
Investment Incentives Code (hereafter referred to as the investment code), which governs
investment in all sectors of the economy with the exception of finance, mining, energy and domestic
commerce, which are regulated by separate laws. The current investment code dates back to
December 27, 1993 (Law 93-120 of 27 December 1993) and its coverage and key provisions
concerning entry were subsequently amended by 22 presidential decrees, all of which are included in
our database.8
While the code stipulates the freedom to invest for both foreign (non-resident) and domestic
(resident) entities, it also contains a number of provisions that restrict this freedom. Two salient
such restrictions are authorization requirements and restrictions on FDI. 9 Starting with the former,
7 We did not find any evidence that the quality of reporting information varied between connected and non-connected firms. 8 More specifically, the decrees covered by our database are: Décret n° 95-1095, Décret n° 96-1234, Décret n° 96-2229, Décret n° 97-0503, Décret n° 97-783, Décret n° 98-29, Décret n° 98-2094, Décret n° 2000-821, Décret n° 2001-2444, Décret n° 2002-0518, Décret n° 2003-1676, Décret n° 2004-0008 , Décret n° 2004-1630 , Décret n° 2005-2856, Décret n° 2006-1697, Décret n° 2007-1398, Décret n° 2007-2311 , Décret n° 2007-4194, Décret 2008-3961,Décret n° 2009-2751,Décret n° 2010-825 and Décret n° 2010-2936. We do not include decrees that do not pertain to the coverage of the investment code or entry regulation. That is, we do not record decrees resulting in changes in registration requirements, customs regulations, fiscal advantages, etc. 9 In addition to containing provisions regulating entry and FDI, the code also contains a myriad of clauses concerning taxation and the provision of fiscal incentives.These include fiscal incentives to promote R&D, SME development, regional development, environmental protection, international trade and agricultural upgrading. While the specificity and complexitiy of these incentives renders it challenging to analyze them in a comprehensive manner using econometric methods, our exploratory foray into this interesting area for future research is suggestive of substantial abuse of fiscal incentives. For example, Décret n° 2010-3116 stipulates that the ministry of transport will contribute towards the financing of 15 kilometers of railway to connect Carthage Cement’s production facility at Jebel Ressas Mornag to the railroad network.

9
for a number of activities one needs to obtain prior authorization from the government in order to
be able to operate legally; i.e. one needs to apply for operating permits. Examples of such activities
include fishing, tourism (travel agencies), air transport, maritime transport and road transport,
telecommunications, education, the film industry, real estate, marketing, and health related
industries.
Authorization requirements enable the government to regulate entry and impact market
structure and competition. Since both prospective entrants and incumbents need to be authorized in
order to operate, this instrument could be abused both to deter prospective entrants and to stifle
competition from existing firms. Anecdotal evidence suggests this happened in the case of the
closing of the Bouebdelli School, a highly respected private school from which many of Tunisia’s
elite have graduated. This school was perceived to be in direct competition with the International
School of Carthage, which was founded by Ben Ali’s second wife, Leila Ben Ali. In spite of
widespread public protests, the Minister of Education ordered the school to close for failure to
comply with registration regulations.10
Second, the investment code stipulates a number of activities for which foreign firms need
to obtain permission from the Investment Commission (Commission Superieure d’Investissement - CSI),
which is chaired by the Prime Minister, to invest when their foreign equity exceeds 50% of capital,
notably transport, communications, tourism, education, cultural production, entertainment,
construction, real estate, computer services, and a select number of other services. Obtaining
permission is difficult. According to a recent review of Tunisia’s Investment Policies by the OECD,
since 2005, the CSI has been processing between two and three applications per year with roughly
half of all applications being successful (OECD, 2012). The list of sectors subjected to restrictions
on foreign investment overlaps considerably, but not perfectly, with those that are subjected to
government authorization.
The resulting restrictions on foreign entry likely limit foreign competition and can also be
used to direct foreign funds to certain domestic firms, as was exemplified by McDonald’s failed
attempt to enter the Tunisian market. Their exclusion was allegedly due to their reluctance to grant
10 Wikileaks cables 09TUNIS372_a and 07TUNIS1489-a: see https://wikileaks.org/plusd/cables/09TUNIS372_a.html, https://wikileaks.org/plusd/cables/07TUNIS1489_a.html, accessed February 23, 2013.
10
the sole license to a franchisee with family connections. The government of Tunisia in turn refused
to grant authorization to invest. 11
The list of activities that are subject to authorization requirements and FDI has evolved over
time, as it has been supplemented and amended by 22 subsequent presidential decrees, resulting in
73 amendments at the NAT 96 level, i.e. the 5-digit sector level, which is the most disaggregate
industrial classification available in Tunisia. We test whether amendments were plausibly due to
manipulation of the investment law by the Ben Ali clan. A major advantage of our strategy is that all
these decrees were issued by the president, which enables us to confidently attribute decision making
authority to Ben Ali himself.
While statistical power is limited due to the relatively small number of observations on both
connected firms and regulatory changes, we document a few instances of striking simultaneity
between regulatory changes and deployment of business activities by clan members. For example,
Décret n° 96-1234 issued in 1996 amended the investment code by introducing authorization
requirements for firms engaging in the handling and transfer of goods in ports, and the towing and
rescue of ships. The decree also introduced restrictions on FDI for firms involved in the transport
of red meat. That same year, Med Afif Chiboub, uncle of Ben Ali’s son-in-law Mohammed Slim
Chiboub, established “La Mediterraneene pour le Commerce, le Transport et la Consignation” a
shipping and logistics company focused on the transport of refrigerated products. As another
example, the establishment of “Carthage Cement” by Belhassen Trabelsi, the brother of the
president’s second wife, followed on the heels of Décret n° 2007-2311 stipulating the need for
government authorization for firms producing cement.
One issue we faced was matching the activities listed in the Investment Code to specific 5-
digit sectors, which do not perfectly overlap. In some cases, the Investment Code provides a more
detailed description of activities, whereas in others, the code is more general than the Tunisian NAT
96 classification that we use. With the help of officials at the Tunisian INS, we create a
correspondence between activities and sectors, but in some cases multiple activities were mapped to
the same sector and vice versa.12 As a consequence it is possible for some sectors to be subjected to
11 Wikileaks cable 08TUNIS679_a, https://wikileaks.org/plusd/cables/08TUNIS679_a.html, accessed February 23, 2013. 12 A detailed mapping from activities to sector codes was constructed in collaboration with the Tunisian Institut National de la Statistique and is available from the authors upon request. The correspondence we developed was not fully
11
several regulations of the same kind.13 These issues are discussed in more detail in Appendix B2,
which provides more detail on the creation of the regulation data.
3 Descriptive Statistics: Excess Profits and Strategic Sorting
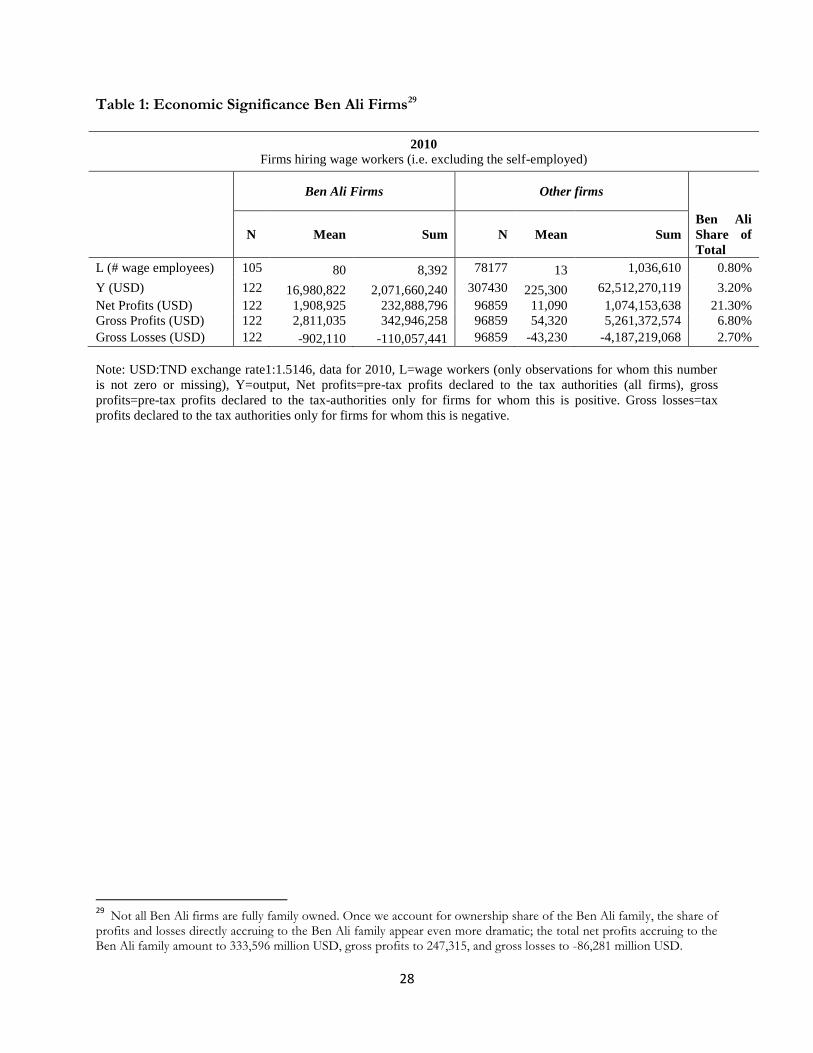
Ben Ali firms are important from an aggregate economic point of view. Descriptive statistics
presented in Table 1 show that in spite of accounting for less than 1% of all wage jobs, Ben Ali
firms (which are either partially or fully family owned) produce 3.2% of all private sector output, and
obtain 21.3% of all net private sector profits, although it should be noted that this is in part due to
many firms reporting losses; when only firms reporting positive profits are considered, Ben Ali firms
account for 6.8% of all profits. Profits are measured as operating profits declared to the tax
authorities.14 These numbers are perhaps best interpreted as a lower bound on the total profits
accruing to politically connected firms because we only obtained information on the firms most
closely linked to the Ben Ali family.15
Table 2 presents additional descriptive statistics both in levels and de-meaned by 2-digit and
5-digit sector averages (the right hand columns). We exclude firms that never report hiring workers,
i.e. the self-employed, in order not to bias the comparison and to minimize the impact of non-
reporting.16 On average, Ben Ali firms are significantly larger in terms of employment and output
and produce higher levels of output per worker, even after sorting is controlled for by subtracting
sector averages. They also report higher profits, though the difference with profits reported by non-
exhaustive; a handful of activity descriptions, such as “exporting activities” were too generic to match to particular subsectors. 13 The analysis presented here relies on binary indicators of regulation. In robustness checks not presented here to conserve space but available upon request, we experimented with using the number of regulations pertaining to a particular sector as a measure for regulatory density instead. The results we obtain using this alternative proxy are very similar to using the simpler binary proxy. 14 For a subset of firms, we were able to identify which share of the firms was owned by the Ben Ali family, which allows us to estimate the share of profits and losses directly accruing to the Ben Ali family. The resulting estimates are large; the total net profits accruing to the Ben Ali family amount to 333,596 million USD, gross profits accruing to them to 247,315 million USD and gross losses to -86,281 million USD, respectively; 25.5% of overall net profits, 4.4% of gross profits and 2.0% of gross losses, respectively). 15 Moreover, there might be many firms that benefit from cultivated, as opposed to family, connections with the ruling elite. 16
This leads us to exclude exactly 100 connected firms and just under 80% of the non-connected firms. In spite of accounting for just under a third of all jobs, self-employment only accounts for 2% of all output. The qualitative patterns of results we document are robust to using the full sample of firms and available upon request but not presented here to conserve space.
12
connected firms is not statistically significant. Interestingly Ben Ali firms are significantly more likely
to report losses than non-connected firms. The group of Ben Ali firms is highly heterogeneous in
other dimensions as well.
Analyzing growth differentials is complicated by the presence of substantial measurement
error and survivor bias since our identification of political connectedness hinges on firms surviving
up until 2011. Nonetheless, taken at face value the descriptive statistics presented in Table 2 suggest
that Ben Ali firms expand employment and output faster. Their faster growth in labor usage is not
matched by a corresponding increase in output, however, such that they exhibit significantly lower
growth in output per worker. Ben Ali firms also do not experience significantly faster growth in
profits, and record significantly lower growth in profits per worker.
Crucially, connected firms are more likely to operate in sectors which are subject to
restrictions on entry; 64% of Ben Ali firms are in sectors subject to authorization requirements and
64% in sectors subject to restrictions on FDI. For non-Ben-Ali firms the comparable numbers are
45% and 36%, respectively.17
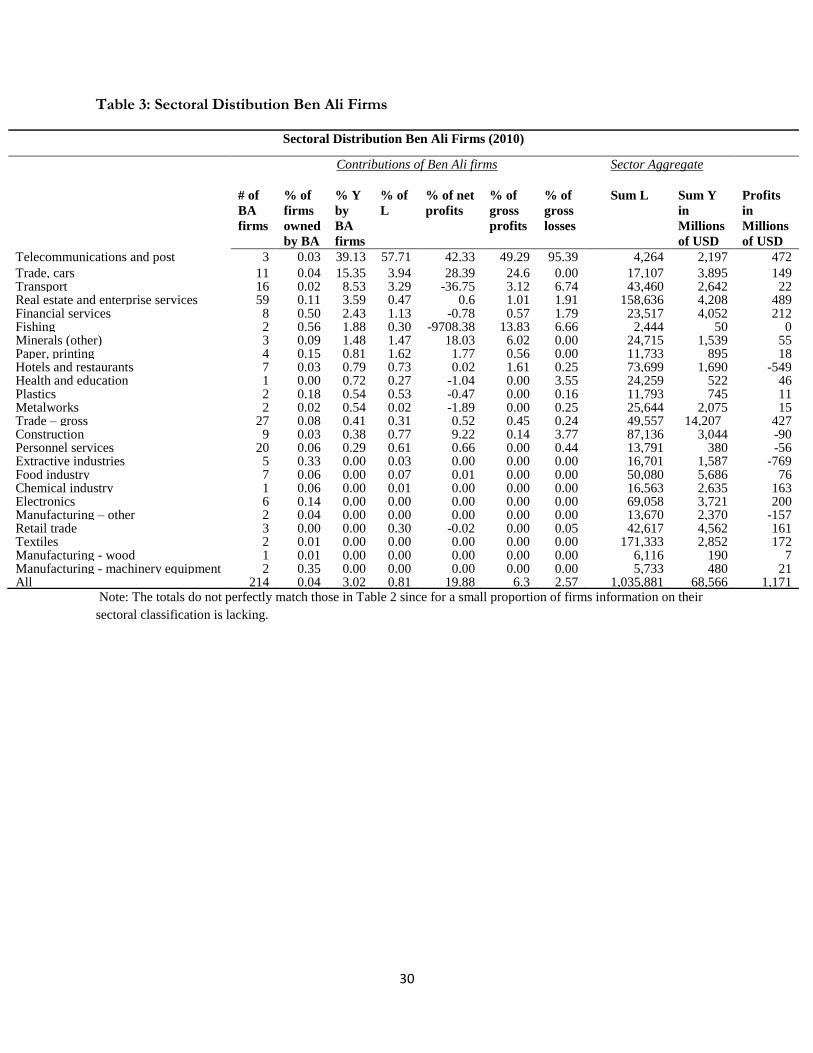
Table 3 provides a broad overview of activities deployed by Ben Ali firms and documents
the average share of output, employment and profits Ben Ali firms account for across broad sectors
using the entire sample of firms (i.e. including the self-employed). Many firms are operating in the
real estate and enterprise services sectors (59 firms), personnel services (20), transport (16),
wholesale trade (15), automobile trade (11), and also construction (9), financial services (8), the food
industry (7) and hotels and restaurants (7). It is also noticeable that five firms engaged in media
activities. When one focuses instead on the shares of output, employment and profits Ben Ali firms
account for, one can see that sheer numbers are not necessarily informative about the economic
significance of firms; even though there are only three Ben Ali firms in the post and
telecommunications sector, these account for 43% of output and 44% of profits in that sector. Ben
Ali firms are also important in terms of output in the trade and transport sectors.
17 Note that the number of observations on these variables is limited to 64 for this variable because we confine attention to enterprises operating in sectors in which the investment code is binding; similarly, for the non-connected firms, where the sample is restricted to 70,259. This amounts to about 55 percent of the full sample for both connected and non-connected firms. The regressions are also confined to this group of firms. Many of the other sectors are also subject to government intervention, but not through the Investment Code.

13
These aggregate categorizations obscure large variability within broad sectors as Ben Ali
firms are often major market players that account for an important share of output, employment and
profits within specific subsectors. This is demonstrated in Table A1 in the Appendix which provides
a detailed sectoral breakdown at the 5-digit level, but only for activities in which Ben Ali firms
account for more than 10% of all firms, output, employment, gross profits or net profits in case
sector aggregate net profits are positive. It also includes sectors in which more than five Ben Ali
firms are operating. The Table unveils that the airline industry and telecommunications were
dominated by Ben Ali firms.
4 Accounting for Performance Differentials: Why Are Ben Ali Firms More Profitable?
Now that we have established that Ben Ali firms operate in sectors which are more likely to be
subject to restrictions on entry, are larger, produce more output per worker and grow faster than
other firms, even after we condition on their sector selection, a natural next question is: do these
regulations explain the superior performance of connected firms?
4.1 Static Performance Differentials
We next examine whether the performance differentials are the result of other firm or sector
characteristics. We then test the hypothesis that Ben Ali firms outperform their competitors when
regulatory restrictions are prevalent. Our most general estimation equation takes the form;
where Ben Ali is a dummy variable indicating whether a firm was owned by a clan member,
Regulation is a set of dummies capturing whether the specific 5-digit sector in which the firm
operates is subject to i) requirements for authorization and/or ii) restrictions on foreign investment,
14
lnL is the log of the number of paid employees, Age is a measure of firm-age, I a set of 2-digit
industry dummies that capture crude sectoral-differences, a vector of time dummies and an
outcome variable of interest for firm i .
Our main interest is the coefficient on the interaction between political connectedness and
regulation Under the null hypothesis that regulations affect connected firms and their
competitors in the same way, this coefficient should take the value 0. Under the alternative
hypothesis that regulations served family interests, one would expect a positive coefficient.
Specifically, we examine the hypothesis that regulations are associated with greater size, output,
market power, and profits for connected firms. Note that differences in general entrepreneurial
ability between connected and non-connected entrepreneurs would affect the coefficient on
connectedness, but need not impact the coefficient on the interaction term, unless these
capabilities were somehow sector-specific. A positive coefficient nonetheless does not constitute
proof of regulatory abuse; it may simply reflect Ben Ali clan’ members superior ability to navigate
the Tunisian bureaucracy. Irrespective of the cause of the performance differentials, establishing
such patterns of comparative advantage is of interest in and of itself, for rejection of the null
hypothesis suggests a lack of a level playing field.
The results are presented in Table 4, using as dependent variables, respectively, employment,
market share, output and the Z-score (standardized score) of pre-tax profits, which has the
advantages of also allowing for negative profits and reducing the impact of outliers. We estimate
four separate regressions, progressively adding explanatory variables. The first specification only
controls for whether a firm is owned by the Ben Ali family or not. The second specification adds
controls for firm size and age (except when the dependent variable is firm size), such that
performance differentials between Ben Ali and non-Ben Ali firms should now be interpreted as
being per worker.18 The third specification, which mainly serves as a benchmark, adds indicators of
regulation, notably dummy variables indicating whether i) operating in the corresponding 5-digit
sector requires “authorization” and ii) whether there are restrictions on foreign investment in that
sector. In our fourth and preferred specification, these indicators of regulation are interacted with
the dummy indicating being connected. All regressions control for 2-digit industry and year
dummies and the sample is confined to activities covered by the investment code. Only firms which
report hiring paid workers at some point during the year are included; we exclude the self-employed
18 While one would ideally also control for capital intensity, data on capital stock were unfortunately not available.
15
without employees. Also, due to lack of profits and gross output data in earlier years our sample is
out of necessity confined to the period 2000–2010.
The first specification (presented in the columns labelled (1)) confirms that Ben Ali firms are
on average dramatically larger than their peers in terms of the number of people they employ, but
especially in terms of output and profits, and that they have significantly higher market share. The
second specification shows that the superior output, profits and market share of Ben Ali firms are to
a large extent associated with Ben Ali firms employing more workers, with the coefficient on firm
size being consistently statistically significant across specifications; as expected, firms that employ
more workers produce proportionately more output, have higher market shares and make more
profits. The superior performance of Ben Ali firms is not solely due to them being larger on average.
When number of employees and firm age are conditioned on (as is done in the second
specification), Ben Ali firms still on average have 6% higher market shares (see column (2) in the top
right panel) and produce more than three times as much output as their peers (see column (2) in the
bottom left panel). They are also significantly more profitable (see column (2) in the bottom right
panel).
Turning to the results of focal interest, the superior performance of Ben Ali firms is
especially marked in sectors subject to entry restrictions.19 While all firms in sectors that require
authorization tend to employ more workers (see column (3) in the top row on the left), this is
particularly true for Ben Ali firms; the interaction term between being a Ben Ali firm and
authorization requirements is strongly statistically significant (see column 4 in the top row on the
left). Ceteris paribus, Ben Ali firms employ 137% more salaried employees than non-connected
firms in such sectors. FDI restrictions, which are associated with slightly lower average firm size
ceteris paribus, are associated with even larger size differentials between connected firms and their
competitors; the coefficient estimate implies that connected firms ceteris paribus employ 285%
more workers than their non-connected competitors when FDI restrictions are present. It is also
important to note that the coefficient on Ben Ali firms drops by more than half when the interaction
19
One concern is that these results are driven by differential tax reporting between connected and non-connected firms.
In robustness checks not presented to conserve space but available upon request we examined whether tax rates differ
between Ben Ali firms and their competitors and found no statistically significant differences in the tax rates, tax
deferrals and tax reporting. However, Rijkers, Raballand and Baghdadi (2013) show that connected firms that imported
were more likely to evade import duties, inter alia by exploiting duty suspension regimes intended to facilitate exports.

16
terms are included. Thus Ben Ali firms enjoy an especially large size dividend in sectors subject to
authorization requirements and FDI restrictions, consistent with the hypothesis that restrictions on
entry help create market power.
Moreover, differences in market share and output between connected firms and non-
connected firms associated with authorization requirements and FDI restrictions are statistically
significant even after the superior size of connected firms in these sectors is controlled for; entry
restrictions are not only associated with a size premium but also with output and profit premia. The
output of Ben Ali firms exceeds the output of non-connected firms in sectors requiring
authorization by 205% ceteris paribus, while their market share exceeds that of non-connected firms
in such sectors by 4 percentage points on average (see column 4 in the top row on the right); this is a
very sizeable difference when one considers that the average market share of non-connected firms in
sectors subject to authorization requirements is 0.27%. The market share differential between
connected and non-connected firms associated with FDI restrictions is even larger, notably 6.4
percentage points, and statistically significant. Interestingly, these market share and productivity
premia associated with being connected are only significant in sectors subject to authorization
requirements and FDI restrictions; in sectors governed by the Investment Incentives Code but not
subject to these regulatory requirements, differences in market share are statistically negligible once
the larger size of connected firms is accounted for. It thus seems that their greater market share can
be attributed to entry restrictions.
Profit differentials, presented in the bottom row on the right, exhibit a similar pattern. Ben
Ali firms record higher profits than their peers in sectors subject to authorization and FDI
restrictions; these regulations thus appear disproportionately to assist the profitability of Ben Ali
firms. In sectors not subject to these restrictions, however, Ben Ali firms make significantly less
profit than their competitors ceteris paribus, which countermands the idea that Ben Ali family
members were innately better entrepreneurs across the board. One potential explanation for the
finding that Ben Ali firms are less profitable than other firms when regulations are absent but more
profitable when they are present is that inferior management on the part of Ben Ali firms that can be
offset with regulations that target their competitors.
In summary, performance differentials between Ben Ali firms and their peers are
significantly larger in sectors subject to authorization requirements and FDI restrictions. The results
17
show that these entry regulations are associated with greatly enhanced size, output, market share and
profitability of Ben Ali firms. These results are consistent with regulatory capture.20
4.2 Dynamic Performance Differences
Dynamic performance differentials are assessed in Table 5. We estimate four specifications which
are similar in set-up to those presented above; we estimate models with and without controlling for
the lagged dependent variable and use two different specifications; one that simply controls for
whether a firm is owned by the Ben Ali and one that has a full set of controls for initial conditions.
Our most general specification is
,
where we use as dependent variable, respectively, employment growth, profits growth, output
growth and changes in market share.
The results are presented in Table 5 and confirm that Ben Ali firms exhibit significantly
higher unconditional employment, market share, output and profits growth, albeit that differences in
output growth between Ben Ali firms and their competitors are only significant at the 10% level.
Once we control for initial employment, profits and output, Ben Ali firms expand output,
employment and profits significantly faster at conventional significance levels.21
Again, these performance differences vary across sectors systematically with the prevalence
of regulations, in spite of substantial measurement error. To start with, Ben Ali firms operating in
sectors subject to authorization exhibit faster growth in profits, market share as well as output,
though the latter association is only significant once initial output is controlled for. They do not
20 The qualitative pattern of the results presented in this section are robust to restricting the sample to large firms only. Results are available upon request but not presented to conserve space. 21 One might be worried that the results presented here reflect survivor bias since the connected firms in our sample all survived up until 2011, but such bias turns out to be small in practice; In robustness tests not presented to conserve space but available upon request we have restricted the sample to firms that were all still active in 2010 (the last year of our dataset) and the pattern of results we document is qualitatively robust to excluding firms that exit before 2010.
18
record significantly higher growth in employment. Second, in sectors with restrictions on foreign
ownership Ben Ali firms expand employment, output, market share and profits significantly faster
than their competitors, irrespective of whether we control for initial conditions or not.
5 Regulation and State Capture
Given the association between the success of Ben Ali firms and entry regulation, an important
question is whether the Ben Ali family might have manipulated the Investment Code to promote its
business interests. To shed light on this question, we examine the co-evolution of the business
interests of the Ben Ali and the Tunisian Investment Code since its inception in 1993. First, we
assess whether the prevalence of entry restrictions ordained in the original code was higher in
sectors in which Ben Ali firms had already been operating. Second, we examine whether Ben Ali
firms disproportionately enter into regulated sectors. Third, we assess whether revisions to the code
were more likely when Ben Ali firms were undertaking a particular activity, and whether these
correlate with the start-up of connected firms in a given sector.
While statistical power is limited since laws evolve slowly over time, one major advantage of
examining changes in regulation is that it mitigates the risk that there is a third factor, such as high
rents, or (“natural”) market structure that drives both crony entry and regulation.22 Nonetheless, it
could still be the case that certain sectors spuriously attract both more connected firms and more
regulation. As a partial check against endogeneity of this type, it is informative to examine the timing
of Ben Ali entry and regulation; since these are statistically (relatively) rare events, one would not
expect strong simultaneity a priori, even when they occur in the same sector.
5.1 Was the Original Code Corrupted?
22 In robustness checks not presented to conserve space, we also ran regressions in which we modeled the likelihood of new regulation being introduced as a function of market concentration, profit margins, and Ben Ali presence. The results we obtained were qualitatively broadly similar to the results presented here, which cover a larger sample. Since information on profits margins and market concentration is not complete for the majority of sectors, and moreover, missing for all year prior to 2000, we instead prefer to present simple bivariate correlations for the larger sample.
19
The strong correlation between the presence of Ben Ali firms and entry restrictions was present in
the original code enacted on 27 December 1993. This is demonstrated in Table 6 which presents
information on the prevalence of entry restrictions by whether or not connected firms were present
in a particular sector, separately for 1994 (the top row), the first full year in which the current
investment laws were binding, as well as for 2010 (the bottom panel), the last full calendar year of
Ben Ali’s reign. The columns document the number of 5-digit sectors without and with Ben Ali
presence by the prevalence of authorization requirements and FDI restrictions. Fisher’s exact t-tests
are used to test the null hypothesis that the presence of Ben Ali firms and regulations are
independent of one another. This test is well-suited for small samples as it provides an exact
quantification of its power.
Of the confiscated firms in our list that were already operating before 27 December 1993,
the day the Investment Code was enacted, eight were active in sectors which were to be governed by
the Investment Code. These eight firms were spread over eight different sub-sectors,23 out of a total
of 310. While the numbers of sectors with Ben Ali presence is very small, these sub-sectors were
significantly more prone to entry regulation than the sub-sectors in which Ben Ali firms were not
active. Of the eight sectors populated by Ben Ali firms, four were subject to FDI restrictions and
four to authorization requirements. By contrast, of the 302 subsectors in which connected firms
were not present fewer than one in five (19%) were subject to authorization requirements and fewer
than one in seven (14%) were subject to FDI restrictions. Fisher’s exact t-tests strongly rejects the
null that the prevalence of authorization requirements and FDI restrictions did not vary with Ben
Ali presence at the conventional 5% significance level.
For purposes of comparison, Table 6 also presents the sectoral distribution of regulation and
Ben Ali firms in 2010. Over time, the code was expanded to include an additional 22 sectors and
both the prevalence of connected firms and regulation increased, yet the strong correlation between
Ben Ali presence and restrictions on entry persisted. 24,25
23 The subsectors were fabrication of plastic packaging, non-refridgerated warehouses, construction of large structures for) buildings, hotels and restaurants, non-regular air transport, real estate, engineering/technical studies, and services related to production. 24
Note that additional regulations were also introduced in some of the sectors in which some, but not all, activities were already regulated, but these do not show up in Table 6 since we code a sector as being regulated if at least one of the activities in it is subject to regulation.
20
5.2 Did Ben Ali Firms Enter into Regulated Sectors?
This persistence of the correlation between Ben Ali presence and regulation begs the question
whether Ben Ali firms entered into sectors that were already regulated, or whether sectors in which
Ben Ali firms were already operating were more likely to attract additional regulation. We examine
the first question here and assess the latter possibility in the next subsection.
Table 7 demonstrates evidence that Ben Ali firms disproportionately entered into sectors
subject to restrictions on foreign investment and authorization requirements. Out of a total of 129
entries of connected firms into sectors regulated by the Investment Code, more than half (57%)
were into sectors subject to FDI restrictions, while only 18% of all sectors in any given year are
subject to such regulations. In addition, 47% of all connected firms started in sectors subject to
authorization requirements which on average pertain to 24% of all sector-year observations. For
both these categories of regulation, the null hypothesis that Ben Ali entry is independent of the
presence of regulation is rejected at the 1% significance level.
5.3 Did Ben Ali Firms Change the Rules?
We analyze the evolution of the Tunisian Investment Code to assess whether Ben Ali might have
manipulated the investment code to further his family’s business interests. To this end, Table 7
summarizes changes made to the Tunisian investment code between 1994 and 2010 by means of 22
decrees issued by Ben Ali himself. These decrees introduced new authorization requirements
pertaining to 45 sectors and new FDI restrictions in 28 sectors.26 The structure of the table is similar
25 One limitation of our data is that we only observe connected firms that were confiscated in 2011; we thus do not
identify firms that went out of business or were sold before the outbreak of the Revolution. This may result in survivor
bias, though it is not a priori obvious how to sign this bias. Such bias is much less likely to afflict the 2010 data.
26 Note that because decrees pertain to activities and because sectors can span multiple activities, even at the 5 digit level, a number of sectors in which novel regulations were introduced were already partially subjected to such regulations. E.g. in 16 of the 45 sectors in which new authorization requirements were introduced at least one other activity was already prone to such requirement. Similarly, in 11 sectors in which FDI restrictions became more stringent other activities also
21
to that of Table 6; the top row cross-tabulates the prevalence of the imposition of new regulations
by the presence of Ben Ali firms, while the bottom row cross-tabulates the prevalence of legislative
changes by start-up of Ben Ali firms either in the same year or the year immediately after the
introduction of new regulations within narrowly defined 5-digit sectors, using binary indicator
variables which take the value 1 if a new regulation is introduced that pertains to the sector and 0
otherwise.27 The table thus examines both whether the probability of regulatory proliferation is
independent on the presence of Ben Ali firms (the top panel of the table), and whether the entry of
Ben Ali firms within narrowly defined 5-digit sectors is correlated with the imposition of new
restrictions pertaining to these sectors (in the bottom panel of the table). Note that the latter test
mitigates concerns about omitted variables driving a potential correlation between regulation and
family connections somewhat, since both of these events are relatively rare in our data. The
probability of them occurring exactly at the same time is very low, though this is of course not a
litmus test.
Both Ben Ali presence and Ben Ali start-up help predict the proliferation of regulation. To
start with, the null hypothesis that the imposition of new requests for government authorization to
operate is independent of the presence of connected firms is rejected at the 10% level; columns 1
and 2 show that in seven of the 45 (approximately 16%) sector-years in which new authorization
requirements were imposed connected firms were present. By contrast only in 8% of all sector-year
observations Ben Ali firms were present. The association between connected firms and the
imposition of new FDI requirements is also significant; in nine out of the 28 sector-years in which
new restrictions were imposed, Ben Ali firms were present (see columns 1 and 2). The null
hypotheses that the likelihood of the imposition of new FDI restrictions does not depend on the
presence of connected firms is rejected at the 1% significance level, as is evidenced by Fisher’s exact
t-test presented in column 5.
Table 8 also examines the correlation between the introduction of new regulations and
startup of new Ben Ali enterprises either in the year the law was revised or the year immediately
after. We use a two-year entry window to have a relatively broad definition of simultaneity, but
classified in that same sector were already prone to restrictions on FDI. Note that a total of 51 activities were subject to new authorization requirements and 36 activities were subject to new authorization requirements. 27Note that our indicator variable does not take into account regulations already in place; it is thus possible for the same NAT96 sector to be subject to new regulations multiple times over the sample period.
22
obtain similar results confining attention to entry in the same year only.28 While the number of
observations is again small, the data reject the null of independence between the startup of new Ben
Ali firms in narrowly defined 5-digit sectors and the introduction of new authorization requirements
and FDI restrictions, albeit at the 10% significance level.
The data are thus not only consistent with regulatory capture of existing legislation by
connected entrepreneurs, but also with regulatory proliferation being endogenous to their business
interests.
5.4 Discussion
The data reject the null hypothesis that the evolution of the Tunisian investment law was
independent of the business interests of the Ben Ali family, and are consistent with state capture. An
important question is to what extent our findings can be interpreted causally. Potential endogeneity
of connections (e.g. better entrepreneurs being more likely to become connected by marrying into
the family), firm performance (e.g. better firms being more likely to be captured) and regulations
(e.g. a spurious relationship between regulation and connections) are the three main challenges to
such an interpretation. While we cannot rule out any of these, there are a number of reasons to
believe that their likely empirical magnitude is limited.
To start with concerns about endogenous selection, we do not have enough degrees of
freedom to examine the effect of selection into the Ben Ali family with statistical confidence, yet the
sudden business success of those who married into the family is strongly suggestive of the superior
performance of connected entrepreneurs not solely being driven by their business acumen. For
example, Ben Ali’s son in-law, Sakr-El-Materi’s business empire grew especially rapidly after his
marriage with Ben Ali’s daughter Nesrine in 2004. Two years after marrying her he purchased
ENNAKL, a previously publicly owned car-dealership, for 22 million Dinars. Following the transfer
of ownership, the quotas for import of cars awarded to ENNAKL increased almost four-fold. In
2009 40% of the company's capital was sold through an IPO yielding 53 million Tunisian of dinars.
Sakr-El-Materi also managed to obtain permission from the government of Tunisia to establish an
28
Results are available from the authors upon request but not presented here to conserve space.

23
exclusive new cruise port in La Goulette, which he exploited using his newly founded firm Goulette
Shipping Services.
Second, anecdotal evidence suggests predation was an issue and that the Ben Ali-Trabelsi
family targeted relatively successful firms. In the case of take-overs of firms by the Ben Ali clan, part
of the superior performance of connected firms thus likely reflects prior performance differences.
Our focus on the interaction between regulations and connections should reduce this bias. If
predation was the main channel of success, there is no reason why better performance should be
associated with greater regulation. In addition, if Ben Ali’s relatives could take over the best firms
there would be no need to erect barriers to entry in sectors in which they are active. While we
would have liked to examine this potential endogeneity of firm performance in more depth through
an analysis of the impacts of takeovers by the Ben Ali clan and which firms they were targeting, in
the vast majority of cases, the connected firms we identify were started by the Ben Ali clan members
themselves. In the few cases where we are able to compare firm performance before and after Ben
Ali participation, such as the case of ENNAKL, the evolution of profits growth is inconsistent with
performance differentials reflecting endogeneity alone; A substantial number of firms become more
profitable after being included in the Ben Ali’s clan’s portfolio rather than vice versa. For example,
Carthage Cement, which was founded in 2008 by Belhassen Trabelsi as a split-off from the heavily
indebted cement firm “Grandes Carrières du Nord”, exhibited spectacular profits growth after
gaining exclusive concessions to harvest in Jbel Ressas, resulting in rapid growth of the firm.
Concerns about potential endogeneity bias are also mitigated by the conviction of Ben Ali
and several of his family members for abuse of power (though not necessarily for manipulating the
investment code itself) in the aftermath of the Jasmin Revolution. Thus, the interpretation of
regulatory capture advanced in this paper is consistent with other corrupt practices the Ben Ali clan
has been shown to engage in. The quantitative evidence we have presented also resonates with
qualitative evidence on corruption in Tunisia. According to a recent study by the Chekir and Menard
(2013), for example, “predation mainly focused on (i) highly regulated sectors in which cronies could abuse of their
influence and privileged access to the decision-making spheres” (p4).
6 Conclusion
24
Direct empirical testing of the hypothesis that business regulations serve the private interests of
those who institute them has been complicated by data limitations. To help fill this gap in the
literature, this paper assembles a unique data set to examine the relationship between the evolution
of the Tunisian investment law and the business interests of President Ben Ali’s family during the
last decade and a half before his fall. Tunisia provides a relevant case study, as it was at the forefront
of the Arab Spring, and because its development strategy was lauded by the international
community.
The Ben Ali family’s business interests were significant from a macro-economic perspective
and concentrated in sectors subject to entry restrictions. Enterprises with direct ownership links to
the Ben Ali family confiscated in the aftermath of the revolution accounted for 3% of all private
sector output and appropriated approximately a fifth of all private sector profits. Sectors in which
they operated were significantly more likely to be subjected to prior government authorization and
FDI restrictions.
Crucially, performance differences between Ben Ali firms and other firms were significantly
larger in sectors subject to authorization requirements and FDI restrictions. In the absence of these
entry regulations, performance differences between Ben Ali and other firms were much smaller or
absent altogether. Thus it appears that regulatory capture was a major conduit for rent
appropriation.
The hypothesis that the evolution of the Tunisian Investment Incentives Code was
exogenous to the president family’s business interests is rejected. Although the number of
observations is small, the correlation between Ben Ali firm presence and entry regulation was already
significant when the code was introduced. In addition, the likelihood of new FDI restrictions and
requests for government authorization being imposed in a narrowly defined 5-digit sub-sector is
correlated both with prior presence of Ben Ali firms in that sector, as well as with start-up of
connected firms.
Assessing the welfare implications of the state-business relationships documented in this
paper and extending the analysis to other policy domains, such as public procurement and
privatizations, would seem promising areas for future research.
25
7 References
Acemoglu, Daron, and Thierry Verdier, “The Choice between Market Failures and Corruption,” American Economic Review, XC (2000), 90 (1): 194–211. Ades, Alberto and Rafael Di Tella ”National Champions and Corruption: Some Unpleasant Interventionist Arithmetic,” The Economic Journal, (1997) 107: 1023-42. Ades, Alberto, and Rafael Di Tella, “Rents, Competition, and Corruption,” American Economic Review, LXXXIX (1999), 89 (4): 982–993. Bliss, Christopher, and Rafael Di Tella, “Does Competition Kill Corruption,” Journal of Political Economy, CV (1997), 105(5): 1001–1023. Chekir, Hamouda and Ishac Diwan “Distressed Whales on the Nile: Egypt Capitalists in the Wake
of the 2010 Revolution” CID Working Paper 250 (2012).
Chekir, Hamouda and Claude Menard. “Barriers to Private Firm Dynamism in Tunisia: A Qualitative Approach” Report to the World Bank (2013).
Claessens, Stijn, Erik Feijen, and Luc Laeven, "Political connections and preferential access to
finance: The role of campaign contributions," Journal of Financial Economics (2008), 88(3): 554-580.
De Soto, Hernan, The Other Path. (1990), New York, NY, Harper and Row. Djankov, Simeon; La Porta, Rafael; Lopez de-Silanes, Florencio and Shleifer, Andrei. “The Regulation of Entry.” Quarterly Journal of Economics, (2002), 117(1),1–37. Faccio, Mara. “Politically Connected Firms" The American Economic Review, (2006), 96(1): 369-386.
Faccio, Mara, John J. McConnell and Ronald W. Masulis.
“Political connections and corporate bailouts” Journal of Finance, (2006), 61(6): 2597-2635.
Ferguson, Thomas and Hans-Joachim Voth. “Betting on Hitler—The Value of Political Connections in Nazi Germany.” Quarterly Journal of Economics (2008) 123:1, 101-137. Fisman, Raymond. “Estimating the Value of Political Connections.” American Economic Review, (2001), 91(4), 1095–1102. Harrison, Ann and Andrés Rodríguez-Clare “Trade, Foreign Investment, and Industrial Policy for Developing Countries”. In Dani Rodrik and Mark Rosenzweig, editors: Handbook of Development Economics, Vol. 5, The Netherlands: North-Holland, (2010), 4039-4214. Hellman, Joel S., Geraint Jones, and Daniel Kaufmann. "Seize the State, Seize the Day." World Bank Policy Research Working Paper No. 2444 (2000). Johnson, Simon and Todd Mitton. “Cronyism and Capital Controls: Evidence from Malaysia.” Journal of Financial Economics (2003), 67(2): 351–82.
26
McChesney, Fred S., “Rent Extraction and Rent Creation in the Economic Theory of Regulation,” Journal of Legal Studies, XVI (1987): 101–118. Peltzman, Sam, “Toward a More General Theory of Regulation,” Journal of Law, and Economics, XIX (1976), 211–240. Rijkers, Bob, Raballand, Gael and Leila Baghdadi, (2013) “Political Connections and Tariff Evasion: Evidence from Tunisia” Mimeo. Rijkers, Bob, Hassen Arouri, Caroline Freund and Antonio Nucifora “Which Firms Create the Most Jobs in Developing Countries? Evidence from Tunisia”. Labour Economics (forthcoming). Rodrik, Dani, “Understanding Economic Policy Reform” Journal of Economic Literature, (1996), Vol. XXXIV, 9–41 Rodrik Dani, “Normalizing Industrial Policy” Harvard Kennedy School Working Paper (2007). Shleifer, Andrei and Robert W. Vishny. “Corruption.” Quarterly Journal of Economics, (1993), 108(3): 599–617. Shleifer, Andrei and Robert W. Vishny. “Politicians and Firms” Quarterly Journal of Economics, (1994) 109(4), 995–1025. Stigler, George J. “The Theory of Economic Regulation.” Bell Journal of Economics and Management Science, 1971, 2(1): 3–21. OECD (2012), OECD Investment Policy Reviews: Tunisia 2012.

27
Tables and Graphs
Figure 1: The Business Interest of the Ben Ali Family (# of firms in parentheses)
Note: The diagram indicates the Ben Ali clan’s alleged ownership of confiscated firms using information published
on the website of the Ministry of Finance. The diagram is confined to firms for whom we obtained information from
the Tunisian authorities and is consequently not exhaustive. The diagram merely indicates alleged ownership
relations and does not imply improper conduct of any kind on the part of the listed individuals. It should also be
noted that some of the listed individuals are currently contesting the confiscation of their assets.
Sources:http://www.finances.gov.tn/index.php?option=com_content&view=article&id=201:gestion-des-biens-
confisques&catid=28&Itemid=577&lang, Journal Officiel de la République Tunisienne, 18 mars 2011, No 18, 337-342.
Zine El Abidine Ben Ali
Children with Leila Trabelsi
and in laws (39 firms)
• Nesrine Ben Ali & Sakhr El Materi (35) • Halima Ben Ali & Mehdi Ben Gaied (4)
Children with Naima Kefi
and in laws (23 firms)
• Ghazoua Ben Ali & Slim Zarrouk (6) • Syrine Ben Ali & Marouane Mabrouk (7) • Dorsaf Ben Ali & Slim Chiboub (10)
Leila Trabelsi’s Siblings (72 firms)
• Belhassen Trabelsi & Zahra Jilani (37) • Med Adel Trabelsi & Souad Ben Jemiai (3) • Med Mourad Trabelsi & Hela Belhadj (7) • Med Ennaceur Trabelsi & Nadia Mufti (5) • Moncef Trabelsi & Yamina Souiai (5) • Jalila Trabelsi (4) • Nefissa Trabelsi & Habib Ben Zakis (2) • Samira Trabelsi & Med Montassar Meherzi (9)
Ben Ali nieces and nephews
(35 firms)
ZA Ben Ali 's Siblings (22 firms)
• Tijani Ben Ali & Paulette Ben Ali (3) • Naima Ben Ali (6) • Hayet Ben Ali (6) • Houria Ben Ali (2) • Najet Ben Ali & Sadok Mhiri (3) • Faouzi Ben Ali (2)
Leila Trabelsi (3 firms)
Trabelsi nieces and nephews
(56 firms)
28
Table 1: Economic Significance Ben Ali Firms29
Note: USD:TND exchange rate1:1.5146, data for 2010, L=wage workers (only observations for whom this number
is not zero or missing), Y=output, Net profits=pre-tax profits declared to the tax authorities (all firms), gross
profits=pre-tax profits declared to the tax-authorities only for firms for whom this is positive. Gross losses=tax
profits declared to the tax authorities only for firms for whom this is negative.
29
Not all Ben Ali firms are fully family owned. Once we account for ownership share of the Ben Ali family, the share of profits and losses directly accruing to the Ben Ali family appear even more dramatic; the total net profits accruing to the Ben Ali family amount to 333,596 million USD, gross profits to 247,315, and gross losses to -86,281 million USD.
2010
Firms hiring wage workers (i.e. excluding the self-employed)
Ben Ali Firms Other firms
N Mean Sum N Mean Sum
Ben Ali
Share of
Total
L (# wage employees) 105 80 8,392 78177 13 1,036,610 0.80%
Y (USD) 122 16,980,822 2,071,660,240 307430 225,300 62,512,270,119 3.20%
Net Profits (USD) 122 1,908,925 232,888,796 96859 11,090 1,074,153,638 21.30%
Gross Profits (USD) 122 2,811,035 342,946,258 96859 54,320 5,261,372,574 6.80%
Gross Losses (USD) 122 -902,110 -110,057,441 96859 -43,230 -4,187,219,068 2.70%

29
Table 2: Descriptive Statistics
Descriptive Statistics Ben Ali Firms vs Other firms – 2010
Excluding firms which never report hiring paid workers
Descriptive Statistics
Differentials
Ben Ali Firms Other Firms
(Total N=114)
(Total N=128397)
Demeaned
N Mean St. Dev N Mean St Dev
No 2-digit 5-digit
Static Performance x
ln L 105 2.610 1.859 78177 0.896 1.406
1.713 1.604 1.122
lnY 70 21.757 2.580 74119 18.052 2.180
3.705 3.501 1.936
ln(Y/L) 68 18.895 1.997 57060 17.561 1.464
1.334 1.098 0.572
Profits (Z-score)+ 83 0.981 10.704 49862 0.000 2.051
0.981 0.937 1.228
Profits/L (Z-
score)+
78 0.020 0.071 42749 -0.012 3.183
0.031 0.041 0.013
Profitable# 83 0.494 0.503 49862 0.663 0.473
-0.169 -0.111 -0.093
Market Sharei 83 0.063 0.175 86483 0.006 0.049
0.057 0.055 0.032
Firm Characteristics
Age 114 10.430 10.166 128397 15.155 16.942
-4.725 -4.216 -3.605
Offshore 114 0.070 0.257 126019 0.060 0.238
0.010 0.020 -0.004
Regulation
FDI Restriction* 64 0.641 0.484 70259 0.361 0.480
0.280 0.118
Authorization
* 64 0.641 0.484 70259 0.446 0.497
0.195 0.185
Growth
x
ΔlnL 96 0.239 0.845 70493 0.025 0.550
0.214 0.195 0.147
ΔlnY 63 0.121 1.331 70131 0.074 0.715
0.048 0.032 -0.042
Δln(Y/L) 58 -0.155 1.197 50733 0.030 0.715
-0.186 -0.182 -0.195
ΔProfits (Z-score)+ 83 -0.237 2.697 48179 -0.007 2.125
-0.229 -0.236 -0.215
ΔProfits/L (Z-
score)+
71 0.068 0.488 38331 -0.001 0.556
0.069 0.075 0.036
* Bolded coefficients in the last three columns indicate that the differential between Ben Ali and non-Ben Ali firms
is significant at the 10% level. Bolded and underlined coefficients in the last three columns indicate that the
differential between Ben Ali and non-Ben Ali firms is significant at the 5% level. x Sample is confined to firms that reported hiring paid labor at some point during 2000 and 2010.
+Note to account for negative profits and minimize the impact of outliers we use the Z-score the variable in question
computed over the period 2000-2010. i Market share is measured at the 5 digit level.
#Profitable is a dummy variable taking the value 1 if a firm reports positive profits and 0 otherwise.
*FDI Restriction and Authorization are dummy variables indicating whether the particular 5 digit sub-sector the firm
operates in is subject to the regulation in question, taking the value 1 if this is the case and 0 otherwise.
30
Table 3: Sectoral Distibution Ben Ali Firms
Sectoral Distribution Ben Ali Firms (2010)
Contributions of Ben Ali firms Sector Aggregate
# of
BA
firms
% of
firms
owned
by BA
% Y
by
BA
firms
% of
L
% of net
profits
% of
gross
profits
% of
gross
losses
Sum L Sum Y
in
Millions
of USD
Profits
in
Millions
of USD
Telecommunications and post 3 0.03 39.13 57.71 42.33 49.29 95.39 4,264 2,197 472
Trade, cars 11 0.04 15.35 3.94 28.39 24.6 0.00 17,107 3,895 149 Transport 16 0.02 8.53 3.29 -36.75 3.12 6.74 43,460 2,642 22 Real estate and enterprise services 59 0.11 3.59 0.47 0.6 1.01 1.91 158,636 4,208 489 Financial services 8 0.50 2.43 1.13 -0.78 0.57 1.79 23,517 4,052 212 Fishing 2 0.56 1.88 0.30 -9708.38 13.83 6.66 2,444 50 0 Minerals (other) 3 0.09 1.48 1.47 18.03 6.02 0.00 24,715 1,539 55 Paper, printing 4 0.15 0.81 1.62 1.77 0.56 0.00 11,733 895 18 Hotels and restaurants 7 0.03 0.79 0.73 0.02 1.61 0.25 73,699 1,690 -549 Health and education 1 0.00 0.72 0.27 -1.04 0.00 3.55 24,259 522 46 Plastics 2 0.18 0.54 0.53 -0.47 0.00 0.16 11,793 745 11 Metalworks 2 0.02 0.54 0.02 -1.89 0.00 0.25 25,644 2,075 15 Trade – gross 27 0.08 0.41 0.31 0.52 0.45 0.24 49,557 14,207 427 Construction 9 0.03 0.38 0.77 9.22 0.14 3.77 87,136 3,044 -90 Personnel services 20 0.06 0.29 0.61 0.66 0.00 0.44 13,791 380 -56 Extractive industries 5 0.33 0.00 0.03 0.00 0.00 0.00 16,701 1,587 -769 Food industry 7 0.06 0.00 0.07 0.01 0.00 0.00 50,080 5,686 76 Chemical industry 1 0.06 0.00 0.01 0.00 0.00 0.00 16,563 2,635 163 Electronics 6 0.14 0.00 0.00 0.00 0.00 0.00 69,058 3,721 200 Manufacturing – other 2 0.04 0.00 0.00 0.00 0.00 0.00 13,670 2,370 -157 Retail trade 3 0.00 0.00 0.30 -0.02 0.00 0.05 42,617 4,562 161 Textiles 2 0.01 0.00 0.00 0.00 0.00 0.00 171,333 2,852 172 Manufacturing - wood 1 0.01 0.00 0.00 0.00 0.00 0.00 6,116 190 7 Manufacturing - machinery equipment
(excl transport)
2 0.35 0.00 0.00 0.00 0.00 0.00 5,733 480 21 All 214 0.04 3.02 0.81 19.88 6.3 2.57 1,035,881 68,566 1,171
Note: The totals do not perfectly match those in Table 2 since for a small proportion of firms information on their
sectoral classification is lacking.
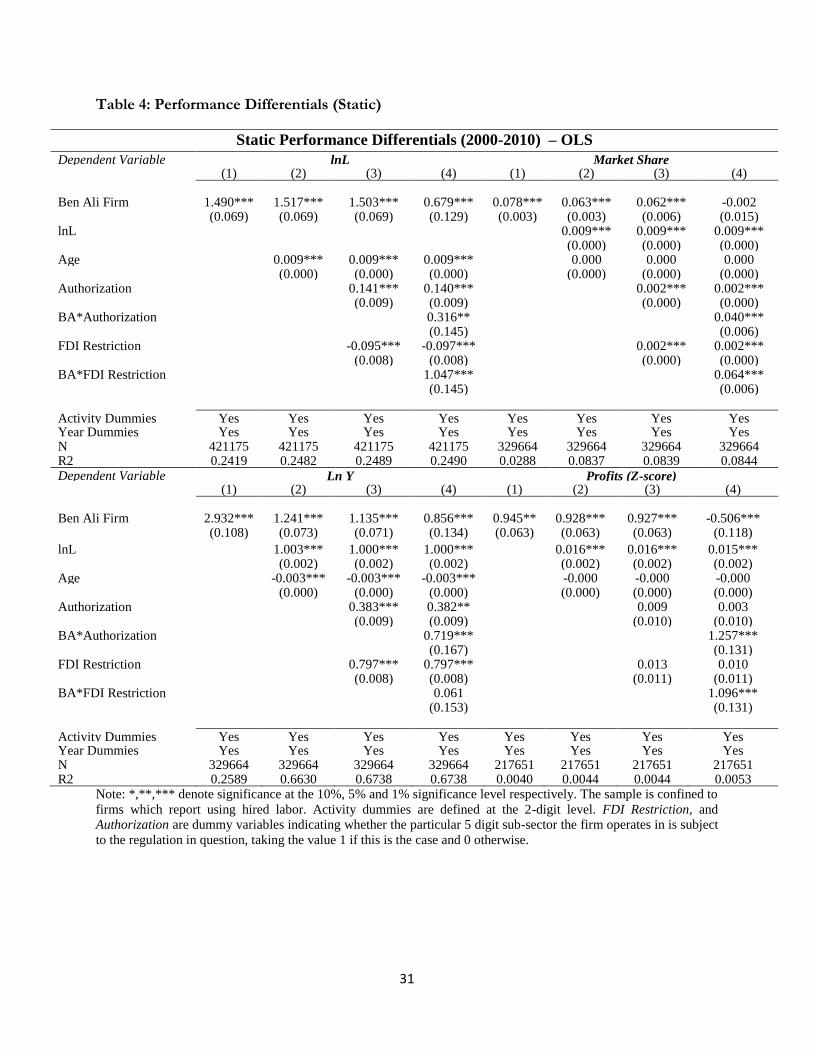
31
Table 4: Performance Differentials (Static)
Static Performance Differentials (2000-2010) – OLS
Dependent Variable lnL Market Share (1) (2) (3) (4) (1) (2) (3) (4)
Ben Ali Firm 1.490*** 1.517*** 1.503*** 0.679*** 0.078*** 0.063*** 0.062*** -0.002
(0.069) (0.069) (0.069) (0.129) (0.003) (0.003) (0.006) (0.015) lnL 0.009*** 0.009*** 0.009*** (0.000) (0.000) (0.000) Age 0.009*** 0.009*** 0.009*** 0.000 0.000 0.000
(0.000) (0.000) (0.000) (0.000) (0.000) (0.000) Authorization 0.141*** 0.140*** 0.002*** 0.002*** (0.009) (0.009) (0.000) (0.000) BA*Authorization 0.316** 0.040*** (0.145) (0.006) FDI Restriction -0.095*** -0.097*** 0.002*** 0.002*** (0.008) (0.008) (0.000) (0.000) BA*FDI Restriction 1.047*** 0.064*** (0.145) (0.006)
Activity Dummies Yes Yes Yes Yes Yes Yes Yes Yes Year Dummies Yes Yes Yes Yes Yes Yes Yes Yes N 421175 421175 421175 421175 329664 329664 329664 329664 R2 0.2419 0.2482 0.2489 0.2490 0.0288 0.0837 0.0839 0.0844 Dependent Variable Ln Y Profits (Z-score) (1) (2) (3) (4) (1) (2) (3) (4)
Ben Ali Firm 2.932*** 1.241*** 1.135*** 0.856*** 0.945**
*
0.928*** 0.927*** -0.506*** (0.108) (0.073) (0.071) (0.134) (0.063) (0.063) (0.063) (0.118)
lnL 1.003*** 1.000*** 1.000*** 0.016*** 0.016*** 0.015*** (0.002) (0.002) (0.002) (0.002) (0.002) (0.002) Age -0.003*** -0.003*** -0.003*** -0.000 -0.000 -0.000
(0.000) (0.000) (0.000) (0.000) (0.000) (0.000) Authorization 0.383*** 0.382** 0.009 0.003 (0.009) (0.009) (0.010) (0.010) BA*Authorization 0.719*** 1.257***
(0.167) (0.131) FDI Restriction 0.797*** 0.797***
0.013 0.010
(0.008) (0.008)
(0.011) (0.011) BA*FDI Restriction 0.061
1.096***
(0.153)
(0.131) Activity Dummies Yes Yes Yes Yes Yes Yes Yes Yes Year Dummies Yes Yes Yes Yes Yes Yes Yes Yes N 329664 329664 329664 329664 217651 217651 217651 217651 R2 0.2589 0.6630 0.6738 0.6738 0.0040 0.0044 0.0044 0.0053
Note: *,**,*** denote significance at the 10%, 5% and 1% significance level respectively. The sample is confined to
firms which report using hired labor. Activity dummies are defined at the 2-digit level. FDI Restriction, and
Authorization are dummy variables indicating whether the particular 5 digit sub-sector the firm operates in is subject
to the regulation in question, taking the value 1 if this is the case and 0 otherwise.
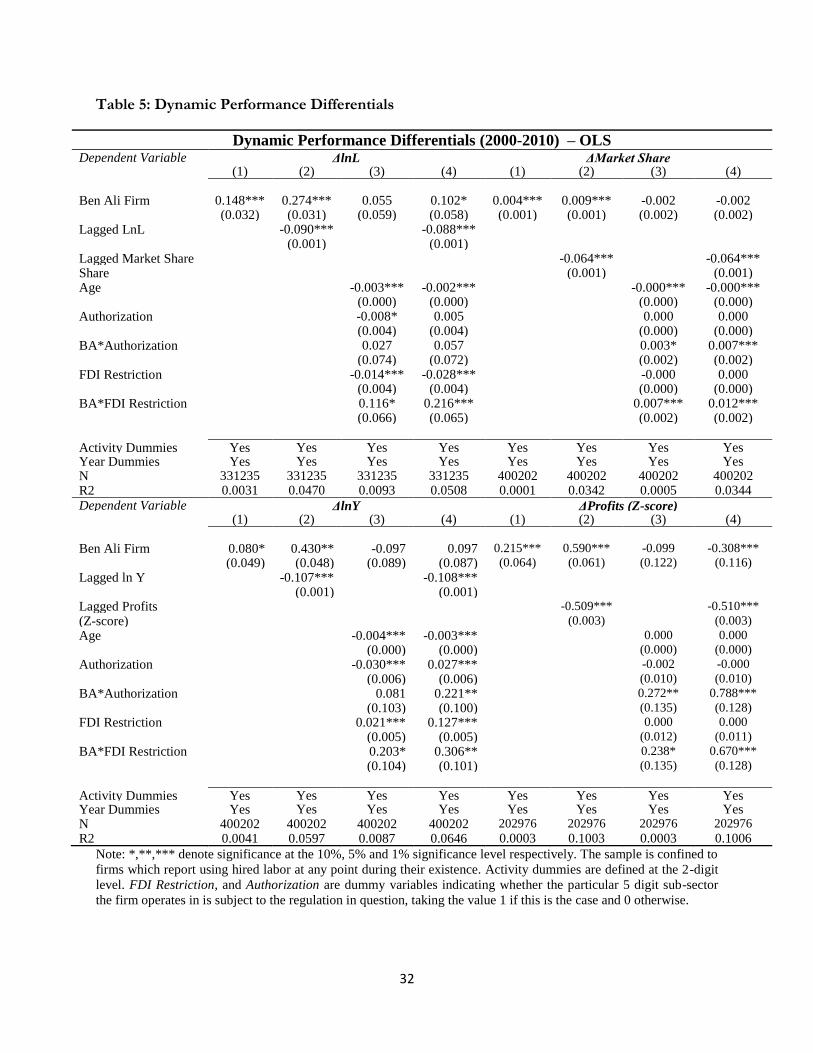
32
Table 5: Dynamic Performance Differentials
Dynamic Performance Differentials (2000-2010) – OLS Dependent Variable ΔlnL ΔMarket Share (1) (2) (3) (4) (1) (2) (3) (4)
Ben Ali Firm 0.148*** 0.274*** 0.055 0.102* 0.004*** 0.009*** -0.002 -0.002
(0.032) (0.031) (0.059) (0.058) (0.001) (0.001) (0.002) (0.002) Lagged LnL -0.090*** -0.088***
(0.001) (0.001) Lagged Market Share -0.064*** -0.064*** Share (0.001) (0.001) Age -0.003*** -0.002*** -0.000*** -0.000***
(0.000) (0.000) (0.000) (0.000) Authorization
-0.008* 0.005 0.000 0.000 (0.004) (0.004) (0.000) (0.000)
BA*Authorization 0.027 0.057 0.003* 0.007*** (0.074) (0.072) (0.002) (0.002)
FDI Restriction
-0.014*** -0.028*** -0.000 0.000 (0.004) (0.004) (0.000) (0.000)
BA*FDI Restriction
0.116* 0.216*** 0.007*** 0.012*** (0.066) (0.065) (0.002) (0.002)
Activity Dummies Yes Yes Yes Yes Yes Yes Yes Yes Year Dummies Yes Yes Yes Yes Yes Yes Yes Yes N 331235 331235 331235 331235 400202 400202 400202 400202 R2 0.0031 0.0470 0.0093 0.0508 0.0001 0.0342 0.0005 0.0344
Dependent Variable ΔlnY ΔProfits (Z-score) (1) (2) (3) (4) (1) (2) (3) (4)
Ben Ali Firm 0.080* 0.430** -0.097 0.097 0.215*** 0.590*** -0.099 -0.308***
(0.049) (0.048) (0.089) (0.087) (0.064) (0.061) (0.122) (0.116)
Lagged ln Y -0.107*** -0.108*** (0.001) (0.001)
Lagged Profits -0.509*** -0.510***
(Z-score) (0.003) (0.003)
Age -0.004*** -0.003*** 0.000 0.000 (0.000) (0.000) (0.000) (0.000)
Authorization
-0.030*** 0.027*** -0.002 -0.000 (0.006) (0.006) (0.010) (0.010)
BA*Authorization 0.081 0.221** 0.272** 0.788***
(0.103) (0.100) (0.135) (0.128) FDI Restriction
0.021*** 0.127*** 0.000 0.000 (0.005) (0.005) (0.012) (0.011)
BA*FDI Restriction
0.203* 0.306** 0.238* 0.670***
(0.104) (0.101) (0.135) (0.128)
Activity Dummies Yes Yes Yes Yes Yes Yes Yes Yes Year Dummies Yes Yes Yes Yes Yes Yes Yes Yes N 400202 400202 400202 400202 202976 202976 202976 202976
R2 0.0041 0.0597 0.0087 0.0646 0.0003 0.1003 0.0003 0.1006
Note: *,**,*** denote significance at the 10%, 5% and 1% significance level respectively. The sample is confined to
firms which report using hired labor at any point during their existence. Activity dummies are defined at the 2-digit
level. FDI Restriction, and Authorization are dummy variables indicating whether the particular 5 digit sub-sector
the firm operates in is subject to the regulation in question, taking the value 1 if this is the case and 0 otherwise.
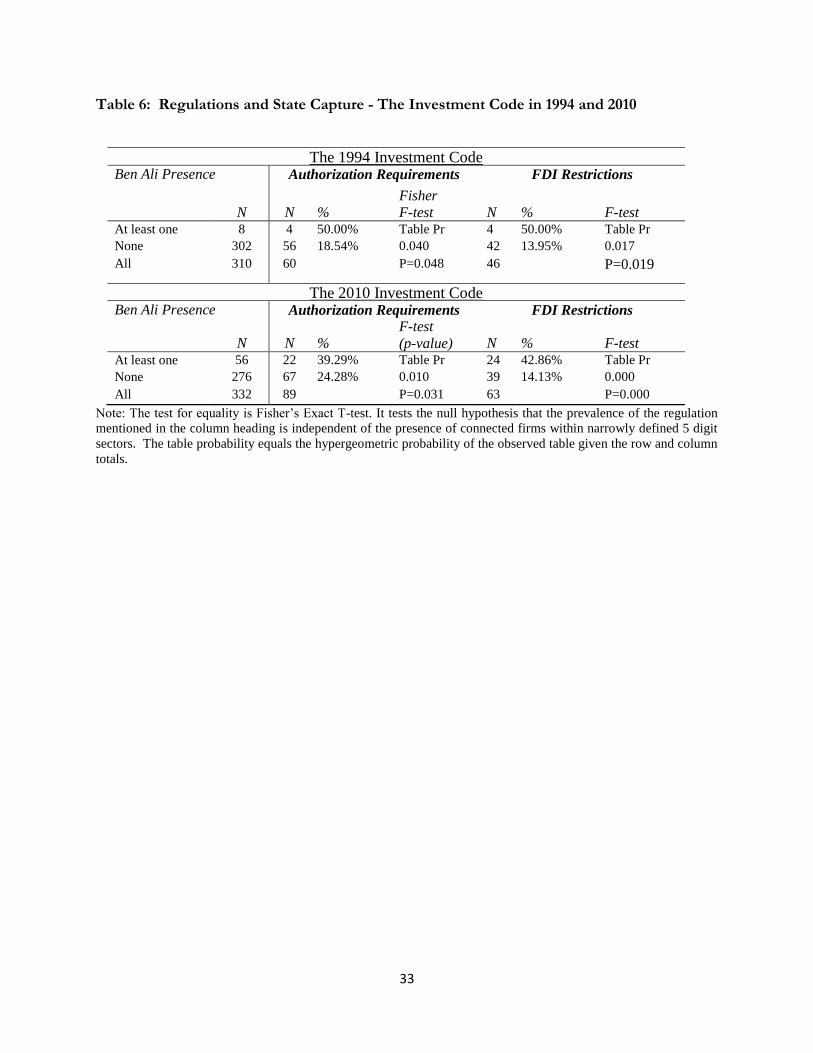
33
Table 6: Regulations and State Capture - The Investment Code in 1994 and 2010
The 1994 Investment Code Ben Ali Presence Authorization Requirements FDI Restrictions
N N %
Fisher
F-test N % F-test At least one 8 4 50.00% Table Pr
0.0195
4 50.00% Table Pr
0.0195 None 302 56 18.54% 0.040 42 13.95% 0.017
All 310 60 P=0.048 46 P=0.019
The 2010 Investment Code
Ben Ali Presence Authorization Requirements FDI Restrictions
N N %
F-test
(p-value) N % F-test At least one 56 22 39.29% Table Pr
0.0195
24 42.86% Table Pr
0.0195 None 276 67 24.28% 0.010 39 14.13% 0.000
All 332 89 P=0.031 63 P=0.000
Note: The test for equality is Fisher’s Exact T-test. It tests the null hypothesis that the prevalence of the regulation
mentioned in the column heading is independent of the presence of connected firms within narrowly defined 5 digit
sectors. The table probability equals the hypergeometric probability of the observed table given the row and column
totals.
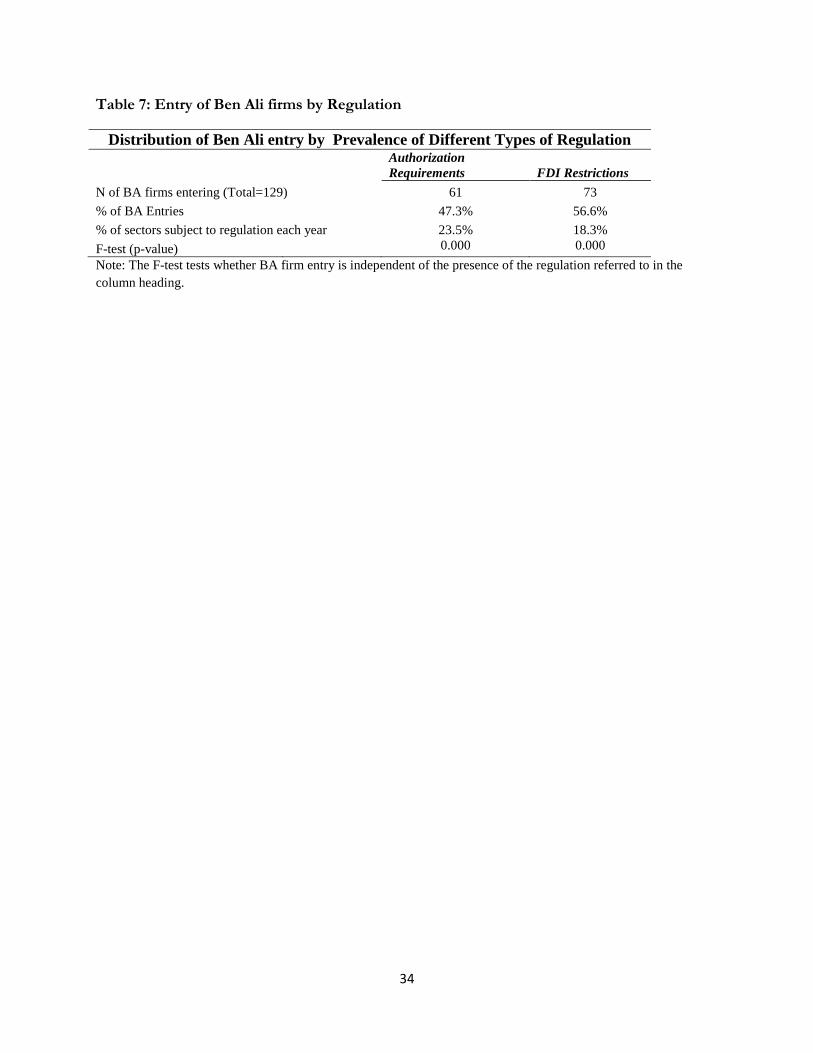
34
Table 7: Entry of Ben Ali firms by Regulation
Distribution of Ben Ali entry by Prevalence of Different Types of Regulation
Authorization
Requirements FDI Restrictions
N of BA firms entering (Total=129) 61 73
% of BA Entries
47.3% 56.6%
% of sectors subject to regulation each year 23.5% 18.3%
F-test (p-value)
0.000 0.000
Note: The F-test tests whether BA firm entry is independent of the presence of the regulation referred to in the
column heading.
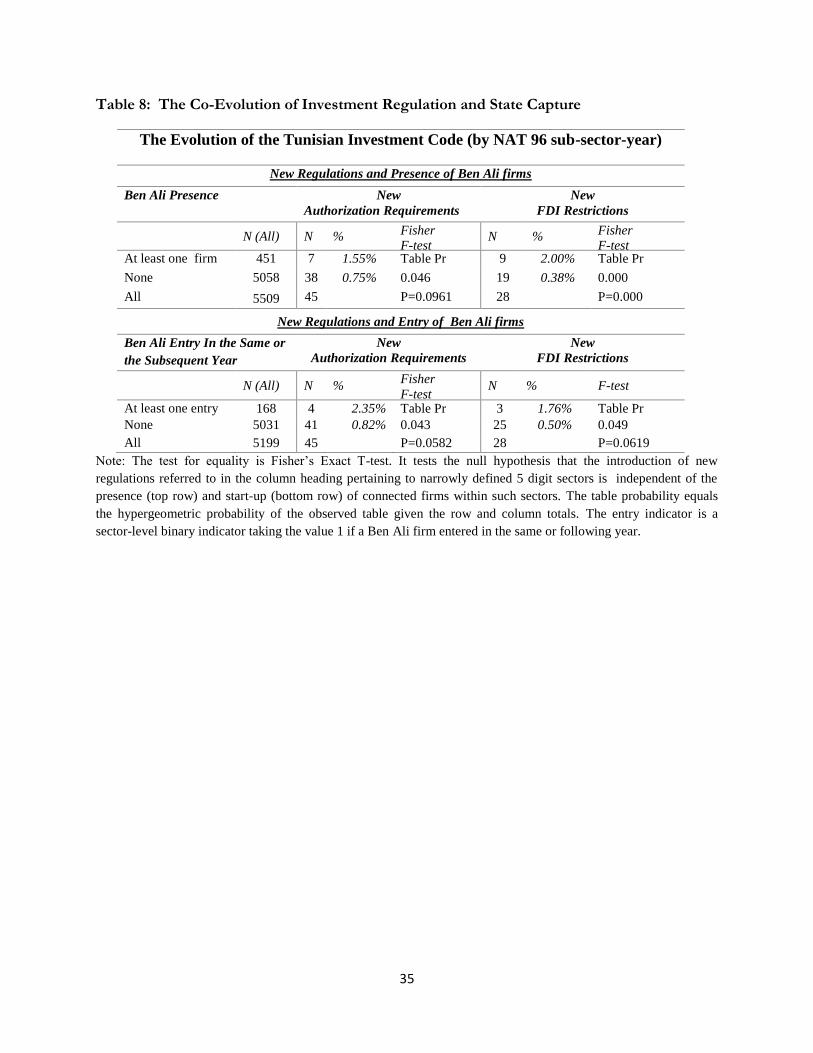
35
Table 8: The Co-Evolution of Investment Regulation and State Capture
The Evolution of the Tunisian Investment Code (by NAT 96 sub-sector-year)
New Regulations and Presence of Ben Ali firms
Ben Ali Presence New
Authorization Requirements
New
FDI Restrictions
N (All) N % Fisher
F-test N %
Fisher
F-test At least one firm 451 7 1.55% Table Pr
0.0195
9 2.00% Table Pr
0.0195 None 5058 38 0.75% 0.046 19 0.38% 0.000
All 5509 45 P=0.0961 28 P=0.000
New Regulations and Entry of Ben Ali firms
Ben Ali Entry In the Same or
the Subsequent Year
New
Authorization Requirements
New
FDI Restrictions
N (All) N %
Fisher
F-test N % F-test
At least one entry 168 4 2.35% Table Pr
0.0195
3 1.76% Table Pr
0.0195 None 5031 41 0.82% 0.043 25 0.50% 0.049
All 5199 45 P=0.0582 28 P=0.0619
Note: The test for equality is Fisher’s Exact T-test. It tests the null hypothesis that the introduction of new
regulations referred to in the column heading pertaining to narrowly defined 5 digit sectors is independent of the
presence (top row) and start-up (bottom row) of connected firms within such sectors. The table probability equals
the hypergeometric probability of the observed table given the row and column totals. The entry indicator is a
sector-level binary indicator taking the value 1 if a Ben Ali firm entered in the same or following year.
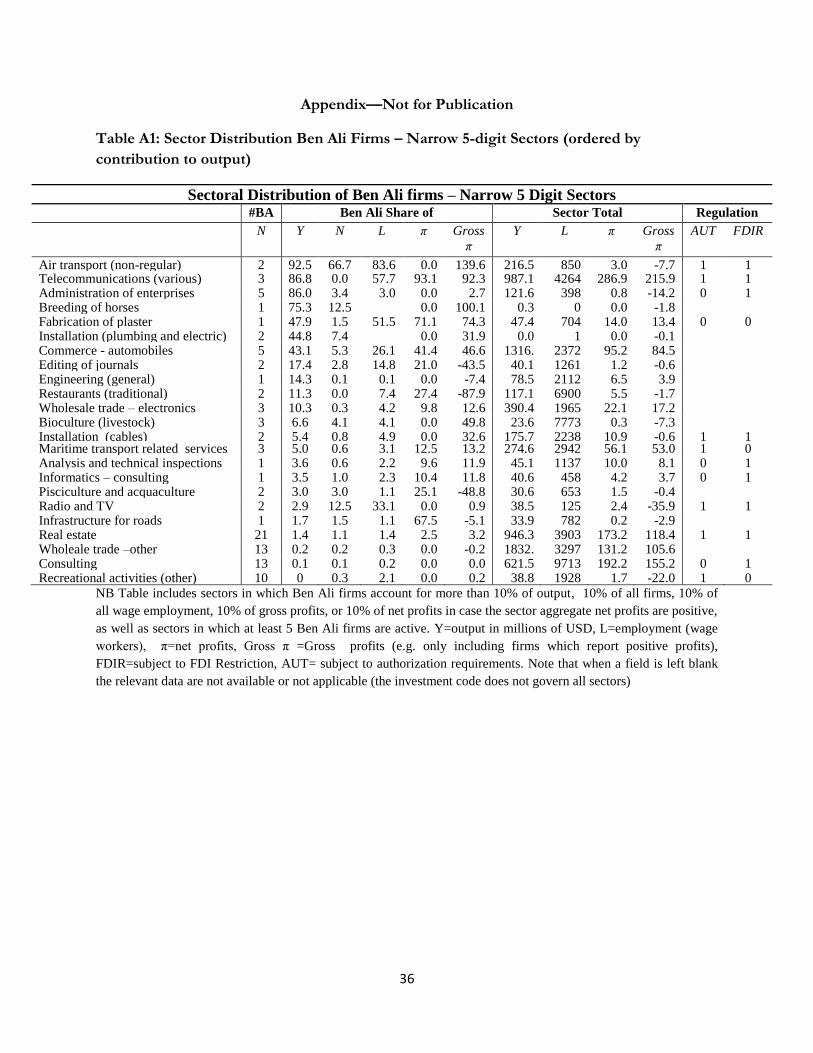
36
Appendix—Not for Publication
Table A1: Sector Distribution Ben Ali Firms – Narrow 5-digit Sectors (ordered by
contribution to output)
Sectoral Distribution of Ben Ali firms – Narrow 5 Digit Sectors
#BA Ben Ali Share of Sector Total Regulation
N Y N L π Gross
π
Y L π Gross
π
AUT FDIR
Air transport (non-regular) 2 92.5 66.7 83.6 0.0 139.6 216.5 850 3.0 -7.7 1 1 Telecommunications (various) 3 86.8 0.0 57.7 93.1 92.3 987.1 4264 286.9 215.9 1 1 Administration of enterprises 5 86.0 3.4 3.0 0.0 2.7 121.6 398 0.8 -14.2 0 1 Breeding of horses 1 75.3 12.5 0.0 100.1 0.3 0 0.0 -1.8 Fabrication of plaster 1 47.9 1.5 51.5 71.1 74.3 47.4 704 14.0 13.4 0 0 Installation (plumbing and electric) 2 44.8 7.4 0.0 31.9 0.0 1 0.0 -0.1 Commerce - automobiles 5 43.1 5.3 26.1 41.4 46.6 1316.
2
2372 95.2 84.5 Editing of journals 2 17.4 2.8 14.8 21.0 -43.5 40.1 1261 1.2 -0.6 Engineering (general) 1 14.3 0.1 0.1 0.0 -7.4 78.5 2112 6.5 3.9 Restaurants (traditional) 2 11.3 0.0 7.4 27.4 -87.9 117.1 6900 5.5 -1.7 Wholesale trade – electronics 3 10.3 0.3 4.2 9.8 12.6 390.4 1965 22.1 17.2 Bioculture (livestock) 3 6.6 4.1 4.1 0.0 49.8 23.6 7773 0.3 -7.3 Installation (cables) 2 5.4 0.8 4.9 0.0 32.6 175.7 2238 10.9 -0.6 1 1 Maritime transport related services 3 5.0 0.6 3.1 12.5 13.2 274.6 2942 56.1 53.0 1 0 Analysis and technical inspections 1 3.6 0.6 2.2 9.6 11.9 45.1 1137 10.0 8.1 0 1 Informatics – consulting 1 3.5 1.0 2.3 10.4 11.8 40.6 458 4.2 3.7 0 1 Pisciculture and acquaculture 2 3.0 3.0 1.1 25.1 -48.8 30.6 653 1.5 -0.4 Radio and TV 2 2.9 12.5 33.1 0.0 0.9 38.5 125 2.4 -35.9 1 1 Infrastructure for roads 1 1.7 1.5 1.1 67.5 -5.1 33.9 782 0.2 -2.9 Real estate 21 1.4 1.1 1.4 2.5 3.2 946.3 3903 173.2 118.4 1 1 Wholeale trade –other 13 0.2 0.2 0.3 0.0 -0.2 1832.
6
3297 131.2 105.6 Consulting 13 0.1 0.1 0.2 0.0 0.0 621.5 9713 192.2 155.2 0 1 Recreational activities (other) 10 0 0.3 2.1 0.0 0.2 38.8 1928 1.7 -22.0 1 0
NB Table includes sectors in which Ben Ali firms account for more than 10% of output, 10% of all firms, 10% of
all wage employment, 10% of gross profits, or 10% of net profits in case the sector aggregate net profits are positive,
as well as sectors in which at least 5 Ben Ali firms are active. Y=output in millions of USD, L=employment (wage
workers), π=net profits, Gross π =Gross profits (e.g. only including firms which report positive profits),
FDIR=subject to FDI Restriction, AUT= subject to authorization requirements. Note that when a field is left blank
the relevant data are not available or not applicable (the investment code does not govern all sectors)
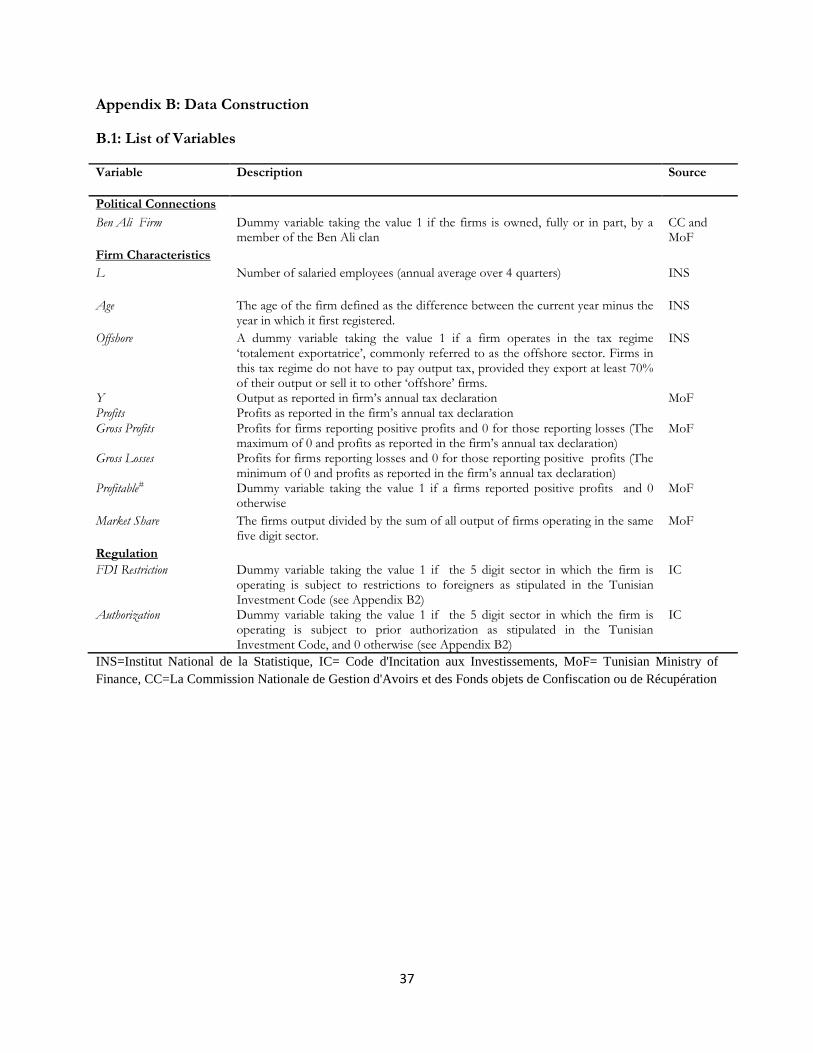
37
Appendix B: Data Construction
B.1: List of Variables
Variable Description Source
Political Connections
Ben Ali Firm Dummy variable taking the value 1 if the firms is owned, fully or in part, by a member of the Ben Ali clan
CC and MoF
Firm Characteristics
L Number of salaried employees (annual average over 4 quarters) INS
Age The age of the firm defined as the difference between the current year minus the year in which it first registered.
INS
Offshore A dummy variable taking the value 1 if a firm operates in the tax regime ‘totalement exportatrice’, commonly referred to as the offshore sector. Firms in this tax regime do not have to pay output tax, provided they export at least 70% of their output or sell it to other ‘offshore’ firms.
INS
Y Output as reported in firm’s annual tax declaration MoF Profits Profits as reported in the firm’s annual tax declaration
Gross Profits Profits for firms reporting positive profits and 0 for those reporting losses (The maximum of 0 and profits as reported in the firm’s annual tax declaration)
MoF
Gross Losses Profits for firms reporting losses and 0 for those reporting positive profits (The minimum of 0 and profits as reported in the firm’s annual tax declaration)
Profitable# Dummy variable taking the value 1 if a firms reported positive profits and 0 otherwise
MoF
Market Share The firms output divided by the sum of all output of firms operating in the same five digit sector.
MoF
Regulation
FDI Restriction Dummy variable taking the value 1 if the 5 digit sector in which the firm is operating is subject to restrictions to foreigners as stipulated in the Tunisian Investment Code (see Appendix B2)
IC
Authorization Dummy variable taking the value 1 if the 5 digit sector in which the firm is operating is subject to prior authorization as stipulated in the Tunisian Investment Code, and 0 otherwise (see Appendix B2)
IC
INS=Institut National de la Statistique, IC= Code d'Incitation aux Investissements, MoF= Tunisian Ministry of
Finance, CC=La Commission Nationale de Gestion d'Avoirs et des Fonds objets de Confiscation ou de Récupération
38
B.2: Coding the Investment Code
To assess the relationship between firm performance, political connections and the regulation, we
created a database of the Tunisian Investment Code, the Code d'Incitation aux Investissements. The
dataset contains annual information at the NAT96 5-digit sector level, the most disaggregated sector
classification available in Tunisia, on which activities were covered by the Investment Code and
whether these activities were subject to i) prior authorization as stipulated in Article 4 of Décret
n°94-492 and subsequent amendments ii) restrictions on foreign investment in the form of having to
obtain permission from the Commission Superieure d’Investissement as stipulated in stipulated in Article 5
of Décret n°94-492 and subsequent amendments.
To construct this dataset we code the original Investment Code enacted in December 1993
and all subsequent decrees resulting in amendments to investment laws up until 2010. In total we
record 22 decrees which result in revisions in the coverage of the Investment Code and changes in
which activities are subject to authorization requirements and restrictions on foreign investment. We
do not record decrees resulting in changes in registration requirements, customs regulations, fiscal
advantages, or other regulations that are not analyzed in this paper.
Arguably the most important challenge in coding these regulations is that the list of activities
stipulated in the investment code and the Tunisian NAT 96 classification do not overlap perfectly.30
Sometimes the activities listed in the Investment Code are more general than the NAT96
classifications (for example, the activity “Hébergement” in the Investment Code corresponds to a
number of NAT96 categories, notably “Hôtels avec restaurant”, “Hôtels de tourisme sans
restaurant”, “Hôtels non classes”, “Auberges de jeunesse et refuges”, “Exploitation de terrains de
camping”, “Autre hébergement touristique”, “Hébergement collectif non touristique”). In other
instances, they are more specific (for example the activities “Pêche côtière”, Pêche au feu, Pêche au
chalut” are encompassed by the NAT96 sector “Pêche”) and occasionally it is hard to create a
satisfactory correspondence (e.g. the activity “Topographie” is difficult to map to NAT96 sectors).
Coding the Investment Code thus inherently involves a degree of subjectivity, which we have tried
30 Note also that as a result of the imperfect overlap is possible that some of the activities classified in a NAT96 sub-sector are subject to particular provisions in the investment code whereas others are not. We treat all activities in such a sector as being affected by the regulation; while this is not ideal, it is not possible to gage how many “activities” a sector is comprised of, rendering it difficult to account for the “intensity” of regulation within narrowly defined 5 digit sectors, though we do record the number of provisions relevant to a particular sub-sector. Conversely, certain provisions apply to multiple sub-sectors.
39
to minimize by developing the correspondence between NAT96 and the Investment Code in
collaboration with the Tunisian Institut National de la Statistique.
Table B.2.1 depicts part of this correspondence for activities covered by the original
Investment Code subject to authorization requirements and FDI restrictions.31 Table B.2.2 presents
an overview of changes to the Investment Code, again excluding changes in coverage that do not
involve the imposition of authorization requirements or restrictions on foreign investment.32
31 A longer list that also covers those activities covered by the investment code but not subject to any one of these three regulations is not presented to conserve space but available upon request. 32 These are not presented to conserve space, but available upon request.
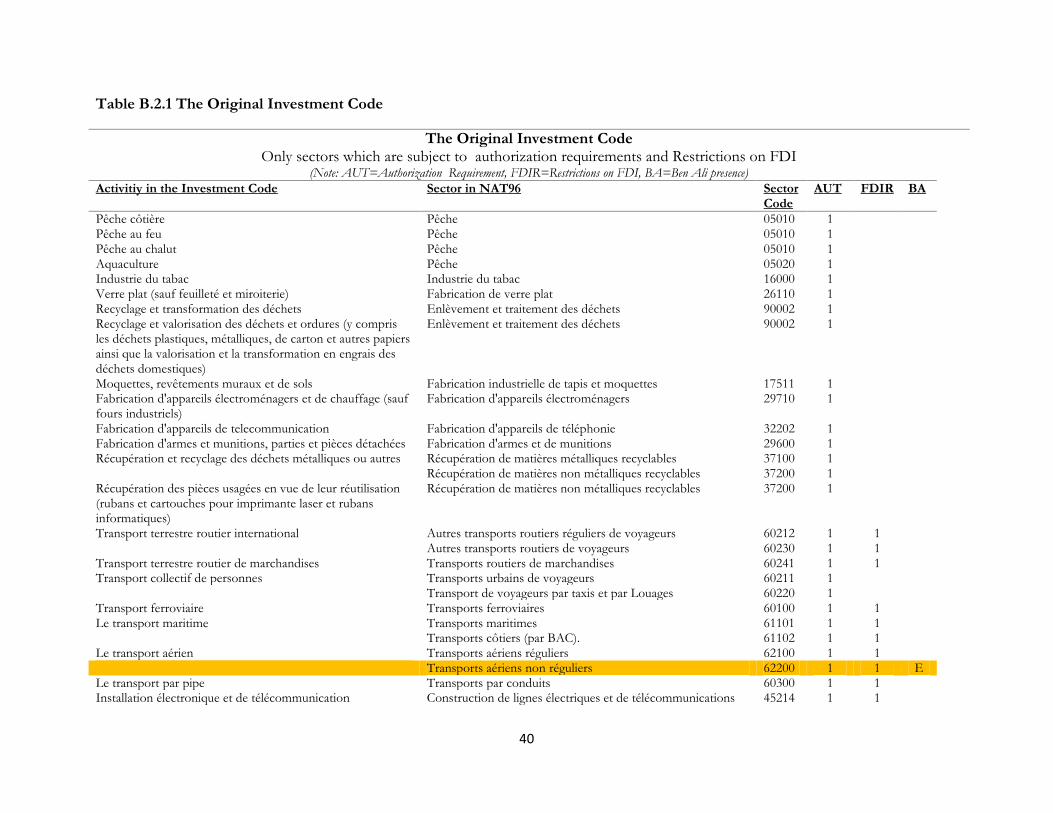
40
Table B.2.1 The Original Investment Code
The Original Investment Code Only sectors which are subject to authorization requirements and Restrictions on FDI
(Note: AUT=Authorization Requirement, FDIR=Restrictions on FDI, BA=Ben Ali presence)
Activitiy in the Investment Code Sector in NAT96 Sector Code
AUT FDIR BA
Pêche côtière Pêche 05010 1 Pêche au feu Pêche 05010 1 Pêche au chalut Pêche 05010 1 Aquaculture Pêche 05020 1 Industrie du tabac Industrie du tabac 16000 1 Verre plat (sauf feuilleté et miroiterie) Fabrication de verre plat 26110 1 Recyclage et transformation des déchets Enlèvement et traitement des déchets 90002 1 Recyclage et valorisation des déchets et ordures (y compris les déchets plastiques, métalliques, de carton et autres papiers ainsi que la valorisation et la transformation en engrais des déchets domestiques)
Enlèvement et traitement des déchets 90002 1
Moquettes, revêtements muraux et de sols Fabrication industrielle de tapis et moquettes 17511 1 Fabrication d'appareils électroménagers et de chauffage (sauf fours industriels)
Fabrication d'appareils électroménagers 29710 1
Fabrication d'appareils de telecommunication Fabrication d'appareils de téléphonie 32202 1 Fabrication d'armes et munitions, parties et pièces détachées Fabrication d'armes et de munitions 29600 1 Récupération et recyclage des déchets métalliques ou autres Récupération de matières métalliques recyclables 37100 1 Récupération de matières non métalliques recyclables 37200 1 Récupération des pièces usagées en vue de leur réutilisation (rubans et cartouches pour imprimante laser et rubans informatiques)
Récupération de matières non métalliques recyclables 37200 1
Transport terrestre routier international Autres transports routiers réguliers de voyageurs 60212 1 1 Autres transports routiers de voyageurs 60230 1 1 Transport terrestre routier de marchandises Transports routiers de marchandises 60241 1 1 Transport collectif de personnes Transports urbains de voyageurs 60211 1 Transport de voyageurs par taxis et par Louages 60220 1 Transport ferroviaire Transports ferroviaires 60100 1 1 Le transport maritime Transports maritimes 61101 1 1 Transports côtiers (par BAC). 61102 1 1 Le transport aérien Transports aériens réguliers 62100 1 1 Transports aériens non réguliers 62200 1 1 E Le transport par pipe Transports par conduits 60300 1 1 Installation électronique et de télécommunication Construction de lignes électriques et de télécommunications 45214 1 1
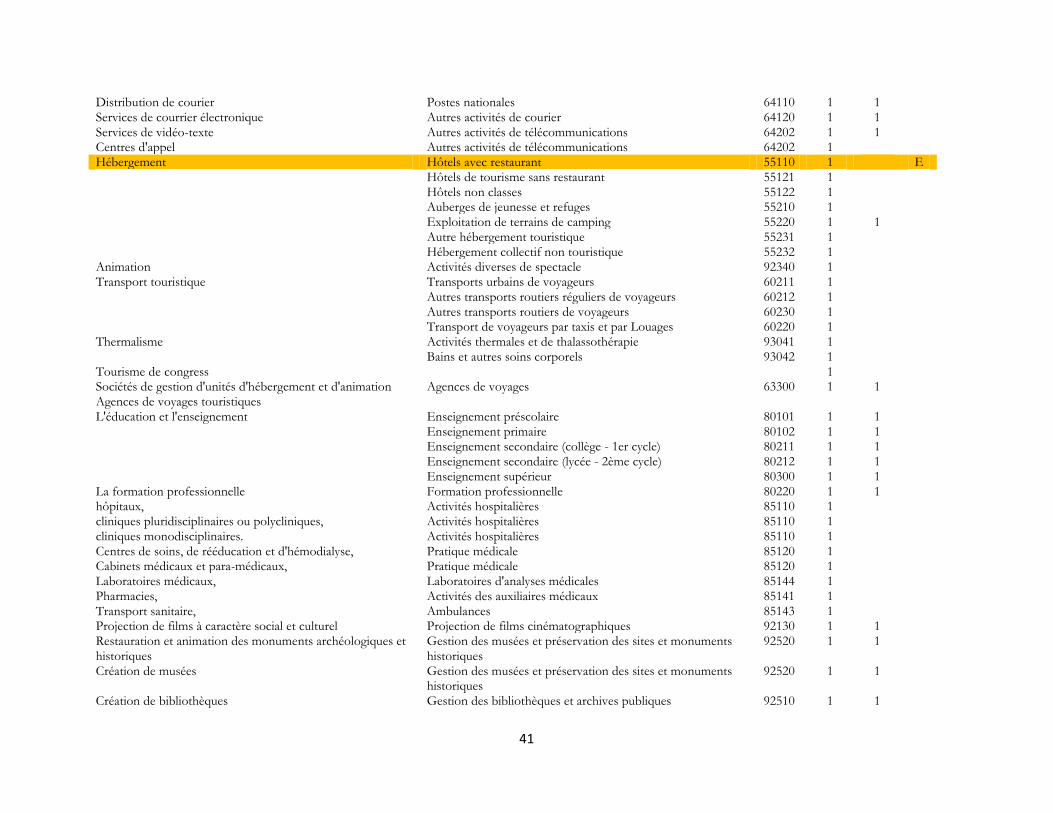
41
Distribution de courier Postes nationales 64110 1 1 Services de courrier électronique Autres activités de courier 64120 1 1 Services de vidéo-texte Autres activités de télécommunications 64202 1 1 Centres d'appel Autres activités de télécommunications 64202 1 Hébergement Hôtels avec restaurant 55110 1 E Hôtels de tourisme sans restaurant 55121 1 Hôtels non classes 55122 1 Auberges de jeunesse et refuges 55210 1 Exploitation de terrains de camping 55220 1 1 Autre hébergement touristique 55231 1 Hébergement collectif non touristique 55232 1 Animation Activités diverses de spectacle 92340 1 Transport touristique Transports urbains de voyageurs 60211 1 Autres transports routiers réguliers de voyageurs 60212 1 Autres transports routiers de voyageurs 60230 1 Transport de voyageurs par taxis et par Louages 60220 1 Thermalisme Activités thermales et de thalassothérapie 93041 1 Bains et autres soins corporels 93042 1 Tourisme de congress 1 Sociétés de gestion d'unités d'hébergement et d'animation Agences de voyages touristiques
Agences de voyages 63300 1 1
L'éducation et l'enseignement Enseignement préscolaire 80101 1 1 Enseignement primaire 80102 1 1 Enseignement secondaire (collège - 1er cycle) 80211 1 1 Enseignement secondaire (lycée - 2ème cycle) 80212 1 1 Enseignement supérieur 80300 1 1 La formation professionnelle Formation professionnelle 80220 1 1 hôpitaux, Activités hospitalières 85110 1 cliniques pluridisciplinaires ou polycliniques, Activités hospitalières 85110 1 cliniques monodisciplinaires. Activités hospitalières 85110 1 Centres de soins, de rééducation et d'hémodialyse, Pratique médicale 85120 1 Cabinets médicaux et para-médicaux, Pratique médicale 85120 1 Laboratoires médicaux, Laboratoires d'analyses médicales 85144 1 Pharmacies, Activités des auxiliaires médicaux 85141 1 Transport sanitaire, Ambulances 85143 1 Projection de films à caractère social et culturel Projection de films cinématographiques 92130 1 1 Restauration et animation des monuments archéologiques et historiques
Gestion des musées et préservation des sites et monuments historiques
92520 1 1
Création de musées Gestion des musées et préservation des sites et monuments historiques
92520 1 1
Création de bibliothèques Gestion des bibliothèques et archives publiques 92510 1 1
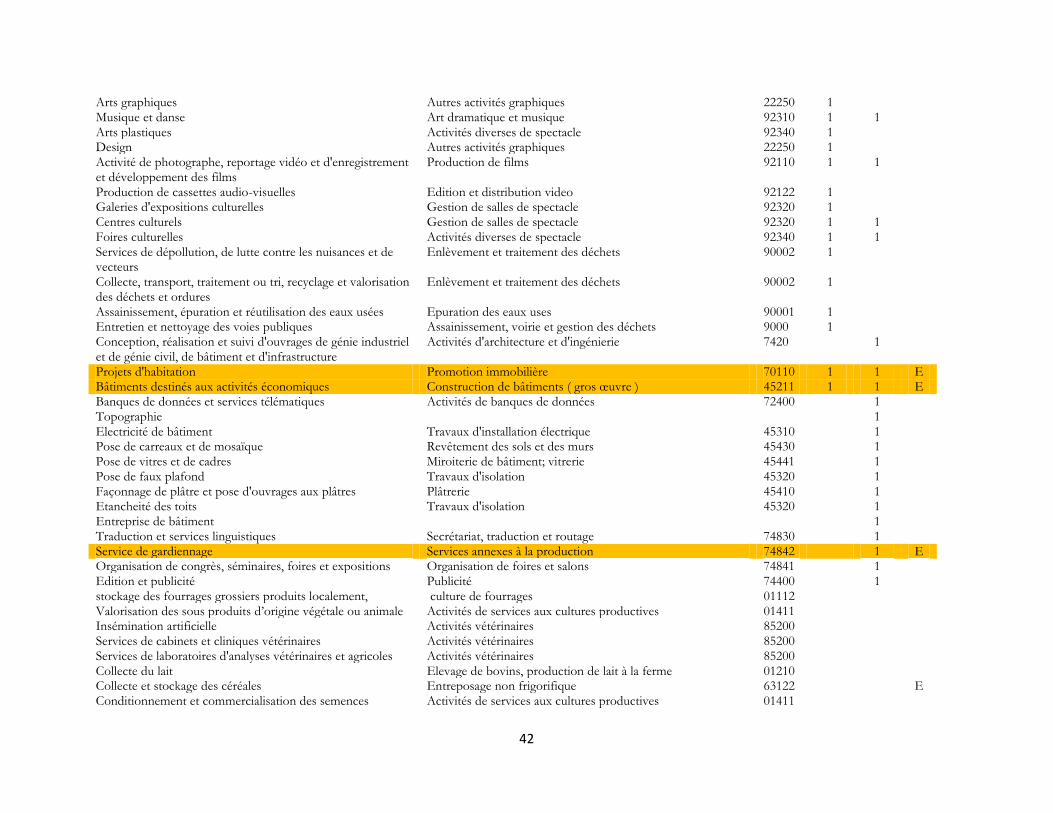
42
Arts graphiques Autres activités graphiques 22250 1 Musique et danse Art dramatique et musique 92310 1 1 Arts plastiques Activités diverses de spectacle 92340 1 Design Autres activités graphiques 22250 1 Activité de photographe, reportage vidéo et d'enregistrement et développement des films
Production de films 92110 1 1
Production de cassettes audio-visuelles Edition et distribution video 92122 1 Galeries d'expositions culturelles Gestion de salles de spectacle 92320 1 Centres culturels Gestion de salles de spectacle 92320 1 1 Foires culturelles Activités diverses de spectacle 92340 1 1 Services de dépollution, de lutte contre les nuisances et de vecteurs
Enlèvement et traitement des déchets 90002 1
Collecte, transport, traitement ou tri, recyclage et valorisation des déchets et ordures
Enlèvement et traitement des déchets 90002 1
Assainissement, épuration et réutilisation des eaux usées Epuration des eaux uses 90001 1 Entretien et nettoyage des voies publiques Assainissement, voirie et gestion des déchets 9000 1 Conception, réalisation et suivi d'ouvrages de génie industriel et de génie civil, de bâtiment et d'infrastructure
Activités d'architecture et d'ingénierie 7420 1
Projets d'habitation Promotion immobilière 70110 1 1 E Bâtiments destinés aux activités économiques Construction de bâtiments ( gros œuvre ) 45211 1 1 E Banques de données et services télématiques Activités de banques de données 72400 1 Topographie 1 Electricité de bâtiment Travaux d'installation électrique 45310 1 Pose de carreaux et de mosaïque Revêtement des sols et des murs 45430 1 Pose de vitres et de cadres Miroiterie de bâtiment; vitrerie 45441 1 Pose de faux plafond Travaux d'isolation 45320 1 Façonnage de plâtre et pose d'ouvrages aux plâtres Plâtrerie 45410 1 Etancheité des toits Travaux d'isolation 45320 1 Entreprise de bâtiment 1 Traduction et services linguistiques Secrétariat, traduction et routage 74830 1 Service de gardiennage Services annexes à la production 74842 1 E Organisation de congrès, séminaires, foires et expositions Organisation de foires et salons 74841 1 Edition et publicité Publicité 74400 1 stockage des fourrages grossiers produits localement, culture de fourrages 01112 Valorisation des sous produits d’origine végétale ou animale Activités de services aux cultures productives 01411 Insémination artificielle Activités vétérinaires 85200 Services de cabinets et cliniques vétérinaires Activités vétérinaires 85200 Services de laboratoires d'analyses vétérinaires et agricoles Activités vétérinaires 85200 Collecte du lait Elevage de bovins, production de lait à la ferme 01210 Collecte et stockage des céréales Entreposage non frigorifique 63122 E Conditionnement et commercialisation des semences Activités de services aux cultures productives 01411
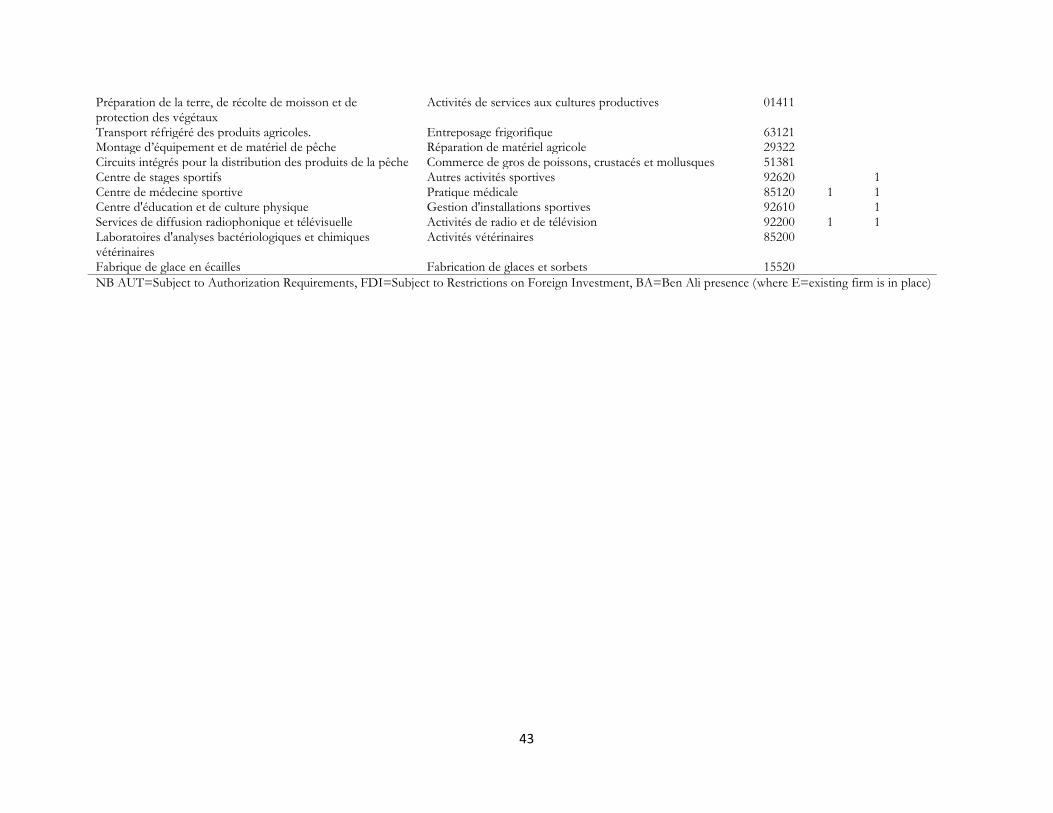
43
Préparation de la terre, de récolte de moisson et de protection des végétaux
Activités de services aux cultures productives 01411
Transport réfrigéré des produits agricoles. Entreposage frigorifique 63121 Montage d’équipement et de matériel de pêche Réparation de matériel agricole 29322 Circuits intégrés pour la distribution des produits de la pêche Commerce de gros de poissons, crustacés et mollusques 51381 Centre de stages sportifs Autres activités sportives 92620 1 Centre de médecine sportive Pratique médicale 85120 1 1 Centre d'éducation et de culture physique Gestion d'installations sportives 92610 1 Services de diffusion radiophonique et télévisuelle Activités de radio et de télévision 92200 1 1 Laboratoires d'analyses bactériologiques et chimiques vétérinaires
Activités vétérinaires 85200
Fabrique de glace en écailles Fabrication de glaces et sorbets 15520
NB AUT=Subject to Authorization Requirements, FDI=Subject to Restrictions on Foreign Investment, BA=Ben Ali presence (where E=existing firm is in place)
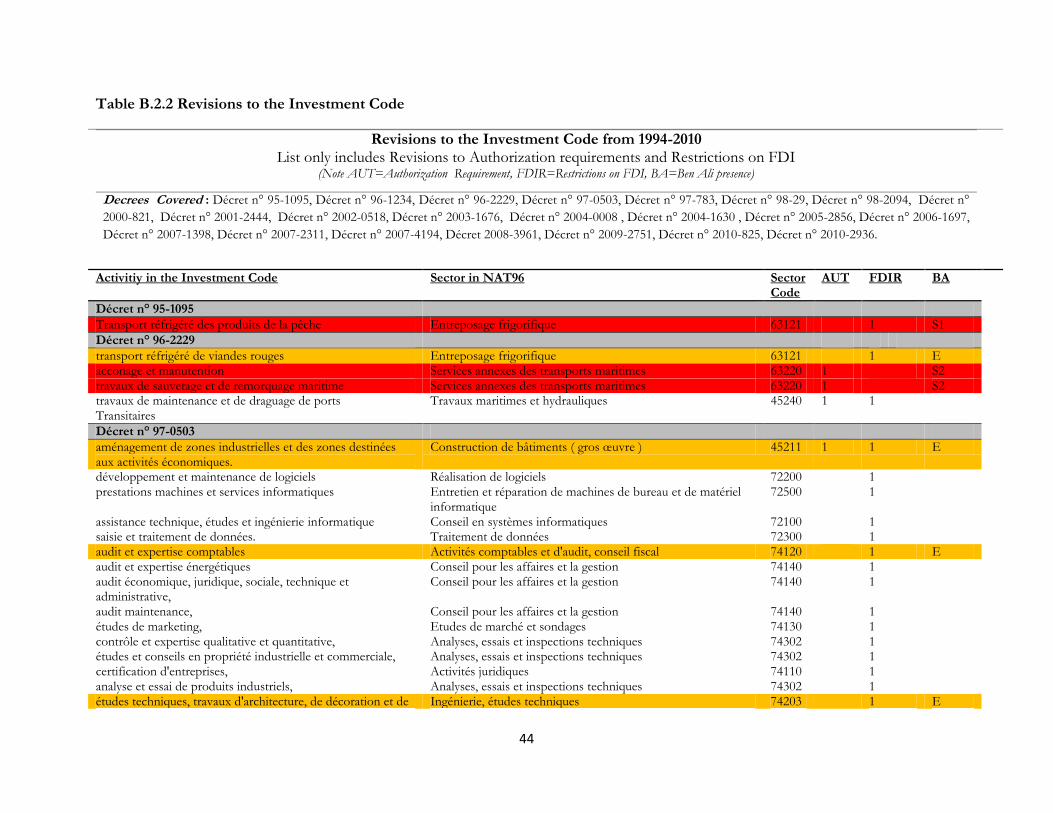
44
Table B.2.2 Revisions to the Investment Code
Revisions to the Investment Code from 1994-2010 List only includes Revisions to Authorization requirements and Restrictions on FDI
(Note AUT=Authorization Requirement, FDIR=Restrictions on FDI, BA=Ben Ali presence)
Decrees Covered : Décret n° 95-1095, Décret n° 96-1234, Décret n° 96-2229, Décret n° 97-0503, Décret n° 97-783, Décret n° 98-29, Décret n° 98-2094, Décret n°
2000-821, Décret n° 2001-2444, Décret n° 2002-0518, Décret n° 2003-1676, Décret n° 2004-0008 , Décret n° 2004-1630 , Décret n° 2005-2856, Décret n° 2006-1697,
Décret n° 2007-1398, Décret n° 2007-2311, Décret n° 2007-4194, Décret 2008-3961, Décret n° 2009-2751, Décret n° 2010-825, Décret n° 2010-2936.
Activitiy in the Investment Code Sector in NAT96 Sector Code
AUT FDIR BA
Décret n° 95-1095
Transport réfrigéré des produits de la pêche Entreposage frigorifique 63121 1 S1
Décret n° 96-2229
transport réfrigéré de viandes rouges Entreposage frigorifique 63121 1 E acconage et manutention Services annexes des transports maritimes 63220 1 S2 travaux de sauvetage et de remorquage maritime Services annexes des transports maritimes 63220 1 S2 travaux de maintenance et de draguage de ports Travaux maritimes et hydrauliques 45240 1 1 Transitaires
Décret n° 97-0503
aménagement de zones industrielles et des zones destinées aux activités économiques.
Construction de bâtiments ( gros œuvre ) 45211 1 1 E
développement et maintenance de logiciels Réalisation de logiciels 72200 1 prestations machines et services informatiques Entretien et réparation de machines de bureau et de matériel
informatique 72500 1
assistance technique, études et ingénierie informatique Conseil en systèmes informatiques 72100 1 saisie et traitement de données. Traitement de données 72300 1 audit et expertise comptables Activités comptables et d'audit, conseil fiscal 74120 1 E audit et expertise énergétiques Conseil pour les affaires et la gestion 74140 1 audit économique, juridique, sociale, technique et administrative,
Conseil pour les affaires et la gestion 74140 1
audit maintenance, Conseil pour les affaires et la gestion 74140 1 études de marketing, Etudes de marché et sondages 74130 1 contrôle et expertise qualitative et quantitative, Analyses, essais et inspections techniques 74302 1 études et conseils en propriété industrielle et commerciale, Analyses, essais et inspections techniques 74302 1 certification d'entreprises, Activités juridiques 74110 1 analyse et essai de produits industriels, Analyses, essais et inspections techniques 74302 1 études techniques, travaux d'architecture, de décoration et de Ingénierie, études techniques 74203 1 E
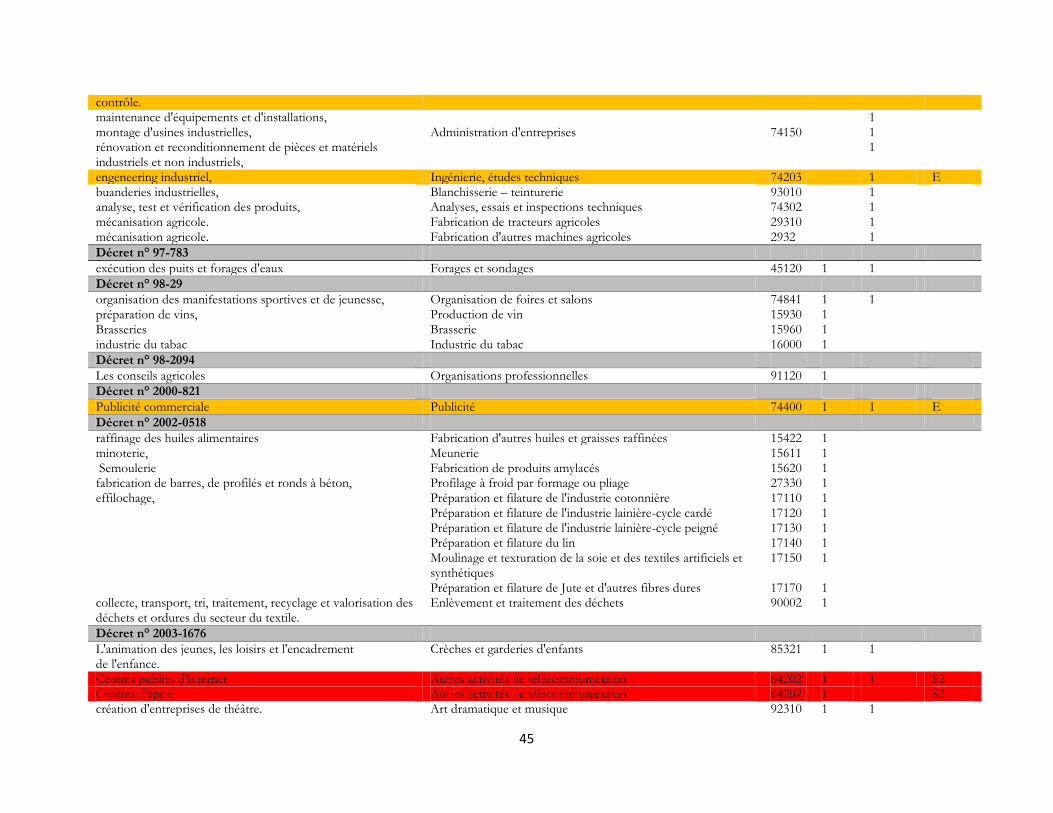
45
contrôle. maintenance d'équipements et d'installations, 1 montage d'usines industrielles, Administration d'entreprises 74150 1 rénovation et reconditionnement de pièces et matériels industriels et non industriels,
1
engeneering industriel, Ingénierie, études techniques 74203 1 E buanderies industrielles, Blanchisserie – teinturerie 93010 1 analyse, test et vérification des produits, Analyses, essais et inspections techniques 74302 1 mécanisation agricole. Fabrication de tracteurs agricoles 29310 1 mécanisation agricole. Fabrication d'autres machines agricoles 2932 1
Décret n° 97-783
exécution des puits et forages d'eaux Forages et sondages 45120 1 1
Décret n° 98-29
organisation des manifestations sportives et de jeunesse, Organisation de foires et salons 74841 1 1 préparation de vins, Production de vin 15930 1 Brasseries Brasserie 15960 1 industrie du tabac Industrie du tabac 16000 1
Décret n° 98-2094
Les conseils agricoles Organisations professionnelles 91120 1
Décret n° 2000-821
Publicité commerciale Publicité 74400 1 1 E
Décret n° 2002-0518
raffinage des huiles alimentaires Fabrication d'autres huiles et graisses raffinées 15422 1 minoterie, Meunerie 15611 1 Semoulerie Fabrication de produits amylacés 15620 1 fabrication de barres, de profilés et ronds à béton, Profilage à froid par formage ou pliage 27330 1 effilochage, Préparation et filature de l'industrie cotonnière 17110 1 Préparation et filature de l'industrie lainière-cycle cardé 17120 1 Préparation et filature de l'industrie lainière-cycle peigné 17130 1 Préparation et filature du lin 17140 1 Moulinage et texturation de la soie et des textiles artificiels et
synthétiques 17150 1
Préparation et filature de Jute et d'autres fibres dures 17170 1 collecte, transport, tri, traitement, recyclage et valorisation des déchets et ordures du secteur du textile.
Enlèvement et traitement des déchets 90002 1
Décret n° 2003-1676
L'animation des jeunes, les loisirs et l'encadrement de l'enfance.
Crèches et garderies d'enfants 85321 1 1
Centres publics d'internet Autres activités de télécommunication 64202 1 1 S2 Centres d'appel Autres activités de télécommunication 64202 1 S2 création d'entreprises de théâtre. Art dramatique et musique 92310 1 1
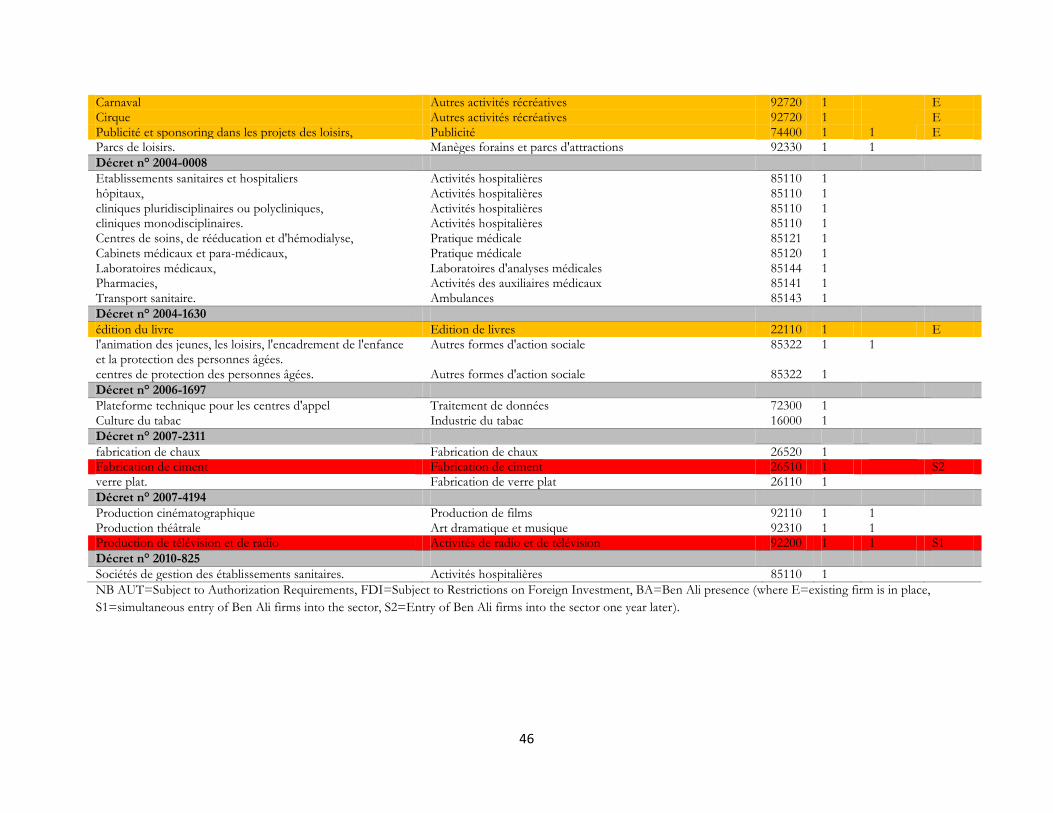
46
Carnaval Autres activités récréatives 92720 1 E Cirque Autres activités récréatives 92720 1 E Publicité et sponsoring dans les projets des loisirs, Publicité 74400 1 1 E Parcs de loisirs. Manèges forains et parcs d'attractions 92330 1 1
Décret n° 2004-0008
Etablissements sanitaires et hospitaliers Activités hospitalières 85110 1 hôpitaux, Activités hospitalières 85110 1 cliniques pluridisciplinaires ou polycliniques, Activités hospitalières 85110 1 cliniques monodisciplinaires. Activités hospitalières 85110 1 Centres de soins, de rééducation et d'hémodialyse, Pratique médicale 85121 1 Cabinets médicaux et para-médicaux, Pratique médicale 85120 1 Laboratoires médicaux, Laboratoires d'analyses médicales 85144 1 Pharmacies, Activités des auxiliaires médicaux 85141 1 Transport sanitaire. Ambulances 85143 1
Décret n° 2004-1630
édition du livre Edition de livres 22110 1 E l'animation des jeunes, les loisirs, l'encadrement de l'enfance et la protection des personnes âgées.
Autres formes d'action sociale 85322 1 1
centres de protection des personnes âgées. Autres formes d'action sociale 85322 1
Décret n° 2006-1697
Plateforme technique pour les centres d'appel Traitement de données 72300 1 Culture du tabac Industrie du tabac 16000 1
Décret n° 2007-2311
fabrication de chaux Fabrication de chaux 26520 1 Fabrication de ciment Fabrication de ciment 26510 1 S2 verre plat. Fabrication de verre plat 26110 1
Décret n° 2007-4194
Production cinématographique Production de films 92110 1 1 Production théâtrale Art dramatique et musique 92310 1 1 Production de télévision et de radio Activités de radio et de télévision 92200 1 1 S1
Décret n° 2010-825
Sociétés de gestion des établissements sanitaires. Activités hospitalières 85110 1
NB AUT=Subject to Authorization Requirements, FDI=Subject to Restrictions on Foreign Investment, BA=Ben Ali presence (where E=existing firm is in place,
S1=simultaneous entry of Ben Ali firms into the sector, S2=Entry of Ben Ali firms into the sector one year later).