Embed Size (px)
Citation preview
The Regulatory Assistance Project 50 State Street, Suite 3 Montpelier, VT 05602
Phone: 802-223-8199 web: www.raponline.org
All Cost-Effective Conservation. All???? Are You Serious?
Presentation to
Missouri Financial Research Institute
Jim Lazar RAP Senior Advisor
June 13, 2012
About Jim Lazar
Jim Lazar is a RAP Senior Advisor, based in Olympia, WA
• Economist with 34 years experience in utility resource planning, rate
development, and financial analysis
• Expert witness in more than 100 rate proceedings on revenue
requirement, cost allocation, rate design, and energy efficiency.
• Participated in development of energy efficiency programs in Washington,
Oregon, Idaho, Montana, California, Arizona, and British Columbia
• Assisted RAP in many US states, plus Brazil, China, Hungary, India,
Indonesia, Israel, Mauritius, Mozambique, Namibia, Philippines
• Author or co-author of RAP publications on Electricity Regulation,
Energy Efficiency, Pricing, and Emissions Costs.
Many thanks to the American Council for an Energy-Efficient Economy
for several of the graphics in this presentation. www.aceee.org
2
Acquiring “All” Cost-Effective
Energy Conservation
• Defining and measuring cost-effectiveness
• Show where it’s happening
• Ramping up programs gradually
• Illustrate financial and ratepayer benefits
• Give examples of “best states”
• Addressing utility financial impact: the
“least-cost strategy” should be the most
profitable strategy.
3
4
What Do We Mean By “All Cost-Effective” Conservation
• Only discussing electricity; you can draw parallels to
natural gas, water, and even transportation.
• Many market barriers; Experience shows that the utility
system must be involved in programs.
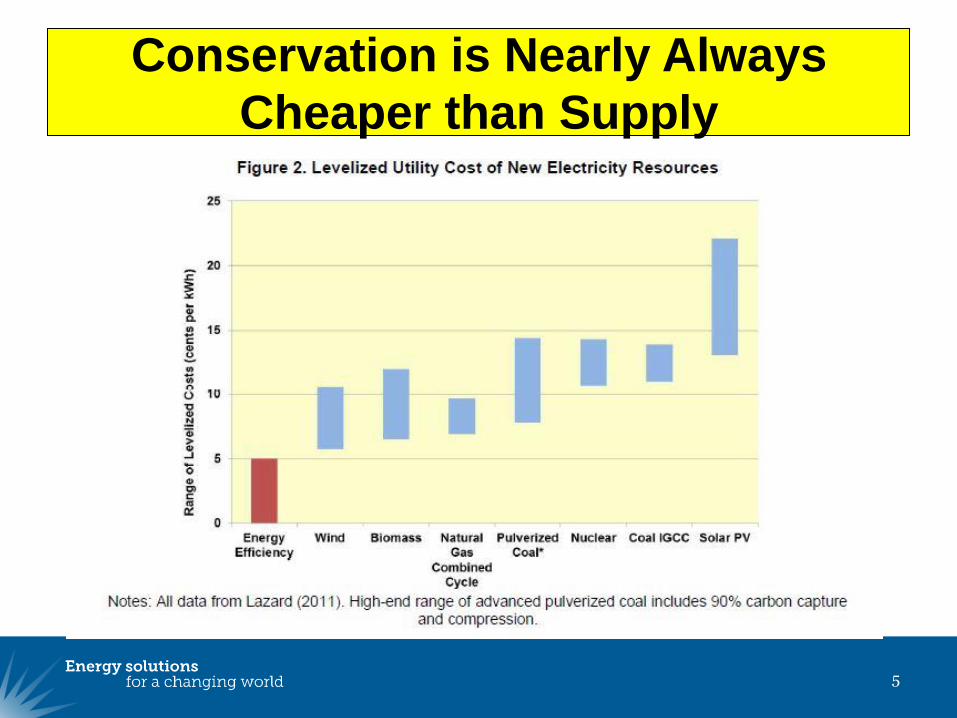
• “Cost-effective” means it costs less than a supply-side
alternative over the life-cycle of the measure.
• Saves money compared with the alternative; a failure to
deploy leaves money on the table.
• Should (where needed) include non-energy benefits, such
as reduced maintenance cost.
• Includes utility programs, governmental programs, building
codes and appliance standards, and education.
5
Conservation is Nearly Always
Cheaper than Supply
6
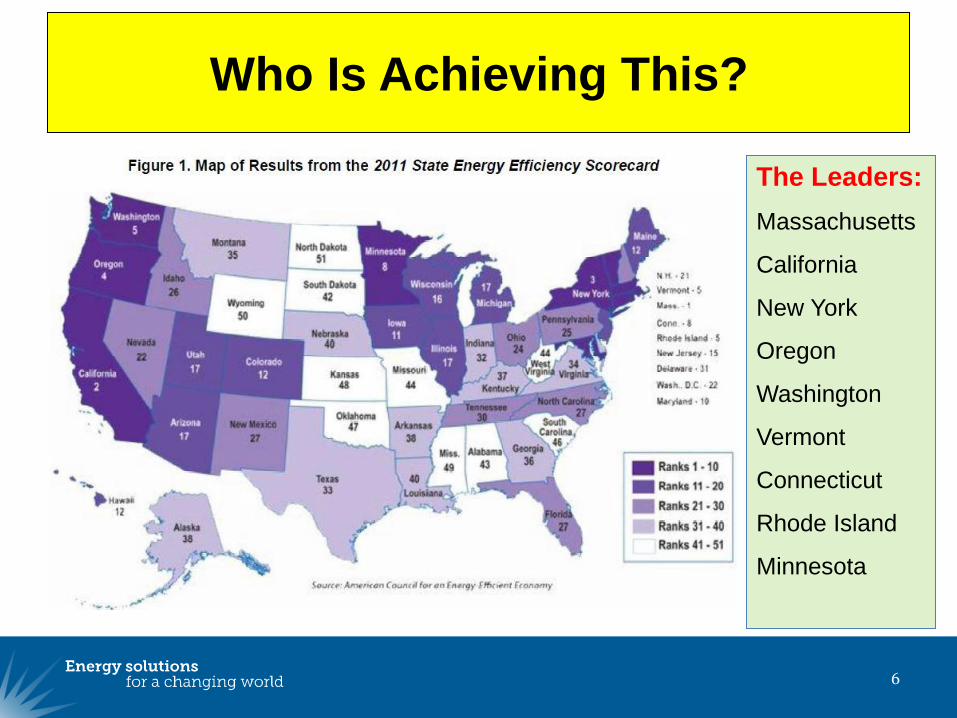
Who Is Achieving This?
The Leaders:
Massachusetts
California
New York
Oregon
Washington
Vermont
Connecticut
Rhode Island
Minnesota
7
Energy Efficiency Has
MANY Benefits
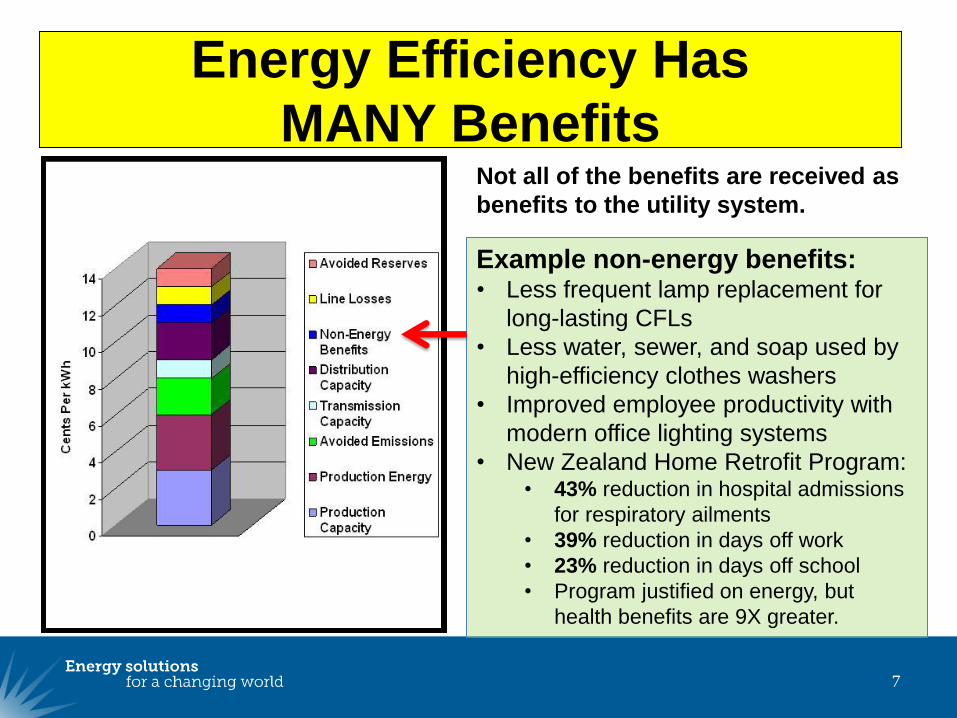
Example non-energy benefits: • Less frequent lamp replacement for
long-lasting CFLs
• Less water, sewer, and soap used by
high-efficiency clothes washers
• Improved employee productivity with
modern office lighting systems
• New Zealand Home Retrofit Program: • 43% reduction in hospital admissions
for respiratory ailments
• 39% reduction in days off work
• 23% reduction in days off school
• Program justified on energy, but
health benefits are 9X greater.
Not all of the benefits are received as
benefits to the utility system.
8
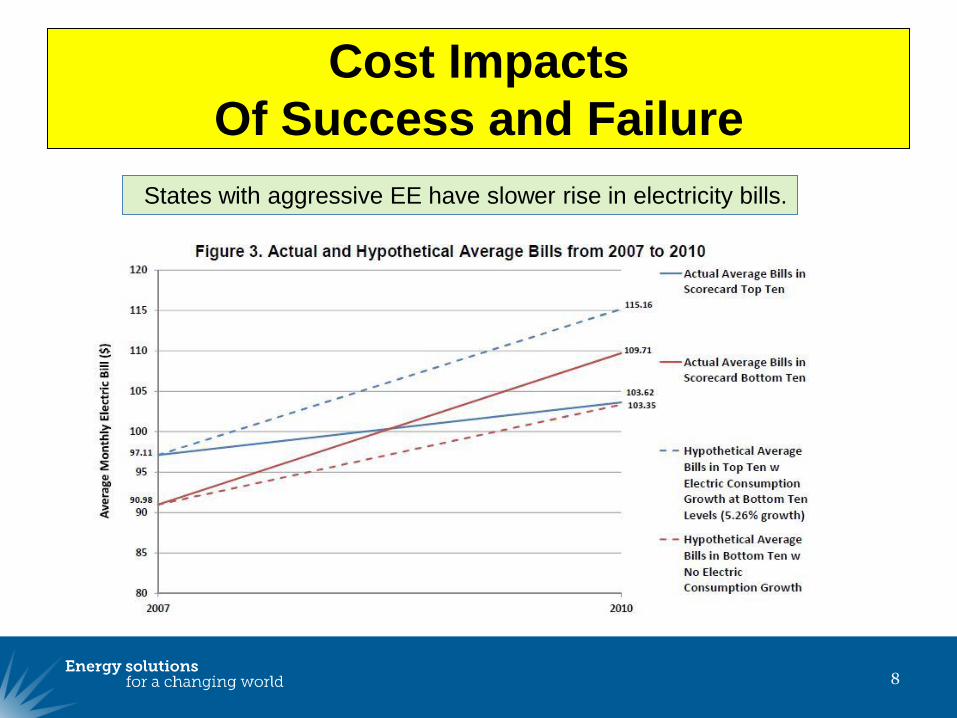
Cost Impacts
Of Success and Failure
States with aggressive EE have slower rise in electricity bills.
9
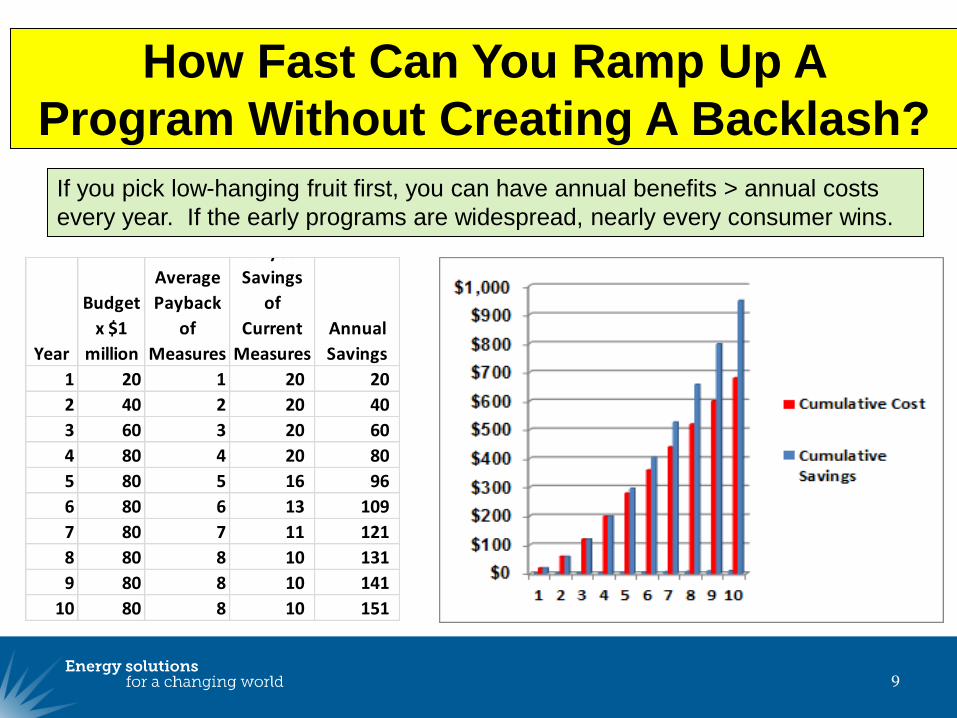
How Fast Can You Ramp Up A
Program Without Creating A Backlash?
Year
Budget
x $1
million
Average
Payback
of
Measures
1st year
Savings
of
Current
Measures
Annual
Savings
1 20 1 20 20
2 40 2 20 40
3 60 3 20 60
4 80 4 20 80
5 80 5 16 96
6 80 6 13 109
7 80 7 11 121
8 80 8 10 131
9 80 8 10 141
10 80 8 10 151
If you pick low-hanging fruit first, you can have annual benefits > annual costs
every year. If the early programs are widespread, nearly every consumer wins.
10
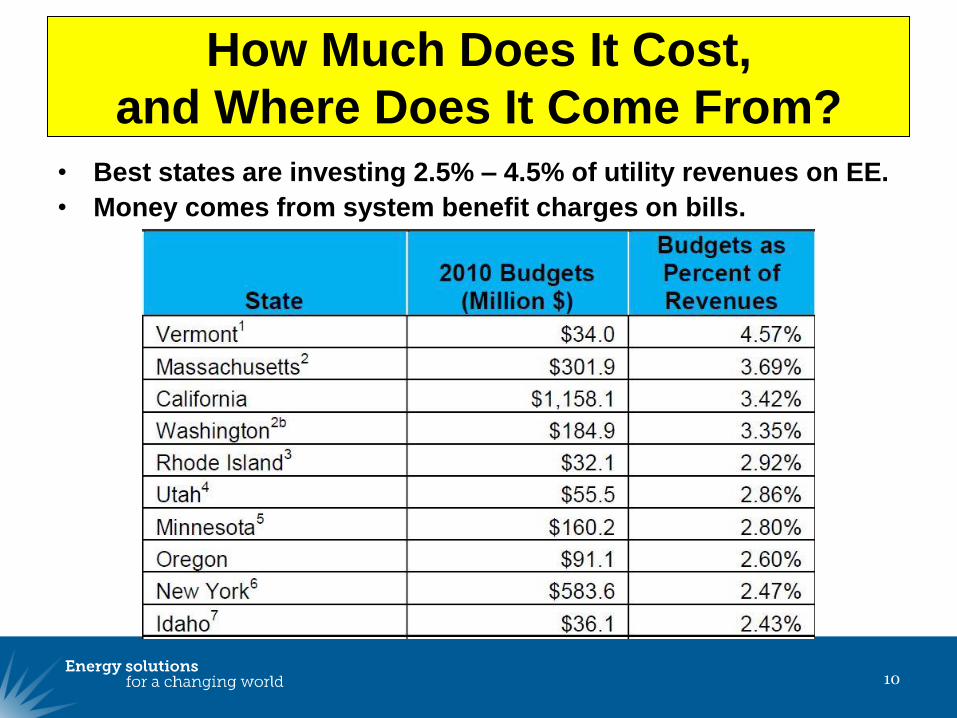
How Much Does It Cost,
and Where Does It Come From?
• Best states are investing 2.5% – 4.5% of utility revenues on EE.
• Money comes from system benefit charges on bills.
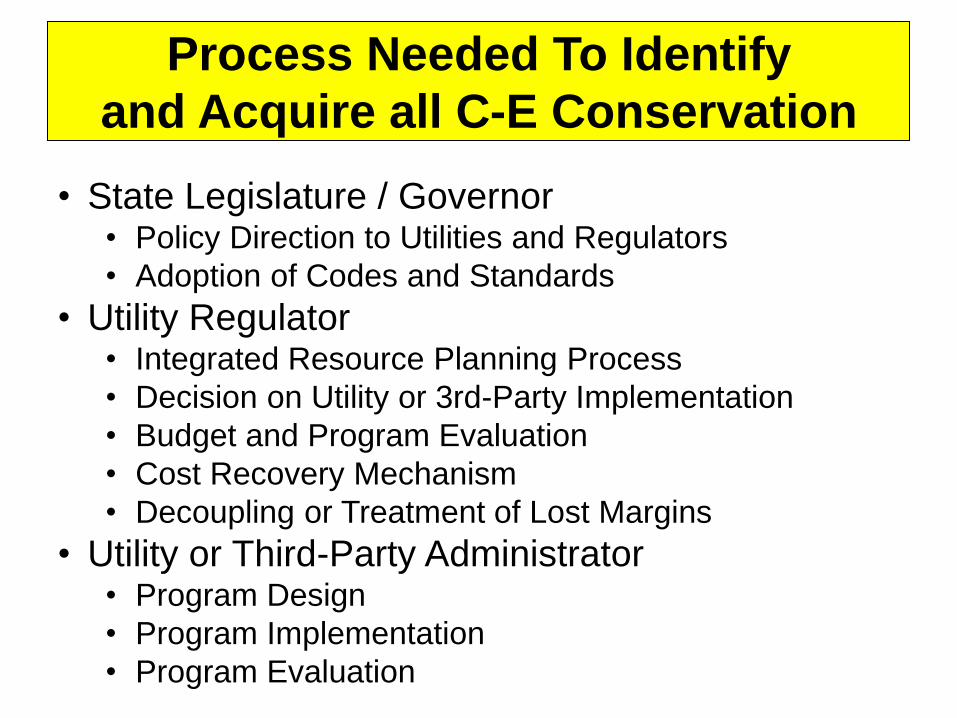
Process Needed To Identify
and Acquire all C-E Conservation
11
• State Legislature / Governor • Policy Direction to Utilities and Regulators
• Adoption of Codes and Standards
• Utility Regulator • Integrated Resource Planning Process
• Decision on Utility or 3rd-Party Implementation
• Budget and Program Evaluation
• Cost Recovery Mechanism
• Decoupling or Treatment of Lost Margins
• Utility or Third-Party Administrator • Program Design
• Program Implementation
• Program Evaluation
12
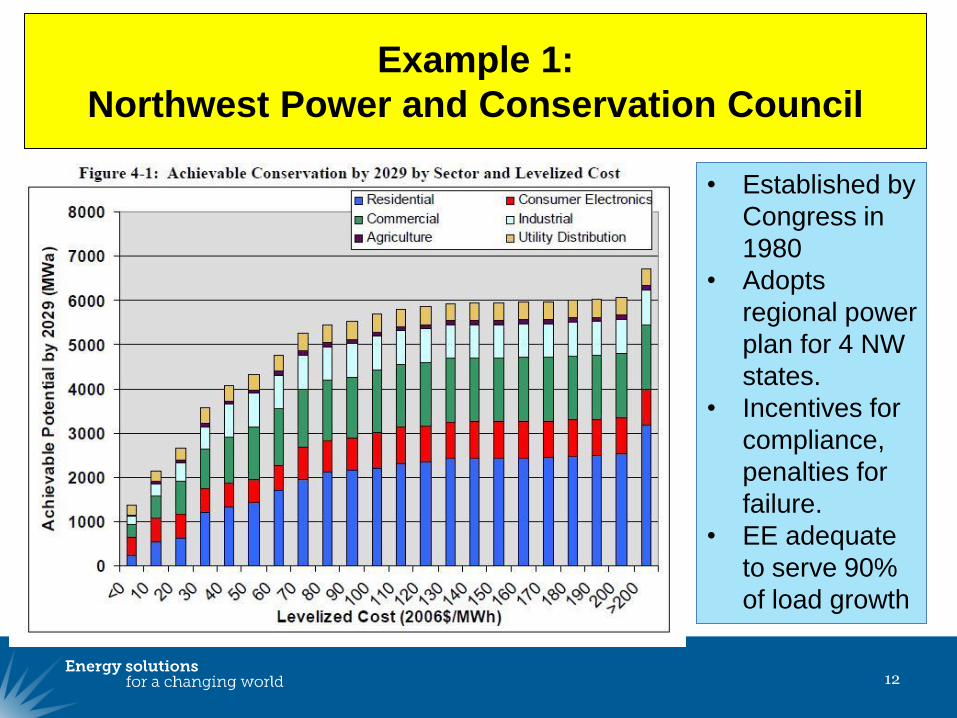
Example 1:
Northwest Power and Conservation Council
• Established by
Congress in
1980
• Adopts
regional power
plan for 4 NW
states.
• Incentives for
compliance,
penalties for
failure.
• EE adequate
to serve 90%
of load growth
13
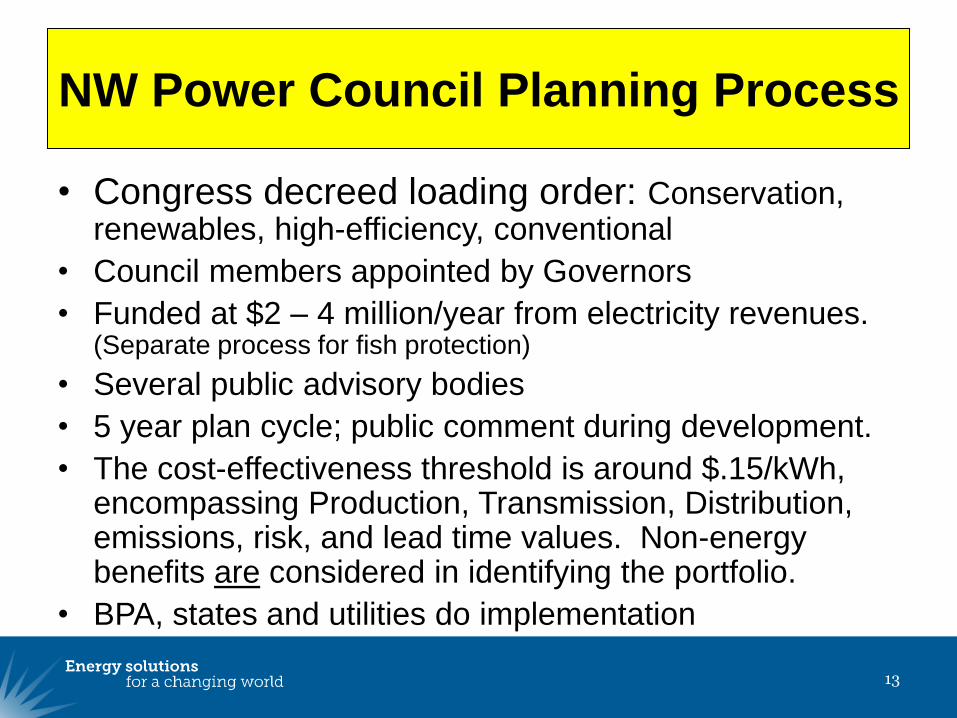
NW Power Council Planning Process
• Congress decreed loading order: Conservation, renewables, high-efficiency, conventional
• Council members appointed by Governors
• Funded at $2 – 4 million/year from electricity revenues. (Separate process for fish protection)
• Several public advisory bodies
• 5 year plan cycle; public comment during development.
• The cost-effectiveness threshold is around $.15/kWh, encompassing Production, Transmission, Distribution, emissions, risk, and lead time values. Non-energy benefits are considered in identifying the portfolio.
• BPA, states and utilities do implementation
14
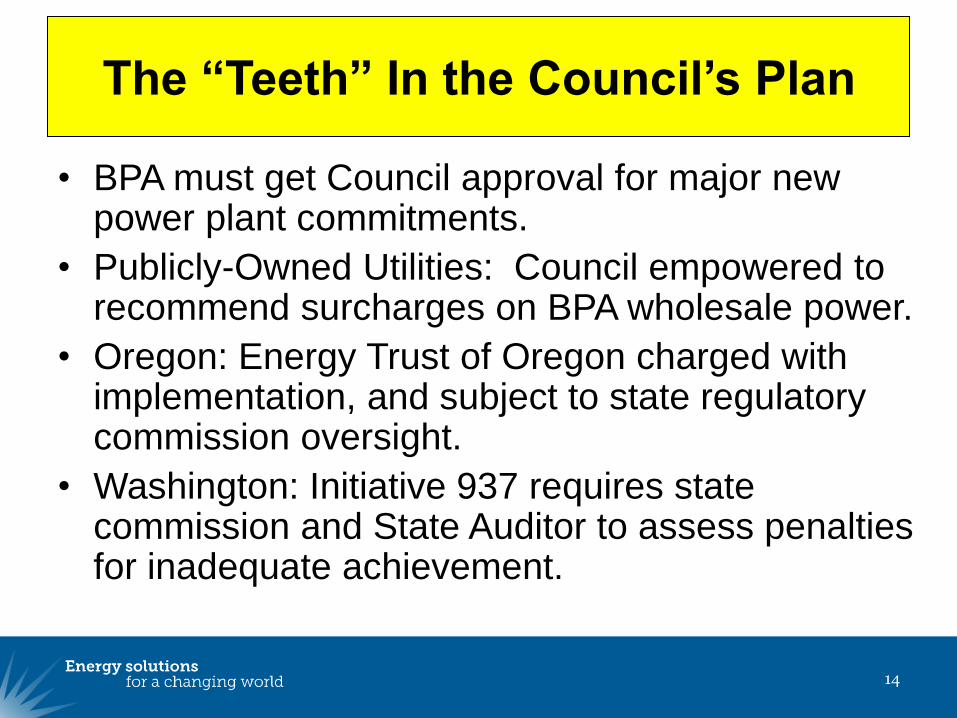
The “Teeth” In the Council’s Plan
• BPA must get Council approval for major new power plant commitments.
• Publicly-Owned Utilities: Council empowered to recommend surcharges on BPA wholesale power.
• Oregon: Energy Trust of Oregon charged with implementation, and subject to state regulatory commission oversight.
• Washington: Initiative 937 requires state commission and State Auditor to assess penalties for inadequate achievement.
15
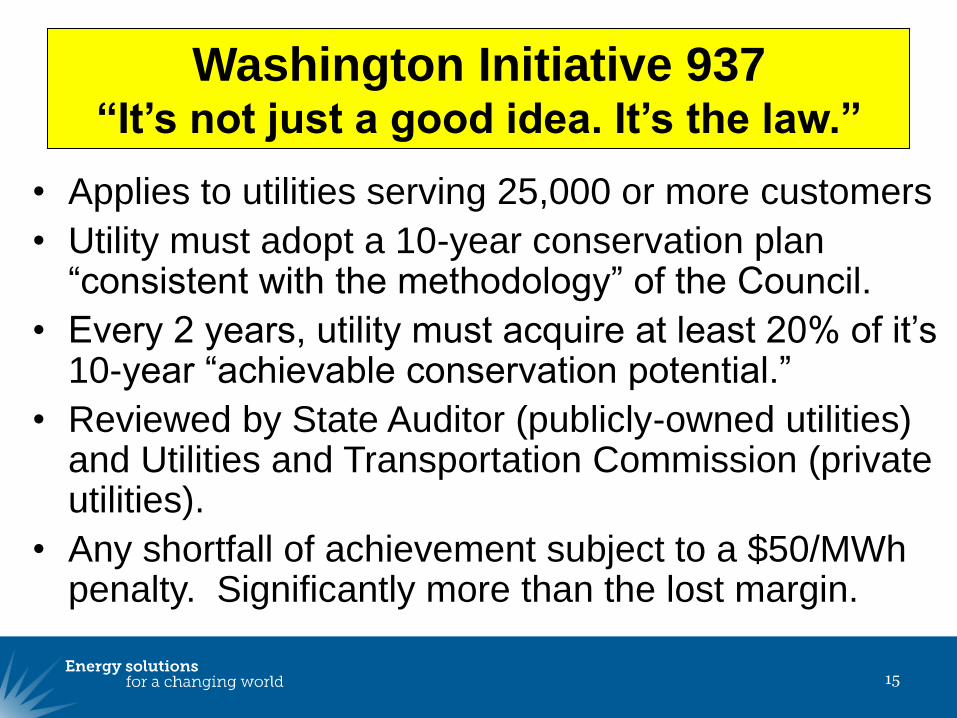
Washington Initiative 937 “It’s not just a good idea. It’s the law.”
• Applies to utilities serving 25,000 or more customers
• Utility must adopt a 10-year conservation plan “consistent with the methodology” of the Council.
• Every 2 years, utility must acquire at least 20% of it’s 10-year “achievable conservation potential.”
• Reviewed by State Auditor (publicly-owned utilities) and Utilities and Transportation Commission (private utilities).
• Any shortfall of achievement subject to a $50/MWh penalty. Significantly more than the lost margin.
16
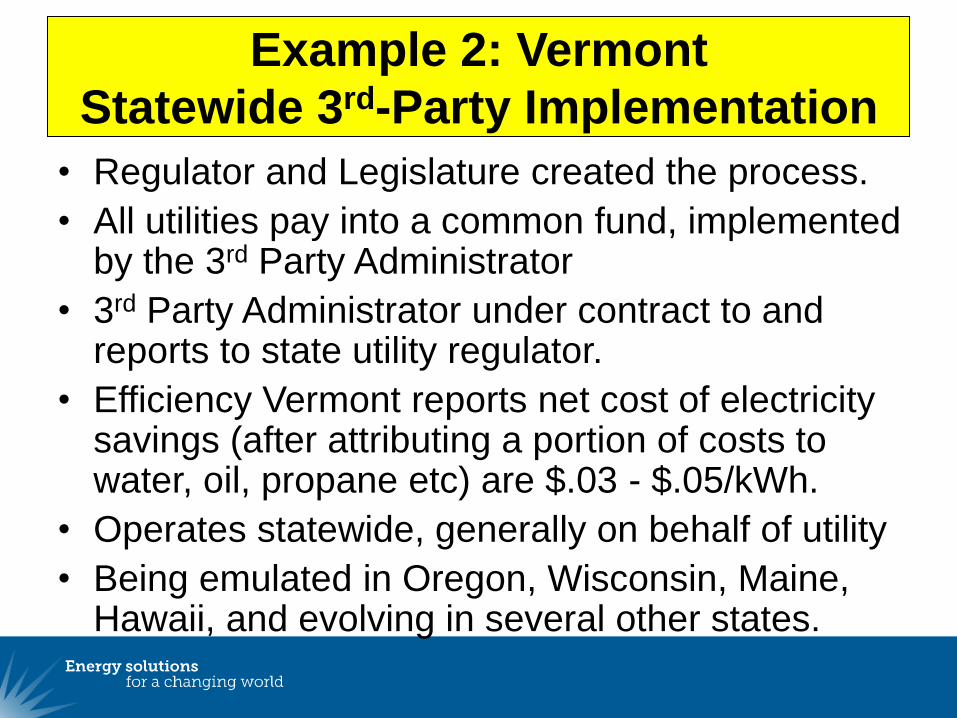
Example 2: Vermont
Statewide 3rd-Party Implementation
• Regulator and Legislature created the process.
• All utilities pay into a common fund, implemented by the 3rd Party Administrator
• 3rd Party Administrator under contract to and reports to state utility regulator.
• Efficiency Vermont reports net cost of electricity savings (after attributing a portion of costs to water, oil, propane etc) are $.03 - $.05/kWh.
• Operates statewide, generally on behalf of utility
• Being emulated in Oregon, Wisconsin, Maine, Hawaii, and evolving in several other states.
17
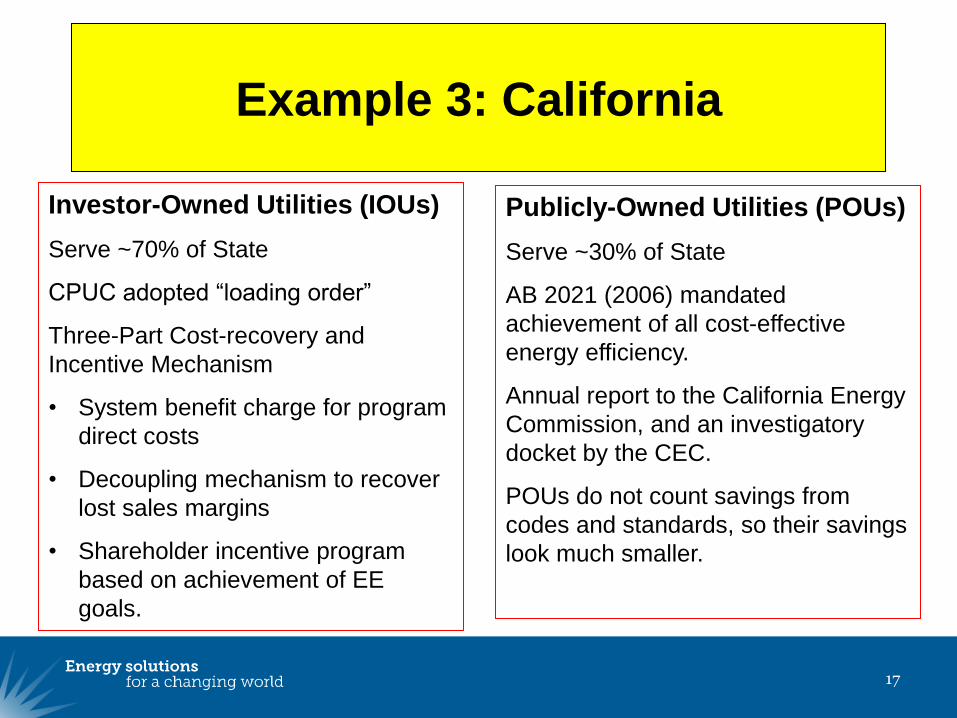
Example 3: California
Investor-Owned Utilities (IOUs)
Serve ~70% of State
CPUC adopted “loading order”
Three-Part Cost-recovery and
Incentive Mechanism
• System benefit charge for program
direct costs
• Decoupling mechanism to recover
lost sales margins
• Shareholder incentive program
based on achievement of EE
goals.
Publicly-Owned Utilities (POUs)
Serve ~30% of State
AB 2021 (2006) mandated
achievement of all cost-effective
energy efficiency.
Annual report to the California Energy
Commission, and an investigatory
docket by the CEC.
POUs do not count savings from
codes and standards, so their savings
look much smaller.
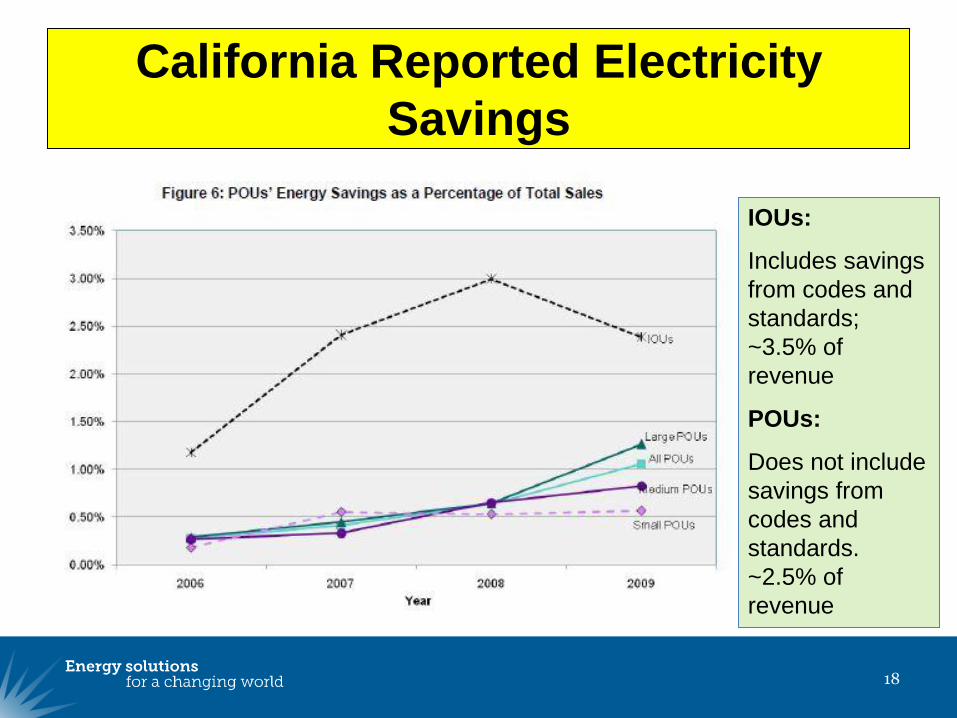
18
California Reported Electricity
Savings
IOUs:
Includes savings
from codes and
standards;
~3.5% of
revenue
POUs:
Does not include
savings from
codes and
standards.
~2.5% of
revenue
19
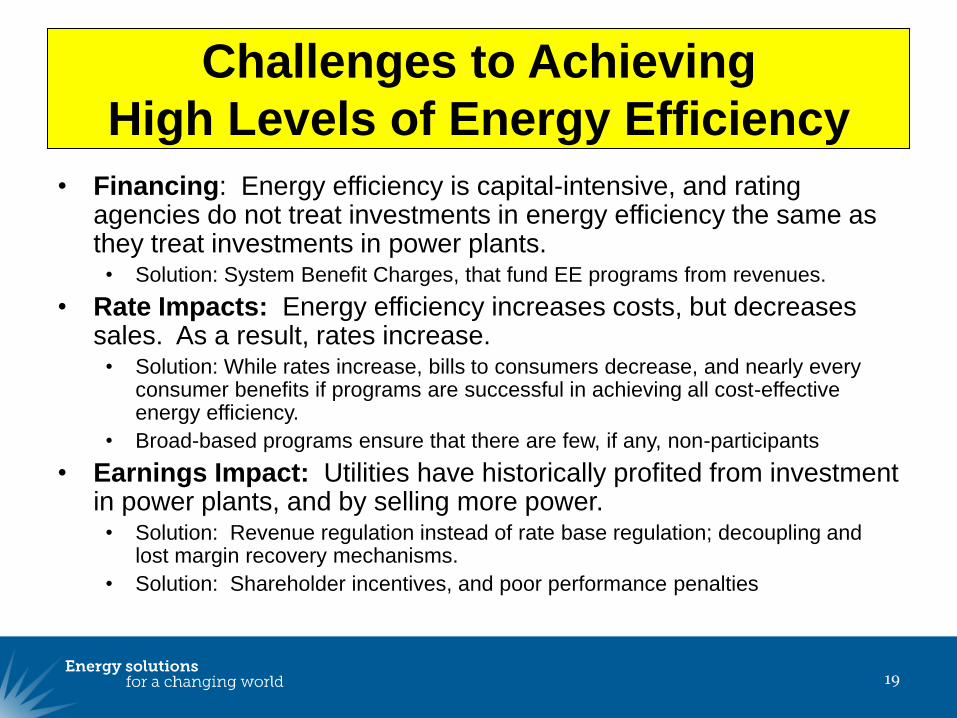
Challenges to Achieving
High Levels of Energy Efficiency
• Financing: Energy efficiency is capital-intensive, and rating agencies do not treat investments in energy efficiency the same as they treat investments in power plants.
• Solution: System Benefit Charges, that fund EE programs from revenues.
• Rate Impacts: Energy efficiency increases costs, but decreases sales. As a result, rates increase.
• Solution: While rates increase, bills to consumers decrease, and nearly every consumer benefits if programs are successful in achieving all cost-effective energy efficiency.
• Broad-based programs ensure that there are few, if any, non-participants
• Earnings Impact: Utilities have historically profited from investment in power plants, and by selling more power.
• Solution: Revenue regulation instead of rate base regulation; decoupling and lost margin recovery mechanisms.
• Solution: Shareholder incentives, and poor performance penalties
20
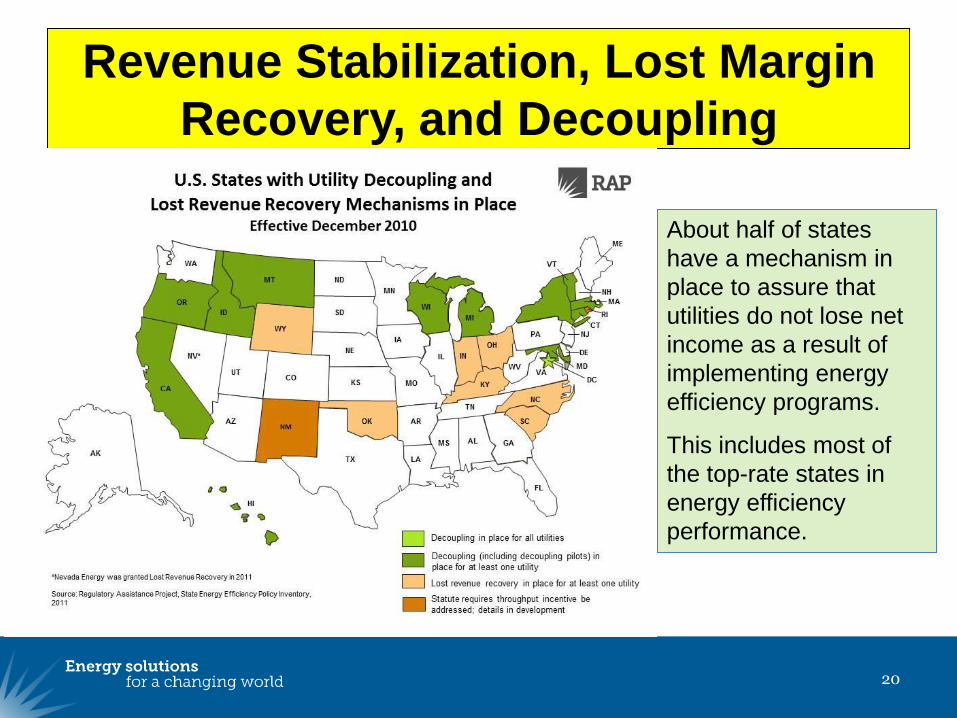
Revenue Stabilization, Lost Margin
Recovery, and Decoupling
About half of states
have a mechanism in
place to assure that
utilities do not lose net
income as a result of
implementing energy
efficiency programs.
This includes most of
the top-rate states in
energy efficiency
performance.
About RAP
The Regulatory Assistance Project (RAP) is a global, non-profit team of experts that focuses on the long-term economic and environmental sustainability of the power and natural gas sectors. RAP has deep expertise in regulatory and market policies that:
Promote economic efficiency Protect the environment Ensure system reliability Allocate system benefits fairly among all consumers
Learn more about RAP at www.raponline.org
Jim Lazar: [email protected]