Embed Size (px)
Citation preview
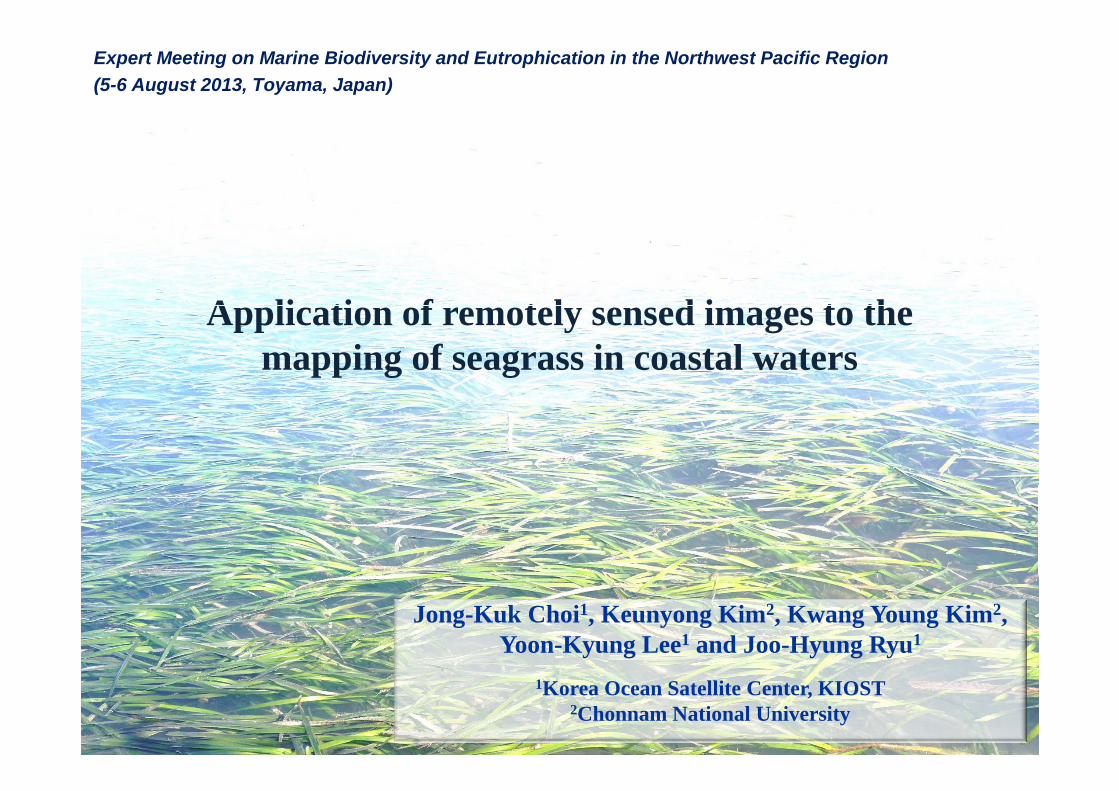
Expert Meeting on Marine Biodiversity and Eutrophication in the Northwest Pacific Region(5-6 August 2013, Toyama, Japan)
A li ti f t l d i t thApplication of remotely sensed images to the mapping of seagrass in coastal waters
Jong-Kuk Choi1, Keunyong Kim2, Kwang Young Kim2, Yoon-Kyung Lee1 and Joo-Hyung Ryu1
1Korea Ocean Satellite Center, KIOST2Chonnam National University

ContentsContents
Seagrass mapping in the Korean coastal water
Tidal flat application
Coral reef habitat mapping
Geostationary Ocean Color Imager (GOCI)

ContentsContents
Seagrass mapping in the Korean coastal water
Tidal flat application
Coral reef habitat mapping
Geostationary Ocean Color Imager (GOCI)

Global seagrass diversity and distributionGlobal seagrass diversity and distribution
Zostera marina, Z. caulescens, Z j i Z i iZ. japonica, Z. asiatica, Z. caespitosaPhyllospadix iwatensis, P japonicusP. japonicusRuppia maritimaHalophila nipponica Short et al. 2007
4 genus, 5 species inhabit in Korea

Why seagrass beds are important?Why seagrass beds are important?
Provides habitats of a variety of coastal organismsProvides habitats of a variety of coastal organisms
Produces organic clasts through photosynthesis
Dominates substances circulation in the coastal ecosystems by secreting
di l d i ttdissolved organic matter
Provides fields for spawning and growth of the fish of large economic value
Stabilizes bottom sediment by controlling their movement and suspension
very large ecological value in the coastal region

Mapping seagrassMapping seagrass
Physical SamplingSeagrass beds
Due to high ecological value of seagrass beds, studies on its distribution,
production, etc. have been continuously carried out in Korea
H di t ib ti d bi h h b i d t iHowever, seagrass distribution and biomass research has been carried out in
some limited areas and depth because it relies on the direct sampling method
through scuba diving

Methods for mapping seagrassMethods for mapping seagrass
Underwater Videography
Hydroacoustics Aerial & Satellite image
To overcome the difficulties in the research on the distribution and spatiotemporal
changes of seagrass, diverse techniques like underwater photography, underwater
ti d t i l dacoustics and remote sensing are employed
Underwater photography using video camera has an advantage in that it can identify
species density and plant health status with relatively low cost However dataspecies, density, and plant health status with relatively low cost. However, data
collection is limited due to a narrow range of observation, and in particular, the
accuracy is influenced by the turbidity of the water, which lead to difficulties in
analyzing whole vegetated sites.

Methods for mapping seagrassMethods for mapping seagrass
Underwater Videography
Hydroacoustics Aerial & Satellite image
Recently aerial photography is widely used. It can obtain images of wide area,
but due to the large cost it is not suitable for repeated temporal analysis for abut due to the large cost it is not suitable for repeated temporal analysis for a
particular region
Remote sensing technique is an effective way for the study on the temporalRemote sensing technique is an effective way for the study on the temporal
and spatial distribution of algae that live in the broadband

Aims of studyAims of study
Satellite remote sensinggmethod
- Mapping - Wide area- Time-series data
Application of a
t llit i tiHydroacousticmethod
Time series data
- HeightCoverage
satellite image time-
series to map changes
of seagrass beds- Coverage- Mapping
of seagrass beds
Evaluate the accuracyEvaluate the accuracy
of satellite image for
mapping seagrass bedsDirect sampling
method- Height- Coverage
mapping seagrass beds
in turbid and shallow
coastal watersg- Biomass
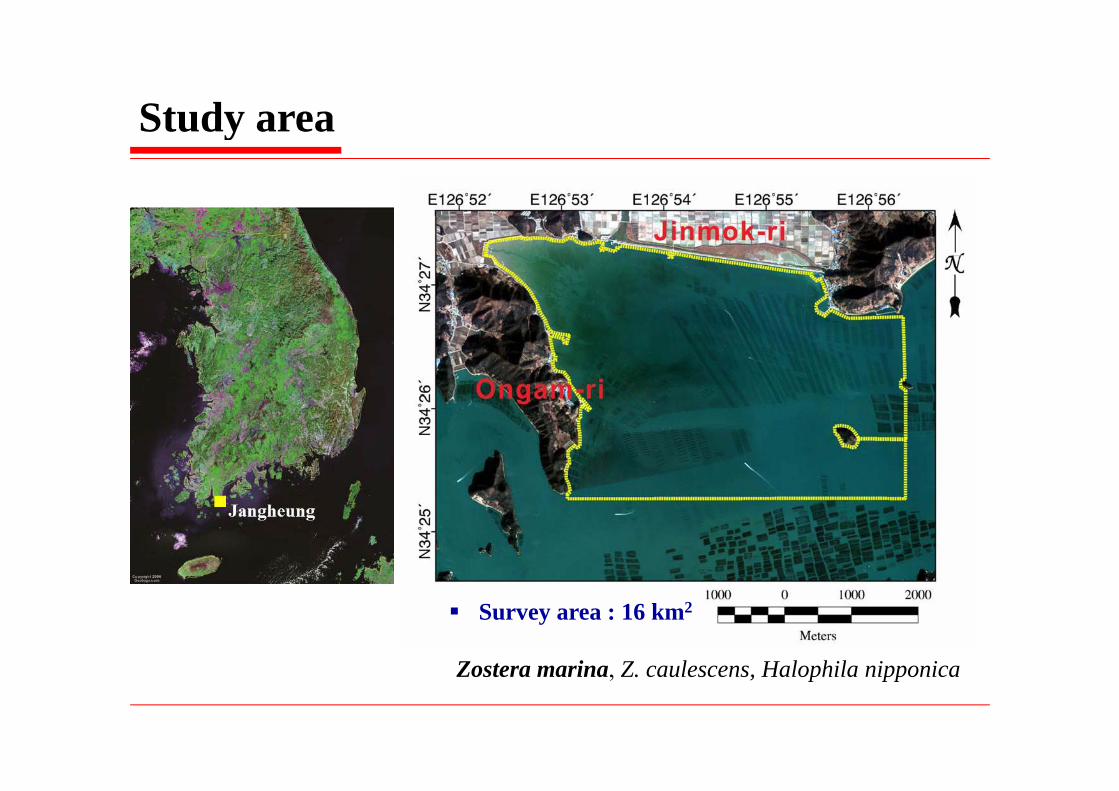
Study areaStudy area
Survey area : 16 km2
Z t i Z l H l hil i iZostera marina, Z. caulescens, Halophila nipponica

Hydroacoustic surveyHydroacoustic survey
(D)(A) (B) (D)
(C)
Equipment- Digital Echosounder (Biosonics, USA)g ( , )> beam width : 6°(420KHz)> pulse width : 0.1 ms> pings rates : 5 pings s-1
Accurate positioning of the surveyed location was secured - DGPS (horizontal error : ± 5 m)
> ship speed : 2 m s-1- DGPS (horizontal error : ± 5 m)
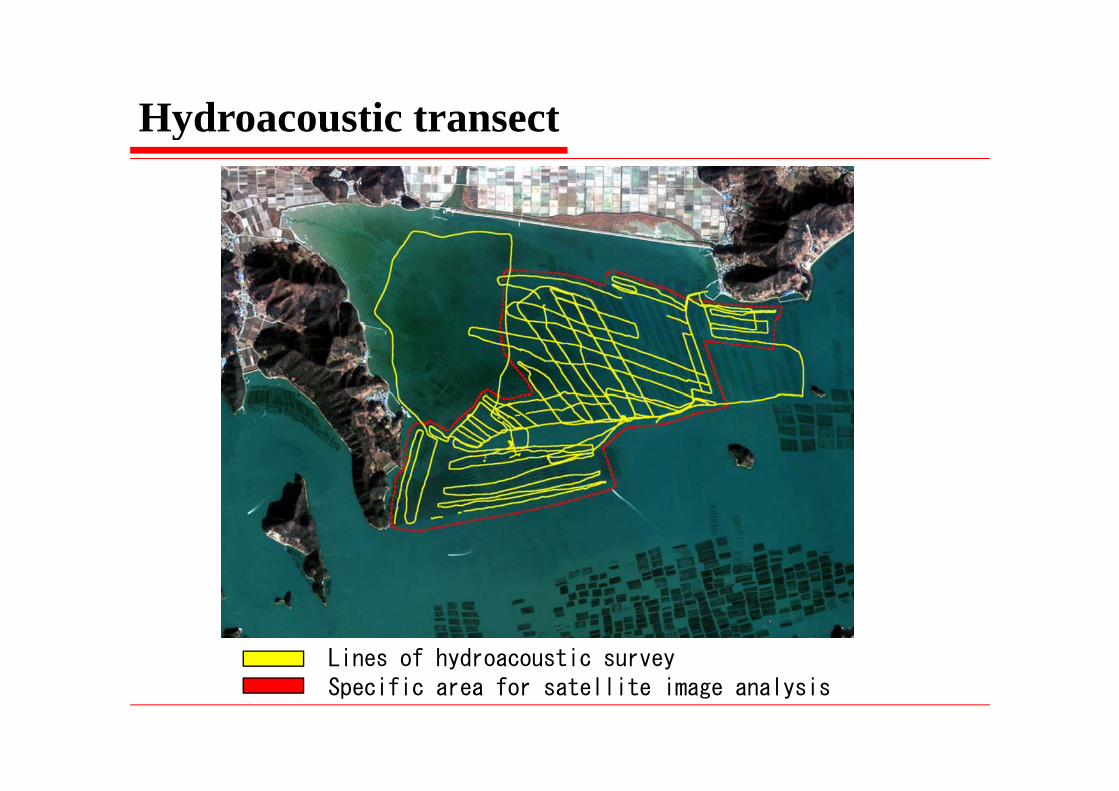
Hydroacoustic transectHydroacoustic transect
Lines of hydroacoustic surveyLines of hydroacoustic surveySpecific area for satellite image analysis

Analysis of satellite imageAnalysis of satellite imageSatellite scene Date Time Low tideLandsat 5TM 1995. 11. 27 10:05 07:00 (042) 13:00 (369)Landsat 5TM 1999. 3. 11 10:44 05:00 (250) 11:00 (170)Landsat 5TM 2000 3 13 10:39 09:00 (136) 15:00 (256)Landsat 5TM 2000. 3. 13 10:39 09:00 (136) 15:00 (256)Landsat 5TM 2001. 4. 1 10:45 09:00 (145) 14:00 (237)
Landsat 7ETM 2002. 2. 7 10:54 07:00 (275) 14:00 (146)( ) ( )Spot-4 2004. 2. 27 11:38 09:00 (141) 14:00 (254)
Kompsat-2 2007. 12. 20 10:36 07:00 (301) 13:00 (129)Aster 2011. 3. 27 11:24 11:41 (159) 16:46 (206)
Kompsat-2 2012. 1. 7 10:30 09:13 (321) 15:42 (108)
Image classificationMahalanobis distance classification (MDC) : one of the cluster analysisMahalanobis distance classification (MDC) : one of the cluster analysis

Field observation & in situ spectral measurementField observation & in situ spectral measurement
Field observation- 2012. 1. 17-20
(A)Seagrass beds & unvegetated area(B) Unvegetated seawater
- 2012. 2. 20
EquipmentFi ldS 3 (ASD I USA)
(C) Seagrass beds(D)Seaweed aquaculture
- FieldSpec3 (ASD Inc., USA)

Optical data measurementOptical data measurement- Total water leaving radiance (LwT)
- Sky radiance (Lsky)Sky radiance (Lsky)
- Down-welling irradiance (Ed)
- Radiance from white reference plate (Lwhite)
for data calibration
Ed
for data calibration
- Instrument : dual field spectroradiometer (ASD Inc.)
Ed
Ed
Lsky
LwT

Accuracy evaluation of satellite image classificationAccuracy evaluation of satellite image classification
1 2 3 4 5
1. Field observation for error matrix 2. Correlation map
1
2
3
4
5
Kompsat-2 classification
1 2 3 4 5
5
1
2
33
4
5
50% of in-situ measurement was used for the validation(error matrix)
Hydroacoustic mapping

Results from hydroacoustic surveyResults from hydroacoustic survey
cover rate
seagrass height
Seagrass area from hydroacoustic survey : 4.5 km2
Seagrass were mainly distributed within 0 2 m depth based on the lowest low water levelSeagrass were mainly distributed within 0-2 m depth based on the lowest low water levelNo seagrass in the area of 7-9 m depth

Field spectrumField spectrum
Seagrass
Seawater
AquacultureAquaculture

Spatial & spectral resolutionSpatial & spectral resolution
Band Kompsat-2 Spot-4 Aster Landsat-5Bl 0 45 0 52 0 45 0 52Blue 0.45-0.52 - - 0.45-0.52
Green 0.52-0.60 0.50-0.59 0.52-0.60 0.52-0.60Red 0.63-0.69 0.61-0.68 0.63-0.69 0.63-0.69Red 0.63 0.69 0.61 0.68 0.63 0.69 0.63 0.69NIR 0.76-0.90 0.78-0.89 0.78-0.86 0.76-0.90
Spatial l i 4 m 10 m 15 m 30 mresolution 4 m 10 m 15 m 30 m

Reflectance correction using spectral response functionReflectance correction using spectral response function
Kmpsat-2 Landsat-5
Spot-4Aster
Seagrass Seawater
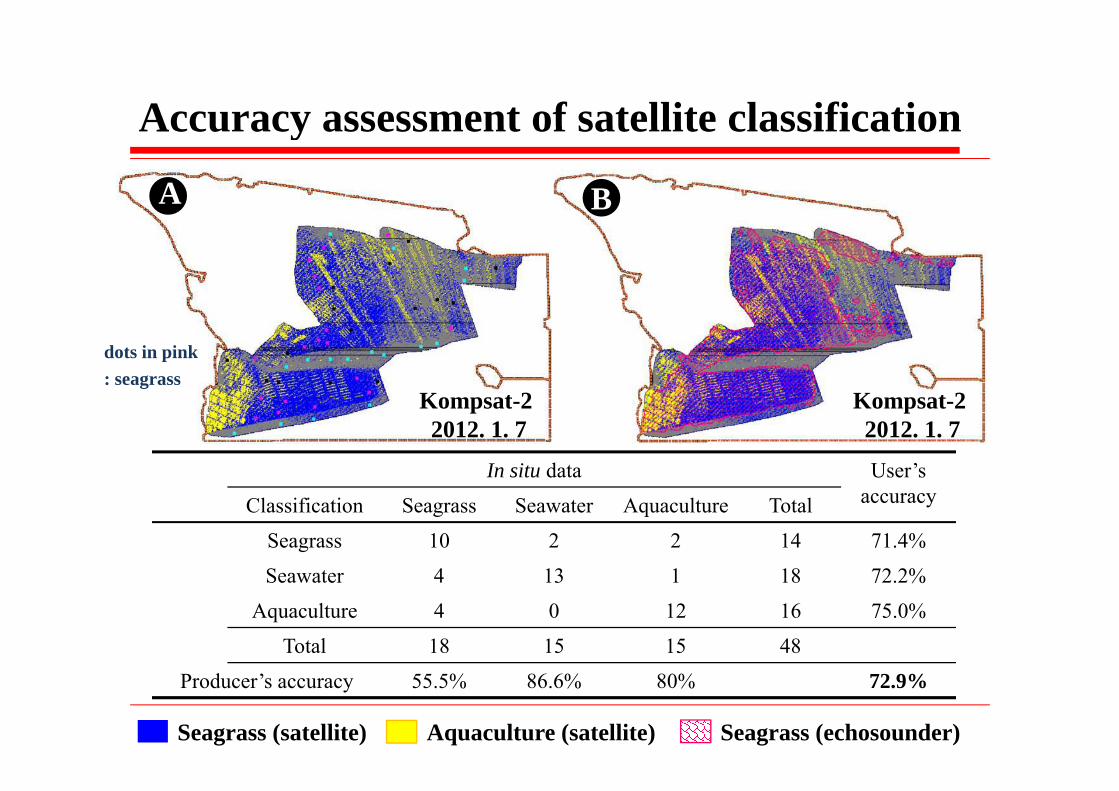
Accuracy assessment of satellite classificationAccuracy assessment of satellite classification
A B
K t 2 K t 2
dots in pink : seagrass
In situ data User’s
Kompsat-2 2012. 1. 7
Kompsat-2 2012. 1. 7
accuracyClassification Seagrass Seawater Aquaculture Total
Seagrass 10 2 2 14 71.4%
Seawater 4 13 1 18 72 2%Seawater 4 13 1 18 72.2%
Aquaculture 4 0 12 16 75.0%
Total 18 15 15 48
Seagrass (satellite) Seagrass (echosounder)
Producer’s accuracy 55.5% 86.6% 80% 72.9%
Aquaculture (satellite)

Spatial distribution of seagrass bedsSpatial distribution of seagrass beds

Spatial distribution of seagrass bedsSpatial distribution of seagrass beds
1999 (Maximum) 2011 (Minimum)

Long term changes of seagrass distributionLong term changes of seagrass distribution
ContentsContents
Seagrass mapping in the Korean coastal water
Tidal flat application
Coral reef habitat mapping
Geostationary Ocean Color Imager (GOCI)
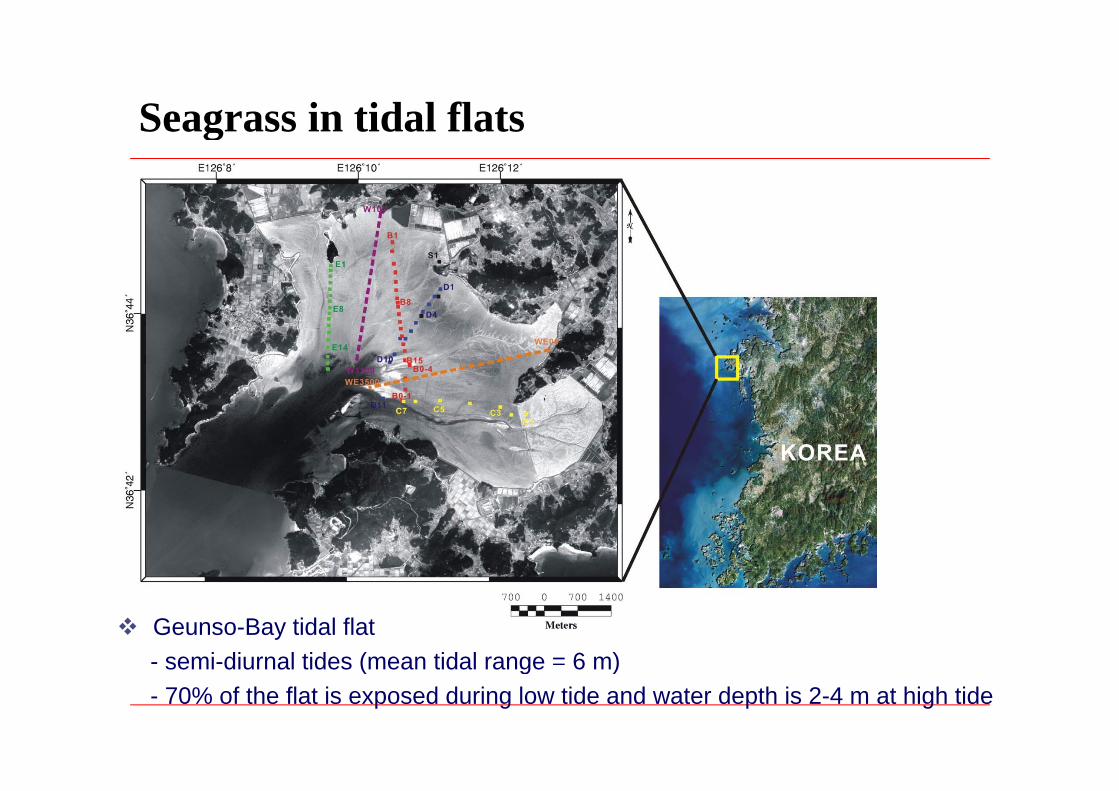
Seagrass in tidal flatsSeagrass in tidal flats
Geunso-Bay tidal flat- semi-diurnal tides (mean tidal range = 6 m)semi diurnal tides (mean tidal range 6 m)- 70% of the flat is exposed during low tide and water depth is 2-4 m at high tide

Seagrass in tidal flatsSeagrass in tidal flats
d) NDVI (NIR-R / NIR+R)
: clear pattern of seagrass,
c) NIR+Red+Green of Landsat ETM+ (February 20 2004)
p g ,
diatom
c) NIR+Red+Green of Landsat ETM+ (February 20, 2004)� red area : chlorophyll dominant (seagrass at the bay mouth, Fig. a)
widely reddish area : algal mat (Fig. b)

Diatom blooming in tidal flat surfaceDiatom blooming in tidal flat surface
Overall concentration of Chlorophyll a p y- 88.0 ~ 222.1 mg·m-2 (February, 2007)- 43.2 ~ 115.9 mg·m-2 (May, 2007)Algal mat, which has been formed by diatom blooming, is well developed at someAlgal mat, which has been formed by diatom blooming, is well developed at somesampling locations in February

Diatom blooming in tidal flat surfaceDiatom blooming in tidal flat surface
Seasonal variations in diatom
distribution Landsat ETM+
- clear pattern of diatomclear pattern of diatom
blooming in tidal surface was
identified in the image from g
October to February
- decrease until September p
and increase again
- specific blooming in thespecific blooming in the
center part of study area from
the image of Februaryg y

ContentsContents
Seagrass mapping in the Korean coastal water
Tidal flat application
Coral reef habitat mapping
Geostationary Ocean Color Imager (GOCI)

Coral reef habitat in Weno Island, FSMCoral reef habitat in Weno Island, FSM
Korea-South pacific Ocean Research CenterResearch Center, KSORC
Weno island in the Chuuk lagoon of Federated States of MicronesiaWeno island in the Chuuk lagoon of Federated States of Micronesia- biodiversity : Mangrove forest, Seagrass, Coral reef comunities

Seagrass in Weno Island, FSMSeagrass in Weno Island, FSMLong Seagrass Short Seagrass
C lCoral

Coral reef habitat mappingCoral reef habitat mapping← WorldView-2 image at Feb, 3rd, 2010

Habitat mapping & Change monitoringHabitat mapping & Change monitoringDec. 5, 2000 IKONOS Sep. 16, 2008 Kompsat-2
Class Names Color Pixels Area (m2) % Pixels Area (m2) %
f1 seagrass (1) 78557 78557 15.26
2 seagrass (2) 24794 24794 4.82
3 Sand 85416 85416 16.60
4sand + short
grass86134 86134 16.74
1 5969 95504 15.05
2 5019 80304 12.65
3 5799 92784 14.62
4 5375 86000 13.55
5 2054 32864 5 18
- area of seagrass
: increased 8%
T t l f l fg
5 sand + long grass 16286 16286 3.16
6 coral (1) 51790 51790 10.06
7 coral (2) 70603 70603 13.72
8 coral (3) 94248 94248 18.31
9 k 3261 3261 0 63
5 2054 32864 5.18
6 2366 37856 5.96
7 5560 88960 14.02
8 6282 100512 15.84
9 166 2656 0.42
- Total area of coral reef
habitat : decreased 6.28%
from 42 09 % to 35 82%9 rock 3261 3261 0.63
10 deep sea 3570 3570 0.69
Total 514659 514659 100
10 1079 17264 2.72
39669 634704 100
from 42.09 % to 35.82%

ContentsContents
Seagrass mapping in the Korean coastal water
Tidal flat application
Coral reef habitat mapping
Geostationary Ocean Color Imager (GOCI)

Technical Specification of GOCITechnical Specification of GOCI
P6
Target AreaGOCIGSD(Ground Sampling Distance) : 500m * 500m Slot 16
Slot 9 Slot 12
Slot 13
P5P7
- GSD(Ground Sampling Distance) : 500m * 500m- Target Area : 2,500km * 2,500km (Center : 130°E 36°N)- Included Nations : Korea, China, Japan, Russia, etc.
Slot 1 Slot 4
Slot 5Slot 8
P8Spectral Bands Characteristic and Requirements of GOCI
, , p , ,- Temporal Resolution : 1hour (8 times at 1 day)
Band Central wavelengths
Band Width
SNR Type Primary Application
B1 412 nm 20 nm 1,000 Visible Yellow substance and turbidity
Spectral Bands Characteristic and Requirements of GOCI
, yB2 443 nm 20 nm 1,090 Visible Chlorophyll absorption maximumB3 490 nm 20 nm 1,170 Visible Chlorophyll and other pigmentsB4 555 nm 20 nm 1,070 Visible Turbidity, suspended sedimentB5 660 nm 20 nm 1 010 Visible Baseline of fluorescence signal Chlorophyll suspendedB5 660 nm 20 nm 1,010 Visible Baseline of fluorescence signal, Chlorophyll, suspended
sedimentB6 680 nm 10 nm 870 Visible Atmospheric correction and fluorescence signalB7 745 nm 20 nm 860 NIR Atmospheric correction and baseline of fluorescence signalB8 865 nm 40 nm 750 NIR Aerosol optical thickness, vegetation, water vapor reference
over the ocean
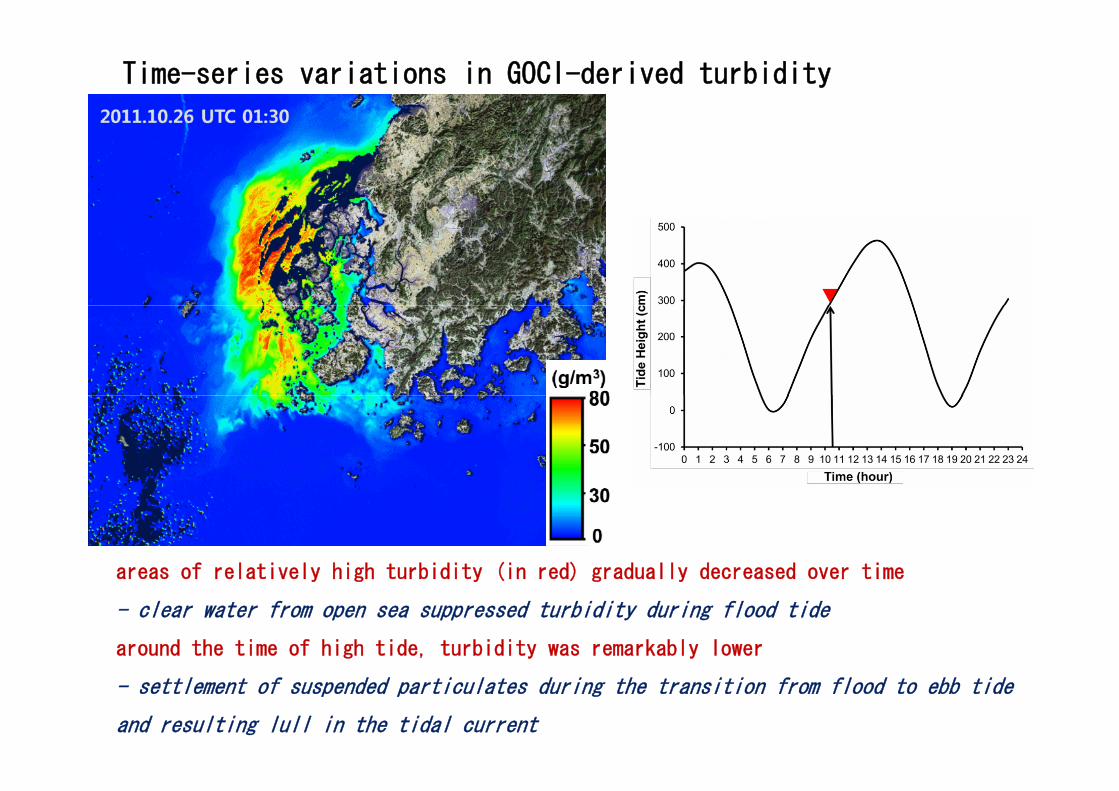
Time-series variations in GOCI-derived turbidity
areas of relatively high turbidity (in red) gradually decreased over timeareas of relatively high turbidity (in red) gradually decreased over time
- clear water from open sea suppressed turbidity during flood tide
around the time of high tide, turbidity was remarkably lower
- settlement of suspended particulates during the transition from flood to ebb tide
and resulting lull in the tidal current

GOCI-based CHL-a 1-h interval image (2012 4 17)(2012.4.17)

GOCI-based TSM daily composite (2011.9.1-(2011.9.12013.12.31)

SummarySummary
Seagrass beds was spectrally distinct from unvegetated seawaterSeagrass beds was spectrally distinct from unvegetated seawater
and aquaculture in the high spatial resolution satellite images
Remotely sensed images can be applied to the mapping of
seagrass distribution with relatively high accuracy (73%)g y g y ( )
Annual variability in spatial change of seagrass distribution was
b d b t 1995 d 2012observed between 1995 and 2012
Remote sensing technique is effective for long-term monitoring of
seagrass beds distribution combined with in situ observationseagrass beds distribution combined with in-situ observation

Thank youThank you
http://www.divephotoguide.com/user/stevedeneef/gallery/gallery/photo/12361/
j @