Embed Size (px)
Citation preview

Adoption of Sustainable Agricultural Intensification Technologies in Ethiopia: Drivers and Synergies
Ali M. Oumer
UWA School of Agriculture and Environment
UWA Institute of AgriculturePostgraduate Showcase

SupervisorsAssociate Professor Michael Burton Associate Professor Atakelty HailuSenior Lecturer Amin MugeraProfessor Salvatore Di FalcoDr Menale Kassie
Data accessEIAR - Ethiopian Institute of Agricultural ResearchCIMMYT - International Maize and Wheat Improvement CentreNMA- National Meteorological Agency of Ethiopia
Acknowledgments
FundingAustralian Government through ACIAR - Australian Centre for International Agricultural Research
Project facilitationDr Chilot YirgaDebra Basanovic

Farming: >95% smallholders
Average farm size: <1 hectare
Fertilizer: low (34 kg/ha)
Land degradation, soil fertility depletiono Mono-cropping, removal of farm resources, top soil erosiono Extractive practices: soil nutrients mining
Mainly rain-fed; prone to weather variabilityo 1% of total maize area irrigated
Research context: Maize in Ethiopia

Wide yield gaps
Ethiopian maize yield (tons/ha)
Global yield gap Atlas (www.yieldgap.org)
0
2
4
6
8
10
12
14
16
On-station trials On-farm trials National average
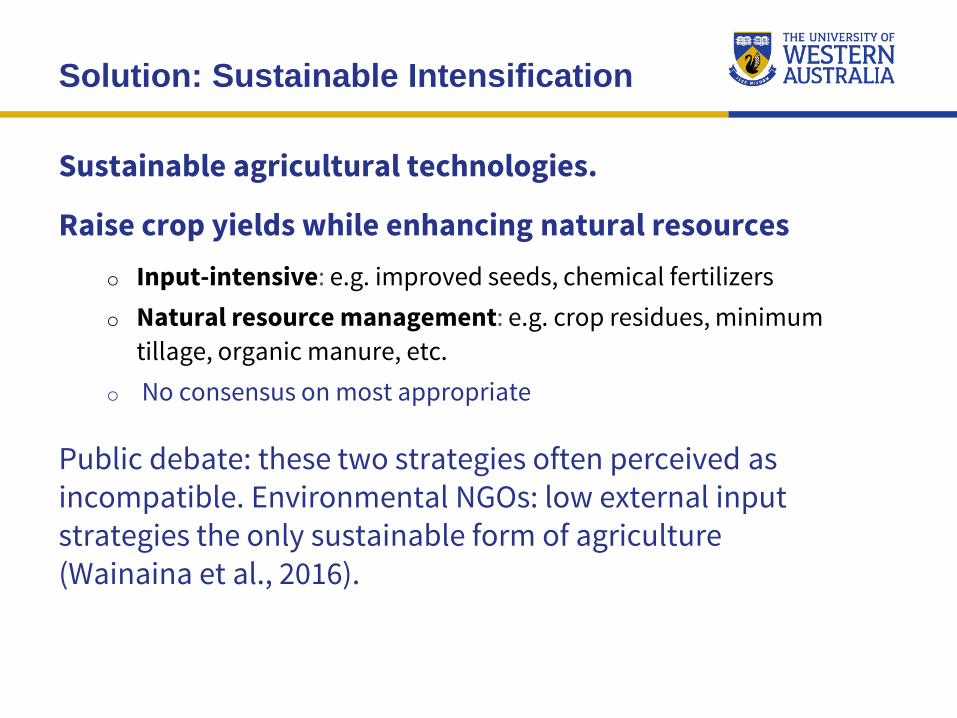
Raise crop yields while enhancing natural resourceso Input-intensive: e.g. improved seeds, chemical fertilizerso Natural resource management: e.g. crop residues, minimum
tillage, organic manure, etc.o No consensus on most appropriate
Public debate: these two strategies often perceived as incompatible. Environmental NGOs: low external input strategies the only sustainable form of agriculture (Wainaina et al., 2016).
Solution: Sustainable Intensification
Sustainable agricultural technologies.

Research question:
What determines the adoption of sustainable agricultural technologies?
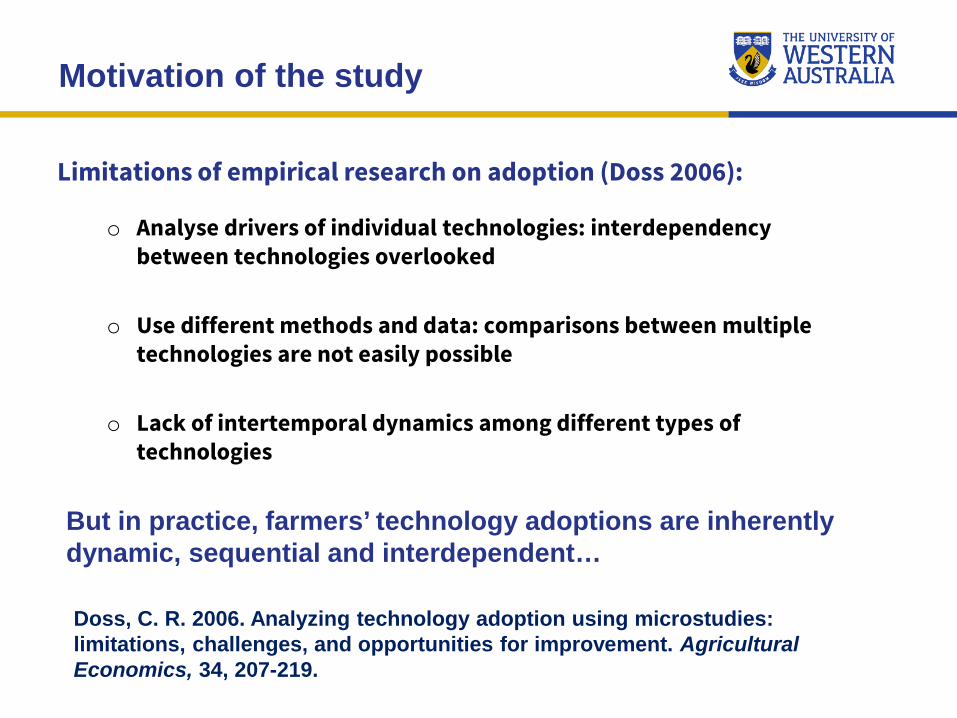
o Analyse drivers of individual technologies: interdependency between technologies overlooked
o Use different methods and data: comparisons between multiple technologies are not easily possible
o Lack of intertemporal dynamics among different types of technologies
But in practice, farmers’ technology adoptions are inherently dynamic, sequential and interdependent…
Motivation of the study
Limitations of empirical research on adoption (Doss 2006):
Doss, C. R. 2006. Analyzing technology adoption using microstudies: limitations, challenges, and opportunities for improvement. Agricultural Economics, 34, 207-219.

The study area and data
Sample villages from maize growing districts of Ethiopia
Multi-stage random sampling procedure
Sample size: Panel of 2031 households in 2009/2010 and 2012/2013
Household level data matched with village level climate data

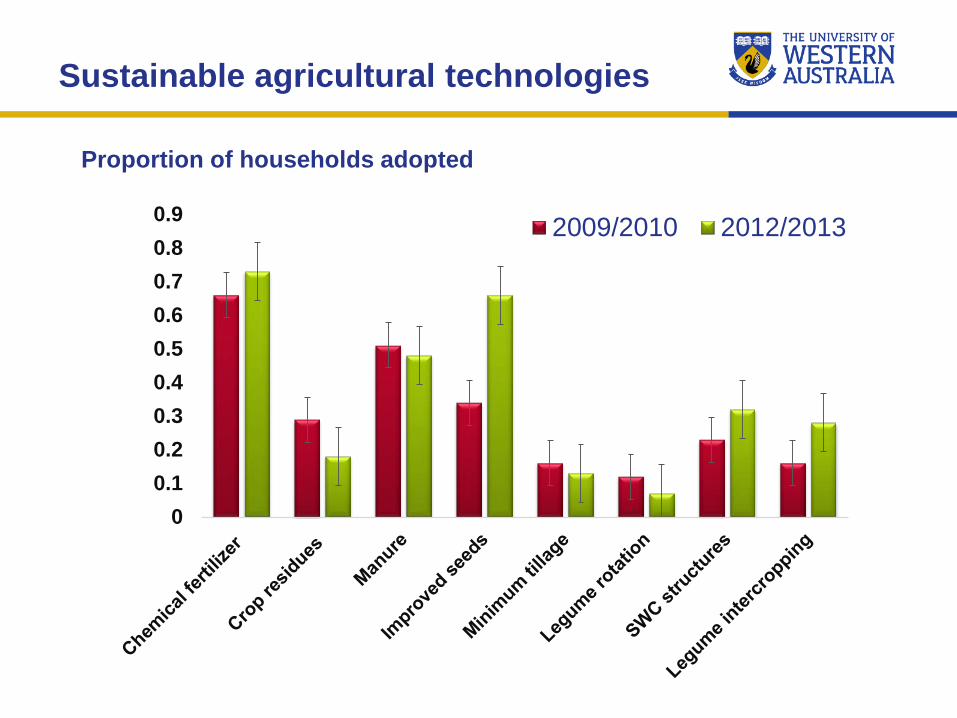
Sustainable agricultural technologies
Proportion of households adopted
00.10.20.30.40.50.60.70.80.9 2009/2010 2012/2013

Dynamic multivariate probit
The empirical model
* ' ,itm itm m itmy x β ε= +
1 * 0,
0 itm
itm
if yy
otherwise>
=
Where:
i = household, t = time period=1,2
m = sustainable agricultural technology=1,2….8 in each period with a total of 16 binary choices
y* is a latent variable that captures the expected benefit from adopting a technology in each period
X is a vector of covariates (drivers)
is unobserved error term capturing unobserved effect of interrelationships
is unknown parameter
Observable unobservable
𝜺𝜺
𝛃𝛃

Significant drivers in period one
Main drivers Sustainable agricultural technologies
CF IS M SWC CR MT LR LIClimate factorsHist. Rainfall abundance + - + + + + +Hist. temperature + - +Hist. rainfall variability - + + + - +Lag rainfall variability - + + + - -Hist. temperature variability - + + -
CF=Chemical fertilizer IS=Improved seed
M=ManureSWC=Soil-water conservation
CR=Crop residueMT=Minimum tillage
LR=Legume rotation LI=Legume intercrop

Significant drivers in period one cont.…
Main drivers Sustainable agricultural technologiesCF IS M SWC CR MT LR LI
Farm characteristicsAge of farm manager - - - + -Farm size + + + + + +Infertile soils + + - -Steep fields + + + -Farm distance + - + + +Altitude + + - -
CF=Chemical fertilizer IS=Improved seed
M=ManureSWC=Soil-water conservation
CR=Crop residueMT=Minimum tillage
LR=Legume rotation LI=Legume intercrop

Significant drivers in period one cont.…
Main drivers Sustainable agricultural technologiesCF IS M SWC CR MT LR LI
Household characteristicsOff-farm income - - - - +Lack of oxen - - + +Credit use + +Institutions + + + - - +Tenure security + +Family education + + -Education of head +Family labour + - -
CF=Chemical fertilizer IS=Improved seed
M=ManureSWC=Soil-water conservation
CR=Crop residueMT=Minimum tillage
LR=Legume rotation LI=Legume intercrop

Significant drivers in period one cont.…
Main drivers Sustainable agricultural technologies
CF IS M SWC CR MT LR LIEconomic factors
Fertilizer price - - - +Seed price + + - - -
Labour price - - + + +
CF=Chemical fertilizer IS=Improved seed
M=ManureSWC=Soil-water conservation
CR=Crop residueMT=Minimum tillage
LR=Legume rotation LI=Legume intercrop

Temporal dynamics of adoption
Sustainable agricultural technologies Intertemporalcorrelation
Chemical fertilizer 0.52***Improved variety seed 0.22***Manure 0.18***Soil and water conservation structures 0.19***Crop residue retention 0.13***Minimum tillage 0.47***Legume rotation 0.21***Legumes intercropping 0.27***
We observe persistence in the adoption of technologies: Positive spill-over effect of time in adoption behaviour.

Significant correlations in period two
CF IS M SWC CR MT LR LICF 1
IS 0.67 1
M -0.09 1
SWC 0.28 0.14 1
CR -0.11 -0.09 0.08 1
MT -0.28 -0.33 -0.09 1
LR 1
LI 0.16 0.17 0.16 1
CF=Chemical fertilizer IS=Improved seed
M=ManureSWC=Soil-water conservation
CR=Crop residueMT=Minimum tillage
LR=Legume rotation LI=Legume intercrop

Summary
1. Significant dynamic interrelationships between different types of sustainable agricultural technologies.
2. Input-intensive and NRM technologies are compatible, contrary to the literature.
3. Drivers of adoption differ between technologies; reflect observed dynamic interdependencies [synergistic patterns]
4. Positive spill-over effect of time on adoption: enhance widespread use of the technologies if farmers get persistent and appropriate incentives.
Policy implications
Policies could promote a combination (packages) of input-intensive and NRM technologies that could lead to beneficial synergies.
The individual technology promotion approach may not work in every context as African agroecosystems are diverse and complex.
Understanding the drivers and synergies of dynamic adoption would be the best way forward.

Further research
If farmers realize the benefits of NRM technologies, why are then low adoption rates?
Could farmers get benefits for their ecosystem services beyond the farm?
What roles could sustainable agricultural technologies play in offsetting production risks and food insecurity?


Backup slides, error correlation matrix and adoption drivers with significance values

Significant correlations in period one
CF CR M IS MT LR SWC LICF 1
CR -0.10 1
M -0.12 1
IS 0.45 -0.19 -0.13 1
MT -0.41 -0.33 1
LR 0.22 0.17 1
SWC 0.12 0.10 1
LI 0.11 -0.34 0.22 0.12 1
CF=Chemical fertilizer CR=Crop residues
M=ManureIS=Improved seed
MT=Minimum tillage LR=Legume rotation
SWC=Soil-water controlLI=Legume intercrop

Results…interrelationships-period one
CF CR M IS MT LR SWC LICF 1
CR -0.10** 1
M -0.12*** 1
IS 0.45*** -0.19*** -0.13*** 1
MT -0.41*** -0.33*** 1
LR 0.22*** 0.17*** 1
SWC 0.12*** 0.10** 1
LI 0.11** -0.34*** 0.22*** 0.12** 1
CF=Chemical fertilizer CR=Crop residues
M=ManureIS=Improved seed
MT=Minimum tillage LR=Legume rotation
SWC=Soil-water conserveLI=Legume intercrop
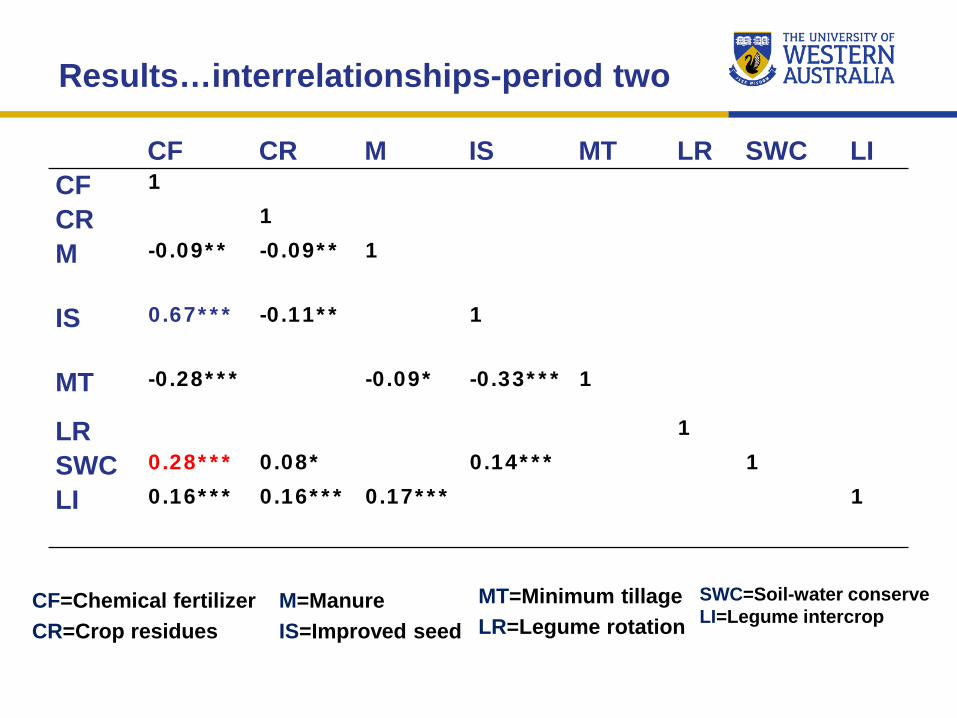
Results…interrelationships-period two
CF CR M IS MT LR SWC LICF 1
CR 1
M -0.09** -0.09** 1
IS 0.67*** -0.11** 1
MT -0.28*** -0.09* -0.33*** 1
LR 1
SWC 0.28*** 0.08* 0.14*** 1
LI 0.16*** 0.16*** 0.17*** 1
CF=Chemical fertilizer CR=Crop residues
M=ManureIS=Improved seed
MT=Minimum tillage LR=Legume rotation
SWC=Soil-water conserveLI=Legume intercrop

MT=Minimum tillage LR=Legume rotation
Results…temporal dynamics
2009/2010 [Period one]CF CR M IS MT LR SWC LI
2012
/201
3 [P
erio
d tw
o]
CF 0.52*** 0.13*** -0.14*** 0.08* 0.19***
CR -0.17*** 0.13*** -0.10** 0.09*
M -0.08** 0.18*** -0.16*** 0.07*
IS 0.34*** -0.12*** 0.22*** -0.22*** 0.19***
MT -0.19*** -0.15** 0.47*** 0.14**
LR 0.16** 0.13** 0.21***
SWC 0.15*** 0.09** 0.19*** 0.09*
LI 0.16*** -0.18*** 0.11** 0.17*** 0.27***
SWC=Soil-water conserveLI=Legume intercrop
M=ManureIS=Improved seed
CF=Chemical fertilizer CR=Crop residues

Results…key drivers-period one
Main drivers Sustainable agricultural intensification technologiesCF CR M IS MT LR SWC LI
Climate factorsH. rainfall 0.04*** 0.05*** 0.04*** -0.05*** 0.08*** -0.1*** 0.06***H. temperature 0.06*** 0.06*** -0.04**H. rainfall variability
6.3*** -3.5* 6.2** -6.0** 9.0*** 6.7**
Lagged rainfall variability
-1.6*** -1.3*** 0.8*** 0.8*** 1.0*** -3.4***
H. temperature variability
-6.4*** 3.3* 11.0*** -7.3***
Farm characteristicsFarm size 0.16*** 0.09** 0.10** 0.14*** 0.08* 0.09*Soil fertility 0.21*** -0.15** -0.13** 0.28***Slope of field 0.19*** 0.21*** -0.3*** 0.36***
Farm distance 0.07** 0.07** -0.2*** 0.08** 0.07**Altitude 0.10*** 0.05*** -0.18*** -0.03*

Results…key drivers-period one cont.…
Main drivers Sustainable agricultural intensification technologiesCF CR M IS MT LR SWC LI
Household characteristicsOff-farm income -0.35*** -0.32*** -0.24** 0.46*** -0.31**Lack of oxen -0.24** -0.27*** 0.50*** 0.27**Credit use 0.19** 0.20**
Institutions 0.09*** -0.11*** 0.06*** -0.06** 0.05* 0.11***
Tenure security 0.31*** 0.27**
Family education 0.05** -0.05** 0.12***Education level of head
0.04***
Economic factorsFertilizer price -0.07** 0.10*** -0.15*** -0.08**
Seed price 0.09*** 0.08*** -0.05*** -0.04*** -0.05***Labour price -0.04*** 0.04*** -0.03*** 0.021** 0.04***
Sustainable agricultural technologies
00.10.20.30.40.50.60.70.80.9 2009/2010 2012/2013
Proportion of households adopted