Embed Size (px)
Citation preview
Quadstream
Algorithms for Multi-scalePolygon Generalization
Curran KelleherDecember 5, 2012
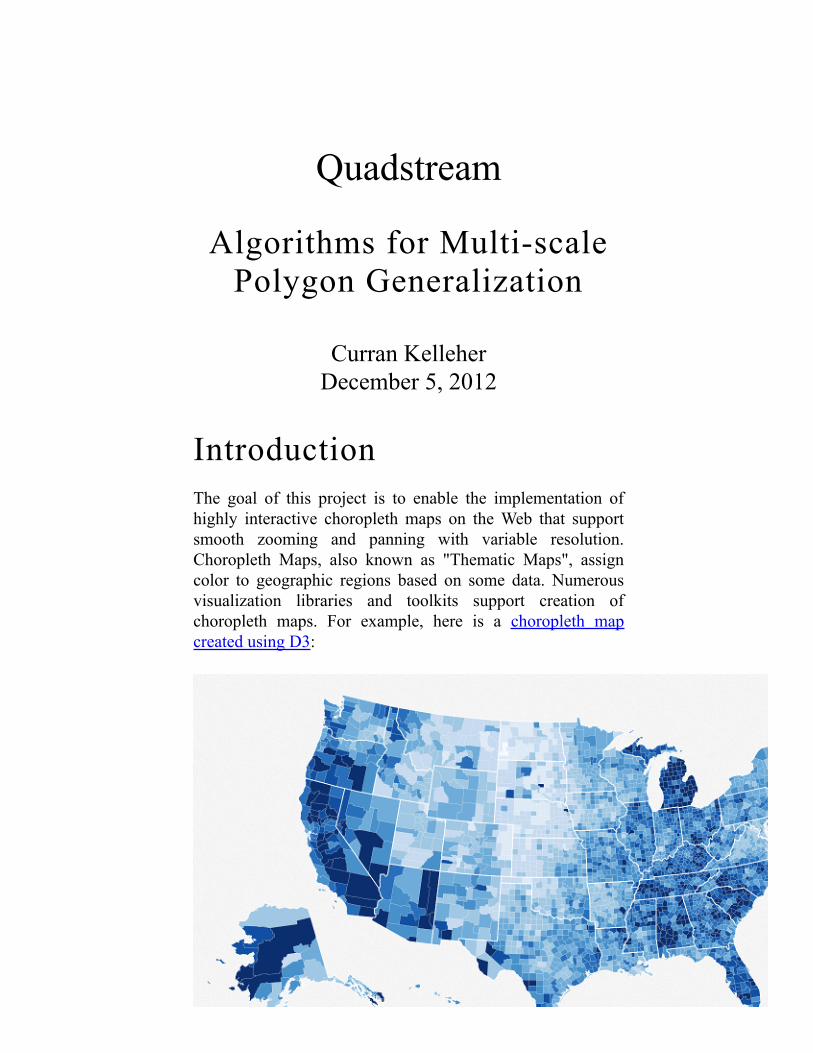
IntroductionThe goal of this project is to enable the implementation ofhighly interactive choropleth maps on the Web that supportsmooth zooming and panning with variable resolution.Choropleth Maps, also known as "Thematic Maps", assigncolor to geographic regions based on some data. Numerousvisualization libraries and toolkits support creation ofchoropleth maps. For example, here is a choropleth mapcreated using D3:
The target data to be visualized includes public data sets thathave
many various measures that could be visualized usingcolortemporal variance (e.g. yearly data), andhierarchical structure (e.g. Continents, Countries,States).
The desired choropleth map therefore must have thefollowing properties:
instant response when the user changes eitherthe measure to visualizethe color map usedthe time slice viewed
support for zooming and panning to explore thehierarchy
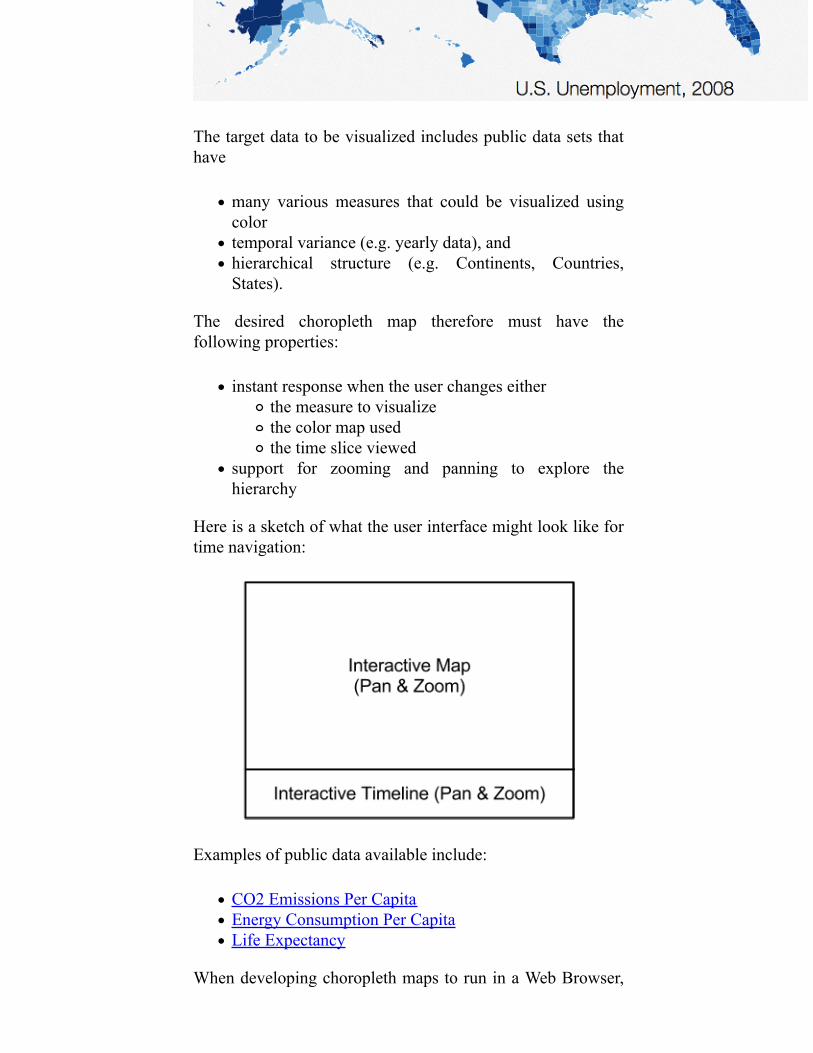
Here is a sketch of what the user interface might look like fortime navigation:
Examples of public data available include:
CO2 Emissions Per CapitaEnergy Consumption Per CapitaLife Expectancy
When developing choropleth maps to run in a Web Browser,
one must consider bandwidth limitations. To keep downloadsizes small, existing solutions typically either use a fixedpolygon generalization, or image tiles rendered on the serverside. Fixed generalization leads to rough looking polygonboundaries when zooming in. Use of server-side image tilesdemands a round trip to the server for re-rendering. Ourdesired choropleth map tool cannot use fixed generalization,as we require high quality polygon boundaries at any zoomlevel. The image tile approach cannot be used userinteractions that cause re-rendering must be instant, and notrequire a round trip to the server.
The contribution of this project is a set of algorithms and datastructures for building client-side rendered choropleth mapswith multi-scale polygon generalization. This approachfulfills all the requirements for our choropleth mapapplication, and can be re-used by researchers and softwaredevelopers looking for a solution for creating a highlyperformant interactive Web-based choropleth map withsmooth zooming and panning and support for hierarchicalpolygons.
Related WorkIn this section prior work is surveyed in the areas ofmulti-scale structures, line and polygon generalizationalgorithms, and web-based choropleth map visualizationtools.
Multi-Scale Structures
Multi-scale data structures and algorithms have been devisedto cope with data at multiple scales (i.e. varying "zoom level"or "level of detail"). These approaches often involve recursivepartitioning of a space into a data structure that can beefficiently queried. Multi-scale structures related to this workinclude the Quadtree, R-Tree, Reactive Tree, and BLG Tree.
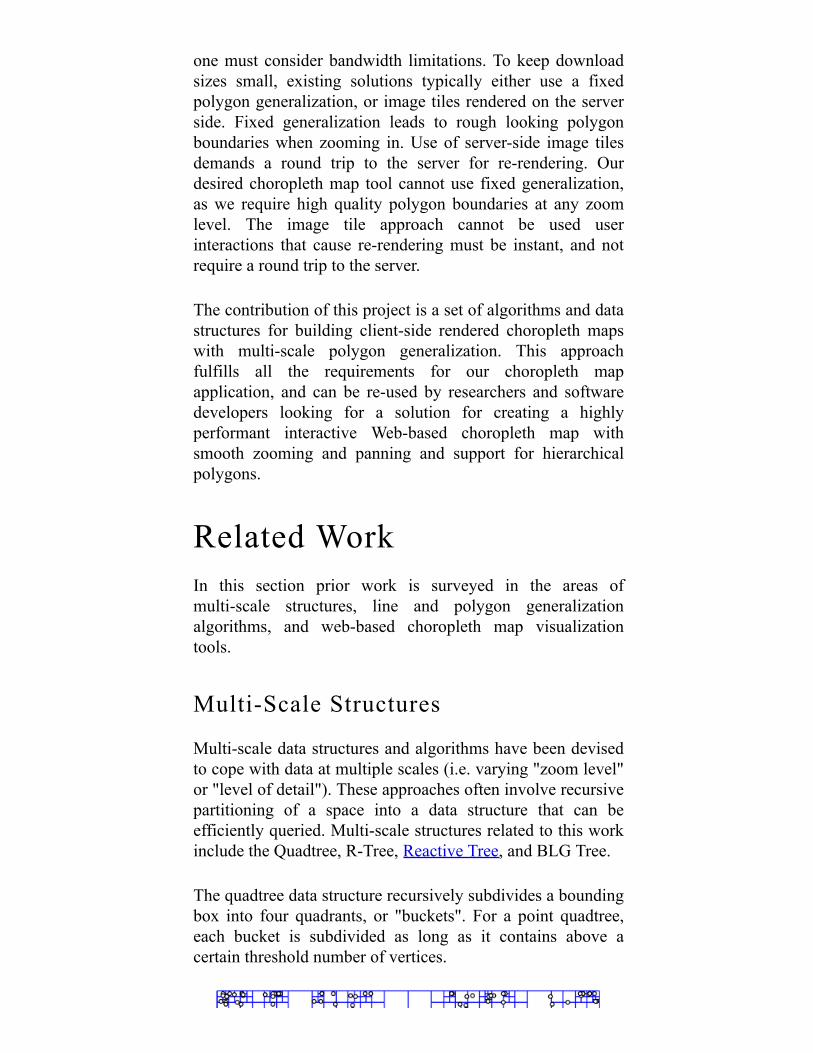
The quadtree data structure recursively subdivides a boundingbox into four quadrants, or "buckets". For a point quadtree,each bucket is subdivided as long as it contains above acertain threshold number of vertices.
An example point quadtree, from Wikipedia.
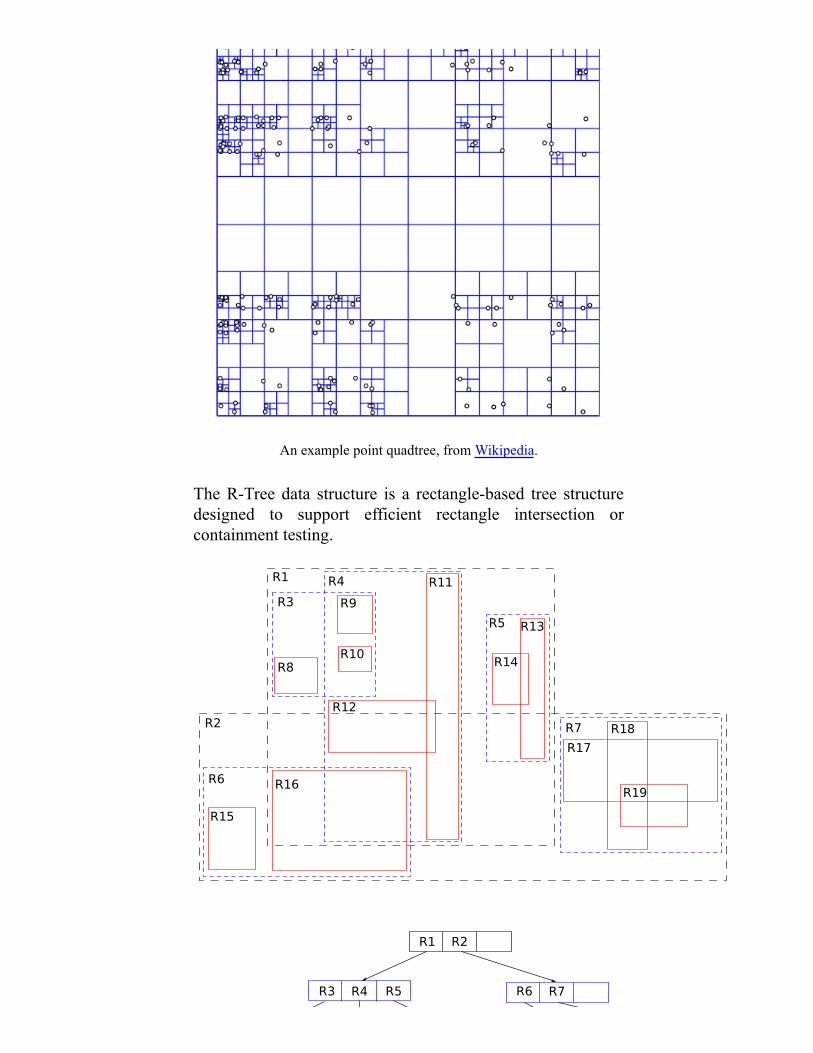
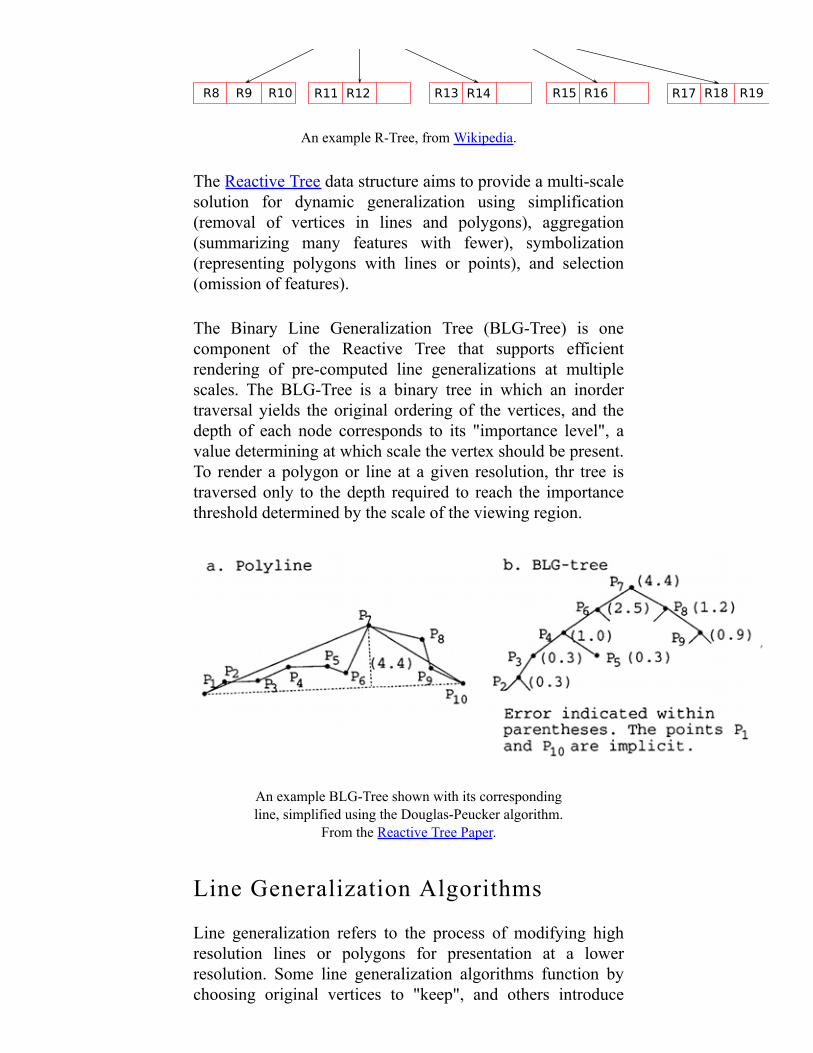
The R-Tree data structure is a rectangle-based tree structuredesigned to support efficient rectangle intersection orcontainment testing.
R1
R3
R4
R9
R11
R13
R10
R12
R16
R15
R14R8
R2
R6
R7
R17
R18
R19
R5
R1 R2
R3 R4 R5 R6 R7
R8 R9 R10 R11 R12 R13 R14 R15 R16 R17 R18 R19
An example R-Tree, from Wikipedia.
The Reactive Tree data structure aims to provide a multi-scalesolution for dynamic generalization using simplification(removal of vertices in lines and polygons), aggregation(summarizing many features with fewer), symbolization(representing polygons with lines or points), and selection(omission of features).
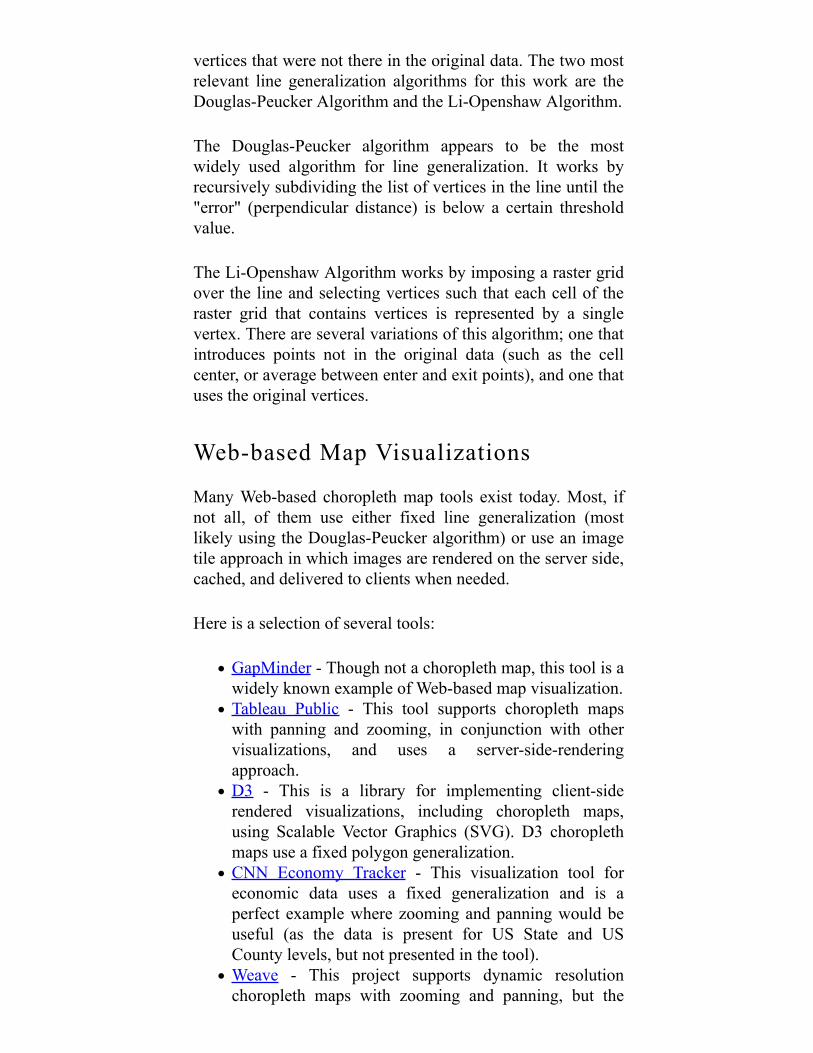
The Binary Line Generalization Tree (BLG-Tree) is onecomponent of the Reactive Tree that supports efficientrendering of pre-computed line generalizations at multiplescales. The BLG-Tree is a binary tree in which an inordertraversal yields the original ordering of the vertices, and thedepth of each node corresponds to its "importance level", avalue determining at which scale the vertex should be present.To render a polygon or line at a given resolution, thr tree istraversed only to the depth required to reach the importancethreshold determined by the scale of the viewing region.
An example BLG-Tree shown with its correspondingline, simplified using the Douglas-Peucker algorithm.
From the Reactive Tree Paper.
Line Generalization Algorithms
Line generalization refers to the process of modifying highresolution lines or polygons for presentation at a lowerresolution. Some line generalization algorithms function bychoosing original vertices to "keep", and others introduce
vertices that were not there in the original data. The two mostrelevant line generalization algorithms for this work are theDouglas-Peucker Algorithm and the Li-Openshaw Algorithm.
The Douglas-Peucker algorithm appears to be the mostwidely used algorithm for line generalization. It works byrecursively subdividing the list of vertices in the line until the"error" (perpendicular distance) is below a certain thresholdvalue.
The Li-Openshaw Algorithm works by imposing a raster gridover the line and selecting vertices such that each cell of theraster grid that contains vertices is represented by a singlevertex. There are several variations of this algorithm; one thatintroduces points not in the original data (such as the cellcenter, or average between enter and exit points), and one thatuses the original vertices.
Web-based Map Visualizations
Many Web-based choropleth map tools exist today. Most, ifnot all, of them use either fixed line generalization (mostlikely using the Douglas-Peucker algorithm) or use an imagetile approach in which images are rendered on the server side,cached, and delivered to clients when needed.
Here is a selection of several tools:
GapMinder - Though not a choropleth map, this tool is awidely known example of Web-based map visualization.Tableau Public - This tool supports choropleth mapswith panning and zooming, in conjunction with othervisualizations, and uses a server-side-renderingapproach.D3 - This is a library for implementing client-siderendered visualizations, including choropleth maps,using Scalable Vector Graphics (SVG). D3 choroplethmaps use a fixed polygon generalization.CNN Economy Tracker - This visualization tool foreconomic data uses a fixed generalization and is aperfect example where zooming and panning would beuseful (as the data is present for US State and USCounty levels, but not presented in the tool).Weave - This project supports dynamic resolutionchoropleth maps with zooming and panning, but the
algorithms involved have not been published.
QuadstreamOur solution, which we call "Quadstream", involves thecombination of the Quadtree recursive subdivision patternwith the Li-Openshaw line generalization algorithm. Theresult can be partitioned into small files. The client canconsume these files as they are neede to fill in detail ondemand, as the user zooms and pans.
The Quadstream algorithm works in two phases; thepublishing phase and the consumption phase.
Publishing Phase
The publishing phase is the process by which original inputfiles (e.g. ESRI Shapefiles or GeoJSON files) are transformedinto a set of files that can be published to the Web andconsumed by Quadstream clients. This is a one-time processfor each shape set to be published.
The algorithms for the publishing phase do the following:
Preprocess vertices - input polygons are assigned integeridentifiers, and for each polygon, vertices are assignedinteger identifiers that define their winding order forrendering. Vertices that fall on the same (x, y)coordinates are aggregated. The resulting data structureis a collection of vertex objects with the followingproperties:
(x,y) coordinatesmemberships, a list of objects with
polygonIdvertexId
1.
Build the quadtree - each vertex is assigned to a node inthe quadtree using a multi-scale variant of theLi-Openshaw algorithm. After this phase, a quadtree isavailable in which each occupied node contains a singlevertex. This quadtree can be traversed to a limited depthto compute the Li-Openshaw generalization for aspecified scale. The vertices in this quadtree can beinserted into a BLG-Tree in which their importance
2.
value corresponds to their level in the Quadtree.Partition into files - to partition the vertices into files, atransformation of the quadtree is computed in which thevertices are moved several levels up in the tree (andvertices at the root stay at the root). Let us call thenumber of levels vertices are moved up fileDepth.The effect of this transformation is that all the verticespresent in the subtreefileDepth levels down from theroot all end up in the root node, and subnodes containthe leaf nodes of their original subtree downfileDepth levels. Each node in the transformed treeis output as a file containing an array of vertex objects,named according to its (level, i, j) address in the tree.The value of fileDepth can be tweaked to optimizethe size of the files for best performance.
3.
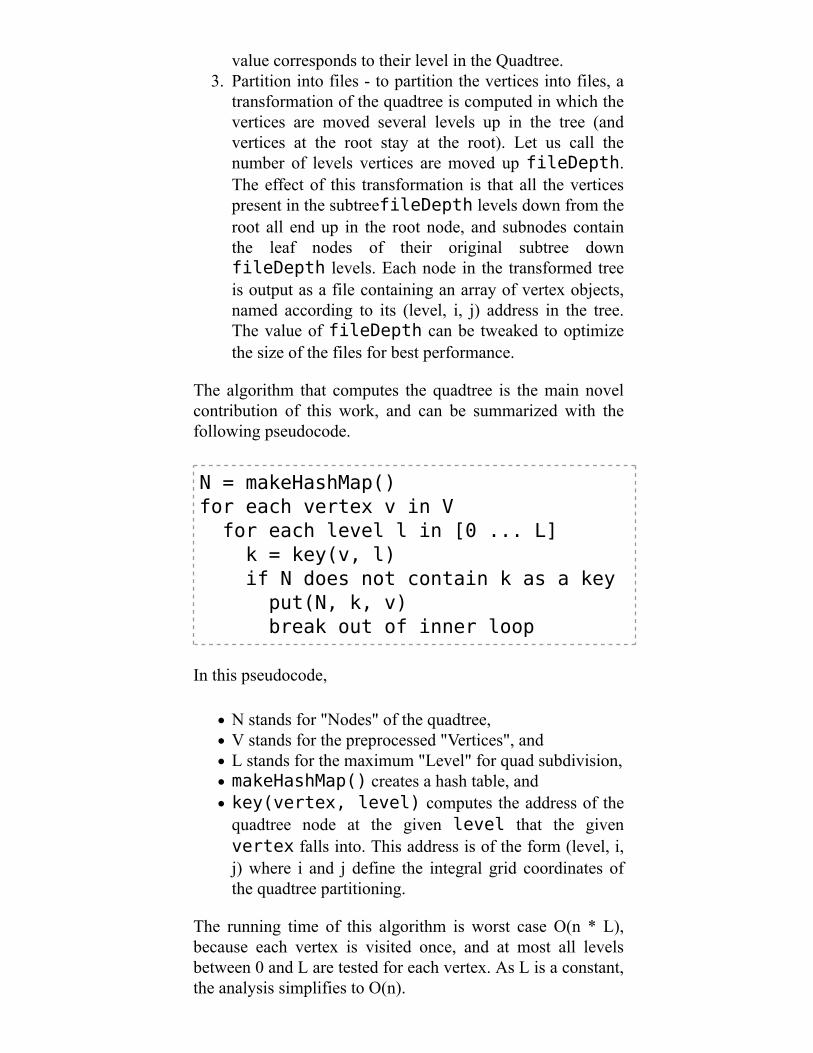
The algorithm that computes the quadtree is the main novelcontribution of this work, and can be summarized with thefollowing pseudocode.
N = makeHashMap()for each vertex v in V for each level l in [0 ... L] k = key(v, l) if N does not contain k as a key put(N, k, v) break out of inner loop
In this pseudocode,
N stands for "Nodes" of the quadtree,V stands for the preprocessed "Vertices", andL stands for the maximum "Level" for quad subdivision,makeHashMap() creates a hash table, andkey(vertex, level) computes the address of thequadtree node at the given level that the givenvertex falls into. This address is of the form (level, i,j) where i and j define the integral grid coordinates ofthe quadtree partitioning.
The running time of this algorithm is worst case O(n * L),because each vertex is visited once, and at most all levelsbetween 0 and L are tested for each vertex. As L is a constant,the analysis simplifies to O(n).
Consumption Phase
The consumption phase is the phase of the Quadstreamsystem that executes when a Browser-residend Quadstreamclient reads the files created in the publishing phase from theserver and presents an interactive map with zooming andpanning to the end user.
In the client, an R-Tree is initialized that will contain thebounding rectangles of the polygons. Each polygon isrepresented in the client using a BLG-Tree. Initially, the rootfile is downloaded, which contains a coarse generalization ofall polygons (and their bounding boxes, so the R-Tree can beinitialized). As the user zooms and pans, the files containingthe vertices that should be rendered for the changing viewrectangle are downloaded and inserted into theircorresponding BLG trees.
Our goal is to achieve a rendering cycle that can execute at 60Frames per second to support smoothly animated zoomingand panning. Each rendering cycle, the following steps occur:
The R-Tree is queried to find the list of polygons thatare
partially or totally inside the viewing rectangle,andlarge enough to see.
For each polygon in the resulting list, its correspondingBLG Tree is traversed to a limited depth to find thevertices that define the polygon at the appropriate scaledefined by the viewing rectangle.Each list of vertices is intersected with the viewingrectangle to eliminate vertices outside the viewingrectangle.Some data value is looked up for each polygon, andeach polygon is rendered to the display using HTML5Canvas.
Issues
The above sections articulate the ideal implementation,however the actual implementation fails to address thefollowing:
Partitioning across multiple files (the partitioning iscomputed, but in memory)Use of an R-Tree to index polygons, andView rectangle intersection computation.
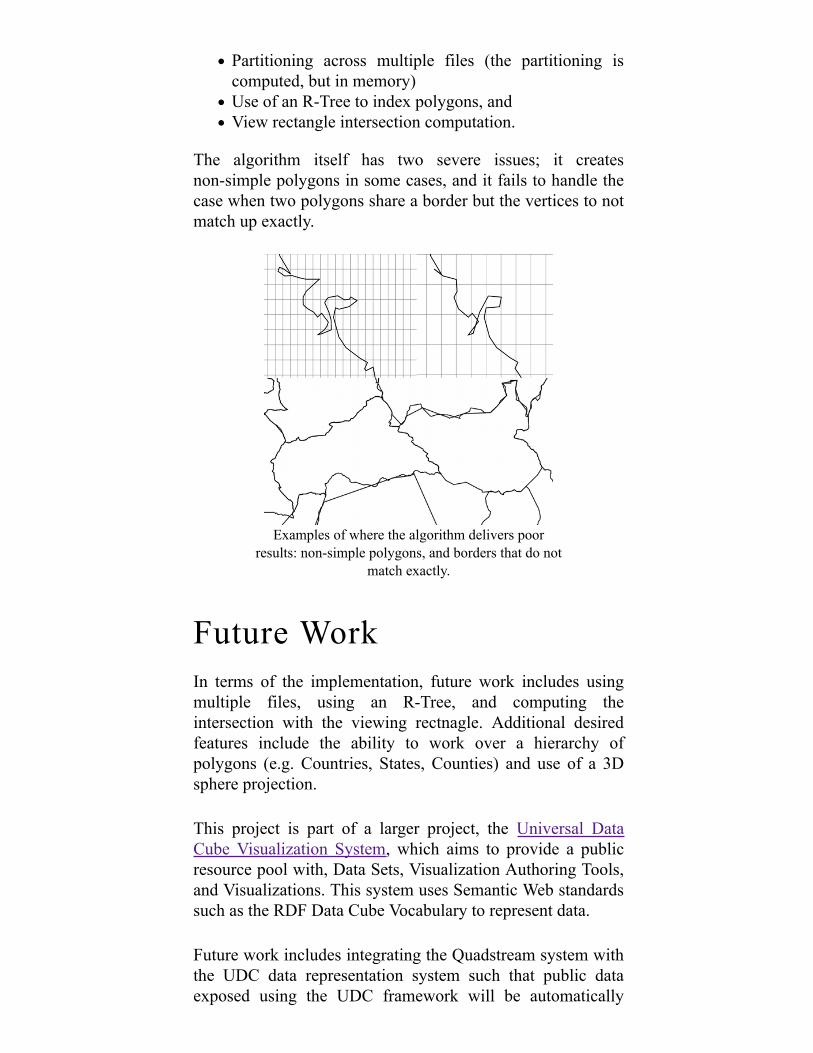
The algorithm itself has two severe issues; it createsnon-simple polygons in some cases, and it fails to handle thecase when two polygons share a border but the vertices to notmatch up exactly.
Examples of where the algorithm delivers poorresults: non-simple polygons, and borders that do not
match exactly.
Future WorkIn terms of the implementation, future work includes usingmultiple files, using an R-Tree, and computing theintersection with the viewing rectnagle. Additional desiredfeatures include the ability to work over a hierarchy ofpolygons (e.g. Countries, States, Counties) and use of a 3Dsphere projection.
This project is part of a larger project, the Universal DataCube Visualization System, which aims to provide a publicresource pool with, Data Sets, Visualization Authoring Tools,and Visualizations. This system uses Semantic Web standardssuch as the RDF Data Cube Vocabulary to represent data.
Future work includes integrating the Quadstream system withthe UDC data representation system such that public dataexposed using the UDC framework will be automatically
made browsable using Quadstream-based choropleth maps.This involves the assignment of RDF URIs to Quadstreampolygons as identifiers, and matching of identifers occuring inthe UDC data with identifiers used for polygons.
Ideally a distributed Web-based ecosystem of developers andusers can evolve in which users and developers publish theirsimplified polygons to the Web, and others can access them.Eventually, a system can evolve that contains all boundariesof Continents, Countries, States, Counties (and internationalequivalent), Cities, and Towns.
This hierarchy can serve as a backbone for assembling acollection of all useful public data, including statistics forhealth, economics, education, pollution, industry, and manymore. The resulting tool would function as a telescope intothe world through the lens of data and interactive graphics,and could be used by anyone with an Internet connection. It isour hope that this tool stands to revolutionize education,journalism, and public policy processes.
Links:
Journal of ProgressMid-project Presentation 1Mid-project Presentation 2Final PresentationPseudocodeCircle Generalization Demo with Addresses (source)Quadtree Subdivision Demo (source)Pan Zoom Demo with Test Data (source)World Map Demo (source, documentation)3D Earth Demo (source)Natural Earth
Raster DataCountry Polygons
Originally an ESRI ShapefileConverted to GeoJSON with GDAL
Resulting file ~25MB.
References
Li, Z. "Algorithmic Foundataion of Multi-Scale SpatialRepresentation". CRC Press. 2007.
Samet, S. "Foundations of Multidimensional and MetricData Structures". Morgan Kaufmann Publishers. 2006.Samet, S. "Applications of Spatial Data Structures".Addison Wessley Publishing. 1990.Wikipedia: R-Tree Quadtree KD-Tree Douglas-PeukerAlgorithmLarger project: the UDCViS