Embed Size (px)
Citation preview

1
Alberta’s Energy Markets:
Opportunities and Challenges
Paul Tsounis Alberta Department of Energy
Economics and Markets Branch June 2012

Key Issues of the Day • Uncertainties in Europe
– Greek elections
– GDP expected to shrink 0.4% in 2012
• Economic uncertainties in the US
– GDP in Q1 revised from 2.2% to 1.9%
– Jobless rate up in May
• Iran
– Under pressure to stop nuclear program (civilian or nuclear?)
– Co-operating with inspectors?
• Slowing growth in Asian Pacific?
– China’s Purchasing Managers Index was weak in May.
– GDP at 7.9% in Q1 – slowest quarter in 13 years
• Increased crude oil supplies
– IEA: global production up 200,000 bpd (91.1 million) in May

World Oil Supply Scenario - IEA
Oil sands
(Unconventional oil)
13a
The world will
continue to need oil
for decades to come
Supply depends on:
Fields to be found
Fields to be developed

4 How is Alberta Positioned to Meet
the Worlds Energy Demands?
Overview of Alberta’s Crude Oil and Natural Gas Resources
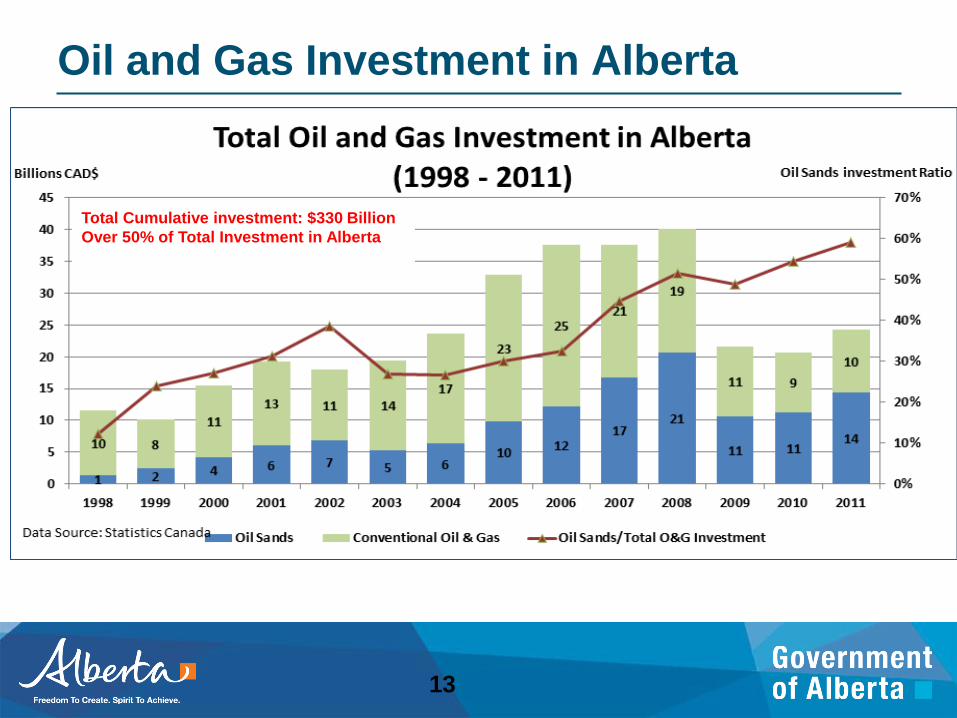
Oil and Gas Investment in Alberta
13
Total Cumulative investment: $330 Billion
Over 50% of Total Investment in Alberta

Source: Canadian Society for Unconventional Gas
Source: Energy Resource Conservation Board, Petrel Robertson, Gas Technology
Institute (GTI)
0
100
200
300
400
500
600
700
800
900
Conventional Gas (GIP) Deep Basin Tight Gas(GIP)
Coal Bed Methane (GIP) Shale Gas (GIP)
Tc
f Remaining
Recoverable
Gas in Place
Produced
Alberta’s Natural Gas Resources
NGC: Natural gas from coal (CBM)
GIP: Gas in Place is the total gas volume believed to be contained in the reservoir. Alberta’s Natural Gas Industry
is Well Placed with Abundant
Resource Opportunities
World Proved Natural Gas
Reserves (Tcf): • Russia: 1,680
• Iran: 1,046
• Qatar: 896
• Saudi Arabia: 276
141 Tcf 82 Tcf
100 Tcf
3
Global Natural Gas
Production (Bcf/d): • United States: 59.1
• Russia: 57
• Canada: 15.5
• Iran: 13.2
Alberta production in 2010:
11.5 (bcf/d)

7
Alberta’s Crude Oil Proved Reserves
State owned or controlled
Accessible Canada’s Oil Sands
World Oil Reserves
Other Accessible Reserves
51%
49%
Accessible
Oil Reserves
Includes 170 billion barrels of oil sands reserves
Source: Oil & Gas Journal. December 2010 * Excluding one-half of the reserves in the Neutral Zone.
Alberta’s Oil Sands represent more than half of the world’s oil resources that are easily accessible

8 Can Alberta Deliver its Energy
Resources to the World?
Overview of Alberta’s Crude Oil and Natural Gas Markets

9
Current Alberta Natural Gas Markets
9
WCSB 14.4 Bcf/d
US Rockies 10 Bcf/d
Barnett & Haynesville
6 Bcf/d
Marcellus 1
Bcf/d
Gulf 15.8 Bcf/d
Bison
Source: Source: WoodMcKenzie 2009 ; ERCB 2010,
Legend Light Blue– WCSB Gas Production Dark Blue – US Gas Production
Market Bcf per Day
PADD 1 0.26
PADD 2 2.87
PADD 3 0.00
PADD 4 0.40
PADD 5 1.26
Eastern Canada 1.76
Western Canada 1.07
Total 7.63
Alberta Disposition – 2010
Alberta production in 2010: 11.5 (bcf/d)
New Shale Gas Production Impeding on Alberta’s Traditional Eastern Markets
LNG Projects (7 Bcf/d): 1. Shell Project 2. BG 3. Kitimat LNG 4. Shell LNG 5. Douglas Island

Global Landed LNG Prices

Current Alberta Crude Oil Markets
Source: CAPP – 2011
Crude oil Market Outlook
Market
Alberta
Exports
(Barrels Per
Day 000’s)
PADD 1 55
PADD 2 1,237
PADD 3 119
PADD 4 237
PADD 5 205
Eastern Canada 393
Western Canada 25
Total 2,271
PADD 3
119
[8,996]
PADD 5
205
[2,731]
PADD 1
55
[1,312]
PADD 2
1,231
[3,736]
PADD 4
237
[613]
Eastern
Canada
276
[393]
Crude Oil Demand from
Western Canada (refinery
capacity in parenthesis)
Barrels per day 000’s
Alberta’s Crude Oil Market Limited to U.S. Mid West – Huge Potential in U.S. Gulf Coast

Hardisty
Current
Trends: North American demand for heavy
crude oil increased over the past
decade due to increased heavy
crude oil refining capacity in the US
and strong global economic growth.
However, since the recession in
2009:
• Pipeline ruptures, refinery
maintenance en route to PADD II
(“A”) disrupted Alberta crude oil
exports into its main market.
• Increasing supplies from Bakken
and heavy crude from Alberta with
limited pipeline capacity to new
markets/tidewater creating a glut of
crude oil in Cushing (main storage
hub) (“B”)
A
B
Bakken
and AB
Heavy
(Enbridge)
Bakken
AB Heavy
(TransCanada
Keystone)

Tight Oil Outlook in the US
Impact on Alberta SCO/Oil Sands?
Significant Production Growth • From existing fields and emerging
plays • Bakken production to double to
800,000 bbls/day by 2016-18 • Tight oil plays in general could boost
production to 2 million bbls/day • Total estimated recoverable resources
are more than 17 billion barrels Tight oil impact not as profound as shale gas. Large production possible however: • Oil is global - demand is very large • Refineries have spent billions to
process more heavy oil. Tight oil is “light”

Despite Increased Tight Oil Production, Heavy Crude Oil Still in Demand

North American Light Crude Prices Not Keeping Pace with Global (Brent) Prices

North American Heavy Crude Prices Not Keeping Pace with Global (Maya) Prices

17
Access to New Markets Is Critical!
Some Good News on the Horizon…
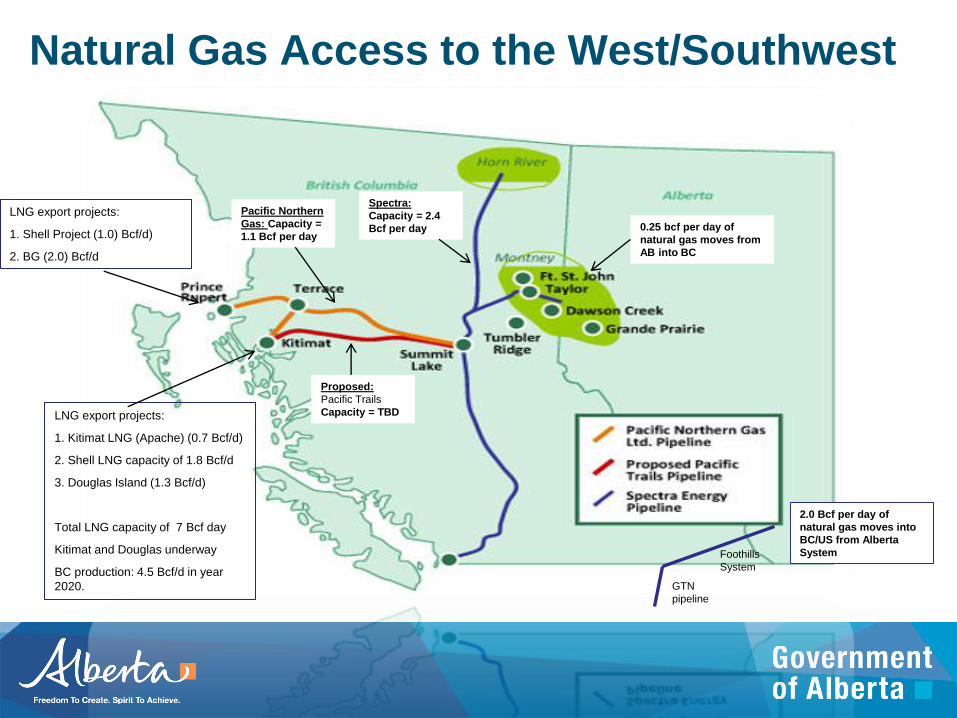
Natural Gas Access to the West/Southwest
0.25 bcf per day of
natural gas moves from
AB into BC
2.0 Bcf per day of
natural gas moves into
BC/US from Alberta
System Foothills
System
GTN
pipeline
Spectra:
Capacity = 2.4
Bcf per day
Proposed:
Pacific Trails
Capacity = TBD
Pacific Northern
Gas: Capacity =
1.1 Bcf per day
LNG export projects:
1. Kitimat LNG (Apache) (0.7 Bcf/d)
2. Shell LNG capacity of 1.8 Bcf/d
3. Douglas Island (1.3 Bcf/d)
Total LNG capacity of 7 Bcf day
Kitimat and Douglas underway
BC production: 4.5 Bcf/d in year
2020.
LNG export projects:
1. Shell Project (1.0) Bcf/d)
2. BG (2.0) Bcf/d
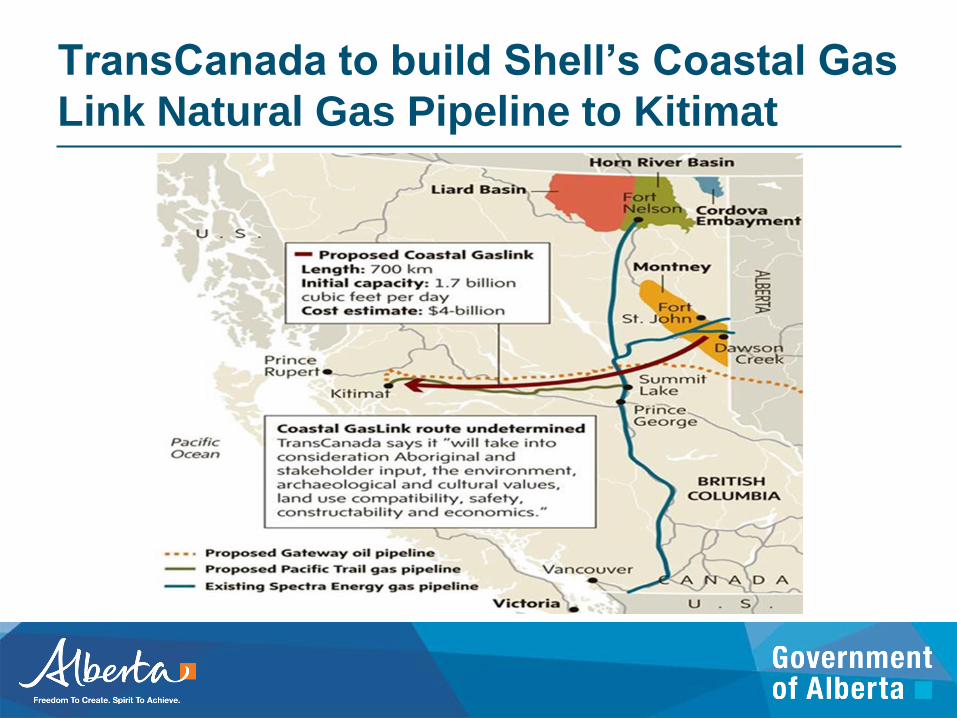
TransCanada to build Shell’s Coastal Gas
Link Natural Gas Pipeline to Kitimat

Existing: Keystone (591k b/d)
Proposed: Keystone XL Hardisty to Cushing
(700k b/d)
Proposed: Keystone XL Cushing to Gulf (500k
b/d)
Now called “Gulf Coast Project” (700k b/d)
TransCanada Keystone XL & Gulf Coast Project

Enbridge “Gulf Coast Access Project”
Existing: Canada
Mainline System (2.5
million b/d with Lakehead)
Existing: Lakehead
System (2.5 million b/d
with Canada Mainline)
Existing: Spearhead
System (2.5 million b/d
with Canada Mainline)
Proposed: Flanagan
South (535k b/d) - 2014
Proposed: Seaway:
Phase 1: Reversal (150k b/d) - 2012/13
Phase 2: Expansion (from 150k b/d to 400k b/d) – 2014
Phase 3: Twinning (from 400k b/d to 850k b/d) - 2014
Existing Enbridge Line
Proposed Enbridge Line
New Coking Capacity:
- WRB in Wood River
- Marathon in Detroit
- Motiva in Port Authur
- BP in Whiting

Access to the East: Enbridge Line 9
Reversal
Line 9 reversal - Phase 1:
Reversal from Sarnia to
Imperial Oil Refinery in
Nanticoke and United
Refining Company's
refinery in Warren,
Pennsylvania
Phase 2:
Full reversal from
Sarnia to Suncor
refinery in Montreal
Phase 3:
Reversal of Portland
Montreal Pipeline
which would see
crude oil flow from
Montreal to the
seaport in Portland
Maine.
STATUS
Application to reverse the first section
of line has been submitted to the NEB
Currently, there is 734k b/d of pipeline capacity
linking Alberta crude oil to Ontario.
In 2010, Alberta exported 252k b/d of light
crude oil to Ontario (balance of capacity on
pipelines filled with light barrels form Sask,
Man and the Midwest

Eastern Markets: More Complicated Discussion
• Refined Product Demand:
– Demand not as strong
– More competitive
– Deficit situation in East Coast US?
• Crude Oil Demand:
– Refineries are simple – can process light crude
– Crude feed stocks are expensive
– Cheaper feedstocks available from Bakken

Crude Oil Access to the West:
Kinder Morgan TMX
Proposed: Northern Leg
(after 2016) +400k bpd
- All crude oil – no RPP’s
Existing: 300k bpd
Proposed: 450k bpd
expansionMostly crude oil and
refined products
Remaining 75k bpd
shipped off of Westridge
docks to California
150k (from the current 300k bpd)
end up in Burnaby and North
Washington

Crude Oil Access to the West: Enbridge Gateway
Proposed: 525k bpd
capacity. All crude oil
(SCO, SynBit, DilBit)
Proposed: Condensate
line from Kitimat back to
Edmonton (193k bpd)

26
Can Alberta Deliver its Refined Products to the World?
Overview of Alberta’s Current Refined Products
Market

27
Refining Capacity in Canada
Source: NRCan

Alberta Refined Products Refining
Capacity
Source: StatsCan, Enbridge, Kinder
Morgan
C B
A
A) Imperial – 187,000 B/D
B) Suncor -135,000 B/D
C) Shell – 110,000 B/D
36,000 B/D
by pipeline; 14,000
B/D by truck
38,000 B/D
by pipeline; 3,000
B/D by truck/rail
Alberta Refineries - Capacity
Trucked/Railed
volumes are
estimated
-
20,000
40,000
60,000
80,000
100,000
120,000
140,000
160,000
180,000
200,000
2005 2011
Barre
ls Pe
r Day
Gasoline
-
20,000
40,000
60,000
80,000
100,000
120,000
140,000
160,000
180,000
200,000
2005 2011
Barre
ls Pe
r Day
Diesel
-
5,000
10,000
15,000
20,000
25,000
30,000
2005 2011Ba
rrel
s Pe
r Day
Jet Fuel
Alberta consumption Other province Consumption
Alberta Production

29
Alberta Synthetic Crude Oil Refining Capacity
Source: Govt Alberta Fact Sheet – April 2011; ERCB ST-98
Athabasca
Alberta Upgraders – Capacity A. Suncor – 357,000 B/D B. Syncrude – 350,000 B/D C. Shell Scotford – 158,000 B/D D. Opti-Nexen – 58,500 B/D E. CNRL Horizon – 114,000 B/D
Cold Lake
B
A
D
C
E
Bitumen
Upgraders
Peace River
0.00
0.50
1.00
1.50
2.00
2000 2010 2020
Mill
ion
Bar
rels
Pe
r D
ay
SCO Production
0.00
0.50
1.00
1.50
2.00
2000 2010 2020M
illio
n B
arre
ls P
er
Day
Dilbit Production
0.00
0.50
1.00
1.50
2.00
2000 2010 2020
Mill
ion
Bar
rels
Pe
r D
ay
Conventional Production

30
Western Canada Supply-Demand Balance Forecast, 2010-2020
400,000
450,000
500,000
550,000
600,000
Ba
rre
ls P
er
Da
y
Supply Demand
Source: Statistics Canada, Purvin & Gertz
The supply-demand deficit is growing in western Canada.
If refining capacity is not added, Western Canada demand for RPPs is forecast to exceed supply by 90,000 b/d by 2020.

Current Alberta Refined Products
Markets (Diesel, Gasoline and Jet Fuel)
PADD 5
PADD 3 (Major
transportation fuel
Supplier)
PADD 1 Large consumers of
fuels. Landlocked
region with “simple”
refineries
PADD 2 Structural deficit
for diesel
/gasoline
Eastern
Canada
Exports
Alberta
Exports
Global Imports
2.1 m b/d
10,000 b/d PADD 4
80,000 b/d
Source: EIA, 2011 data
Unlike Crude Oil, Alberta Has Limited
Access to U.S. Mid West for its Refined Products
Western
Canada Strong Demand!

Summary • Alberta energy production and reserves among the highest in
the world.
• Lack of North American transportation infrastructure impacting market access. However, some good news to the south.
• North American crude oil production increasing, however:
– Will still need our heavy crude oil
– Alaska/Mexican crude oil imports declining
• North American natural gas production increasing, however:
– Drilling activity focused on liquids rich plays – crude oil
– Environmental concerns with hydraulic fracturing

THANK-YOU