Embed Size (px)
Citation preview


2 alaska green jobs report
Visit R&A Green jobs Online:labor.alaska.gov/research/greenjobs/greenjobs.htm
ALASKADEPARTMENT OF LABOR and WORKFORCE DEVELOPMENT
Governor Sean ParnellCommissioner Clark Bishop
Research and Analysis SectionBrynn Keith, Chief
Dean Rasmussen, Project Lead
On the cover: A wind turbine generator, towering more than 110 feet and with blades each 44 feet long, is installed at the Tin City Long Range Radar Station near Tin City, Alaska. The generator will augment the existing diesel-fueled power system at the site. Photo courtesy of the U.S. Air Force.
Images in this report, except where otherwise noted, are courtesy of the Alaska Department of Commerce, Community, and Economic Devel-opment; Division of Community and Business Development.
Printed in June 2011 at a cost of $3.93 per copy.
June 2011June
PREPARED BY:
Stephen DeutschEconomist
Sara WhitneyEditor/Graphic Artist
Jeanne BillerJack CannonJesse DonnerKathy ErmatingerJeff HadlandEvelyn KirstineKelsey Kost
Rob KreigerDavid MiliusTodd MosherCaroline SchultzErik Stimpfl eJosh Warren
PROJECT CONTRIBUTORSThis report was funded by a grant awarded by the U.S. Department of Labor’s Employ-ment and Training Administration. The report was created by the grantee and does not necessarily refl ect the offi cial position of the U.S. Department of Labor. The Depart-ment of Labor makes no guarantees, warranties, or assurances of any kind, express or implied, with respect to such information, including any information on linked sites, in-cluding, but not limited to, accuracy of the information or its completeness, timeliness, usefulness, adequacy, continued availability, or ownership. This report is copyrighted by the institution that created it. Internal use by an organization and/or personal use by an individual for noncommercial purposes is permissible. All other uses require the prior authorization of the copyright owner.
DISCLAIMER

3alaska green jobs report
table
of contents
Executive Summary 4 How Many Green Jobs Are There? 4 Industries and Occupations 4 The Seven Categories 4 Shades of Green 5 Training 5 Public Sector Employment 5
Summary of Data 6 Employer Data 6 Industries 7 Occupations 7 SIDEBAR: Historically Green 9 SIDEBAR: Renewable Energy in Alaska 12
Occupational Highlights 13 Skills or Certifi cations 13 Recruiting Green Workers 13 Retooling the Workforce 14 SIDEBAR: Alaska Training Clearinghouse 16 SIDEBAR: Cold-Climate Weatherization 17
State Employees 18 SIDEBAR: The Seafood Industry 18
Appendix One: Methodology 20Appendix Two: Survey Instrument 21Appendix Three: Alaska’s Green Occupations 23Appendix Four: Alaska’s Green Occupations, State Government 26
List of Tables One: Green Employers by Industry 6 Two: Green Employment by Industry 7 Three: Top Green Occupations by Employment 8 Four: Top Green Occupations by Green Score 10 Five: Top Green Occupations by Percent Green 11 Six: Green Occupations with Special Requirements, by Training Category 13 Seven: Diffi culty Recruiting or Retaining Workers, by Occupation 14 Eight: Green Job: Environmental Engineer 15 Nine: Public Sector Employees, State 19

4 alaska green jobs report
This report was funded as part of a United States Department of Labor state labor market information
improvement grant. The scope of this grant is to promote economic growth by quantifying jobs and skill sets associ-ated with green jobs throughout Alaska.
METHODOLOGY
The Alaska Department of Labor and Workforce Develop-ment Research and Analysis Section conducted a survey of 4,826 private and local government fi rms during the fourth quarter of 2010. R&A received a response from 2,979 of these fi rms, with 375 reporting they employed at least one worker in a green job. R&A defi ned a green job as one where workers provided a good or service in at least one of seven categories:
• Renewable energy• Energy effi ciency• Greenhouse gas reduction• Pollution prevention, reduction, and cleanup• Recycling and waste reduction• Agricultural and natural resources conservation• Education, compliance, public awareness, and training
HOW MANY GREEN
JOBS ARE THERE?Research and Analysis identifi ed 145 individual green oc-cupations with reported employment in Alaska. Total green employment was estimated at 4,973 green jobs1 among 1,552 employers during 2010, with green work represent-ing 1.7 percent of Alaska’s private and local government employment.1 Except where otherwise noted, all employment references in this report only refl ect private and local government employment.
The results are consistent with existing research that sug-gests green jobs do not represent an industry of their own; rather, they are spread across all industries where employ-ers pursue more environmentally sustainable concepts.
INDUSTRIES AND OCCUPATIONS
Research and Analysis found the largest concentrations of green jobs in local government, at 1,033 jobs (20.8 per-cent); and in professional, scientifi c, and technical service organizations, at 1,013 jobs (20.4 percent). Tour guides as an occupation had the largest green employment.
THE SEVEN CATEGORIES
The following is a summary of jobs by category:
Renewable energy accounted for 13 percent (639) of all positions.2 These jobs were found primarily among employ-ers in utilities and local government.
Energy effi ciency accounted for 39 percent (1,954) of all positions. These jobs were found primarily in construction.
Greenhouse gas reduction accounted for 9 percent (466) of all positions. These jobs were found primarily within the utilities industry and mostly focused on occupations that were helping the transition to power sources with less carbon pollution.
Pollution prevention, reduction, and cleanup accounted for 33 percent (1,620) of all positions. These jobs were found primarily in waste management and remediation.
Recycling and waste reduction accounted for 32 percent (1,611) of all positions. These jobs were found primarily within waste management and local government, but this category spanned the largest cross-section of industries.2 An employer can classify workers in more than one category. The sum will exceed the total number of green jobs.
executive
summary

5alaska green jobs report
Agricultural and natural resources conservation accounted for 26 percent (1,313) of all positions. These jobs were found primarily in agriculture, and in professional and scientifi c ser-vices.
Education, compliance, public awareness, and training ac-counted for 35 percent (1,740) of all positions. These jobs were found primarily in professional and scientifi c services.
SHADES OF GREEN
Most workers in green jobs don’t spend 100 percent of their time producing a green product or service. Survey data sup-port the idea of “shades of green.” Many workers have accept-ed new “environmentally conscious” roles that supplement their primary workload. In other cases, workers have found them-selves in essentially new occupations where the green work differs signifi cantly from that of their nongreen counterparts.
By taking the average percentage of time workers in an oc-cupation spend performing green work, R&A estimated the various shades of green among industries and occupations. The section found that 8 percent of green occupations spent greater than or equal to 50 percent of their time on average performing work in one of the green categories.
TRAINING
About half of all green jobs required extensive on-the-job training, certifi cation, or special licensing. The Hazardous Waste Operations and Emergency Response Standard (HAZ-WOPER) was the most common required certifi cate. Leader in Energy Effi cient Design (LEED) also showed up frequently in engineering, where fi rms are seeing a greater market demand for energy effi ciency.
PUBLIC SECTOR EMPLOYMENT
The centralized administration of state and federal divisions made it diffi cult to survey public employees. The resulting state and federal employment numbers refl ected reported values from a nonstatistical sampling of state workers.
R&A used the State of Alaska e-mail system to directly contact employees in a division that was likely to have green jobs. Although statistically reliable employment estimates were not possible, the survey did show that green work in the public sector was overwhelmingly in education, compliance, public awareness, and training; as well as in agriculture and natural resource conservation.
keyicons
k
CO2
Renewable energy
Energy efficiency
Greenhouse gas reduction
Pollution prevention, reduction,and cleanup
Recycling and waste reduction
Agricultural and naturalresource conservation
Education, compliance, publicawareness, and training
6 alaska green jobs report
summary
of data
EMPLOYER DATA
Green employers provided business and occupation information that
showed how they’ve adapted to chang-es in the market for green products and services.
An estimated 9.4 percent of employers in the state have at least one worker performing green tasks. Professional and scientifi c services, specialty trade contractors, and local governments represented the largest concentrations of green employers among industries, respectively.
Around 22 percent of these employ-ers reported they had added additional workers because of an increased de-mand for green goods or services, and the professional and scientifi c services industry reported the largest increase in workers. Occupations and fi rms within this industry are diversifi ed across all seven green categories. These data support a picture of Alaska’s employers identifying challenges, available re-sources, and viable alternatives.
New occupations in local govern-ment and specialty trade contracting increased the most because of rising demand for green products and services. Professional, scientifi c, and techni-cal services are expanding to support increased green activities, and industries that implement that research are creating new positions and training to support them.
Around 14 percent of fi rms surveyed across all industries
Industry
Employers Reported categories*Green Total
Agriculture, Forestry, Fishing, and Hunting1 39 138
Mining, Quarrying, Oil and Gas 26 164
Utilities 20 77
Construction of Buildings 161 678
Heavy and Civil Engineering Construction 16 215
Specialty Trade Contractors 222 1,310
Manufacturing 62 499
Wholesale Trade 65 622
Retail Trade 49 1,834
Transportation and Warehousing 36 800Information 0 244 N/AFinancial Activities 67 1,049
Professional, Scientifi c, and Technical Services 344 1,800
Administrative and Support Services 44 883
Waste Management and Remediation Services 50 123
Educational Services, Private 25 222
Health Care and Social Assistance, Private 27 1,614
Leisure and Hospitality 34 2,152
Other Services (Except Government) 86 1,453
Local Government 179 636TOTAL 1,552 16,513
ONEONE Green Employers by Industry
said they were adding jobs in response to green demand. Another 36 percent reported sending workers for addi-tional green jobs training, which ranged from Hazardous Waste Operations and Emergency Response Standard (HAZWOPER) training to wind turbine maintenance and Leader in Energy Effi cient Design (LEED) certifi cation. Local government and specialty trade contractors most
*See page 5 for icon key.
1 Excludes the self-employed and most commercial fi shermen and agricultural workers. Source: Department of Labor and Workforce Development, Research and Analysis Section

7alaska green jobs report
frequently reported sending workers for extra training.
INDUSTRIES
Local and tribal governments as an industry have the largest number of green jobs. In a rural community, people often wear many hats in addition to their regular jobs. It is not unusual to fi nd seemingly unlikely combinations, such as cooks who also run the community compost program.
The Environmental Protection Agency’s Indian General Assistance Program had a big impact in Alaska by provid-ing funds for tribal governments to address solid and hazardous waste management, recycling, and renewable energy.
Professional and scientifi c services came in a close second for number of green jobs. Work in this industry is broad and instrumental in development of renewable energy, energy effi ciency, and sustainability education.
The highest concentration of green jobs is found in the waste management and remediation industry. Its percent-age of statewide employment is one of the smallest, but occupations in this sector are critical to supporting the state’s environmental health. Many of this industry’s jobs
Industry
Estimated
green jobsAs % of all green jobs
3rd qtr 2010 employment
As % of industry employment
Agriculture, Forestry, Fishing, and Hunting1 205 4.1% 1,208 17.0%Mining, Quarrying, Oil and Gas 125 2.5% 16,156 0.8%Utilities 110 2.2% 2,233 4.9%Construction of Buildings 278 5.6% 5,698 4.9%Heavy and Civil Engineering Construction 58 1.2% 4,540 1.3%Specialty Trade Contractors 481 9.7% 9,341 5.1%Manufacturing 305 6.1% 19,040 1.6%Wholesale Trade 91 1.8% 6,666 1.4%Retail Trade 225 4.5% 36,898 0.6%Transportation and Warehousing 53 1.1% 21,414 0.2%Information 0 0.0% 6,483 0.0%Financial Activities 91 1.8% 15,385 0.6%Professional, Scientifi c, and Technical Services 1,013 20.4% 14,209 7.1%Administrative and Support Services 17 0.3% 10,713 0.2%Waste Management and Remediation Services 367 7.4% 1,626 22.6%Educational Services, Private 37 0.7% 2,065 1.8%Health Care and Social Assistance, Private 5 0.1% 39,891 0.0%Leisure and Hospitality 321 6.5% 37,399 0.9%Other Services (Except Government) 158 3.2% 12,174 1.3%Local Government 1,033 20.8% 30,996 3.3%TOTAL 4,973 100.0% 294,135
1 Excludes the self-employed and most commercial fi shermen and agricultural workers.Note: All numbers exclude state and federal employment. Percentages won’t sum due to rounding.
TWOTWO Green Employment by Industry
are fundamentally green because they deal overwhelm-ingly with handling waste and mitigating the effects of pollution.
Green jobs are found across almost all industries, but as expected, this survey did not uncover any in the informa-tion industry, and found few in health care and adminis-trative support. These results are in line with other states’ research.
OCCUPATIONS
Research and Analysis asked employers to identify oc-cupations that fell into at least one of the seven green categories. Those who responded reported:
• The total number of workers in these jobs • How many performed green work • The percentage of time each employee spent doing green work • Green categories
R&A used this set of questions to build a database of 145 green occupations within the Standard Occupation Clas-sifi cation (SOC) coding system.
Source: Department of Labor and Workforce Development, Research and Analysis Section

8 alaska green jobs report
Green jobs can be quantifi ed several ways. In most cases, green work is a subset of all work performed in an exist-ing occupation. For example, some engineers seek LEED certifi cation, which allows them to perform additional work. However, even a LEED-certifi ed engineer will design build-ings that do not meet LEED standards, when requested.
By employment numbers, the top 25 green occupations represent 66 percent of green employment in the state. Tour guides and escorts are the largest occupation by green employment. Alaska has a highly seasonal tourism industry that depends on the state’s natural beauty and resources. The survey shows that slightly less than 38 percent of tour guides and escorts educate the public on sustainable practices and increase public awareness of sustainability concepts.
As a major occupational group, construction and ex-traction occupations have the largest total employment
and include eight of the top 25 occupations. This result matches other states’ data, and refl ects a subset of the construction industry that focuses on home weatherization and energy effi ciency upgrades.
The green occupations with the highest employment fall primarily into the energy effi ciency category, which is fol-lowed closely by education.
An occupation’s green score is the weighted average of the percentage of time spent on green activities within a given occupation. The numbers are rounded up and indexed between 1 and 10, with 10 representing 100 percent of work qualifying as green, 9 representing 90 percent, and so on.
Thirty-fi ve green occupations scored greater than 2. Oc-cupations with the most time spent on green activities (e.g., wind turbine technicians) often have the lowest total
THREETHREETop Green Occupations by Employment
Occupation Estimated green jobs
3rd qtr 2010 employment
% of allgreen jobs
Categoriesof work*
Tour Guides and Escorts 440 1,133 8.9%
Carpenters 275 3343 5.5%
Fishers and Related Fishing Workers1 266 605 5.4%
Environmental Scientists and Specialists, Including Health 254 401 5.1%
Retail Salespersons 247 11,520 5.0%
Construction Laborers 212 5461 4.3%
Zoologists and Wildlife Biologists 166 254 3.3%
Environmental Science and Protection Technicians, Including Health
158 158 3.2%
Geological and Petroleum Technicians 144 649 2.9%
General and Operations Managers 139 3,780 2.8%
Roofers 111 324 2.2%
Environmental Engineering Technicians 93 253 1.9%
Ship Engineers 93 208 1.9%
Service Unit Operators, Oil, Gas, and Mining 63 660 1.3% CO2
Environmental Engineers 60 177 1.2%
Hazardous Materials Removal Workers 58 327 1.2%
First-Line Supervisors/Managers of Construction Trades and Extraction Workers
52 1,134 1.1%
First-Line Supervisors/Managers of Farming, Fishing, and Forestry Workers
52 125 1.1%
Offi ce Clerks, General 51 6,236 1.0%
Power Plant Operators 49 441 1.0%
1 Excludes most commercial fi shermenSource: Department of Labor and Workforce Development, Research and Analysis Section *See page 5 for icon key.

9alaska green jobs report
Alaska’s history is rich in areas that are now consid-ered green technology. At the turn of the 20th century,
hyydroelectric power fueled economic growth in South-east Alaska by providing reliable electric power to gold mining operations.
Today, hydroelectric accounts for 25 percent of statewide electrical power, and it continues to be a critical compo-nent of our energy infrastructure.
Cold winters and high transportation costs necessitate making more with less, and the history of Alaska is one of using scarce energy resources as effi ciently as possible. Thus, energy effi ciency in housing design has played a critical role, from Native communities along our windy coasts to the frigid winters of the Interior.
HISTORICALLY GREENemployment. It is also important to look at an occupation’s green employment percentage to assess whether green is prevalent throughout the group or in just a fraction, represented by a few companies producing a specifi c green product.
This distinction is useful for determining how to discuss and target green occupations in the state. Carpenters and construction laborers are two occupations ranking high in green employ-ment and low on percentage of time spent in green activities. Both are large occupation groups doing important work in the home weatherization industry; however, targeting all of these positions for training might not be the best approach. It might make more sense to focus specifi cally on businesses employing carpenters or construc-tion laborers whose primary purpose is a green product or service.
On the other end of the spectrum, a wind turbine service technician’s work is 100 percent green. Even though employment in this occupation is extremely low, any training would go directly toward producing green goods and services.When grouped by green score, occupations are primarily performing work in the agriculture and
Above, the Annex Creek Hydro Power Plant in the late 1800s or early 1900s. Photo courtesy of the Alaska State Library Historical Collections.

10 alaska green jobs report
Occupation Estimated green jobs
3rd qtr 2010 employment
Greenscore
Categoriesof work**
Environmental Science Teachers, Postsecondary * * 10
Wind Turbine Service Technicians * * 10
Materials Scientists * * 9
Cleaning, Washing, and Metal Pickling Equipment Operators and Tenders
* * 8
Environmental Science and Protection Technicians, Including Health 158 158 8
Zoologists and Wildlife Biologists 166 254 7
Boilermakers 30 44 5
Conservation Scientists 23 28 5
Foresters * * 5
Molding, Coremaking, and Casting Machine Setters, Operators, and Tenders, Metal and Plastic
14 30 5
Power Distributors and Dispatchers 17 34 5
Ship Engineers 93 208 5
Chemical Engineers 40 48 4 CO2
Environmental Scientists and Specialists, Including Health 254 401 4
Fishers and Related Fishing Workers1 266 605 4
Environmental Engineers 60 177 3
Farm and Home Management Advisors * * 3
First-Line Supervisors/Managers of Farming, Fishing, and Forestry Workers
52 125 3
Geological and Petroleum Technicians 144 649 3
Natural Sciences Managers 17 28 3
Sales Engineers 20 45 3
Tour Guides and Escorts 440 1,133 3
Travel Guides * * 3
Biological Technicians 7 59 2
Economists * * 2
Environmental Engineering Technicians 93 253 2
First-Line Supervisors/Managers of Landscaping, Lawn Service, and Groundskeeping Workers
13 65 2
Logging Equipment Operators 11 50 2
Roofers 111 324 2
Soil and Plant Scientists * * 2
Training and Development Specialists 32 156 2
FOURFOURTop Green Occupations by Green Score
1 Excludes most commercial fi shermenAn asterisk (*) means the data are suppressed due to confi dentiality and/or reliability reasons.Source: Department of Labor and Workforce Development, Research and Analysis Section
**See page 5 for icon key.

11alaska green jobs report
Occupation Estimated green jobs
3rd qtr 2010 employment
% green by occupation
Categoriesof work**
Cleaning, Washing, and Metal Pickling Equipment Operators and Tenders
* * 100.0%
Environmental Science and Protection Technicians, Including Health
158 158 100.0%
Wind Turbine Service Technicians * * 100.0%
Environmental Science Teachers, Postsecondary * * 92.3%
Materials Scientists * * 85.7%
Chemical Engineers 40 48 83.3% CO2
Conservation Scientists 23 28 82.1%
Economists * * 75.0%
Boilermakers 30 44 68.2%
Zoologists and Wildlife Biologists 166 254 65.4%
Soil and Plant Scientists * * 64.3%
Environmental Scientists and Specialists, Including Health 254 401 63.3%
Natural Sciences Managers 17 28 60.7%
Logging Workers, All Other 20 33 60.6%
Foresters * * 50.0%
Power Distributors and Dispatchers 17 34 50.0%
Molding, Coremaking, and Casting Machine Setters, Operators, and Tenders, Metal and Plastic
14 30 46.7%
Ship Engineers 93 208 44.7%
Sales Engineers 20 45 44.4%
Fishers and Related Fishing Workers1 266 605 44.0%
First-Line Supervisors/Managers of Farming, Fishing, and Forestry Workers
52 125 41.6%
Tour Guides and Escorts 440 1,133 38.8%
Environmental Engineering Technicians 93 253 36.8%
Roofers 111 324 34.3%
Environmental Engineers 60 177 33.9%
FIVEFIVETop Green Occupations by Percent Green
natural resources category, followed closely by pollution reduction, then education.
Finally, examining the occupations by the percentage of green jobs illuminates the structure of the work within the occupation. There is signifi cant overlap between the high-est concentrations of green jobs and the table of jobs by green score.
Chemical engineers are an example of an occupation with a high percentage of green employment (83 percent) but a relatively low green score (4). A large percentage
of chemical engineers perform green work, but only as a minor part of their overall workload.
Taken together, the employment estimates and green scores provide a more robust look at the effects of green work in Alaska. Jobs with high employment and low green activity, as well as jobs with low employment and high activity, are both critical to the development of the state’s green infrastructure. Understanding their differences will increase the effi cacy of developments targeting these two groups and any combination.
**See page 5 for icon key.
1 Excludes most commercial fi shermen. An asterisk (*) means the data are suppressed due to confi dentiality and/or reliability reasons.Source: Department of Labor and Workforce Development, Research and Analysis Section

12 alaska green jobs report
Power generation from renew-able sources has a long history
in Alaska. The Eklutna hydroelectric power plant was responsible for the electrifi cation of Anchorage in 1929, which fueled the growth of the small railroad outpost. Since then, Alaska has experimented with various power sources and of those, natural gas meets the largest portion of our energy demands.
Because of the rising environmental and economic costs of petroleum products, rural communities favor multipronged approaches to power generation. Wind-diesel hybrids use wind power in favorable conditions and utilize diesel as a backup. Kot-zebue and Wales are examplesof small-scale hybrid projects de-signed to offset diesel use. Kodiak Island uses wind and hydro facilities to provide 90 percent of the community’s energy needs, with the remaining 10 percent powered by diesel. The two projects generate power at less than half the cost of diesel per kilowatt hour.
In the city of Eagle, a remote village on the Yukon River, damming the river for power is expensive and has serious environmental considerations. Alaska Power and Telephone instituted a low-im-pact hydrokinetic river turbine in 2010 to help meet the city’s power needs during ice-free months on the river. A barge platform containing the turbine is anchored in the river near the community, where electrical lines transmit energy from the platform to the existing power grid. The entire platform is re-
moved from the river during winter, when the town returns to diesel power.
Multiple approaches are likely to continue as the future of power generation in Alaska. In 2010, the 26th Legislature passed House Bill 306 to establish an energy policy for the state. The bill sets a goal for Alaska to generate 50 percent of its electricity through renewable resources by 2025. That same year, the Legislature passed the Alaska Sustain-able Energy Act to direct investments in Alaska’s energy resources. Also in 2010, the Alaska Divi-sion of Business Partnerships received an Energy Sector Partnership grant to train 700 workers to support the state’s emerging renewable energy and energy effi cient infrastructure.
RENEWABLE ENERGY IN ALASKA
Above, the Yukon River Hydrokinetic Turbine Project. Photo by Mark Mc-Cready, Alaska Power and Telephone.

13alaska green jobs report
occupational
highlights
SKILLS OR CERTIFICATIONS
Employers reported that 46 percent of green occupa-tions require special skills, certifi cates, or licenses to
perform the work. This survey did not ascertain if these requirements were a condition of hire.
Three percent of green jobs required renewable energy certifi cation or training, and these requirements were primarily in the utilities and local government industries. Employers reported that 5 percent of green jobs required an equipment operator or commercial driver’s license. A CDL was often paired with a Hazardous Materials En-dorsement.
By far the most prevalent certifi cation reported was the Hazardous Waste Operations and Emergency Response Standard (HAZWOPER). Cleanup and abatement certi-fi cation was required by 15.5 percent of green occupa-tions, with the HAZWOPER certifi cation accounting for
approximately half of the responses within the category. Energy effi cient construction and LEED certifi cation was the largest specifi c requirement reported, at 16 percent of all occupations.
Other certifi cations at 10 percent and prior experience or on-the-job training at 18 percent captured a wide breadth of requirements that did not contain enough responses to stand on their own. Other certifi cations included occupa-tions requiring a bachelor’s degree specifi c to green-related work. Table Six provides examples of reported requirements.
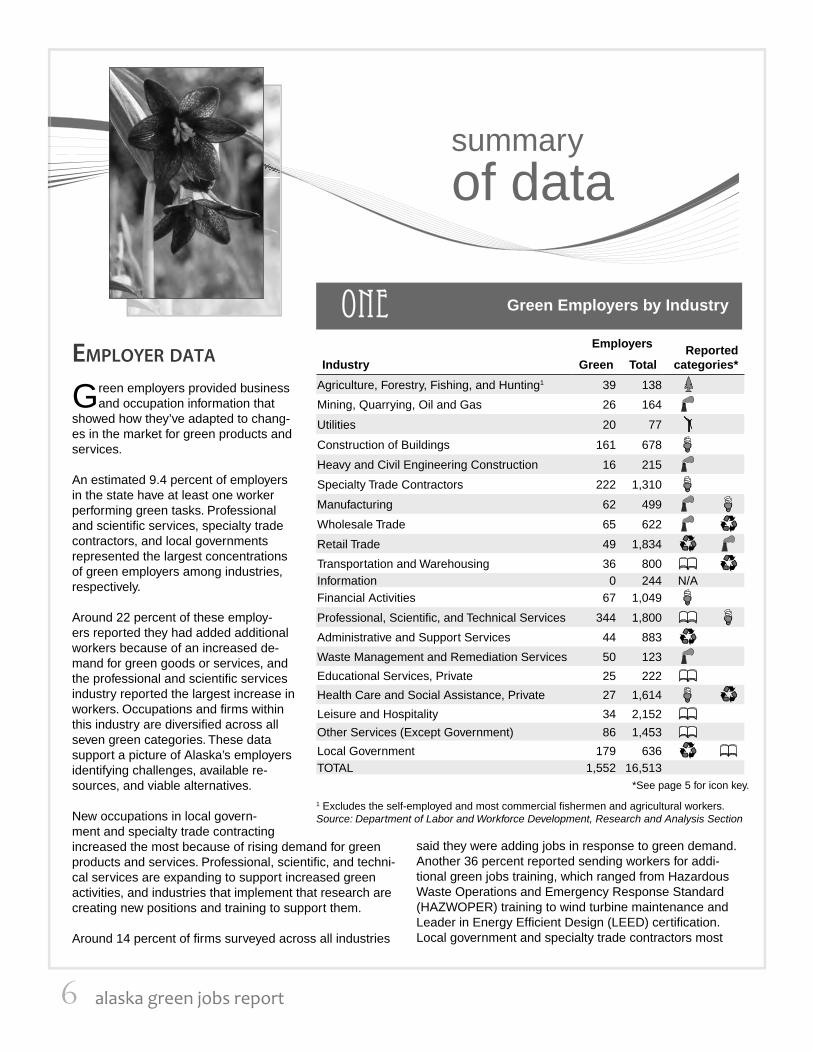
RECRUITING GREEN WORKERS
Recruiting and retaining green workers is not currently an issue for 80 percent of all green jobs. Employers who have had diffi culty cite a lack of workers in Alaska (6 percent), a lack of required green skills (4 percent), and other reasons (4 percent).
The recruitment table (Table Seven) contains occupa-tions with the highest reported diffi culty recruiting or retaining workers. Six of the 11 occupations require more
Training Category % reported Examples
Renewable Energy Certifi cation 3.2%Wind Turbine Operation and Maintenance (O&M),Calibrating solar panels
Cleanup and Abatement Certifi cation 15.5% HAZWOPER Oil Spill Response Training
Equipment Operators License/CDL 4.9% Class A CDL Hazardous Materials Endorsement (HME)
Energy Effi cient Construction/LEED (Weatherization) 16.4%LEED Certifi ed Building Energy Effi ciency Standard (BEES)
Other Certifi cation 10.4%Certifi ed Erosion and Sediment Control Lead (CESCL), Certifi ed Forester
Prior Experience/On-the-Job Training 17.8% Organic Farming Techniques, Knowledge of Regulations
SixSix Green Occupations with Special Requirements by Training Category
Source: Department of Labor and Workforce Development, Research and Analysis Section
14 alaska green jobs report
than a year of training, either on the job or through a degree program.
As a group, green occupations have a nonresident hire rate of 16 percent, compared to 20 percent across all private and local government employment. Occupations with the most diffi culty recruiting due to lack of workers in Alaska usually reported nonresident hire rates above the rate for all green occupations.
These data continue to support the conclusion that green jobs are an emerging component across all industries and occupations. In some cases, workers have been doing green work without that previous classifi cation, and their industries are well established. In other cases, occupa-
tions such as power plant operators integrate investments in renewable resources while supporting existing tradi-tional power generation infrastructure.
RETOOLING THE WORKFORCE
The state plans to focus on helping future job seekers and providers target the skills necessary for green employ-ment, for example, by expanding the ALEXsys system and training 700 workers through the State Energy Sector Partnership grant. Tools such as O*NET, the Occupation Information Network, provide detailed information on nec-essary knowledge, skills, and abilities. This database also compiles information on a job’s expected tasks.
Occupation
Have you had diffi culty recruiting or retaining workers in green-related activities?
Nonresident hire
Training level
(see notes)NoYes, lack of
Alaska workersYes, lack
of req. skillsYes, other reasons
Construction and Related Workers, All Other
83% 17% 17% 0% 39.4% MTOJT
Service Unit Operators, Oil, Gas, and Mining
0% 0% 0% 100% 32.3% MTOJT
Helpers, Construction Trades, All Other 57% 14% 0% 14% 21.8% STOJTConstruction Laborers 70% 10% 10% 10% 18.0% MTOJTCarpenters 67% 10% 5% 5% 17.8% LTOJTLaborers and Freight, Stock, and Material Movers, Hand
50% 17% 17% 0% 17.2% STOJT
Mining and Geological Engineers, Including Mining Safety Engineers
33% 67% 0% 0% 16.1% B.A.
Environmental Science and Protection Technicians, Including Health
64% 7% 14% 21% 12.7% A.A.
Environmental Engineers 60% 10% 10% 0% 11.2% B.A.General and Operations Managers 78% 7% 4% 0% 9.1% B.A.+Power Plant Operators 75% 0% 13% 13% 6.0% LTOJT
All Green Occupations 80% 6% 4% 4% 16.0%
STOJT: Short Term On-the-Job Training, typically requiring less than one month of training to attain average job performance.
MTOJT: Moderate Term On-the-Job Training, typically requiring between one and 12 months of combined on-the-job experience and informal training.
LTOJT: Long Term On-the-Job Training, typically requiring more than 12 months of on-the-job training or combined work experience and formal classroom instruction for workers to develop the necessary skills to attain average job performance.
A.A.: Associate degree, requiring completion of a degree program of at least two years of full-time equivalent academic work, is required to attain average job performance.
B.A.: Bachelor’s degree, requiring completion of a degree program of at least four years but no more than fi ve years of full-time equivalent academic work, is required to attain average job performance.
B.A.+: Bachelor’s degree plus some combination of additional work experience or continued education beyond the bachelor’s degree is required to attain average job performance in these occupations.
SevenSevenDiffi culty Recruiting or Retaining Workers, by Occupation
Source: Department of Labor and Workforce Development, Research and Analysis Section

15alaska green jobs report
Using this information, it is possible to identify existing members of the nongreen workforce who have skills that match green occupations in need
of workers. For example, if one wanted to fi nd workers qualifi ed to be environmental engineers, an employer could look at the attributes of an en-vironmental engineer and fi nd other occupations that share those qualities.
An environmental engineer is responsible for designing systems to prevent, control, and remediate environmen-tal health hazards. Like all occupations, their duties are numerous; for example, to “analyze engineering design problems” or “use land survey-ing techniques.” These activi-
ties are important, but they aren’t necessarily what make this a green occupation.
Table Eight lists 10 activities that contribute to an
Environmental engineer’s levelcompared to related occupations
Civilengineers
Mining andgeological engineers*
Environmental engineeringtechnicians
Overall KSA** similarity very high very high very high Overall Level difference about the same about the same much higherWage level about the same about the same at least 25% higherOverall KSA level slightly lower slightly higher moderately higherKnowledge level moderately lower moderately higher much higherSkill level slightly lower about the same slightly higherAbilities level about the same slightly higher slightly higher
Green-related activities
Supervise pollution control workers
Design waste recovery methodsTest air quality, noise, temperature, or radiationUse hazardous disposal techniques
Judge soil conditions
Analyze ecosystem data
Use building or land use regulations
Use pollution control techniques
Follow safe waste disposal procedures
Use hazardous materials information*Includes mining safety engineers ** Knowledge, skill, and ability
EightEight GREEN JOB: Environmental Engineer
... Is a body of information applied directly to the performanceof a function.
Knowledge
... Is an observable, learned competence to perform an act.
sKILL
... Is the natural capacity to perform an observable behavior that results in an observable product.
Ability
Above, a bear catches salmon at McNeil River Falls in Katmai National Park. Photo by Rex Melton; Alaska Department of Commerce, Community, and Economic Development; Division of Tourism
Source: Department of Labor and Workforce Development, Research and Analysis Section

16 alaska green jobs report
environmental engineer’s green workload. The table also lists three similar occupations and what activities they share as well as how their knowl-edge, skill, and ability compare to environmental engineers.
For example, working as an environmental engineering technician can be a predecessor to a career as an environmental engineer. These technicians assist in the development of pollu-tion remediation technology under the direction of an environmental engineer. The engineer has a much higher level of knowledge; however, the skills and abilities of the engineer are only slightly higher. As the technician gains more experience on the job and attains additional education, that worker could advance into the role of an engi-neer.
Mining and geological engineers also have many similarities to environmental engineers, including similar backgrounds in education, work experi-ence, and wages. However, an environmental engineer’s level of knowledge is slightly higher in most of the areas important to both occupations. While the skills for both occupations are roughly similar, a mining and geological engineer would need additional knowledge in chemistry to transi-tion to environmental engineering.
The civil engineer has higher knowledge and skills than the environmental engineer, and Alaska’s civil engineering labor pool is four times larger. This plus the fact that they earn similar wages makes them well qualifi ed if the demand for environmental engineers were to grow. If a number of civil engineers were to lose their jobs due to a downturn in a particular industry, some could retrain to become environmental engineers.
At left, Angoon residents install a solar power panel on a home as part of the Sustain Angoon Project. Photo cour-tesy of Central Council, Tlingit and Haida Tribes of Alaska.
The Alaska Training Clearinghouse (live.laborstats.alaska.gov/atc/) identifi es training available in Alaska,
searchable by providers, programs, and occupations.
The Research and Analysis Section has begun collect-ing information on green training programs in Alaska. So far, R&A has identifi ed 34 programs through eight train-ing providers. For example, Alaska Technical Center in Kotzebue has reported that their “Advanced Commercial Construction” program is green.
To view green programs and their providers on the Web site listed above, click on the “Green related occupations, training, or industries” fi lter on the programs and providers list pages. Below is our current list of green programs:
ABC of Alaska CarpentryABC of Alaska Construction Craft LaborerABC of Alaska ElectricianABC of Alaska HVACABC of Alaska Painting/Painter and Wall CoveringABC of Alaska Plumber/Pipefi tterABC of Alaska Sheet Metal WorkerABC of Alaska Sprinkler FitterAlaska Ironworkers IronworkAlaska Joint Electrical Apprenticeship and Training Trust
Wireman
Alaska Technical Center Advanced Commercial ConstructionAlaska Technical Center Construction Site DevelopmentAlaska Technical Center Construction TradesAlaska Technical Center Electrical InstallationAlaska Technical Center Electrical OrientationAlaska Technical Center Electrical SystemsAlaska Technical Center Electrical Systems/Heating SystemsAlaska Technical Center Electrical Systems/Heating Sys-
tems/Plumbing SystemsAlaska Technical Center Heating SystemsAlaska Technical Center Plumbing Drain, Waste & DevAlaska Technical Center Plumbing OrientationAlaska Technical Center Plumbing Supply Systems/pipeArctic Safety Training and Consulting Bridge Class, 40-HourArctic Safety Training and Consulting CITS-Cook Inlet Training StandardsArctic Safety Training and Consulting HAZWOPER 24-HourArctic Safety Training and Consulting HAZWOPER 40-HourArctic Safety Training and Consulting HAZWOPER RefresherArctic Safety Training and Consulting North Slope Training CooperativeArctic Safety Training and Consulting Petrochemical Health and SafetyFairbanks Area Plumber and Pipefi t-ters
Plumbing and Pipefi tting
Sheet Metal Workers Local Union #23 Journeyman Service WorkerSheet Metal Workers Local Union #23 Journeyman Sheet Metal WorkerSouthwest Alaska Vocational and Education Center
HAZWOPER, 40-Hour
Southwest Alaska Vocational and Education Center
HAZWOPER, 8-Hour Refresher
ALASKA TRAINING CLEARINGHOUSE

17alaska green jobs report
The construction industry plays a major role in the development of
green infrastructure in Alaska. Home weatherization and energy effi cient construction building practices are becoming popular with both new construction projects and retrofi tting existing structures.
Poorly insulated homes lead to signifi cant increases in heating costs in the winter. A push to weatherize homes has come from homeown-ers and public entities who fi nd that energy-effi cient upgrades are an economical way to counteract rising energy costs. As a result, carpenters and construction laborers are adding new techniques to their existing skills to meet these challenges. Mechani-cal engineers and architects are becoming LEED-certifi ed to design structures that provide energy sav-ings, water effi ciency, greenhouse gas emissions reduction, improved indoor environ-mental quality, and stewardship of resources and sensitivity to their impacts.
The Alaska Housing Finance Corporation received $200 million in state funding for the Weatherization Program and $160 million for a Home Energy Re-bate Program. In 2009, the American Recovery and Reinvestment Act provided an additional $18.1 mil-lion for the weatherization program. These programs offset consumers’ capital costs and may create new jobs in industries that provide weatherization.
Organizations such as Tlingit-Haida Regional Hous-ing Authority provide home weatherization training for people to take back to their communities. Like renewable energy, not all energy effi ciency methods are appropriate for all areas. Trainees learn about appropriate air sealing materials, installation tech-
niques, and insulation types and applications for their regions. For example, blower door testing fi nds buildings’ air leaks and measures the effectiveness of an air-sealing project after it is complete.
The Fairbanks-based Cold Climate Housing Re-search Center is a nonprofi t organization that promotes knowledge of energy effi cient building techniques in the circumpolar region. In addition to providing policy analysis for programs such as the Building Energy Effi cient Standard, they are also a vital experimental testing bed for new building practices in Alaska.
Green occupations in Alaska’s weatherization industry are numerous, from research to implemen-tation. Training in this area was Alaska’s highest reported green certifi cation requirement and will remain an important component of the state’s con-struction industry.
COLD-CLIMATE WEATHERIZATION
Above, a blower door and building diagnostics at the Public Works building in Kotzebue. Photo courtesy of Renewable Energy Alaska Project.

18 alaska green jobs report
state
employees
The centralized administration of state and federal divisions makes surveying
public sector workers challenging. It’s diffi cult to identify someone with knowledge about workers’ duties. Consequently, the results of a separate survey refl ect reported values from a nonstatistical sampling of state work-ers.
State government employment makes up 8 percent of the total nonfarm workforce in Alaska, and public-sector green occupations are similar to their private-sector counter-parts. Zoologists and wildlife biologists was the highest reported green occupation, and numerous science positions also topped the list of the highest reported occupations.
These reported occupations refl ect a common goal of the public sector, to improve management of public resources. The largest green category among public employees was education, compliance, public aware-ness, and training (47 percent), followed closely by agriculture and natural resource conservation (45 percent), and pollution prevention at 32 percent. (For a list of green jobs in state government, see Appendix Four.)
The state plays a critical role in the management of public goods in general, and common-pool resources in particular. From an economic standpoint, goods and services are deemed public if their consumption is nonrivalrous, nonexcludable, or both. Examples of
THE SEAFOOD INDUSTRY
pure public goods include clean air and water, and the establishment and maintenance of state parks.
Because of the collective ownership of mineral and land rights in Alaska, common-pool resources managed by the state include renewable resources such as timber harvesting and sustainably managed fi sheries, and nonrenewable mining resources.
By nature, common-pool resources are nonexcludable as a result of collective ownership, so must be regu-lated to ensure long term viability. Without sustainably managed extraction, common-pool resources can be rendered nonrenewable through overharvesting. Public sector green workers act as stewards of resources that are not privately owned.
Until Alaska became a state in 1959 and assumed control of its fi sheries, salmon harvests were in decline.
The constitution charges the state and Legislature with en-suring common use and sustainable yield of all its renewable resources. In 1973, the Legislature enacted a limited entry law to create transferable permits to limit seafood harvesting to economically healthy and sustainable levels.
Fish harvesting accounted for 29,981 jobs in 2009, with another 23,661 jobs in seafood processing. The industry brought in a harvest valued at $1.2 billion that same year.
All commercial salmon fi sheries in Alaska are under limited entry, and therefore considered a regulated sustainable industry. However, it is beyond the scope of this report to quantify green jobs within the seafood harvesting industry.

19alaska green jobs report
Occupation
Reported green
employment
Totalreported
employmentPercent
green Categories
of work*
Zoologists and Wildlife Biologists 132 147 90%
Environmental Scientists and Specialists, Including Health 91 104 88%
Civil Engineers 52 130 40%
Conservation Scientists 46 64 72%
Natural Sciences Managers 37 45 82%
Biological Technicians 21 24 88%
Environmental Engineers 16 22 73%
Foresters 15 16 94%
General and Operations Managers 14 26 54%
Urban and Regional Planners 14 20 70% CO2
Social Science Research Assistants 12 25 48%
Maintenance and Repair Workers, General 9 9 100%
Forest and Conservation Technicians 8 16 50%
Environmental Science and Protection Tech-nicians, Including Health 7 8 88%
Economists 6 11 55%
Farmworkers, Farm and Ranch Animals 6 9 67%
Statisticians 5 9 56%
Lawyers 5 12 42%
Engineering Managers 3 4 75%
NineNine Public Sector Employment, State
From left, Reynolds Skan Jr., Andrey Seledkov, and Leo Ortega sort salmon fresh off the boat last August at Alaska Gla-cier Seafoods in Juneau. Photo by Kim Andree, Alaska Depart-ment of Labor and Workforce Development.
Source: Department of Labor and Workforce Development, Research and Analysis Section *See page 5 for icon key.

20 alaska green jobs report
Appendix OneAppendix One Methodology
The Alaska Department of Labor and Workforce Devel-opment mailed the Alaska Green Jobs Survey to se-
lected fi rms in August 2010. The survey asked employers to answer questions about occupations with employment during the pay period that included Aug. 12. The survey deadline was Sept. 15, with submission via mail, FAX, phone, e-mail, or online through MyAlaska.
The survey universe contained 16,513 private-sector and local government establishments within Alaska that had at least one employee covered by the Alaska Unemployment Insurance Program. The Research and Analysis Section stratifi ed the universe into 20 industry groups and two employment size groups, and drew the stratifi ed random sample with probability proportionate to fi rm size.
Following the Sept. 15 deadline, R&A surveyed the nonre-sponders in underreported industries through a secondary mailout. This survey contained only the green category defi nitions and the question, “Do you employ any workers who provide goods or services in any of the green-related categories listed below?” R&A contacted employers who responded “yes” by phone or e-mail to request that they fi ll out the remainder of the survey. This resulted in a signifi -cant increase in the overall survey response rate, which was 61.7 percent. All industry groups’ response rates were greater than 50 percent.
Responses were weighted and benchmarked to prelimi-nary Quarterly Census of Employment and Wages data for the third quarter of 2010. A staffi ng pattern generated for each industry, derived from the Alaska Occupational Database, provided a breakdown of each occupation’s share of the total industry employment. R&A applied these survey results to this data set to generate estimated employment counts across 145 occupations with reported green employment.
The survey collected data on wages, but Research and Analysis omitted these results. Respondents frequently skipped this question, so the data were unreliable.
R&A also targeted state departments that might contain green jobs, and contacted 6,134 state employees us-ing their State of Alaska e-mail addresses on Jan. 20, 2011. The e-mail explained the purpose of the survey and provided a link to complete the survey online. Those who said their occupation was green were asked about the percentage of time they spent on green activities, in which
Sample summaryNumber
of establishments
Population of establishments 16,513Original sample draw 5,110Number of fi rms in sample 4,826
Contacted in sample 3,033
Not reached in sample* 1,793
Reason codeNumber
of establishmentsIn/out of sample
Response 2,979 inRefusal 54 inUndeliverable 249 out
Out of business 15 out
Other 19 out
Response rate
Number of fi rms in sample 4,826Total response 2,979Response rate 61.7%
Response "yes" 375
*Represents employers who received a survey but didn’t respond despite repeated attempts to contact them.
category they performed green work, and what special green skills their occupations required.
The response rate among state employees was 19 percent. Of those who responded, 57 percent said they performed work in one of the green categories.
R&A attempted to survey federal agencies, but the central-ized administration of the federal government made it diffi -cult to contact people who knew about federal employees’ green activities. The accuracy of the small amount of data was questionable, so it was omitted from the report.

21alaska green jobs report
Appen
dix
TWO
Appen
dix
TWO
Su
rvey Instru
men
t

22 alaska green jobs report
Appen
dix
TW
OA
ppen
dix
TW
OS
urv
ey In
stru
men
t, co
nt.

23alaska green jobs report
Appendix THREEAppendix THREE Alaska’s Green Occupations
SOC(2000)1 SOC(2010) SOC titleEstimated green
employment2 Estimated
employment3Green
score 1-104
TOTAL (occupations with green employment) 4,973 140,172111011 111011 Chief Executives 34 1,685 1111021 111021 General and Operations Managers 139 3,780 1112021 112021 Marketing Managers 3 290 1112031 112031 Public Relations Managers 7 152 1113011 113011 Administrative Services Managers 29 1,397 1113031 113031 Financial Managers 4 1,090 1113049 113121 Human Resources Managers, All Other 4 215 1119021 119021 Construction Managers 27 971 1119041 119041 Engineering Managers 8 345 1119051 119051 Food Service Managers 6 463 1119121 119121 Natural Sciences Managers 17 28 3119151 119151 Social and Community Service Managers 7 343 1119199 119199 Managers, All Other 40 2,358 1131023 131023 Purchasing Agents, Except Wholesale, Retail, and Farm Products 3 266 1131051 131051 Cost Estimators 3 144 1131073 131151 Training and Development Specialists 32 156 2131199 131199 Business Operations Specialists, All Other 1 492 1132011 132011 Accountants and Auditors 13 1,438 1132072 132072 Loan Offi cers 2 358 1171011 171011 Architects, Except Landscape and Naval 12 188 1171021 171021 Cartographers and Photogrammetrists 5 57 1172041 172041 Chemical Engineers 40 48 4172051 172051 Civil Engineers 28 573 1172071 172071 Electrical Engineers 32 299 1172081 172081 Environmental Engineers 60 177 3
172111 172111Health and Safety Engineers, Except Mining Safety Engineers and Inspectors 21 233 1
172141 172141 Mechanical Engineers 45 303 1172151 172151 Mining and Geological Engineers, Including Mining Safety Engineers 41 154 1172199 172199 Engineers, All Other 65 1,059 1173019 173019 Drafters, All Other 11 157 1173023 173023 Electrical and Electronic Engineering Technicians 3 216 1173025 173025 Environmental Engineering Technicians 93 253 2173027 173027 Mechanical Engineering Technicians 8 45 1191013 191013 Soil and Plant Scientists * * 2191023 191023 Zoologists and Wildlife Biologists 166 254 7191029 191029 Biological Scientists, All Other 13 84 2191031 191031 Conservation Scientists 23 28 5191032 191032 Foresters * * 5192031 192031 Chemists 2 43 1192032 192032 Materials Scientists * * 9192041 192041 Environmental Scientists and Specialists, Including Health 254 401 4192042 192042 Geoscientists, Except Hydrologists and Geographers 3 279 1193011 193011 Economists * * 2193051 193051 Urban and Regional Planners 5 167 1194021 194021 Biological Technicians 7 59 2194041 194041 Geological and Petroleum Technicians 144 649 3194091 194091 Environmental Science and Protection Technicians, Including Health 158 158 8211021 211021 Child, Family, and School Social Workers 2 559 1211093 211093 Social and Human Service Assistants 2 581 1211099 211099 Community and Social Service Specialists, All Other 3 417 1231011 231011 Lawyers 21 442 1
24 alaska green jobs report
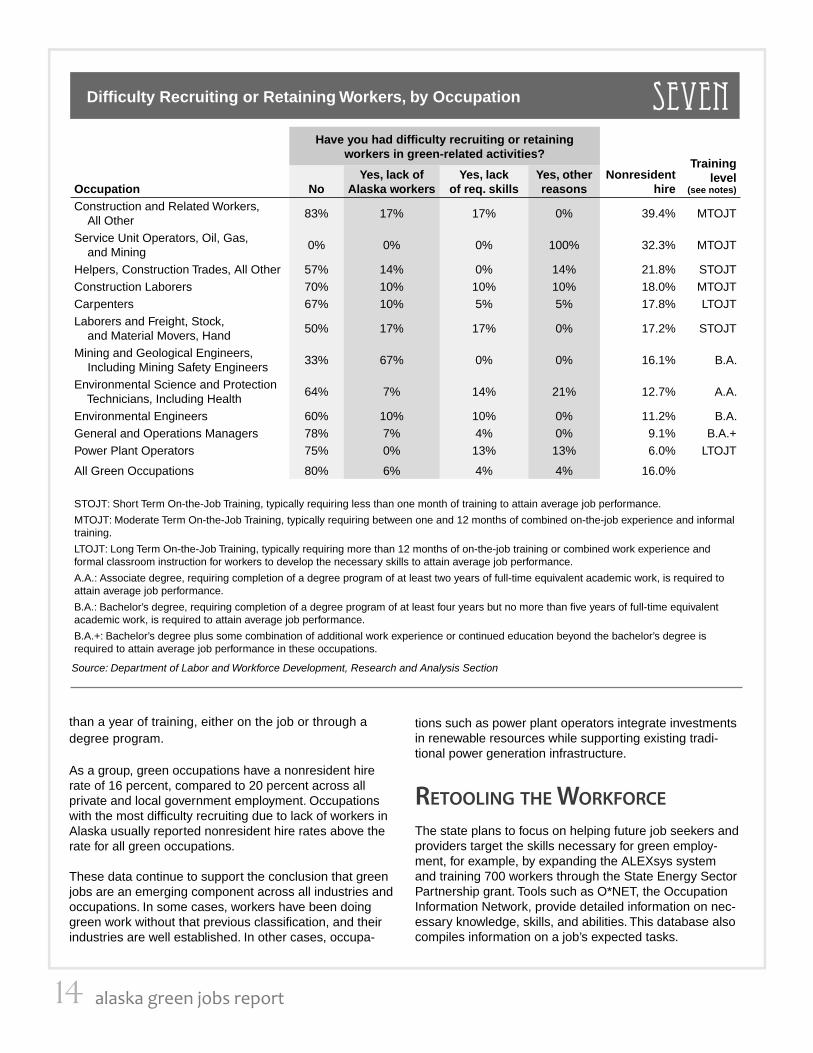
Appendix THREEAppendix THREE Alaska’s Green Occupations, cont.
SOC(2000)1 SOC(2010) SOC titleEstimated green
employment2 Estimated
employment3Green score
1-104
232011 232011 Paralegals and Legal Assistants 14 295 1251053 251053 Environmental Science Teachers, Postsecondary * * 10259021 259021 Farm and Home Management Advisors * * 3259031 259031 Instructional Coordinators 2 273 1271025 271025 Interior Designers 12 37 1352012 352012 Cooks, Institution and Cafeteria 6 686 1352014 352014 Cooks, Restaurant 4 2,185 1
371012 371012First-Line Supervisors/Managers of Landscaping, Lawn Service, and Groundskeeping Workers 13 65 2
372011 372011 Janitors and Cleaners, Except Maids and Housekeeping Cleaners 7 5,230 1372012 372012 Maids and Housekeeping Cleaners 14 3,610 1373011 373011 Landscaping and Groundskeeping Workers 7 801 1373019 373019 Grounds Maintenance Workers, All Other 36 703 1396021 397011 Tour Guides and Escorts 440 1,133 3396022 397012 Travel Guides * * 3411011 411011 First-Line Supervisors/Managers of Retail Sales Workers 10 1,878 1412031 412031 Retail Salespersons 247 11,520 1413099 413099 Sales Representatives, Services, All Other 14 1,267 1
414011 414011Sales Representatives, Wholesale and Manufacturing, Technical and Scientifi c Products 33 304 1
414012 414012Sales Representatives, Wholesale and Manufacturing, Except Tech-nical and Scientifi c Products 5 1,012 1
419031 419031 Sales Engineers 20 45 3419099 419099 Sales and Related Workers, All Other 5 2,108 1
431011 431011First-Line Supervisors/Managers of Offi ce and Administrative Sup-port Workers 3 1,845 1
433031 433031 Bookkeeping, Accounting, and Auditing Clerks 10 4,109 1433061 433061 Procurement Clerks 1 126 1434051 434051 Customer Service Representatives 13 2,630 1434171 434171 Receptionists and Information Clerks 6 3,156 1435061 435061 Production, Planning, and Expediting Clerks 4 381 1435081 435081 Stock Clerks and Order Fillers 10 2,565 1436011 436011 Executive Secretaries and Administrative Assistants 12 3,736 1439061 439061 Offi ce Clerks, General 51 6,236 1439199 439199 Offi ce and Administrative Support Workers, All Other 52 4,604 1
451011 451011First-Line Supervisors/Managers of Farming, Fishing, and Forestry Workers 52 125 3
452092 452092 Farmworkers and Laborers, Crop, Nursery, and Greenhouse 29 411 1452099 452099 Agricultural Workers, All Other 58 246 2453011 453011 Fishers and Related Fishing Workers5 266 605 4454011 454011 Forest and Conservation Workers 5 47 1454021 454021 Fallers 18 106 1454022 454022 Logging Equipment Operators 11 50 2454029 454029 Logging Workers, All Other 20 33 2
471011 471011First-Line Supervisors/Managers of Construction Trades and Extrac-tion Workers 52 1,134 1
472011 472011 Boilermakers 30 44 5472031 472031 Carpenters 275 3,343 1472061 472061 Construction Laborers 212 5,461 1472073 472073 Operating Engineers and Other Construction Equipment Operators 26 3,147 1472081 472081 Drywall and Ceiling Tile Installers 9 202 1472111 472111 Electricians 5 2,362 1472131 472131 Insulation Workers, Floor, Ceiling, and Wall 44 194 1472152 472152 Plumbers, Pipefi tters, and Steamfi tters 20 1,762 1472181 472181 Roofers 111 324 2

25alaska green jobs report
Appendix THREEAppendix THREE Alaska’s Green Occupations, cont.
SOC(2000)1 SOC(2010) SOC titleEstimated green
employment2 Estimated
employment3Green
score 1-104
472211 472211 Sheet Metal Workers 3 424 1473012 473012 Helpers, Carpenters 17 357 1473013 473013 Helpers, Electricians 3 121 1473019 473019 Helpers, Construction Trades, All Other 80 500 2474041 474041 Hazardous Materials Removal Workers 58 327 1474051 474051 Highway Maintenance Workers 5 106 1474099 474099 Construction and Related Workers, All Other 56 729 1475013 475013 Service Unit Operators, Oil, Gas, and Mining 63 660 1475021 475021 Earth Drillers, Except Oil and Gas 2 148 1475071 475071 Roustabouts, Oil and Gas 12 1,668 1491011 491011 First-Line Supervisors/Managers of Mechanics, Installers, and Repairers 2 634 1
492022 492022Telecommunications Equipment Installers and Repairers, Except Line Installers 3 774 1
492094 492094Electrical and Electronics Repairers, Commercial and Industrial Equip-ment 11 201 1
492095 492095 Electrical and Electronics Repairers, Powerhouse, Substation, and Relay 2 108 1493023 493023 Automotive Service Technicians and Mechanics 5 1,610 1493092 493092 Recreational Vehicle Service Technicians 12 48 1499021 499021 Heating, Air Conditioning, and Refrigeration Mechanics and Installers 23 308 1499041 499041 Industrial Machinery Mechanics 7 220 1499051 499051 Electrical Power Line Installers and Repairers 14 400 1499042 499071 Maintenance and Repair Workers, General 47 2,309 1
N/A 499081 Wind Turbine Service Technicians * * 10499098 499098 Helpers, Installation, Maintenance, and Repair Workers 13 781 1499099 499099 Installation, Maintenance, and Repair Workers, All Other 41 1,483 1511011 511011 First-Line Supervisors/Managers of Production and Operating Workers 39 747 1513022 513022 Meat, Poultry, and Fish Cutters and Trimmers 15 7,943 1
514072 514072Molding, Coremaking, and Casting Machine Setters, Operators, and Tenders, Metal and Plastic 14 30 5
514121 514121 Welders, Cutters, Solderers, and Brazers 9 765 1518012 518012 Power Distributors and Dispatchers 17 34 5518013 518013 Power Plant Operators 49 441 1518031 518031 Water and Liquid Waste Treatment Plant and System Operators 22 568 1518099 518099 Plant and System Operators, All Other 12 233 1519032 519032 Cutting and Slicing Machine Setters, Operators, and Tenders 7 71 1519192 519192 Cleaning, Washing, and Metal Pickling Equipment Operators/Tenders * * 8519198 519198 Helpers--Production Workers 6 105 1519199 519199 Production Workers, All Other 24 1,293 1
531031 531031First-Line Supervisors/Managers of Transportation and Material-Moving Machine and Vehicle Operators 2 325 1
533031 533031 Driver/Sales Workers 8 1,063 1535021 535021 Captains, Mates, and Pilots of Water Vessels 12 531 1535031 535031 Ship Engineers 93 208 5537021 537021 Crane and Tower Operators 2 136 1537032 537032 Excavating and Loading Machine and Dragline Operators 3 251 1537051 537051 Industrial Truck and Tractor Operators 43 421 1537062 537062 Laborers and Freight, Stock, and Material Movers, Hand 34 4,459 1537081 537081 Refuse and Recyclable Material Collectors 26 321 1537121 537121 Tank Car, Truck, and Ship Loaders 22 206 1
1 The Standard Occupational Classifi cation (SOC) system is used by federal and state statistical agencies to classify workers and jobs into occupational categories for collecting, calculating, analyzing, or disseminating data.2 Employment is an August 2010 estimate.3 Employment is a third quarter 2010 estimate.4 The green score for an occupation is generated by taking a weighted average of time spent on green activities within a given occupation. The numbers are indexed between 1 and 10, with 10 representing that 100 percent of the occupation’s work is within a green category, 9 representing 90 percent, and so on.5 Excludes most commercial fi shermenNote: All numbers exclude state and federal employment.An asterisk (*) means data are suppressed due to confi dentiality and/or reliability reasons.
Source: Alaska Department of Labor and Workforce Development, Research and Analysis Section

26 alaska green jobs report
Appendix FOURAppendix FOUR Alaska’s Green Occupations, State Government
SOC(2000)1 SOC(2010) SOC titleReported green
employment2 Reported
nongreen3
111011 111011 Chief Executives 1 2111021 111021 General and Operations Managers 14 12111031 111031 Legislators 1 1112021 112021 Marketing Managers 1 0113011 113011 Administrative Services Managers 3 15113031 113031 Financial Managers 2 1113051 113051 Industrial Production Managers 1 0113071 113071 Transportation, Storage, and Distribution Managers 1 6119041 119041 Engineering Managers 3 1119121 119121 Natural Sciences Managers 37 8119141 119141 Property, Real Estate, and Community Association Managers 1 0119151 119151 Social and Community Service Managers 1 2119199 119199 Managers, All Other 5 1131023 131023 Purchasing Agents, Except Wholesale, Retail, and Farm Products 2 5
131041 131041Compliance Offi cers, Except Agriculture, Construction, Health and Safety, and Transportation 2 14
131061 119161 Emergency Management Directors 1 0131199 131121 Business Operations Specialists, All Other 3 3132031 132031 Budget Analysts 1 3132051 132051 Financial Analysts 3 1132072 132072 Loan Offi cers 1 0132099 132099 Financial Specialists, All Other 2 0151021 151131 Computer Programmers 9 5151041 151151 Computer Support Specialists 1 2151071 151142 Network and Computer Systems Administrators 1 3152031 152031 Operations Research Analysts 3 2152041 152041 Statisticians 5 4171021 171021 Cartographers and Photogrammetrists 3 2171022 171022 Surveyors 1 7172051 172051 Civil Engineers 52 78172081 172081 Environmental Engineers 16 6172121 172121 Marine Engineers and Naval Architects 1 3172151 172151 Mining and Geological Engineers, Including Mining Safety Engineers 1 0172171 172171 Petroleum Engineers 3 1173011 173011 Architectural and Civil Drafters 2 7173022 173022 Civil Engineering Technicians 1 1173025 173025 Environmental Engineering Technicians 2 5173029 173029 Engineering Technicians, Except Drafters, All Other 1 4191011 191011 Animal Scientists 2 0191013 191013 Soil and Plant Scientists 3 0191021 191021 Biochemists and Biophysicists 1 0191022 191022 Microbiologists 1 1191023 191023 Zoologists and Wildlife Biologists 132 15191031 191031 Conservation Scientists 46 18191032 191032 Foresters 15 1192031 192031 Chemists 2 1192041 192041 Environmental Scientists and Specialists, Including Health 91 13192042 192042 Geoscientists, Except Hydrologists and Geographers 4 12192043 192043 Hydrologists 2 0193011 193011 Economists 6 5193021 131161 Market Research Analysts 3 1193051 193051 Urban and Regional Planners 14 6193091 193091 Anthropologists and Archeologists 2 2193093 193093 Historians 1 2

27alaska green jobs report
Appendix FOURAppendix FOUR Alaska’s Green Occupations, State Government, cont.
SOC(2000)1 SOC(2010) SOC titleReported green
employment2 Reported
nongreen3
193093 193093 Historians 1 2194021 194021 Biological Technicians 21 3194041 194041 Geological and Petroleum Technicians 2 1194061 194061 Social Science Research Assistants 12 13194091 194091 Environmental Science and Protection Technicians, Including Health 7 1194093 194093 Forest and Conservation Technicians 8 8231011 231011 Lawyers 5 7231021 231021 Administrative Law Judges, Adjudicators, and Hearing Offi cers 1 1232011 232011 Paralegals and Legal Assistants 1 6251031 251031 Architecture Teachers, Postsecondary 1 0251081 251081 Education Teachers, Postsecondary 1 0251194 251194 Vocational Education Teachers, Postsecondary 3 2259041 259041 Teacher Assistants 3 1273031 131161 Market Research Analysts and Marketing Specialists 1 1273031 273031 Public Relations Specialists 1 1273041 273041 Editors 4 5291131 291131 Veterinarians 2 0299011 299011 Occupational Health and Safety Specialists 2 6311011 311011 Home Health Aides 1 0331021 331021 First-Line Supervisors/Managers of Fire Fighting and Prevention Workers 1 0332022 332022 Forest Fire Inspectors and Prevention Specialists 1 0339092 339092 Lifeguards, Ski Patrol, and Other Recreational Protective Service Workers 1 0419021 419021 Real Estate Brokers 4 3419022 419022 Real Estate Sales Agents 2 20431011 431011 First-Line Supervisors/Managers of Offi ce and Administrative Support Workers 3 1433031 433031 Bookkeeping, Accounting, and Auditing Clerks 5 23433061 433061 Procurement Clerks 1 1434171 434171 Receptionists and Information Clerks 5 5435031 435031 Police, Fire, and Ambulance Dispatchers 2 1435081 435081 Stock Clerks and Order Fillers 3 1436011 436011 Executive Secretaries and Administrative Assistants 7 30436012 436012 Legal Secretaries 1 4439061 439061 Offi ce Clerks, General 11 32439111 439111 Statistical Assistants 1 5439199 433099 Offi ce and Administrative Support Workers, All Other 6 3452011 452011 Agricultural Inspectors 1 2452093 452093 Farmworkers, Farm and Ranch Animals 6 3472073 472073 Operating Engineers and Other Construction Equipment Operators 3 19472152 472152 Plumbers, Pipefi tters, and Steamfi tters 1 0474051 474051 Highway Maintenance Workers 2 3499042 499071 Maintenance and Repair Workers, General 9 0
531031 531031First-Line Supervisors/Managers of Transportation and Material-Moving Ma-chine and Vehicle Operators 1 0
535021 535021 Captains, Mates, and Pilots of Water Vessels 1 2
1 The Standard Occupational Classifi cation (SOC) system is used by federal and state statistical agencies to classify workers and jobs into oc-cupational categories for collecting, calculating, analyzing, or disseminating data.2 Number of respondents who said they performed work in at least one of the green categories3 Number of respondents who said they did not perform green work
Source: Alaska Department of Labor and Workforce Development, Research and Analysis Section