Embed Size (px)
Citation preview


ENVIRONMENTAL PROTECTION AGENCYThe Environmental Protection Agency (EPA) is responsible for protecting and improving the environment as a valuable asset for the people of Ireland. We are committed to protecting people and the environment from the harmful effects of radiation and pollution.
The work of the EPA can be divided into three main areas:
Regulation: We implement effective regulation and environmental compliance systems to deliver good environmental outcomes and target those who don’t comply.
Knowledge: We provide high quality, targeted and timely environmental data, information and assessment to inform decision making at all levels.
Advocacy: We work with others to advocate for a clean, productive and well protected environment and for sustainable environmental behaviour.
Our Responsibilities
LicensingWe regulate the following activities so that they do not endanger human health or harm the environment:• waste facilities (e.g. landfills, incinerators, waste transfer
stations);• large scale industrial activities (e.g. pharmaceutical, cement
manufacturing, power plants);• intensive agriculture (e.g. pigs, poultry);• the contained use and controlled release of Genetically
Modified Organisms (GMOs);• sources of ionising radiation (e.g. x-ray and radiotherapy
equipment, industrial sources);• large petrol storage facilities;• waste water discharges;• dumping at sea activities.
National Environmental Enforcement• Conducting an annual programme of audits and inspections of
EPA licensed facilities.• Overseeing local authorities’ environmental protection
responsibilities.• Supervising the supply of drinking water by public water
suppliers.• Working with local authorities and other agencies to tackle
environmental crime by co-ordinating a national enforcement network, targeting offenders and overseeing remediation.
• Enforcing Regulations such as Waste Electrical and Electronic Equipment (WEEE), Restriction of Hazardous Substances (RoHS) and substances that deplete the ozone layer.
• Prosecuting those who flout environmental law and damage the environment.
Water Management• Monitoring and reporting on the quality of rivers, lakes,
transitional and coastal waters of Ireland and groundwaters; measuring water levels and river flows.
• National coordination and oversight of the Water Framework Directive.
• Monitoring and reporting on Bathing Water Quality.
Monitoring, Analysing and Reporting on the Environment• Monitoring air quality and implementing the EU Clean Air for
Europe (CAFÉ) Directive.• Independent reporting to inform decision making by national
and local government (e.g. periodic reporting on the State of Ireland’s Environment and Indicator Reports).
Regulating Ireland’s Greenhouse Gas Emissions• Preparing Ireland’s greenhouse gas inventories and projections.• Implementing the Emissions Trading Directive, for over 100 of
the largest producers of carbon dioxide in Ireland.
Environmental Research and Development• Funding environmental research to identify pressures, inform
policy and provide solutions in the areas of climate, water and sustainability.
Strategic Environmental Assessment• Assessing the impact of proposed plans and programmes on the
Irish environment (e.g. major development plans).
Radiological Protection• Monitoring radiation levels, assessing exposure of people in
Ireland to ionising radiation.• Assisting in developing national plans for emergencies arising
from nuclear accidents.• Monitoring developments abroad relating to nuclear
installations and radiological safety.• Providing, or overseeing the provision of, specialist radiation
protection services.
Guidance, Accessible Information and Education• Providing advice and guidance to industry and the public on
environmental and radiological protection topics.• Providing timely and easily accessible environmental
information to encourage public participation in environmental decision-making (e.g. My Local Environment, Radon Maps).
• Advising Government on matters relating to radiological safety and emergency response.
• Developing a National Hazardous Waste Management Plan to prevent and manage hazardous waste.
Awareness Raising and Behavioural Change• Generating greater environmental awareness and influencing
positive behavioural change by supporting businesses, communities and householders to become more resource efficient.
• Promoting radon testing in homes and workplaces and encouraging remediation where necessary.
Management and structure of the EPAThe EPA is managed by a full time Board, consisting of a Director General and five Directors. The work is carried out across five Offices:• Office of Environmental Sustainability• Office of Environmental Enforcement• Office of Evidence and Assessment• Office of Radiological Protection• Office of Communications and Corporate ServicesThe EPA is assisted by an Advisory Committee of twelve members who meet regularly to discuss issues of concern and provide advice to the Board.

i
Published by
Environmental Protection Agency
An Ghníomhaireacht um Chaomhnú Comhshaoil
PO Box 3000
Johnstown Castle Estate
County Wexford, Ireland
Telephone: +353 53 9160600
Lo Call: 1890 33 55 99
Fax: +353 53 9160699
Email: [email protected]
Web site: www.epa.ie
ISBN: 978-1-84095-749-5
© Environmental Protection Agency 2016
Although every effort has been made to ensure the accuracy of the material contained in this publication, complete
accuracy cannot be guaranteed. Neither the Environmental Protection Agency nor the author(s) accept any
responsibility whatsoever for loss or damage occasioned or claimed to have been occasioned, in part or in full, as
a consequence of any person acting or refraining from acting, as a result of a matter contained in this publication.
Parts of this publication may be reproduced without further permission, provided the source is acknowledged.

Air Quality in Ireland 2016
ii
Contents
Contents ..................................................................................................................................... ii
Figures ....................................................................................................................................... iv
Acknowledgements .................................................................................................................... v
Glossary ..................................................................................................................................... vi
Executive Summary .................................................................................................................... 1
1 Introduction ....................................................................................................................... 3
Air quality monitoring network in Ireland in 2016 ...................................................... 3
Air quality zones in Ireland in 2016 ............................................................................. 4
National Ambient Air Quality Monitoring Programme (AAMP) ................................. 5
National monitoring network .............................................................................. 5
Modelling and forecasting ................................................................................... 5
Citizen engagement ............................................................................................. 6
2 Air Quality Monitoring Results 2016.................................................................................. 7
Nitrogen dioxide (NO2) ................................................................................................ 7
Sulphur dioxide (SO2) .................................................................................................. 8
Carbon monoxide (CO) ................................................................................................ 8
Ozone (O3) ................................................................................................................... 9
Particulate matter (PM10) .......................................................................................... 10
Particulate matter (PM2.5) ......................................................................................... 11
Benzene ..................................................................................................................... 12
Heavy metals – Lead (Pb), Cadmium (Cd), Arsenic (As) and Nickel (Ni) ................... 12
Polycyclic aromatic hydrocarbons (PAHs) ................................................................. 14
Mercury (Hg) .......................................................................................................... 15
Dioxins ................................................................................................................... 15
Radon ..................................................................................................................... 17
3 Air Quality Trends in Ireland ............................................................................................ 18
Nitrogen dioxide (NO2) .............................................................................................. 18
Sulphur dioxide (SO2) ................................................................................................ 18

Air Quality in Ireland 2016
iii
Carbon monoxide (CO) .............................................................................................. 19
Ozone (O3) ................................................................................................................. 19
Particulate matter (PM10) .......................................................................................... 20
Particulate matter (PM2.5) ......................................................................................... 21
Benzene ..................................................................................................................... 21
Heavy metals (As, Cd, Pb and Ni) .............................................................................. 22
Polycyclic aromatic hydrocarbons (PAHs) ................................................................. 23
4 Air Quality Information .................................................................................................... 25
EPA air quality website .............................................................................................. 25
Air Quality Index for Health ...................................................................................... 25
@EPAAirquality ......................................................................................................... 26
5 Conclusions ...................................................................................................................... 27
Appendix A: Legislation and Policy .......................................................................................... 29
Environmental Protection Agency ....................................................................................... 29
EU legislation........................................................................................................................ 29
World Health Organisation air quality guidelines ................................................................ 30
Appendix B: Dioxin survey ....................................................................................................... 31
References ............................................................................................................................... 34

Air Quality in Ireland 2016
iv
Figures
Figure 2.1 Annual mean NO2 concentrations at individual monitoring stations in 2016 .......... 7
Figure 2.2 Daily maximum concentrations for SO2 at individual monitoring stations in 2016 . 8
Figure 2.3 Max 8‐hour mean CO Concentrations at individual stations in 2016....................... 9
Figure 2.4 8‐hour daily maximum ozone concentrations at individual stations in 2016 ........ 10
Figure 2.5 Annual mean PM10 concentrations at individual stations in 2016 ......................... 11
Figure 2.6 Annual mean PM2.5 concentrations at individual stations in 2016 ........................ 12
Figure 2.7 Annual mean benzene concentrations at individual stations in 2016 ................... 12
Figure 2.8 Lead concentrations at individual stations in Ireland in 2016 ................................ 13
Figure 2.9 Arsenic concentrations at individual stations in Ireland in 2016 ........................... 13
Figure 2.10 Cadmium concentrations at individual stations in Ireland in 2016 ...................... 14
Figure 2.11 Nickel concentrations at individual stations in Ireland in 2016............................ 14
Figure 2.12 Annual mean values for PAH (BaP) at individual stations in Ireland in 2016 ....... 15
Figure 2.13 Dioxins/Furans and PCBs 2016 data compared with 2000‐2016 averages .......... 16
Figure 2.14 Dioxins/Furans 2016 Data Compared with 2000‐2016 Averages ......................... 16
Figure 3.1 Trend in NO2 concentrations for zones in Ireland 2006 ‐ 2016 .............................. 18
Figure 3.2 Trend in SO2 concentrations for zones in Ireland 2006 – 2016 .............................. 19
Figure 3.3 Trend in maximum daily 8‐hour mean for Dublin and Cork 2006 – 2016 .............. 19
Figure 3.4 Ozone AOT40 at rural background stations in Ireland 2006 – 2016 ...................... 20
Figure 3.5 Annual mean PM10 concentrations in Zone A in Ireland 2006 – 2016 ................... 20
Figure 3.8 Annual mean PM2.5 concentrations at individual stations in Ireland 2009 – 2016 21
Figure 3.9 Annual mean benzene concentrations at individual stations in Ireland 2006 ‐ 2016
.................................................................................................................................................. 21
Figure 3.10 Annual mean lead concentrations 2009 ‐ 2016 .................................................... 22
Figure 3.11 Annual mean arsenic concentrations 2009 – 2016 .............................................. 22
Figure 3.12 Annual mean cadmium concentrations 2009 – 2016 ........................................... 23
Figure 3.13 Annual mean nickel concentrations 2009 – 2016 ................................................ 23
Figure 3.14 Annual mean BaP concentrations at individual stations in Ireland 2009 ‐ 2016 .. 24
Figure 4.1 The Air Quality Index for Health ............................................................................. 26

Air Quality in Ireland 2016
v
Acknowledgements
The author wishes to acknowledge the contributions of his colleagues, Kevin Delaney, Patrick
Malone, Lin Delaney, Cathal Ruane, Patrick Kenny and Ciara McMahon in the National
Ambient Air Quality Programme and Colman Concannon in the Office of Radiation Protection
and Environmental Monitoring. Additional support in monitoring and analysis is provided by
EPA staff in Dublin, Castlebar, Monaghan, Mallow and Limerick with support in data collection
and reporting from colleagues in the Environmental Research Centre, Air Cross Office Team,
IT and GIS teams. The input of personnel from local authorities, the Health Service Executive,
Met Éireann and NUI Galway and others who provided data for inclusion in this report is also
acknowledged

Air Quality in Ireland 2016
vi
Glossary
> Greater than
AOT40 This is a measure of the overall exposure of plants to ozone. It is the sum of the excess hourly concentrations greater than 80 µg/m3 and is expressed as ug/m3 hours. Only values measured between 08:00 and 20:00 Central European Time each day from May to July are used for the calculation. (The name AOT40 refers to 40ppb which is the same as 80 µg/m3)
As Arsenic
AEI Average exposure indicator
Assessment Threshold Concentration at which varying levels of monitoring must be implemented
Cd Cadmium
CAFE Clean Air for Europe Directive (2008/50/EC)
CEC Council of the European Communities
C6H6 Benzene
CLRTAP Convention on Long‐Range Transboundary Air Pollution
CO Carbon monoxide
DECLG Department of Environment, Community and Local Government
EC European Commission
EC/OC Elemental carbon/organic carbon
EMEP European Monitoring and Evaluation Programme
EPA Environmental Protection Agency
EU European Union
Hg Mercury
LAT Lower assessment threshold
Limit value Level to be attained and not exceeded
mg/m3 Milligrammes per cubic metre
na Not applicable
ng/m3 Nanogrammes per cubic metre
NH3 Ammonia
Ni Nickel
NO Nitric oxide

Air Quality in Ireland 2016
vii
NO2 Nitrogen dioxide
NOx Oxides of nitrogen
O3 Ozone
PAH Polycyclic aromatic hydrocarbon
Pb Lead
PM10 Particulate matter with diameter < 10 µm
PM2.5 Particulate matter with diameter < 2.5 µm
ppb Parts per billion
SO2 Sulphur dioxide
Target value Level to be attained where possible over a given period
Troposphere Region of the atmosphere from ground level to ~10‐15 kilometres
Stratosphere Region of the atmosphere from ~15 kilometres to 50 kilometres
VOCs Volatile organic compounds
yr year
UAT Upper assessment threshold
µm Micron
µg/m3 Microgrammes per cubic metre
µg/m3.h Microgrammes per cubic metre hours
µg/m2/day Microgrammes per square metre per day
Zone A Dublin
Zone B Cork
Zone C Galway, Limerick, Waterford, Clonmel, Kilkenny, Sligo, Drogheda, Wexford, Athlone, Bray, Carlow, Dundalk, Ennis, Naas, Tralee, Celbridge, Letterkenny, Mullingar, Navan, Newbridge, Portlaoise, Greystones and Leixlip.
Zone D Remainder of State (excluding Zones A, B and C)

1
Executive Summary
Air Quality in Ireland 2016
During 2016 ambient air was monitored at 30 stations in Ireland. Data collected from these
stations was assessed against legislative and target values for the protection of health and
vegetation/ecosystems. Concentrations observed were also compared to the World Health
Organisation (WHO) air quality guideline values (EEA estimated reference level used for PAH).
Report highlights include:
No levels above the EU limit value were recorded at any of the ambient air quality
network monitoring sites in Ireland in 2016.
WHO guideline values were exceeded at a number of monitoring sites for particulate
matter (PM10 and PM2.5), ozone, SO2 and NO2:
the PM10 24hr guideline was exceeded at 11 monitoring sites
the PM2.5 24hr guideline was exceeded at 9 monitoring sites and the annual
guideline at 2 monitoring sites
the Ozone guideline was exceeded at 7 monitoring sites
the SO2 24hr guideline was exceeded at 2 monitoring sites
the NO2 1hr guideline was exceeded at 1 monitoring site
EEA reference levels were exceeded as follows:
the PAH at 4 reference level was exceeded monitoring sites
2016 dioxin survey shows that concentrations of dioxins and similar pollutants remain
at a consistently low level in the Irish environment
Challenges
Maintaining our standard of air quality in Ireland is a growing challenge. Overcoming this
challenge is taking on an increased importance with the further understanding of the links
between poor air quality and human health. The European Environment Agency (EEA) have

Air Quality in Ireland 2016
2
estimated a figure of 1,510 premature deaths in Ireland in 2014 (EEA 2017) directly
attributable to air quality, with the predominant culprit being fine particulate matter (PM2.5)
from the use of solid fuels such as wood, coal and peat for home heating. It is becoming
increasingly apparent that there is no safe level of air pollution, a position that is held by the
WHO and is reflected in their much stricter (than EU limit values) air quality guideline values.
The clear benefits in terms of health improvements of reducing the people’s exposure to poor
air quality is also supported by significant economic savings in doing so. This is highlighted by
the OECD report on the economic cost of air pollution (OECD 2016).
Solutions
The implementation of the new Ambient Air Quality Monitoring Programme (AAMP) by the
EPA will be key to tackling the issues surrounding air quality in Ireland. The two key sectors
that predominantly impact negatively on air quality are residential heating and transport. The
AAMP seeks to address these key issues by firstly informing the public on the status of air
quality in Ireland. This will be achieved through an expansion of the monitoring network with
a greater emphasis on provision of real‐time particulate matter levels. In conjunction with
this network expansion, the AAMP will implement a programme of citizen engagement which
will be used to highlight the links between air quality, health and the actions or clean air
choices that can be taken by citizens to directly impact and improve their local air quality.
Namely these are ‐
Any shift from the burning of solid fuel to cleaner, more energy efficient methods of
home heating which will result in cleaner air quality for the consumer, their family and
neighbours with a resultant improvement in their health.
A transition in our modes of transport away from the use of the private diesel and petrol
powered motor cars to alternative modes of transport such as walking, cycling and forms of
transport that are environmentally friendly and sustainable such as electric motor powered
vehicles. This is especially important in our at‐risk urban environments.
To incentivise and compliment these behavioural changes in the public it is imperative that
Ireland adopts policy solutions that can marry the twin issues of ambient air quality and
climate change mitigation. The government’s ‘Clean Air Strategy’ which is due for publication
should point the way forward in terms of policy solutions for Ireland in this regard.

Air Quality in Ireland 2016
3
1 Introduction
This report provides an overview of the ambient air quality in Ireland in 2016. It is based on
monitoring data from 30 stations across Ireland. The measured concentrations are compared
with both EU legislative standards and WHO air quality guidelines for a range of air pollutants
(Appendix 1 provides an introduction to these standards).
Air quality monitoring network in Ireland in 2016
There was one new station added to the network in 2016 with the establishment of
Bishopstown CIT in Cork, while two stations closed in 2016, St. Anne’s Park and Davitt Road,
both in Dublin.
Figure 1.1 Air quality monitoring sites in Ireland in 2016

Air Quality in Ireland 2016
4
Air quality zones in Ireland in 2016
EU legislation on air quality requires that Member States divide their territory into zones for
the assessment and management of air quality. These zones are designated to take account
of population counts from the 2011 CSO Census. The zones in place in Ireland in 2016 are
shown in Figure 1.2. Zone A is the Dublin conurbation; Zone B is the Cork conurbation with
Zone C comprising 23 large towns in Ireland with a population >15,000. Zone D is the
remaining area of Ireland.
The air quality in each zone is assessed and classified with respect to upper and lower
assessment thresholds based on measurements over the previous five years. Upper and lower
assessment thresholds are prescribed in the legislation for each pollutant. The number of
monitoring locations required is dependent on population size and whether ambient air
quality concentrations exceed the upper assessment threshold, are between the upper and
lower assessment thresholds, or are below the lower assessment threshold.
Figure 1.2 Air quality zones in Ireland in 2016

Air Quality in Ireland 2016
5
National Ambient Air Quality Monitoring Programme (AAMP)
Following a comprehensive review of the current status of ambient air quality monitoring in
Ireland, a new national ambient air quality monitoring programme under Section 65 of the
EPA Act, will strengthen the capacity and capability to provide more comprehensive, localised
air quality information linked to public health advice. This programme was issued for public
consultation during 2016.
The new programme will involve a greatly expanded national monitoring network providing
enhanced real‐time information to the public, supplemented by an additional increased local
authority capacity to conduct ‘local’ air monitoring. The network will be supported and
augmented by increased modelling and forecasting capability, with the aim of providing an
ongoing air quality forecast to the public. Supporting both elements will be citizen
engagement and citizen science initiatives to encourage greater understanding and
involvement of the public in air quality issues. The AAMP is built around three key pillars:
National monitoring network
A new national monitoring network will be established which will provide improved spatial
coverage across rural and urban centres. The siting of the stations will be based on the criteria
of population size, vulnerability to air quality issues and spatial distribution. The network of
sites will monitor a range of important air quality parameters including particulates, heavy
metals, inorganic and organic gases.
Modelling and forecasting
There is an increasing awareness of the need for Ireland to develop its capacity and capability in ambient air quality modelling. This proposal aims to provide, on a phased basis, the following modelling capability:
General ambient air quality modelling at urban and regional scales
Ambient air quality forecast modelling
Incident response/ point source modelling in relation to ambient air quality incidents
Ambient air quality modelling as proposed here will enable the provision of information for locations between monitoring stations and provide source identification information. It will also allow scenarios to be modelled to inform general air quality policy development and assist in forming air quality plans. Modelling will also pave the way for the provision for the first time in Ireland, of an operational air quality forecast model. An ambient air quality forecast will inform the public in advance of the predicted air quality and enable choices to be made regarding work and leisure activities; this is particularly important for those who are vulnerable from a health perspective.

Air Quality in Ireland 2016
6
Citizen engagement
Air quality related citizen engagement and citizen science will be progressed to raise
awareness and understanding of air quality issues and encourage individual participation in
improving air quality as follows:
A programme of citizen engagement initiatives in partnership with key
stakeholders to include for example: programmes to support interaction with
schools.
Developing opportunities for citizen science activities.

Air Quality in Ireland 2016
7
2 Air Quality Monitoring Results 2016
This Chapter presents the monitoring data obtained for 2016 in the ambient air quality
monitoring network and the results of the 2016 dioxin survey. The EPA’s air quality webpage
(http://www.epa.ie/air/quality/reports/aqsupp) provides more detailed data, with summary
statistics for the air quality data collected from the ambient air quality monitoring network
as well as the full dioxin survey report. Details of the European Monitoring and Evaluation
Programme (EMEP) network, which provides data on transboundary air pollution, are also
provided on the webpage.
The air quality data measured are compared to the relevant EU legislative limits and target
values, as well as the WHO air quality guideline values. Further information on the legislation
and WHO guidelines are outlined in Appendix A: Legislation and Policy.
Nitrogen dioxide (NO2)
NOX refers to the two pollutants: nitric oxide (NO) and nitrogen dioxide (NO2). They are
produced during combustion at high temperatures with the main sources in Ireland coming
from vehicles and power stations.
Short‐term exposure to NO2 is linked to adverse respiratory effects including airway
inflammation in healthy people and increased respiratory symptoms in asthmatics. Long‐term
exposure is associated with increased risk of respiratory infection in children. NOX is a major
precursor in the formation of ground level ozone. It is also a major precursor in the formation
of photochemical ‘smog’. NOX, along with SO2, also contributes to acidic deposition. NO2 was
monitored at 14 sites in 2016. The results are compared to the EU annual limit value and the
WHO air quality guideline value in Figure 2.1.
Figure 2.1 Annual mean NO2 concentrations at individual monitoring stations in 2016

Air Quality in Ireland 2016
8
The NO2 concentrations at all monitoring sites were below the EU annual limit value and WHO
annual air quality guideline value, both of which are 40 µg/m3. There were also no
exceedances of the EU NO2 hourly limit value (no more than 18 hours above 200 µg/m3 in a
calendar year at individual monitoring sites). There was one hourly average above 200 µg/m3
at one station in 2016, this is above the hourly WHO air quality guideline.
Sulphur dioxide (SO2)
SO2 is a gas which is formed when sulphur containing fuels (mainly coal and oil) are burned in
power stations, domestically, and elsewhere. Volcanic eruptions are the predominant natural
source of sulphur dioxide.
Impacts of high concentrations of SO2 include temporary breathing difficulties for those who
suffer from respiratory conditions such as asthma. Longer‐term exposure to high SO2
concentrations can aggravate existing cardiovascular disease and respiratory illness.
SO2 was monitored at 11 sites in 2016. The results are compared to the EU annual limit value
and the WHO air quality guideline value in Figure 2.2. While no exceedances of the EU daily
limit value were recorded in 2016, SO2 concentrations were above the WHO air quality
guideline value at two sites in 2016.
Figure 2.2 Daily maximum concentrations for SO2 at individual monitoring stations in 2016
There were also no exceedances of the EU one hour limit value (no more than 24 hours > 350
µg/m3 in a calendar year at individual monitoring sites).
Carbon monoxide (CO)
Carbon monoxide is a colourless gas, formed from incomplete oxidation during combustion
of fuel. Sources of CO in Ireland are mainly from automobiles, although tobacco smoke and
poorly adjusted and maintained combustion devices, such as boilers, contribute also. CO
concentrations tend to be higher in areas with heavy traffic congestion.

Air Quality in Ireland 2016
9
CO enters the bloodstream through the lungs where it impairs oxygen delivery to the body’s
organs and tissue. The health impact of CO concentrations that may be found in ambient air
is most serious for those who suffer from cardiovascular diseases such as angina. It may
induce fatigue in healthy people. At higher concentrations not normally found in ambient air,
CO is poisonous causing impaired vision and coordination, headaches, dizziness, confusion,
nausea and death.
CO was monitored at 5 locations in 2016. All concentrations were below the EU limit value
and WHO air quality guideline value (maximum daily 8‐hour mean not to exceed 10 mg/m3 at
individual stations).
Figure 2.3 Max 8‐hour mean CO Concentrations at individual stations in 2016
Ozone (O3)
Ozone is formed as a secondary pollutant in the troposphere from the chemical reaction of
NOX, CO and volatile organic compounds (VOCs) in the presence of sunlight. Ozone can also
be present in the troposphere due to downward flux from the ozone‐rich stratosphere, where
it occurs naturally and has an important role in absorbing harmful UV radiation. Ozone is
readily transported from Atlantic and European regions due to the natural movement of air
masses. Ground‐level ozone is depleted through reactions with traffic‐emitted pollutants;
therefore, levels of ozone are higher in rural areas than in urban areas.
Ozone irritates the eyes, nose, throat and lungs. It can destroy throat and lung tissue leading
to decrease in lung function and respiratory symptoms such as coughing, shortness of breath,
aggravated asthma and other lung diseases. It can lead to premature mortality.
Ozone was monitored at 12 sites in 2016. All observed concentrations were below the EU
limit value. This daily, 8‐hour maximum, limit must not be exceeded on more than 25 days in
the calendar year at individual sites. It was exceeded on one day at two sites in 2016.

Air Quality in Ireland 2016
10
Concentrations at seven monitoring sites were above the WHO air quality guideline value for
ozone in 2016. This guideline value is exceeded if any maximum 8‐hour concentration at a
monitoring site exceeds 100 µg/m3.
Figure 2.4 8‐hour daily maximum ozone concentrations at individual stations in 2016
Particulate matter (PM10)
PM10 are particles with diameters of 10 μm or less. These particles can consist of direct
emissions such as dust, emissions from combustion engines, from the burning of solid fuels
or natural sources such as windblown salt, plant spores and pollens. These direct emissions
are known as primary PM10. PM10 can also be produced indirectly by formation of aerosols
through reactions of other pollutants such as NOX and SO2; these are known as secondary
PM10. In Ireland, the main sources are solid fuel burning and vehicular traffic.
The health impacts of particulate matter relate to its ability to penetrate deep into the
respiratory tract. This inhalation can increase the risk, frequency and severity of
cardiopulmonary and respiratory disorders. It is particularly harmful for those who have a
pre‐existing respiratory illness. It also has a strong association with circulatory disease and
mortality.
PM10 was monitored at 17 sites in 2016. All observed concentrations were below the EU
annual limit value (annual mean concentrations at individual monitoring stations must not
exceed 40 µg/m3). There were also no exceedances of the EU daily limit value (no more than
35 days > 50 µg/m3 at individual stations) Concentrations were also below the annual WHO
air quality guideline value of 20 µg/m3 (annual mean). However, 11 sites were above the daily
WHO air quality guideline value (which states there should be no daily average value above
50 µg/m3).

Air Quality in Ireland 2016
11
Figure 2.5 Annual mean PM10 concentrations at individual stations in 2016
Particulate matter (PM2.5)
PM2.5 or ‘fine’ particulate matter is particle pollution made of a mixture of solids and liquids
of size 2.5 μm or less. It is composed of a number of varying components depending on its
source. These can include acids such as nitrates and sulphates, VOCs, metals, and soil or dust
particles. This PM2.5 can be emitted directly into the atmosphere or can be formed
secondarily. For example, sulphate particles are formed by the chemical reaction of SO2 in the
atmosphere after its release from power plants or industrial facilities. The dominant source
of PM2.5 is domestic solid fuel combustion. PM2.5 is considered a better indicator of man‐made
particulate matter than PM10.
PM2.5 was monitored at nine sites in 2016. All observed concentrations were below the EU
annual limit value of 25 µg/m3. Concentrations were above the annual WHO air quality
guideline value of 10 µg/m3 at two monitoring stations in 2016. All nine monitoring stations
had exceedances of the daily WHO air quality guideline value (which states there should be
no daily average value above 25 µg/m3).

Air Quality in Ireland 2016
12
Figure 2.6 Annual mean PM2.5 concentrations at individual stations in 2016
Benzene
Acute (short‐term) inhalation exposure of humans to benzene may cause drowsiness,
dizziness, headaches, as well as eye, skin, and respiratory tract irritation and, at high levels,
unconsciousness. Chronic (long‐term) inhalation exposure has caused various disorders in the
blood, including reduced numbers of red blood cells and aplastic anaemia, in occupational
settings. Increased incidences of disease have been observed in humans occupationally
exposed to high levels of benzene, although this level of exposure is unlikely in ambient air.
Figure 2.7 Annual mean benzene concentrations at individual stations in 2016
Heavy metals – Lead (Pb), Cadmium (Cd), Arsenic (As) and Nickel (Ni)
Short‐term exposure to these heavy metals can cause irritation of the respiratory system,
which can lead to laryngitis, bronchitis or rhinitis. Long‐term exposure can cause irritation to

Air Quality in Ireland 2016
13
the respiratory tract and cardiovascular and neurological effects, asthma, chronic bronchitis,
emphysema, reduced vital capacity, and lung and nasal cancers. Lead interferes with a variety
of biological processes and is toxic to many organs and tissues. It is particularly damaging to
the brain and causes neurological impairments such as seizures, mental retardation and
behavioural disorders. Levels of lead tend to be low in Ireland. Lead, arsenic, cadmium and
nickel in PM10 were measured at five stations in 2016. The annual mean concentrations
measured at all stations were all below the respective target or limit values. Figure 2.8, Figure
2.9, Figure 2.10 and Figure 2.11 show the annual mean lead, arsenic, cadmium and nickel
concentrations, respectively, at the five monitoring sites in 2016.
Figure 2.8 Lead concentrations at individual stations in Ireland in 2016
Figure 2.9 Arsenic concentrations at individual stations in Ireland in 2016

Air Quality in Ireland 2016
14
Figure 2.10 Cadmium concentrations at individual stations in Ireland in 2016
Figure 2.11 Nickel concentrations at individual stations in Ireland in 2016
Polycyclic aromatic hydrocarbons (PAHs)
Short‐term exposure to high levels of PAHs may cause eye irritation, nausea, diarrhoea,
vomiting and confusion, although high concentrations are unlikely to be found in ambient air.
The chronic or long‐term effects of exposure to low levels of PAHs may include cataracts,
kidney and liver damage and jaundice. Many PAHs have also been identified as carcinogenic
with airborne PAHs most likely to cause lung cancer. PAHs are monitored in Ireland as part of
a PM10 fraction by using Benzo(a)Pyrene (BaP) as a marker for all PAHs. PAH are emitted
domestically from the combustion of solid fuels, such as coal, wood and peat. They can also
be emitted from incomplete combustion of fuel in vehicles. Waste burning or ‘backyard
burning’ and bonfires are a source of PAH as is cigarette smoke.

Air Quality in Ireland 2016
15
PAHs were monitored at five locations in Ireland in 2016. Annual mean concentrations were
below the EU limit value but were above the European Environment Agency (EEA) air quality
estimated reference level at four of the five monitoring sites.
Figure 2.12 Annual mean values for PAH (BaP) at individual stations in Ireland in 2016
Mercury (Hg)
Mercury exposure at high levels can harm the brain, heart, kidneys, lungs and immune system
of people of all ages. It is harmful to the developing nervous system of unborn babies and
young children.
Mercury was measured at Mace Head in Galway in 2016. An annual average concentration of
1.25 ng/m3 was measured.
There is no EU limit value, target value or WHO target value for Mercury in ambient, however
this concentration is low and is in line with previous concentrations observed in Ireland.
Dioxins "Dioxins" is a collective term for the category of 75 polychlorinated dibenzo‐para‐dioxin compounds (PCDDs) and 135 polychlorinated dibenzofuran compounds (PCDFs). These compounds or congeners are not formed for specific purposes but arise mainly as unintentional by‐products of incomplete or poorly controlled combustion and from certain chemical processes. Dioxins are highly toxic and can cause reproductive and developmental problems, damage the immune system, interfere with hormones and may also cause cancer. Direct measurement for dioxins in ambient air is extremely difficult and no limits have been set by the EU for levels in air. The most appropriate method for assessing dioxin exposure in the air is to sample dioxin levels in cows’ milk samples taken during the grazing season. The levels measured were compared to the EU limit values for dioxin levels in milk and the EU limit value for the combination of dioxins and PCBs.

Air Quality in Ireland 2016
16
Results from the Dioxins in milk survey 2016 are presented in Figure 2.13 and Figure 2.14 with
a comparison to the mean values for the period 2000 ‐ 2016. As can be seen from these graphs
concentrations of dioxins and similar pollutants remain at a consistently low level in the Irish
environment. Although sample B2 appears higher, it is only a reflection of the very low values
of other samples and sample B2 is well below the limit value. A comparison with unvalidated
2017 results for sample B2 show concentrations at background levels and in line with other
survey locations. The locations and location codes for the dioxin survey are presented in
Appendix B: Dioxin survey. The full report can be found on our website at
www.epa.ie/air/quality/reports/aqsupp.
Figure 2.13 Dioxins/Furans and PCBs 2016 data compared with 2000‐2016 averages
Figure 2.14 Dioxins/Furans 2016 Data Compared with 2000‐2016 Averages

Air Quality in Ireland 2016
17
Radon Radon is a radioactive, colourless, odourless and tasteless gas. The greatest health risk from
radiation in Ireland is caused by radon. It accounts for more than half of the total radiation
dose received by the Irish population. As a known carcinogen, in the same category as tobacco
smoke and asbestos as causes of lung cancer. Up to 250 cases of lung cancer in Ireland every
year can be linked to radon. Outside radon is diluted to very low levels. Radon can enter a
building from the ground through small cracks in floors and through gaps around pipes or
cables. Homes in some parts of the country are more likely to have a radon problem. The
estimated 250 lung cancer cases are principally associated with exposure to radon in the
home, but exposure in the workplace is also a contributor.
Certain areas of the country are more likely to have a high number of homes with excessive
levels of radon and these areas are known as High Radon Areas. They can be found on our
radon map of Ireland ‐ www.epa.ie/radiation/radonmap.

Air Quality in Ireland 2016
18
3 Air Quality Trends in Ireland
This chapter looks at key trends for air pollutants in the last ten years in Ireland.
Nitrogen dioxide (NO2)
Figure 3.1 shows annual mean NO2 concentrations at monitoring stations from each zone in
Ireland from 2006 to 2016. NO2 has shown a slight downward trend in this period, however it
must be noted that concentrations at urban areas in Ireland are close to the EU annual limit
value, increases in traffic numbers or certain weather conditions unfavourable to dispersion
of pollutants could result in exceedances of the limit value.
Figure 3.1 Trend in NO2 concentrations for zones in Ireland 2006 ‐ 2016
Sulphur dioxide (SO2)
Figure 3.2 shows annual mean SO2 concentrations for zones in Ireland from 2006 to 2016. SO2
concentrations have remained low in this period.

Air Quality in Ireland 2016
19
Figure 3.2 Trend in SO2 concentrations for zones in Ireland 2006 – 2016
Carbon monoxide (CO)
Figure 3.3 shows maximum daily 8‐hour mean values of CO for monitoring stations in Cork
and Dublin from 2006 to 2016. CO concentrations have remained low with a slight downwards
trend in that period.
Figure 3.3 Trend in maximum daily 8‐hour mean for Dublin and Cork 2006 – 2016
Ozone (O3)
The AOT40 is an indicator of exposure of vegetation to ozone during the growing season,
when vegetation is more susceptible to damage from pollutants. Figure 3.4 shows the AOT40
for five rural background stations for the years 2005‐2015.Rural background stations are

Air Quality in Ireland 2016
20
classified as remote, regional or near‐city depending on their proximity to urban areas. Ozone
levels are higher in remote regions and tend to be highest along the western seaboard
(indicated by the Galway and Kerry sites). Ozone is highly influenced by weather and
transboundary sources.
Figure 3.4 Ozone AOT40 at rural background stations in Ireland 2006 – 2016
Particulate matter (PM10)
Figure 3.5 shows the annual mean PM10 concentrations at selected stations from 2006 to
2016. Concentrations have consistently been hovering around the WHO air quality guideline
value over this period.
Figure 3.5 Annual mean PM10 concentrations in Zone A in Ireland 2006 – 2016

Air Quality in Ireland 2016
21
Particulate matter (PM2.5)
Figure 3.6 shows the trend for PM2.5 annual mean concentrations at individual stations for
the period 2009 to 2016. Concentrations show no overall discernible trend with individual
stations showing some slight trends in either direction.
Figure 3.6 Annual mean PM2.5 concentrations at individual stations in Ireland 2009 – 2016
Benzene
Figure 3.7 shows annual mean benzene concentrations at individual monitoring stations in
Ireland from 2006 – 2016. Concentrations over this time period have remained low.
Figure 3.7 Annual mean benzene concentrations at individual stations in Ireland 2006 ‐ 2016

Air Quality in Ireland 2016
22
Heavy metals (As, Cd, Pb and Ni)
Figure 3.8, Figure 3.9, Figure 3.10 and Figure 3.11 show the trends in lead, arsenic, cadmium
and nickel respectively over the period 2009 – 2016. Concentrations in this time have
remained low.
Figure 3.8 Annual mean lead concentrations 2009 ‐ 2016
Figure 3.9 Annual mean arsenic concentrations 2009 – 2016
Air Quality in Ireland 2016
23
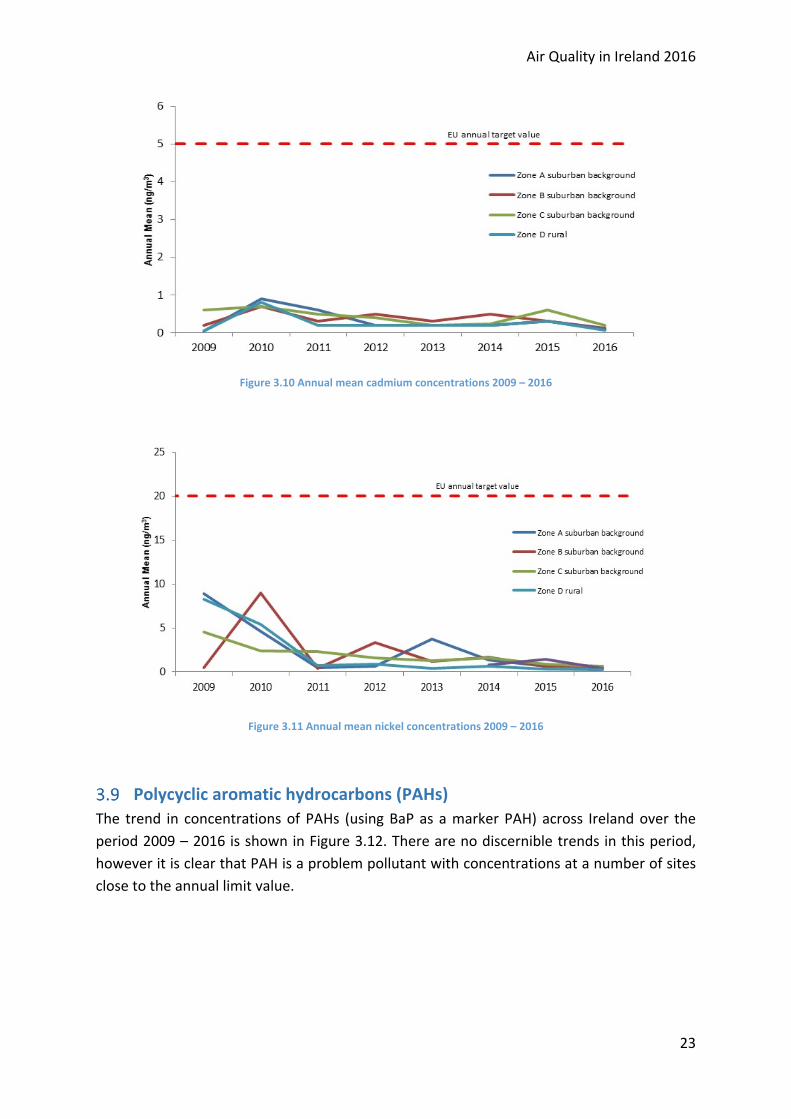
Figure 3.10 Annual mean cadmium concentrations 2009 – 2016
Figure 3.11 Annual mean nickel concentrations 2009 – 2016
Polycyclic aromatic hydrocarbons (PAHs)
The trend in concentrations of PAHs (using BaP as a marker PAH) across Ireland over the
period 2009 – 2016 is shown in Figure 3.12. There are no discernible trends in this period,
however it is clear that PAH is a problem pollutant with concentrations at a number of sites
close to the annual limit value.

Air Quality in Ireland 2016
24
Figure 3.12 Annual mean BaP concentrations at individual stations in Ireland 2009 ‐ 2016

Air Quality in Ireland 2016
25
4 Air Quality Information
This Chapter introduces some of the ways in which the public can access air quality data and
information.
EPA air quality website
The best source of air quality information is the EPA’s air quality website at
www.epa.ie/air/quality/. This site presents real‐time air quality data and details air quality
legislation. It also links to our monthly air quality bulletins and annual air quality reports.
A summary of some key statistics from work undertaken by EPA in air enforcement is available
to view at www.epa.ie/pubs/reports/air/quality
Air Quality Index for Health
The EPA’s Air Quality Index for Health is a web‐based index, developed in conjunction with
the Health Service Executive, Met Éireann, DCCAE and Local Authorities and shows what the
current air quality is across Ireland. The Air Quality Index for Health is a coloured scale of 1 ‐
10. As shown in Figure 4.1, the scale is divided into four bands:
good
fair
poor
very poor
with health advice provided for each band.
The Air Quality Index for Health is calculated hourly and is represented on a colour coded map
of Ireland, from which the public can easily assess current air quality in their area. The Air
Quality Index for Health can be viewed at www.epa.ie/air/quality/.
The Air Quality Index for Health includes health advice for both the general population and
those who are more sensitive to air pollution, for example, people with heart or lung
problems. The accompanying instructions explain how to determine if you or your child is
likely to be at risk from air pollution.

Air Quality in Ireland 2016
26
Figure 4.1 The Air Quality Index for Health
@EPAAirquality
The EPA also has a Twitter channel @EPAAirQuality. Anyone can sign up to this Twitter
channel and receive tweets on the status of air quality in their region every day.

Air Quality in Ireland 2016
27
5 Conclusions
Air pollution presents one of the biggest environmental threats to public health and
ecosystems across Europe. Recently the EEA have estimated that there were 1,510 premature
deaths in Ireland in 2014 due to poor air quality, with a figure of 520,400 premature deaths
across the wider EU (EEA 2017).
Air pollution is clearly negatively impacting on the environment and on the quality of life of
the citizens of Ireland. However, data produced by the EPA on the key sources of these
pollutants also indicates that there are opportunities to take action to reduce the levels of
pollutants in the atmosphere, in order to provide a cleaner and healthier environment
supporting a sustainable society and economy.
While the data from Ireland’s air quality monitoring in 2016 shows that we are in compliance
with the EU statutory limit and target values, it is clear, that Ireland’s air quality fails to meet
the tighter WHO guideline values for a number of pollutants, including PM10, PM2.5, ozone,
SO2 and NO2. Ireland faces a stiff challenge to decrease the levels of these air pollutants to
below that of the WHO Air Quality Guideline values, however it is particularly important to
tackle PM2.5 which the EEA has highlighted as having responsibility for the majority of
premature deaths in Ireland.
The key sector in respect of PM2.5 concentrations in Ireland is the continued use of solid fuel
burning for home heating. Also, there is increasing research in Ireland (UCC Sapphire Project
and UCD Ammonia N2K project) beginning to highlight agriculture as a contributor to PM2.5
concentrations, particularly ammonia which must be further investigated.
For the pollutants SO2 and NO2 there are potential sources in the residential heating, energy,
industry and transport sectors.
Emissions from large industrial activities are well regulated through the industrial and waste
licensing regimes and further downward pressure on emissions will be realised through
ongoing implementation of the European Industrial Emissions Directive (IED) and associated
Best Available Techniques requirements of the IED.
In relation to the other activities (residential heating, energy production and transport), it is
the transport sector which has the greatest impact on NO2 concentrations, particularly in our
urban areas where we are above the WHO guideline value, approaching the EU limit value
and could face exceedances of this EU limit in the future if vehicle numbers continue to rise.
There are solutions to the challenges highlighted above ‐ firstly there should be movement
towards adoption of the WHO guideline values across Europe as this would provide a real
impetus for improvements in air quality. The continued promotion of the shift from solid fuel

Air Quality in Ireland 2016
28
as a method of home heating to cleaner alternatives, is the key issue regarding particulate
matter levels in Ireland and the area where there is the greatest scope for improvements in
air quality. Priority should be given to public transport or clean transport over fossil fuel
powered motor vehicles in all aspects of society. Pollutants such as NO2, from the transport
sector are set to become an issue for Ireland in the coming years, unless we transition from
our dependence on fossil fuel combustion powered transport. The Government’s proposed
‘Clean Air Strategy’ for Ireland is expected to highlight these issues, proposing policy solutions
to address the major public health and environmental challenges posed by air pollution to
Ireland. Together with the ‘National Mitigation Plan’ which also contains many measures
which will have air quality synergies, these documents point the way forward from a policy
perspective.
The EPA’s development of a national ambient air quality monitoring programme (AAMP)
providing enhanced real‐time air quality information to the public as well as the forthcoming
Clean Air Strategy will both require local authorities to play a central role. However, at present
the resources allocated to air quality issues by local authorities are very limited. Sufficient
capacity and capability must be developed within the local authority network in relation to
air quality.
Increased citizen engagement will be crucial to the successful implementation of the Clean
Air Strategy and forms a key pillar of the AAMP. Pivotal to this, is the need to increase public
awareness and understanding of the link between air quality and health and how the actions
of individuals can have a positive effect on local air quality. The continued implementation of
the AAMP by the EPA, supported by the Clean Air Strategy will act to educate, inform and
support the public to make clean air choices, particularly in the how we heat our homes and
travel in our urban centres, which will lead to cleaner air to breathe in our villages, towns and
cities.

Air Quality in Ireland 2016
29
Appendix A: Legislation and Policy
Environmental Protection Agency
The EPA is the designated competent authority for the implementation of all Irish and EU
ambient air quality legislation. It is assisted in its role by the Local Authorities, carrying out
ambient air quality monitoring. This collaborative network of monitoring is known as the
‘National Ambient Air Quality Monitoring Network’. The EPA manages this monitoring
network and is responsible for all reporting to stakeholders – which include the public and
the European Commission (EC). The EPA is also the National Reference Laboratory (NRL) for
air quality for Ireland.
EU legislation
The results of air quality monitoring in 2016 presented in this report are compared to the limit
and target values in the latest EU legislation, the Clean Air for Europe (CAFE) Directive (EP and
CEU, 2008) and the Fourth Daughter Directive (EP and CEU, 2004). The CAFE Directive is an
amalgamation of the Air Quality Framework Directive and its subsequent First, Second and
Third Daughter Directives. The EU intends to incorporate the Fourth Daughter Directive into
the CAFE Directive in the future. The CAFE Directive introduced a limit value for PM2.5. It also
required Member States to measure an average exposure indicator (AEI) for PM2.5, which was
an annual concentration, averaged over three years. Based on this value there is a mandatory
percentage reduction for each Member State to be achieved by 2020. This reduction target,
which is 10% for Ireland is known as the PM2.5 National Exposure Reduction Target (PM2.5
NERT)
The CAFE Directive was transposed into Irish legislation by the Air Quality Standards
Regulations 2011 (S.I. No. 180 of 2011). It replaces the Air Quality Standards Regulations 2002
(S.I. No. 271 of 2002), the Ozone in Ambient Air Regulations 2004 (S.I. No. 53 of 2004) and S.I.
No. 33 of 1999. The 4th Daughter Directive was transposed by the Arsenic, Cadmium,
Mercury, Nickel and Polycyclic Aromatic Hydrocarbons in Ambient Air Regulations 2009 (S.I.
No. 58 of 2009).
Specific requirements are set out in relation to providing the public with information on
ambient air quality. Up‐to‐date information on air quality must be made available on a
widespread basis through appropriate media including newspapers and the Internet, with
more sensitive population groups provided with more specific information. See section 4 of
this report for further details on air quality information. Further details on air quality
legislation can be found at http://www.epa.ie/air/quality/standards/.

Air Quality in Ireland 2016
30
World Health Organisation air quality guidelines
This report makes reference to the World Health Organisation (WHO) air quality guidelines
for particulate matter (PM10), ozone, nitrogen dioxide and sulphur dioxide (WHO, 2005); and
also the WHO air quality guidelines update, which includes PM2.5 (Air Qual Atmos Health,
2008). These guidelines were developed by the WHO, to inform policy makers and provide
appropriate air quality targets worldwide, based on the latest health information available.
These guideline values for many parameters are stricter than the EU Directives. The results
obtained in our monitoring program during 2016 are compared to these guideline values.
Table 1 shows the percentage of the urban population in the EU‐28 exposed to air pollutant
concentrations above the EU limit and reference levels compared with the percentage
exposed to concentrations above the WHO guideline levels.
Pollutant EU reference level Exposure estimate
(%)
WHO AQG Exposure estimate
(%)
PM2.5 Year (25) 8‐12 Year (10) 85‐91
PM10 Day (50) 16‐21 Day (20) 50‐63
O3 8‐hour (120) 8‐17 8‐hour (100) 96‐98
NO2 Year (40) 7‐9 Year (40) 7‐9
BaP Year (1) 20‐24 Year (0.12) 88‐91
SO2 Day (125) < 1 Day (20) 35‐49
CO 8‐hour (10) < 2 8‐hour (10) < 2
Pb Year (0.5) < 1 Year (0.5) < 1
Benzene Year (5) < 1 Year (1.7) 12‐13
Colour coding: < 5% 5‐50% 50‐75% > 75%
Table 1 Percentage of the urban population in the EU‐28 exposed to air pollutant concentrations above the EU and WHO reference levels (2011‐2013) Source: EEA

Air Quality in Ireland 2016
31
Appendix B: Dioxin survey
Table A1 Milk fat related PCDD/F and PCB‐TEQ values determined in the background samples A1 ‐ A25
Sample
No. Milk supply area PCBs Dioxins Dioxins & PCBs
WHO‐TEQincl. LOQ
WHO‐TEQ incl. LOQ
Total WHO‐TEQincl. LOQ
Unit pg/g milk fat pg/g milk fat pg/g milk fat
A1 Mitchelstown Area 0.41 0.16 0.57
A2 Co. Waterford 0.17 0.09 0.26
A3 Dublin South.Co./North
Wicklow Area
0.60 0.19 0.79
A4 North Co. Wexford 0.24 0.10 0.34
A5 Charleville, Co Cork Area 0.16 0.08 0.24
A6 Ballyragget, Co Kilkenny Area 0.17 0.10 0.27
A7 Renmore, Co Galway Area 0.17 0.09 0.26
A8 Moate, Co Westmeath Area 0.23 0.12 0.35
A9 Tipperary Town/Thurles Areas 0.17 0.08 0.25
A10 Nenagh, Co. Tipperary Area 0.16 0.01 0.17
A11 Cavan/Longford/Leitrim 0.25 0.10 0.35
A12 Drinagh, Co Cork 0.68 0.16 0.84
A13 Bandon Area 0.16 0.07 0.23
A14 North Kerry Area 0.16 0.06 0.23
A15 Co Sligo 0.18 0.11 0.29
A16 Roscommon/East Galway 0.18 0.09 0.27

Air Quality in Ireland 2016
32
A18 Roscommon/Leitrim 0.19 0.11 0.30
A19 Co Monaghan 0.27 0.10 0.37
A20 Co Louth 0.18 0.12 0.30
A21 North Kildare/West Dublin 0.32 0.03 0.35
A22 So Kerry (Cahirciveen area) 0.80 0.03 0.83
A23 South Wexford 0.19 0.12 0.31
A24 SE Co. Mayo 0.20 0.07 0.27
A25 Co. Donegal 0.21 0.13 0.34
Table A2 Milk fat related PCDD/F and PCB‐TEQ values determined in the potential impact samples B1 ‐ B 18
Sample
No. Milk supply area PCBs Dioxins Dioxins & PCBs
WHO‐TEQincl. LOQ
WHO‐TEQincl. LOQ
Total WHO‐TEQincl. LOQ
Unit pg/g milk fat pg/g milk fat pg/g milk fat
B1 Carrigtwohill/Cobh/Great
Island 0.18 0.11 0.29
B2 Aghada/East Cork Harbour 0.79 0.29 1.08
B3 Askeaton area 0.16 0.08 0.24
B4 Tarbert Co. Kerry 0.16 0.09 0.24
B5 Clarecastle, Co.Clare 0.18 0.10 0.28
B6 Cooraclare Co.Clare 0.17 0.07 0.24
B7 Ballydine, So. Tipperary 0.28 0.13 0.41
B8 Swords/Mulhuddart.
Co.Dublin 0.25 0.37 0.62
B9 Grannagh, So.Kilkenny 0.22 0.12 0.34
B13 Kinsale(Dunderow) Co.Cork 0.18 0.13 0.31

Air Quality in Ireland 2016
33
B14 Ringaskiddy area.
Co.Cork
0.17 0.09 0.26
B15 Crossakiel
(nr Kells) Co.Meath
0.28 0.22 0.50
B17 Carranstown, Co.Meath 0.20 0.10 0.30
B18 Kinnegad, Co Westmeath 0.19 0.16 0.34

Air Quality in Ireland 2016
34
References
EEA (European Environment Agency), 2017, Air Quality in Europe 2017. EEA Report No.
13/2017.
OECD (2016), The Economic Consequences of Outdoor Air Pollution, OECD Publishing, Paris
http://dx.doi.org/10.1787/9789264257474‐en
WHO (World Health Organisation), 2005. Air Quality Guidelines – Global Update, WHO
Geneva.
WHO (World Health Organisation), 2008, 'Air Quality and Health — Fact sheet No. 313 —
Updated August 2008' (http://www.who.int/ mediacentre/factsheets/fs313/en/) accessed 3
October 2011.
WHO (World Health Organisation), 2014. Mortality from Ambient Air Pollution for 2012 –
Summary of Results, WHO Geneva.

AN GHNÍOMHAIREACHT UM CHAOMHNÚ COMHSHAOILTá an Ghníomhaireacht um Chaomhnú Comhshaoil (GCC) freagrach as an gcomhshaol a chaomhnú agus a fheabhsú mar shócmhainn luachmhar do mhuintir na hÉireann. Táimid tiomanta do dhaoine agus don chomhshaol a chosaint ó éifeachtaí díobhálacha na radaíochta agus an truaillithe.
Is féidir obair na Gníomhaireachta a roinnt ina trí phríomhréimse:
Rialú: Déanaimid córais éifeachtacha rialaithe agus comhlíonta comhshaoil a chur i bhfeidhm chun torthaí maithe comhshaoil a sholáthar agus chun díriú orthu siúd nach gcloíonn leis na córais sin.
Eolas: Soláthraímid sonraí, faisnéis agus measúnú comhshaoil atá ar ardchaighdeán, spriocdhírithe agus tráthúil chun bonn eolais a chur faoin gcinnteoireacht ar gach leibhéal.
Tacaíocht: Bímid ag saothrú i gcomhar le grúpaí eile chun tacú le comhshaol atá glan, táirgiúil agus cosanta go maith, agus le hiompar a chuirfidh le comhshaol inbhuanaithe.
Ár bhFreagrachtaí
CeadúnúDéanaimid na gníomhaíochtaí seo a leanas a rialú ionas nach ndéanann siad dochar do shláinte an phobail ná don chomhshaol:• saoráidí dramhaíola (m.sh. láithreáin líonta talún, loisceoirí,
stáisiúin aistrithe dramhaíola);• gníomhaíochtaí tionsclaíocha ar scála mór (m.sh. déantúsaíocht
cógaisíochta, déantúsaíocht stroighne, stáisiúin chumhachta);• an diantalmhaíocht (m.sh. muca, éanlaith);• úsáid shrianta agus scaoileadh rialaithe Orgánach
Géinmhodhnaithe (OGM);• foinsí radaíochta ianúcháin (m.sh. trealamh x-gha agus
radaiteiripe, foinsí tionsclaíocha);• áiseanna móra stórála peitril;• scardadh dramhuisce;• gníomhaíochtaí dumpála ar farraige.
Forfheidhmiú Náisiúnta i leith Cúrsaí Comhshaoil• Clár náisiúnta iniúchtaí agus cigireachtaí a dhéanamh gach
bliain ar shaoráidí a bhfuil ceadúnas ón nGníomhaireacht acu.• Maoirseacht a dhéanamh ar fhreagrachtaí cosanta comhshaoil na
n-údarás áitiúil.• Caighdeán an uisce óil, arna sholáthar ag soláthraithe uisce
phoiblí, a mhaoirsiú.• Obair le húdaráis áitiúla agus le gníomhaireachtaí eile chun dul
i ngleic le coireanna comhshaoil trí chomhordú a dhéanamh ar líonra forfheidhmiúcháin náisiúnta, trí dhíriú ar chiontóirí, agus trí mhaoirsiú a dhéanamh ar leasúchán.
• Cur i bhfeidhm rialachán ar nós na Rialachán um Dhramhthrealamh Leictreach agus Leictreonach (DTLL), um Shrian ar Shubstaintí Guaiseacha agus na Rialachán um rialú ar shubstaintí a ídíonn an ciseal ózóin.
• An dlí a chur orthu siúd a bhriseann dlí an chomhshaoil agus a dhéanann dochar don chomhshaol.
Bainistíocht Uisce• Monatóireacht agus tuairisciú a dhéanamh ar cháilíocht
aibhneacha, lochanna, uiscí idirchriosacha agus cósta na hÉireann, agus screamhuiscí; leibhéil uisce agus sruthanna aibhneacha a thomhas.
• Comhordú náisiúnta agus maoirsiú a dhéanamh ar an gCreat-Treoir Uisce.
• Monatóireacht agus tuairisciú a dhéanamh ar Cháilíocht an Uisce Snámha.
Monatóireacht, Anailís agus Tuairisciú ar an gComhshaol• Monatóireacht a dhéanamh ar cháilíocht an aeir agus Treoir an AE
maidir le hAer Glan don Eoraip (CAFÉ) a chur chun feidhme.• Tuairisciú neamhspleách le cabhrú le cinnteoireacht an rialtais
náisiúnta agus na n-údarás áitiúil (m.sh. tuairisciú tréimhsiúil ar staid Chomhshaol na hÉireann agus Tuarascálacha ar Tháscairí).
Rialú Astaíochtaí na nGás Ceaptha Teasa in Éirinn• Fardail agus réamh-mheastacháin na hÉireann maidir le gáis
cheaptha teasa a ullmhú.• An Treoir maidir le Trádáil Astaíochtaí a chur chun feidhme i gcomhair
breis agus 100 de na táirgeoirí dé-ocsaíde carbóin is mó in Éirinn.
Taighde agus Forbairt Comhshaoil• Taighde comhshaoil a chistiú chun brúnna a shainaithint, bonn
eolais a chur faoi bheartais, agus réitigh a sholáthar i réimsí na haeráide, an uisce agus na hinbhuanaitheachta.
Measúnacht Straitéiseach Timpeallachta• Measúnacht a dhéanamh ar thionchar pleananna agus clár beartaithe
ar an gcomhshaol in Éirinn (m.sh. mórphleananna forbartha).
Cosaint Raideolaíoch• Monatóireacht a dhéanamh ar leibhéil radaíochta, measúnacht a
dhéanamh ar nochtadh mhuintir na hÉireann don radaíocht ianúcháin.• Cabhrú le pleananna náisiúnta a fhorbairt le haghaidh éigeandálaí
ag eascairt as taismí núicléacha.• Monatóireacht a dhéanamh ar fhorbairtí thar lear a bhaineann le
saoráidí núicléacha agus leis an tsábháilteacht raideolaíochta.• Sainseirbhísí cosanta ar an radaíocht a sholáthar, nó maoirsiú a
dhéanamh ar sholáthar na seirbhísí sin.
Treoir, Faisnéis Inrochtana agus Oideachas• Comhairle agus treoir a chur ar fáil d’earnáil na tionsclaíochta
agus don phobal maidir le hábhair a bhaineann le caomhnú an chomhshaoil agus leis an gcosaint raideolaíoch.
• Faisnéis thráthúil ar an gcomhshaol ar a bhfuil fáil éasca a chur ar fáil chun rannpháirtíocht an phobail a spreagadh sa chinnteoireacht i ndáil leis an gcomhshaol (m.sh. Timpeall an Tí, léarscáileanna radóin).
• Comhairle a chur ar fáil don Rialtas maidir le hábhair a bhaineann leis an tsábháilteacht raideolaíoch agus le cúrsaí práinnfhreagartha.
• Plean Náisiúnta Bainistíochta Dramhaíola Guaisí a fhorbairt chun dramhaíl ghuaiseach a chosc agus a bhainistiú.
Múscailt Feasachta agus Athrú Iompraíochta• Feasacht chomhshaoil níos fearr a ghiniúint agus dul i bhfeidhm
ar athrú iompraíochta dearfach trí thacú le gnóthais, le pobail agus le teaghlaigh a bheith níos éifeachtúla ar acmhainní.
• Tástáil le haghaidh radóin a chur chun cinn i dtithe agus in ionaid oibre, agus gníomhartha leasúcháin a spreagadh nuair is gá.
Bainistíocht agus struchtúr na Gníomhaireachta um Chaomhnú ComhshaoilTá an ghníomhaíocht á bainistiú ag Bord lánaimseartha, ar a bhfuil Ard-Stiúrthóir agus cúigear Stiúrthóirí. Déantar an obair ar fud cúig cinn d’Oifigí:• An Oifig um Inmharthanacht Comhshaoil• An Oifig Forfheidhmithe i leith cúrsaí Comhshaoil• An Oifig um Fianaise is Measúnú• An Oifig um Cosaint Raideolaíoch• An Oifig Cumarsáide agus Seirbhísí CorparáideachaTá Coiste Comhairleach ag an nGníomhaireacht le cabhrú léi. Tá dáréag comhaltaí air agus tagann siad le chéile go rialta le plé a dhéanamh ar ábhair imní agus le comhairle a chur ar an mBord.

HeadquartersPO Box 3000, Johnstown Castle Estate County Wexford, Y35 W821, IrelandBosca Poist 3000, Eastát Chaisleán Bhaile Sheáin Contae Loch Garman, Y35 W821, Éire
T: +353 53 9160600 F: +353 53 9160699 E: [email protected]: www.epa.ieLo Call: 1890 33 55 99
EPA Regional Inspectorate Dublin McCumiskey HouseRichviewClonskeagh RoadDublin 14D14 YR62Tel: 01-268 0100Fax: 01-268 0199
EPA Regional Inspectorate Cork InniscarraCo. CorkP31 VX59Tel: 021-4875540Fax: 021-4875545
EPA Regional Inspectorate Castlebar John Moore RoadCastlebarCo. MayoF23 KT91Tel: 094-9048400Fax: 094-9021934
EPA Regional Inspectorate Kilkenny Seville LodgeCallan RoadKilkennyR95 ED28Tel: 056-7796700Fax: 056-7796798
EPA Regional Inspectorate Monaghan The GlenMonaghanH18 YT02Tel: 047-77600Fax: 047-84987
E: [email protected]: www.epa.ieLoCall: 1890 33 55 99
Printed on an environmentally friendly paper stock