Embed Size (px)
Citation preview
Laughlin Air Force Base
Economic Impact
Statement FY16
Graduate the World’s Best Pilots
Deploy Mission-Ready Warriors
Develop Professional, Resilient and Innovative Airmen
Table of Contents Foreword 3
Commander’s Welcome 4
Organizations 5
Aircraft 7
Mission Assets 8
Capital Assets 9
Program Data 11
Personnel 12
Payroll 13
Expenditures 14
Indirect Jobs Created 15
Total Economic Impact 16
Economic Trend 17
2
FOREWORD
The Economic Impact Statement (EIS) provides unclassified key information about the economic impact of an Air Force base on the surrounding community. This document is made available to senior military officials, federal, state, and local officials, as well as to local business leaders and visitors to the base. An installation’s economic impact on the local community is calculated by use of a cost model that highlights off-base local area spending from gross expenditures. For the purpose of the model, the local area, or Economic Impact Region (EIR), includes all counties encompassing a 50-mile radius from the center of the Air Force base. The cost model also calculates the number of Indirect Jobs Created (IJC) in the local area. Indirect jobs are those additional employment opportunities that are required by local businesses to support the presence of the Air Force base. The IJC is calculated by multiplying the total number of base employees by the base’s unique IJC multiplier furnished by the Bureau of Labor Statistics, U.S. Department of Labor. All information contained herein is current as of 30 September 2016. Questions or comments regarding information appearing in this document should be directed to the Financial Analysis Flight, 47 CPTS/FMA, 427 Liberty Drive, Rm 206, Laughlin AFB TX 78843 DSN 732-5271 or commercial (830) 298–5271
3
4
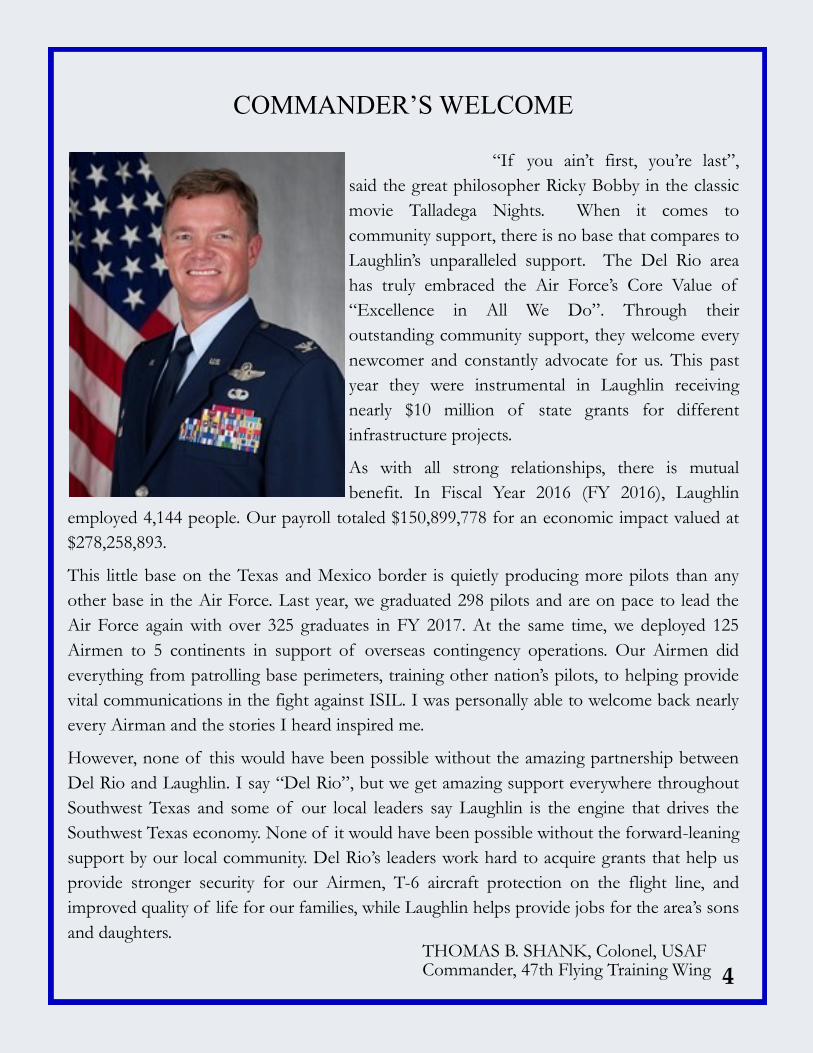
COMMANDER’S WELCOME
“If you ain’t first, you’re last”,
said the great philosopher Ricky Bobby in the classic
movie Talladega Nights. When it comes to
community support, there is no base that compares to
Laughlin’s unparalleled support. The Del Rio area
has truly embraced the Air Force’s Core Value of
“Excellence in All We Do”. Through their
outstanding community support, they welcome every
newcomer and constantly advocate for us. This past
year they were instrumental in Laughlin receiving
nearly $10 million of state grants for different
infrastructure projects.
As with all strong relationships, there is mutual
benefit. In Fiscal Year 2016 (FY 2016), Laughlin
employed 4,144 people. Our payroll totaled $150,899,778 for an economic impact valued at
$278,258,893.
This little base on the Texas and Mexico border is quietly producing more pilots than any
other base in the Air Force. Last year, we graduated 298 pilots and are on pace to lead the
Air Force again with over 325 graduates in FY 2017. At the same time, we deployed 125
Airmen to 5 continents in support of overseas contingency operations. Our Airmen did
everything from patrolling base perimeters, training other nation’s pilots, to helping provide
vital communications in the fight against ISIL. I was personally able to welcome back nearly
every Airman and the stories I heard inspired me.
However, none of this would have been possible without the amazing partnership between
Del Rio and Laughlin. I say “Del Rio”, but we get amazing support everywhere throughout
Southwest Texas and some of our local leaders say Laughlin is the engine that drives the
Southwest Texas economy. None of it would have been possible without the forward-leaning
support by our local community. Del Rio’s leaders work hard to acquire grants that help us
provide stronger security for our Airmen, T-6 aircraft protection on the flight line, and
improved quality of life for our families, while Laughlin helps provide jobs for the area’s sons
and daughters. THOMAS B. SHANK, Colonel, USAF Commander, 47th Flying Training Wing
ORGANIZATIONS
5
ORGANIZATIONS
Wing Staff Agencies
47th Comptroller Squadron
Chapel
Command Post
Command Section
Equal Opportunity
Historian
Inspector General
Office of Special Investigations
Protocol
Public Affairs
SARC
Staff Judge Advocate
47th Mission Support Group
47th Civil Engineer Squadron
47th Communications Squadron
47th Contracting Flight
47th Force Support Squadron
47th Logistics Readiness Flight
47th Security Forces Squadron
47th Operations Group
47th Operations Support Squadron
47th Student Squadron
85th/434th Flying Training Squadron
86th Flying Training Squadron
87th Flying Training Squadron
96th Flying Training Squadron
47th Maintenance Directorate
T-1 Aircraft Maintenance Division
T-6 Aircraft Maintenance Division
T-38 Aircraft Maintenance Division
Component Maintenance Division
Contract Performance Management
Executive Support
Maintenance Operations Division
Quality Assurance
47th Medical Group
47th Medical Operations Squadron
47th Medical Support Squadron
6
AIRCRAFT
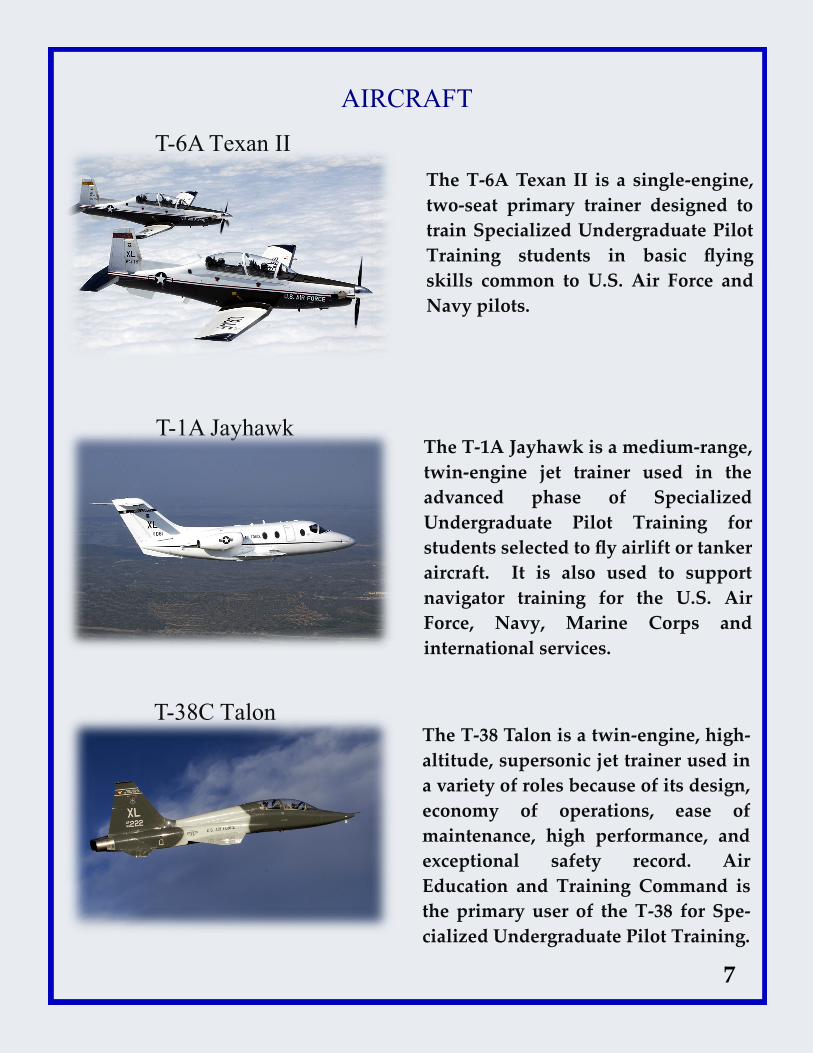
T-6A Texan II
T-1A Jayhawk
T-38C Talon
The T-1A Jayhawk is a medium-range,
twin-engine jet trainer used in the
advanced phase of Specialized
Undergraduate Pilot Training for
students selected to fly airlift or tanker
aircraft. It is also used to support
navigator training for the U.S. Air
Force, Navy, Marine Corps and
international services.
The T-38 Talon is a twin-engine, high-
altitude, supersonic jet trainer used in
a variety of roles because of its design,
economy of operations, ease of
maintenance, high performance, and
exceptional safety record. Air
Education and Training Command is
the primary user of the T-38 for Spe-
cialized Undergraduate Pilot Training.
The T-6A Texan II is a single-engine,
two-seat primary trainer designed to
train Specialized Undergraduate Pilot
Training students in basic flying
skills common to U.S. Air Force and
Navy pilots.
7

MISSION ASSETS
Information not included in Economic Impact Calculation
1. Mission Assets
Aircraft Number Assigned
T-1A 58
T-6A 103
T-38C 65
TOTAL 226
Simulators
T-1A 4
T-6A 20
T-38C 7
TOTAL 31
2. Training Data
Aircraft Sorties Flight Hours Graduates
T-6A 27,863 37,723 322
T-1A 7,127 17,393 204
T-38C 11,653 12,939 94
8
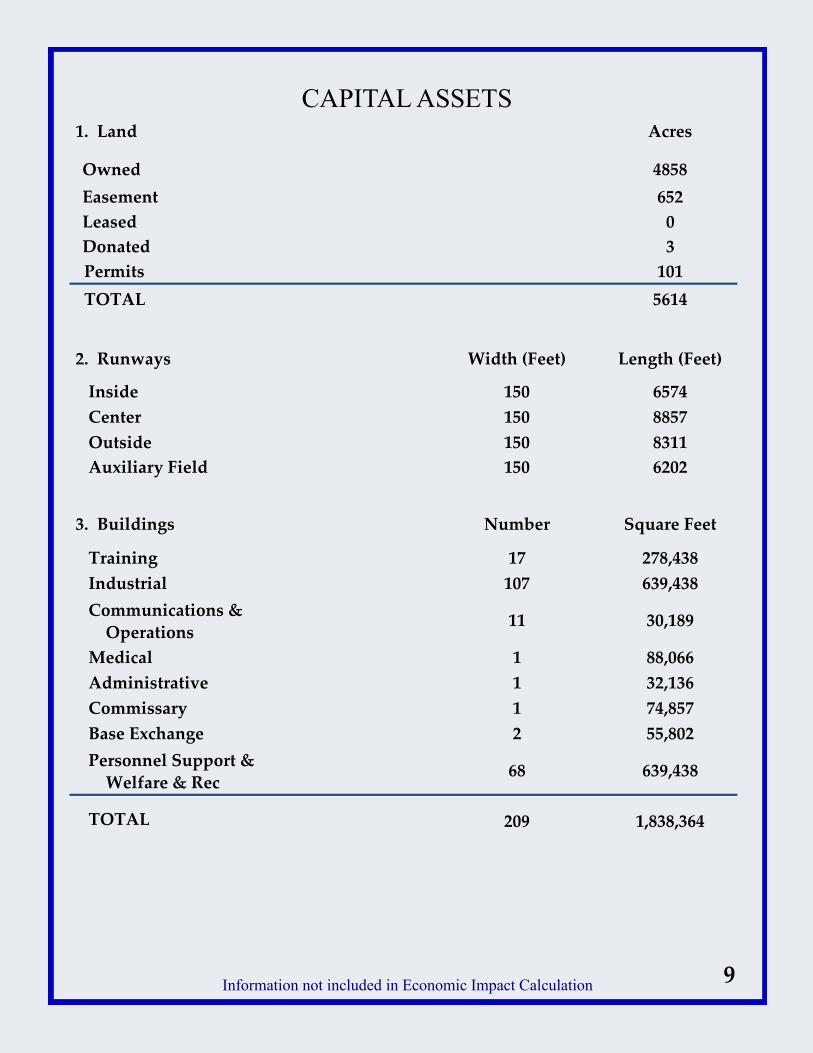
CAPITAL ASSETS
Information not included in Economic Impact Calculation
1. Land Acres
Owned 4858
Easement 652
Leased 0
Donated 3
Permits 101
TOTAL 5614
2. Runways Width (Feet) Length (Feet)
Inside 150 6574
Center 150 8857
Outside 150 8311
Auxiliary Field 150 6202
3. Buildings Number Square Feet
Training 17 278,438
Industrial 107 639,438
Communications &
Operations 11 30,189
Medical 1 88,066
Administrative 1 32,136
Commissary 1 74,857
Base Exchange 2 55,802
Personnel Support &
Welfare & Rec 68 639,438
TOTAL 209 1,838,364
9

CAPITAL ASSETS
Information not included in Economic Impact Calculation
4. Dormitory & Lodging Number Capacity
Unaccompanied Airmen/
NCO 1 105
Unaccompanied Officer 3 255
Visiting Quarters 1 95
Temporary Lodging
Facilities 9 136
Duplexes 42 84
TOTAL 57 772
5. Family Housing Officer Enlisted Total
2 Bedroom 138 117 255
3 Bedroom 64 69 133
4 Bedroom 22 36 58
TOTAL 224 222 446
6. Computers Quantity
Desktops 2,414
Laptops/Tablets 652
TOTAL 3,066
7. Vehicles Quantity
Owned 131
Leased 9
TOTAL 140
10
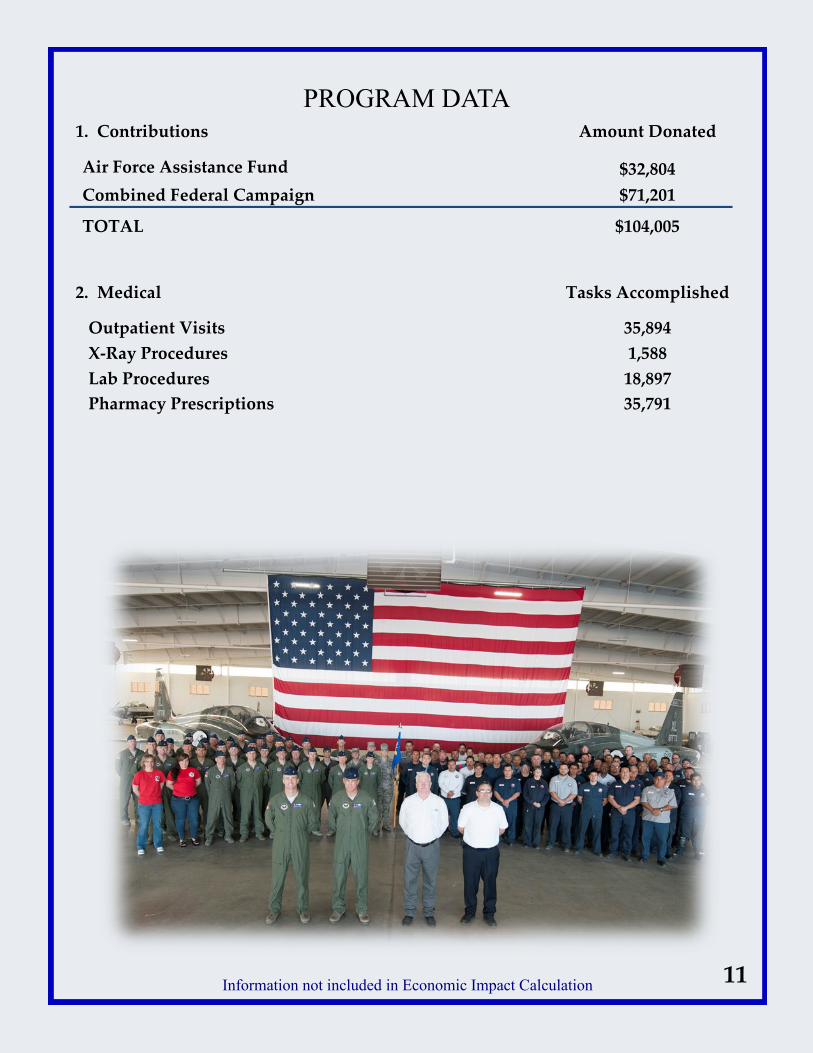
PROGRAM DATA 1. Contributions Amount Donated
Air Force Assistance Fund $32,804
Combined Federal Campaign $71,201
TOTAL $104,005
2. Medical Tasks Accomplished
Outpatient Visits 35,894
X-Ray Procedures 1,588
Lab Procedures 18,897
Pharmacy Prescriptions 35,791
11 Information not included in Economic Impact Calculation
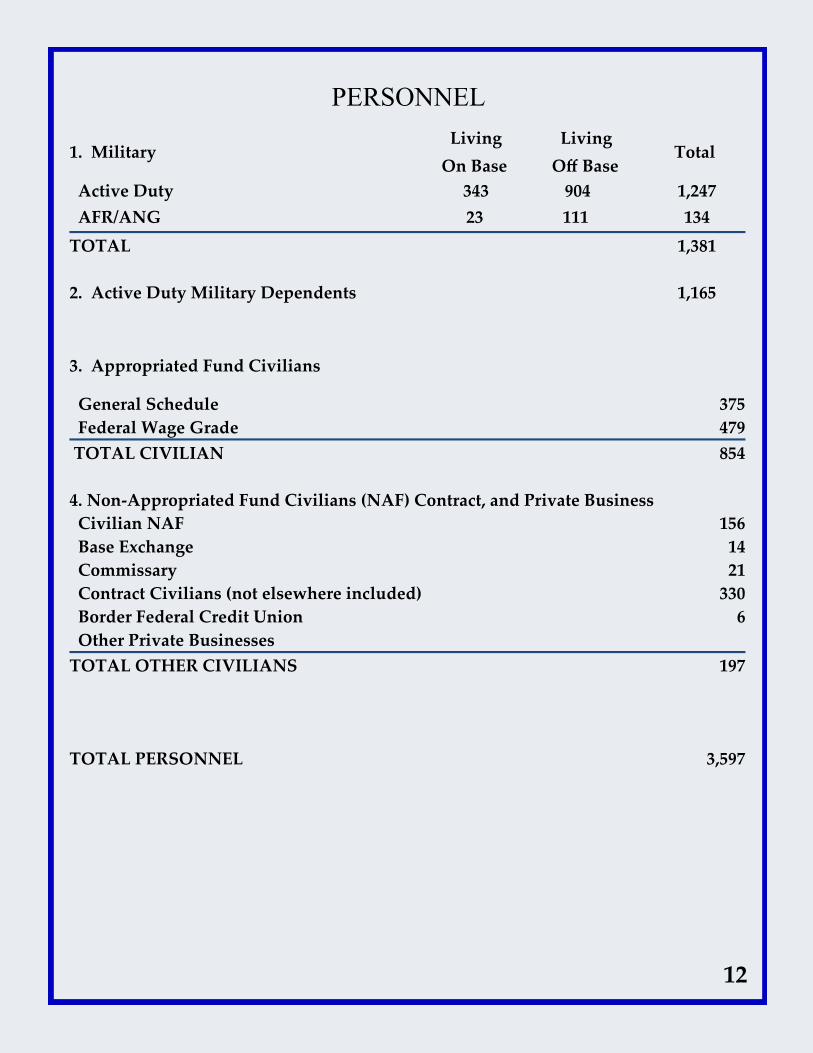
PERSONNEL
1. Military Living
On Base
Living
Off Base Total
Active Duty 343 904 1,247
AFR/ANG 23 111 134
TOTAL 1,381
2. Active Duty Military Dependents 1,165
3. Appropriated Fund Civilians
General Schedule 375
Federal Wage Grade 479
TOTAL CIVILIAN 854
4. Non-Appropriated Fund Civilians (NAF) Contract, and Private Business
Civilian NAF 156
Base Exchange 14
Commissary 21
Contract Civilians (not elsewhere included) 330
Border Federal Credit Union 6
Other Private Businesses
TOTAL OTHER CIVILIANS 197
TOTAL PERSONNEL 3,597
12

PAYROLL
Classification Annual Payroll
Amount
1. Military
Active Duty $61,994,361
AFR/ANG $14,450,868
TOTAL $76,445,229
2. Appropriated Fund (APF) Civilians
General Schedule $32,882,527
Federal Wage Grade $37,359,805
TOTAL APF CIVILIANS 70,242,332
4. Non-Appropriated Fund Civilians (NAF), Contract, and Private Business
Civilian NAF $2,722,255
Base Exchange $401,390
Commissary $1,088,572
Contract Civilians (not elsewhere included) $0
Border Federal Credit Union $158,136
Other Private Businesses $0
TOTAL OTHER CIVILIANS $4,370,353
TOTAL ANNUAL PAYROLL $151,057,914
13
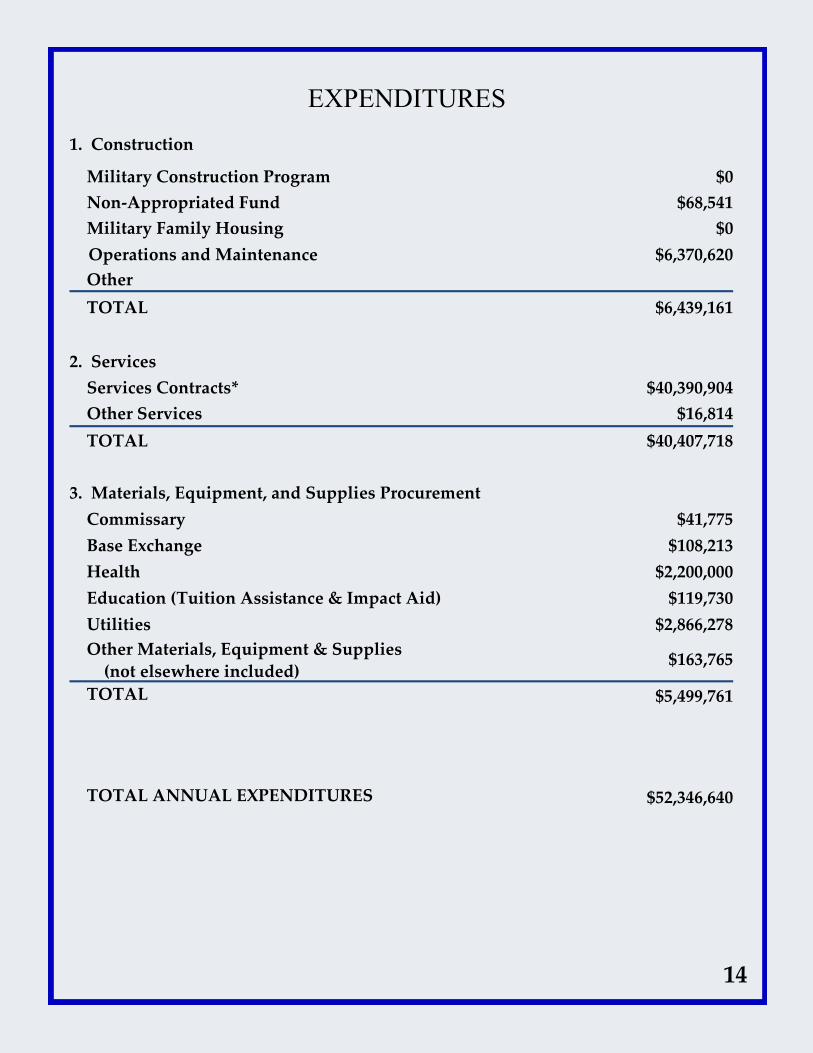
EXPENDITURES
1. Construction
Military Construction Program $0
Non-Appropriated Fund $68,541
Military Family Housing $0
Operations and Maintenance $6,370,620
Other
TOTAL $6,439,161
2. Services
Services Contracts* $40,390,904
Other Services $16,814
TOTAL $40,407,718
3. Materials, Equipment, and Supplies Procurement
Commissary $41,775
Base Exchange $108,213
Health $2,200,000
Education (Tuition Assistance & Impact Aid) $119,730
Utilities $2,866,278
Other Materials, Equipment & Supplies
(not elsewhere included) $163,765
TOTAL $5,499,761
TOTAL ANNUAL EXPENDITURES $52,346,640
14
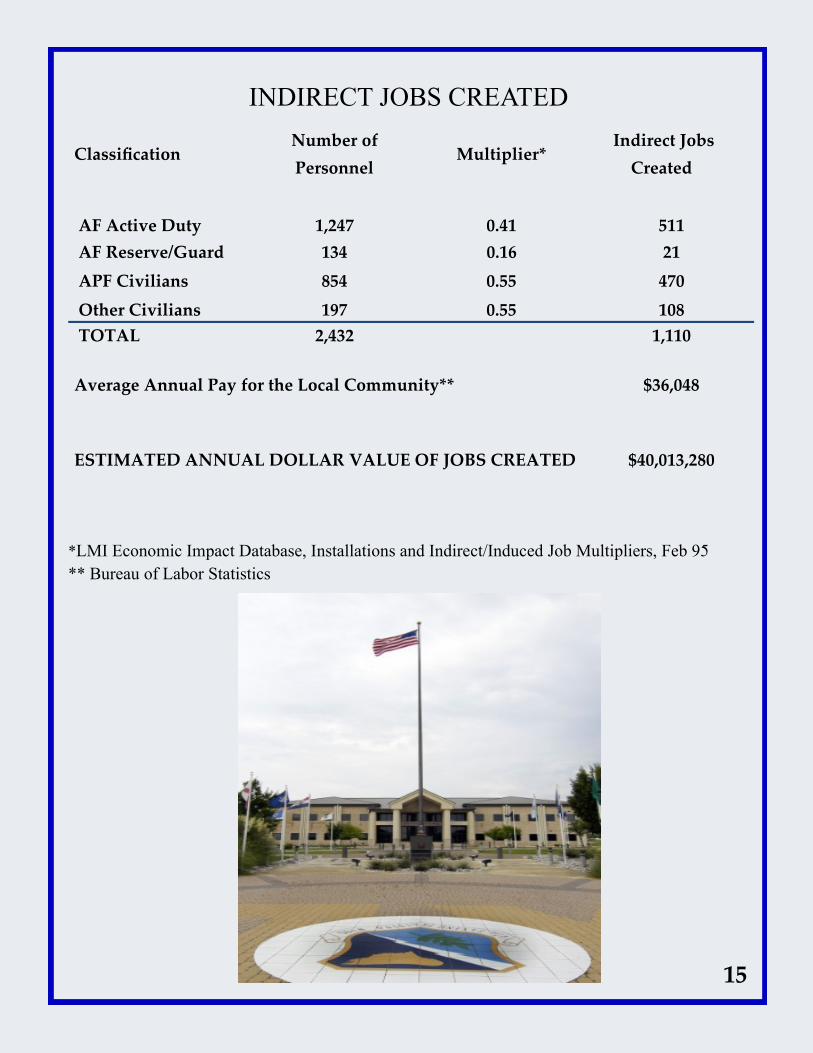
INDIRECT JOBS CREATED
Classification Number of
Personnel Multiplier*
Indirect Jobs
Created
AF Active Duty 1,247 0.41 511
AF Reserve/Guard 134 0.16 21
APF Civilians 854 0.55 470
Other Civilians 197 0.55 108
TOTAL 2,432 1,110
Average Annual Pay for the Local Community** $36,048
ESTIMATED ANNUAL DOLLAR VALUE OF JOBS CREATED $40,013,280
*LMI Economic Impact Database, Installations and Indirect/Induced Job Multipliers, Feb 95
** Bureau of Labor Statistics
15
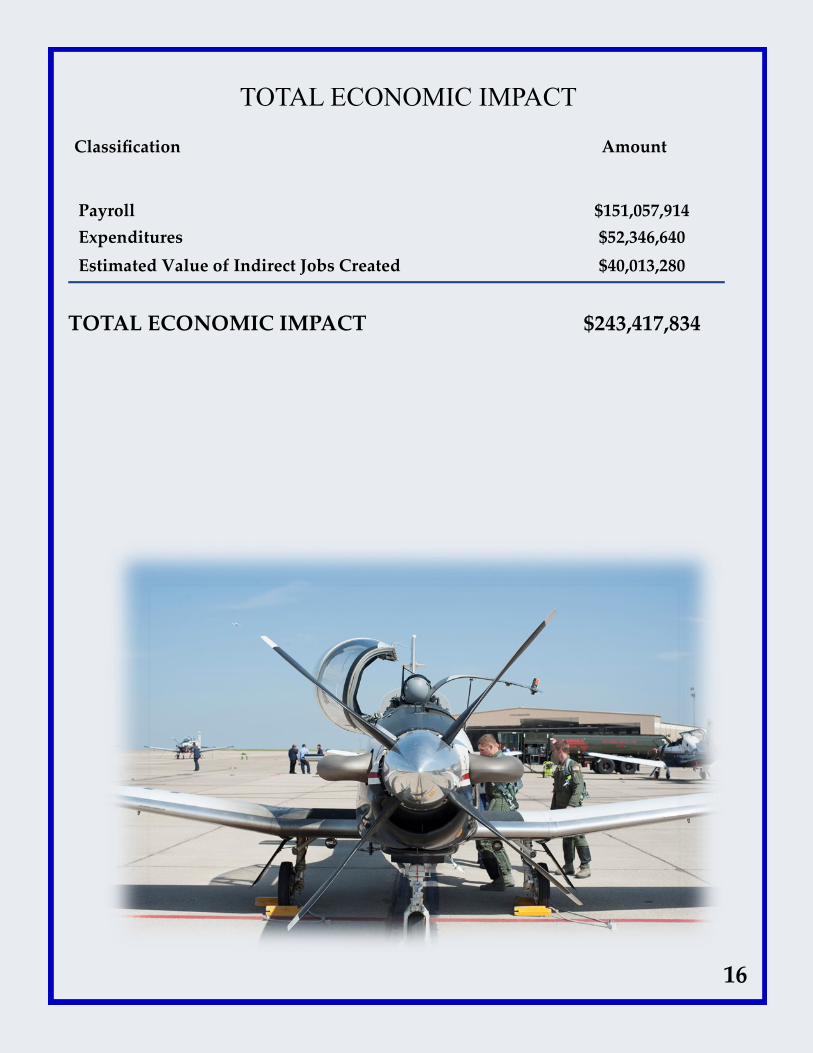
TOTAL ECONOMIC IMPACT
Classification Amount
Payroll $151,057,914
Expenditures $52,346,640
Estimated Value of Indirect Jobs Created $40,013,280
TOTAL ECONOMIC IMPACT $243,417,834
16
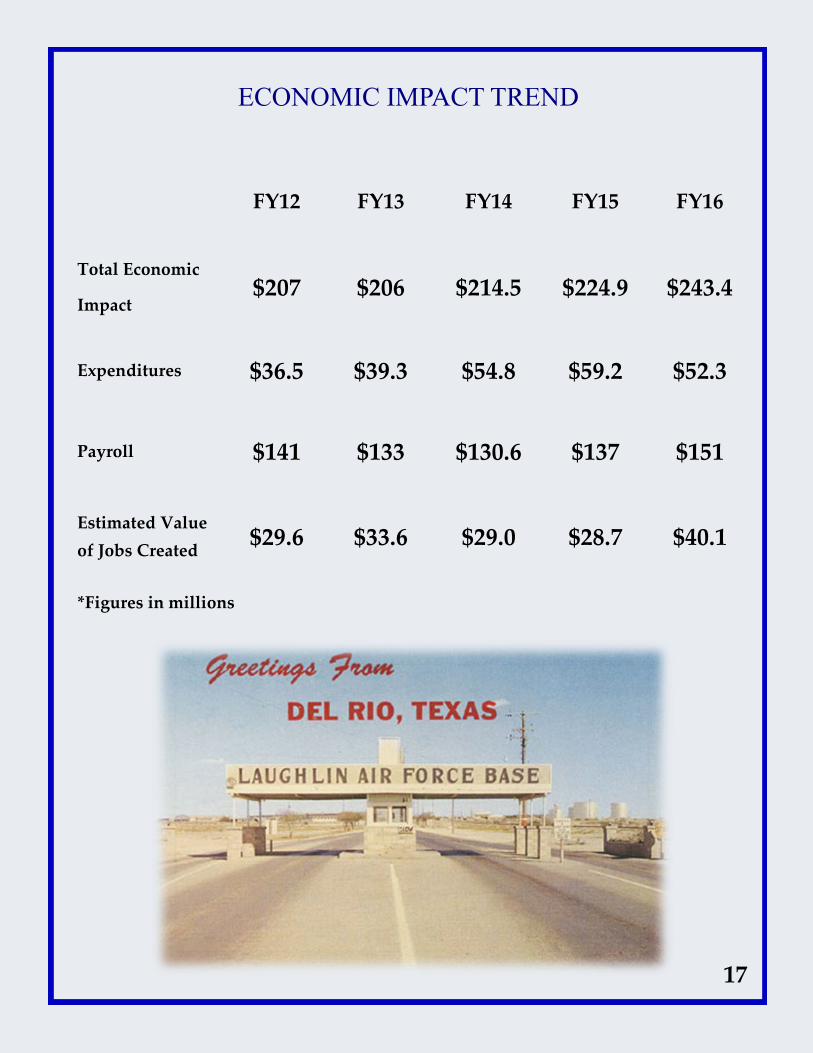
ECONOMIC IMPACT TREND
FY12 FY13 FY14 FY15 FY16
Total Economic
Impact $207 $206 $214.5 $224.9 $243.4
Expenditures $36.5 $39.3 $54.8 $59.2 $52.3
Payroll $141 $133 $130.6 $137 $151
Estimated Value
of Jobs Created $29.6 $33.6 $29.0 $28.7 $40.1
*Figures in millions
17


![FY16 Financial Results [IFRS] - Hitachi...2017/04/26 · Outline of FY16 (Statement of Financial Position in Summary) As of end of March 2017 (100 million yen) Note: ・Total Hitachi](https://img.dokumen.tips/doc/110x75/5f85e39079fa8b44586afce4/fy16-financial-results-ifrs-hitachi-20170426-outline-of-fy16-statement.jpg)