Embed Size (px)
DESCRIPTION
AIPL Research Update. Topic 1. Effect of bulk-tank SCC standard. DHI noncompliance by herd size – 1. 3 of 5 consecutive BTSCC tests exceeding a limit of 750,000 cells/mL 600,000 cells/mL 500,000 cells/mL 400,000 cells/mL. - PowerPoint PPT Presentation
Citation preview
H. D. Norman
Animal Improvement Programs LaboratoryAgricultural Research Service, USDA Beltsville, MD 20705-2350
[email protected] annual meeting (1) 2011
AIPL Research Update

NormanDRMS annual meeting (2) 2011
Topic 1
Effect of bulk-tankSCC standard
NormanDRMS annual meeting (3) 2011
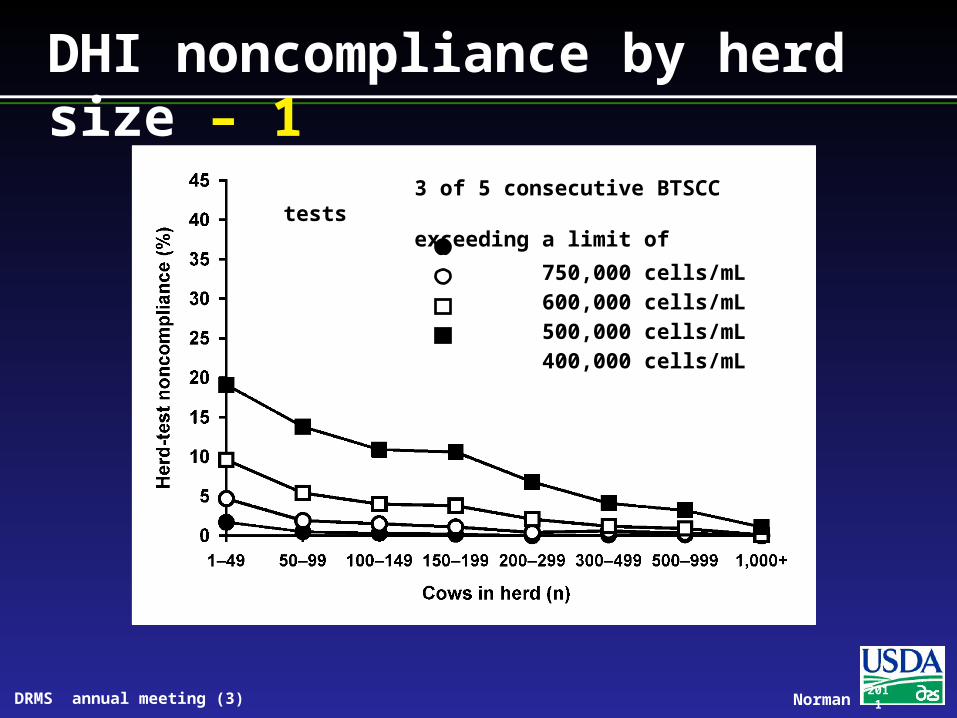
DHI noncompliance by herd size – 1
3 of 5 consecutive BTSCC testsexceeding a limit of
750,000 cells/mL 600,000 cells/mL 500,000 cells/mL 400,000 cells/mL

NormanDRMS annual meeting (4) 2011
DHI noncompliance by herd size – 2
4 consecutive 3-mo geometric mean BTSCCexceeding a limit of
750,000 cells/mL 600,000 cells/mL
500,000 cells/mL 400,000 cells/mL

NormanDRMS annual meeting (5) 2011
DHI noncompliance by herd size – 3
3-mo geometric mean BTSCC exceeding limitplus next BTSCC test exceeding a limit of
750,000 cells/mL 550,000 cells/mL
NormanDRMS annual meeting (6) 2011
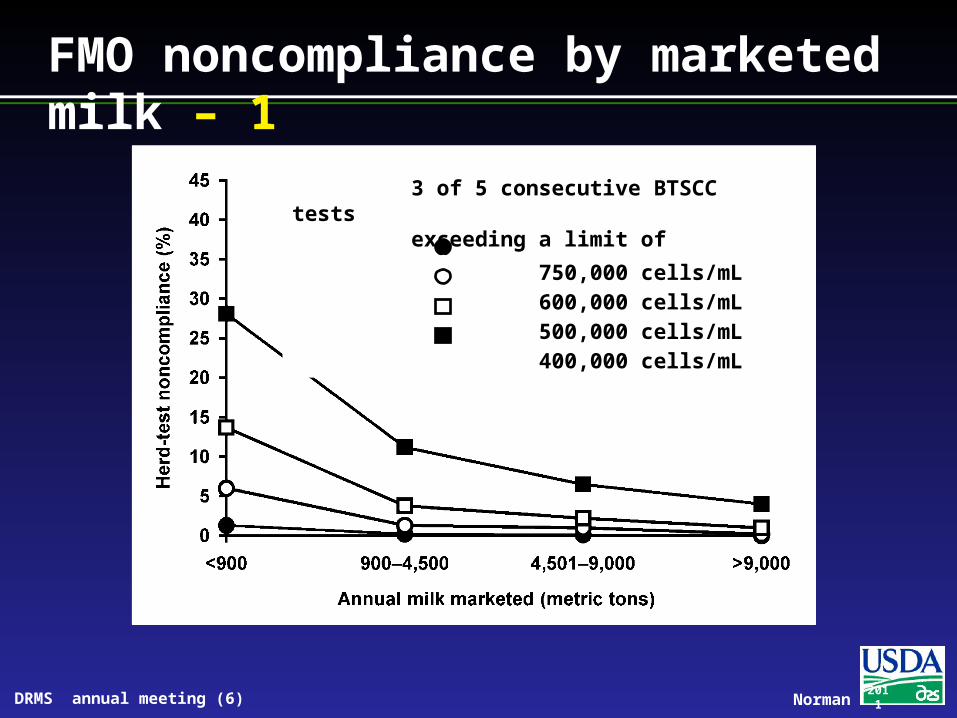
FMO noncompliance by marketed milk – 1
3 of 5 consecutive BTSCC testsexceeding a limit of
750,000 cells/mL 600,000 cells/mL 500,000 cells/mL 400,000 cells/mL

NormanDRMS annual meeting (7) 2011
FMO noncompliance by marketed milk – 2
4 consecutive 3-mo geometric mean BTSCCexceeding a limit of
750,000 cells/mL 600,000 cells/mL 500,000 cells/mL 400,000 cells/mL

NormanDRMS annual meeting (8) 2011
FMO noncompliance by marketed milk – 3
3-mo geometric mean BTSCC exceeding limitplus next BTSCC test exceeding a limit of
750,000 cells/mL 550,000 cells/mL

NormanDRMS annual meeting (9) 2011
Topic 2
Genotyping
NormanDRMS annual meeting (10) 2011
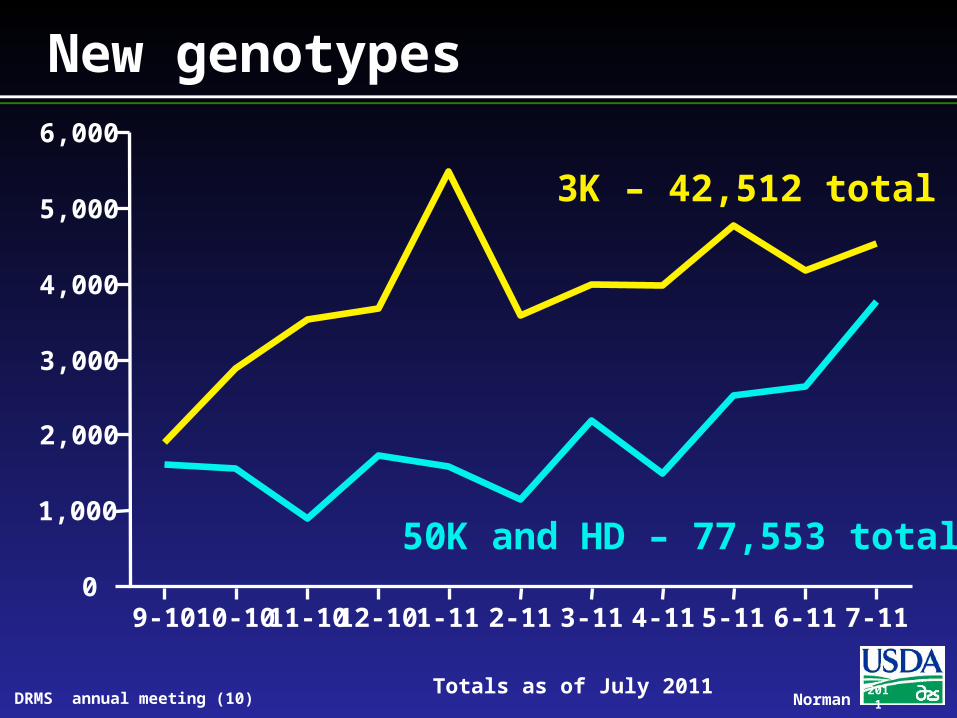
New genotypes
0
1,000
2,000
3,000
4,000
5,000
6,000
9-10 10-10 11-10 12-10 1-11 2-11 3-11 4-11 5-11 6-11 7-11
50K and HD – 77,553 total
Totals as of July 2011
3K – 42,512 total
NormanDRMS annual meeting (11) 2011
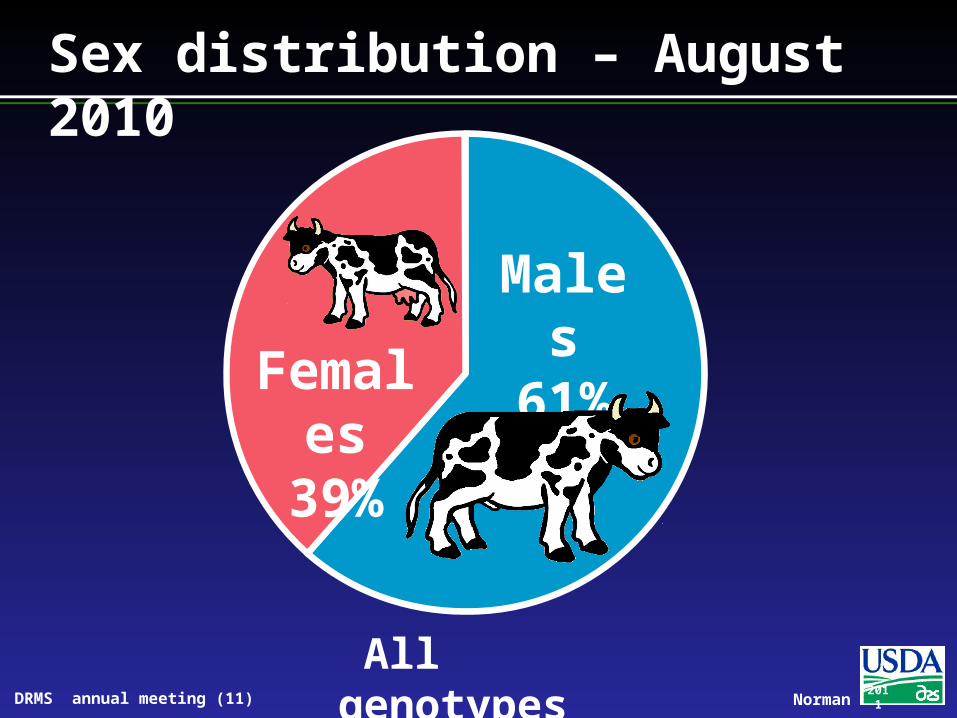
Sex distribution – August 2010
Males61%
Females39%
All genotypes

NormanDRMS annual meeting (12) 2011
Sex distribution – July 2011
Males42%
All genotypes
Females58%

NormanDRMS annual meeting (13) 2011
3K sample characteristics
93% of 3K genotypes are from females
3K sample types include
− Hair (79%)
− Blood (10%)
− Nasal (10%)
− Semen (1%)

NormanDRMS annual meeting (14) 2011
Topic 3
Reporting of haplotypes with recessive effects
on fertility

NormanDRMS annual meeting (15) 2011
Introduction
5 haplotypes with recessive effects on fertility discovered Additive effects small and in EBVs All populations already carry these
At least 19 countries have “health” laws that exclude carriers of defects Only countries that test are banned?
Import restrictions make little sense

NormanDRMS annual meeting (16) 2011
Recessive defect discovery
Check for homozygous haplotypes 7 – 90 expected, but none observed 5 of top 11 confirmed as lethal 936 – 52,449 carrier sire carrier MGS fertility
records 3.0 – 3.7% lower conception rates Some slightly higher stillbirth rates
Confirmed brachyspina same way
NormanDRMS annual meeting (17) 2011
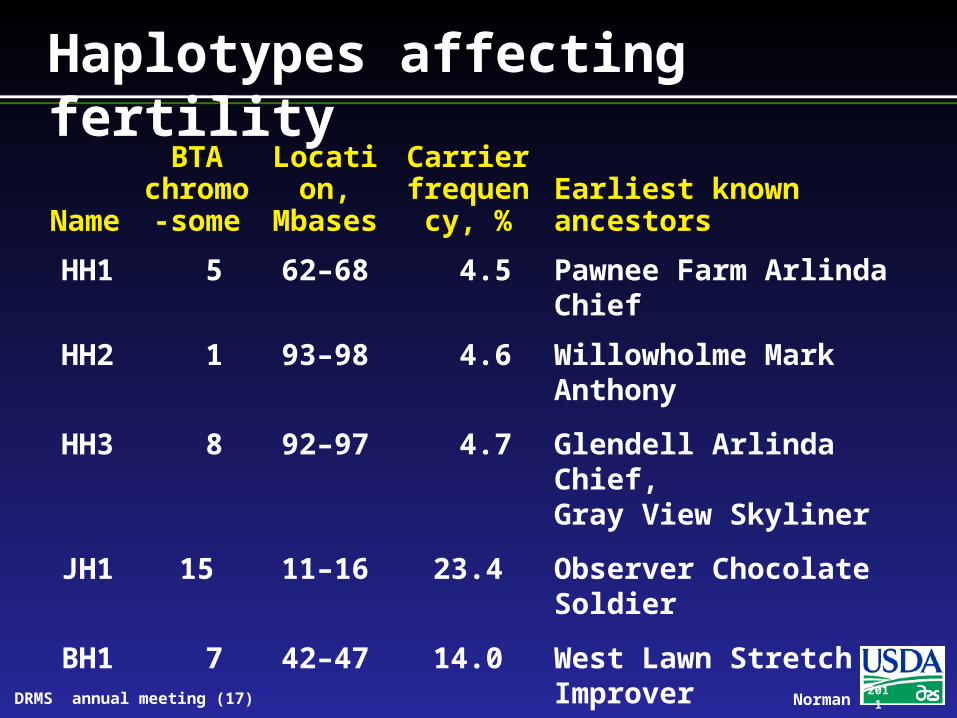
Haplotypes affecting fertility
Name
BTA chromo-
someLocation, Mbases
Carrier frequency,
% Earliest known ancestors
HH1 5 62–68 4.5 Pawnee Farm Arlinda Chief
HH2 1 93–98 4.6 Willowholme Mark Anthony
HH3 8 92–97 4.7 Glendell Arlinda Chief,Gray View Skyliner
JH1 15 11–16 23.4 Observer Chocolate Soldier
BH1 7 42–47 14.0 West Lawn Stretch Improver

NormanDRMS annual meeting (18) 2011
Haplo-type
Additive effect, CR
Sire x MGS interaction
NR60NR100
NR140 CR280CVM –0.12 –0.9 –1.5 –1.9 –2.9
BY –0.46 –2.2 –2.3 –2.3 –2.5HH1 –0.35 –1.1 –1.6 –2.0 –3.1HH2 –0.36 –1.7 –3.0 –2.9 –3.0HH3 –0.36 –3.1 –3.4 –3.4 –3.2JH1 –2.22 –3.7 –3.7 –3.6 –3.7BH1 –0.98 –2.5 –3.7 –2.9 –3.4
Additive and nonadditive effects*
*Nonreturn rates or full gestation conception

NormanDRMS annual meeting (19) 2011
Haplo-type
Conception rateBull Service sire Heifer Cow
BY Ramos N/A +0.1 +5.2HH1 Lucius +3.1 +2.5 +2.5HH2 Colby +2.2 +5.2 +5.4HH3 O-Man +0.6 +2.1 +3.5JH1 Country –0.5 +2.7 +3.2BH1 Payoff +1.5 +1.5 +3.4
Carrier bulls with high fertility
NormanDRMS annual meeting (20) 2011
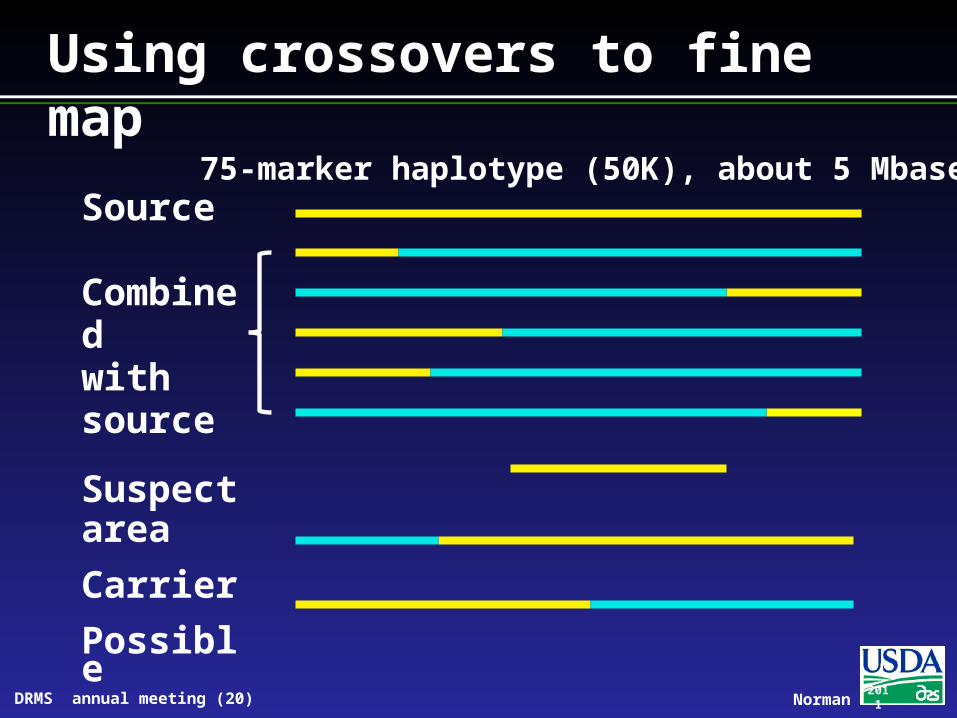
Using crossovers to fine map
Source
Combinedwithsource
SuspectareaCarrierPossible
75-marker haplotype (50K), about 5 Mbases

NormanDRMS annual meeting (21) 2011
Haplo-type
Crossover haplotypes
SNPs in suspect
area
That combined
with source
Within suspect
area
That contained
suspect areaBY 10 66 31 28
HH1 8 51 26 39HH2 9 38 15 25HH3 3 54 0 70JH1 10 22 19 17BH1 0 4 0 74
Crossovers used in fine mapping

NormanDRMS annual meeting (22) 2011
3 methods to detect carriers Use all genotypes and pedigrees One at a time (ignore pedigree) Find and test for causative mutation
Without vs. with haplotyping 2.5% false positives, 0.05% false negatives Similar to Georges et al. (2010) brachyspina
haplotype test
Detection without haplotyping
NormanDRMS annual meeting (23) 2011
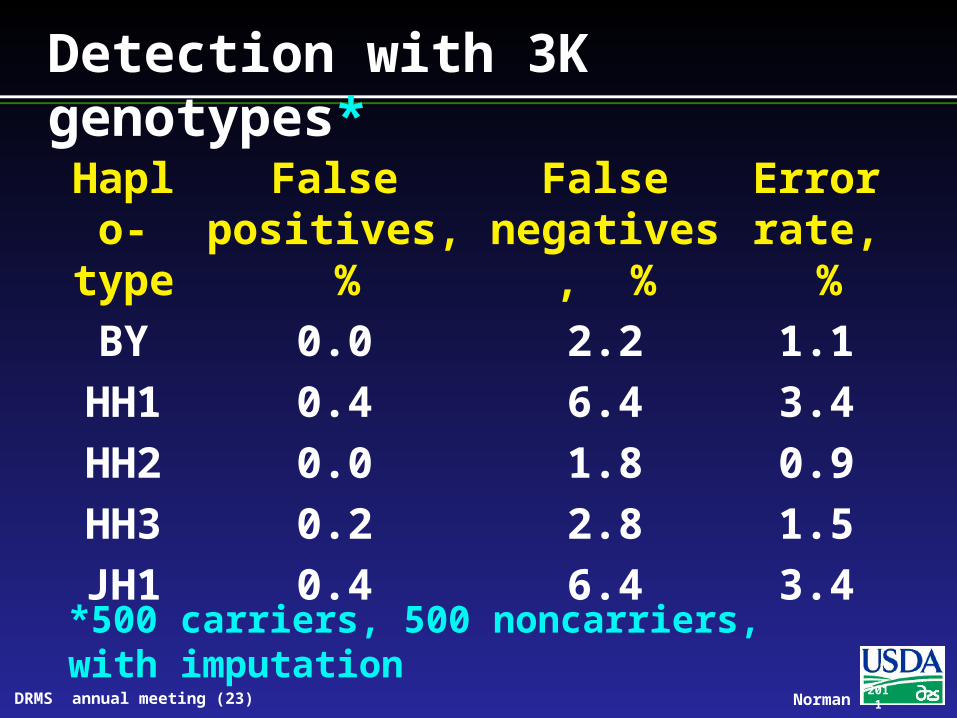
Haplo-type
False positives, %
False negatives, %
Errorrate, %
BY 0.0 2.2 1.1HH1 0.4 6.4 3.4HH2 0.0 1.8 0.9HH3 0.2 2.8 1.5JH1 0.4 6.4 3.4
Detection with 3K genotypes*
*500 carriers, 500 noncarriers, with imputation

NormanDRMS annual meeting (24) 2011
Conclusions
Recessive defects found in each breed(HH1, HH2, HH3, JH1, BH1) Officially reported in August Most embryo losses at <60 days
Breeders should select for fertility (not against individual defects) and mate carriers to noncarriers
Crossovers used for fine mapping

NormanDRMS annual meeting (25) 2011
Acknowledgment
Paul VanRaden (AIPL) discovered the haplotypes that affect fertility with the assistance of:
Dan Null (AIPL)Katie Olson (NAAB)Jana Hutchison (AIPL)