Embed Size (px)
Citation preview
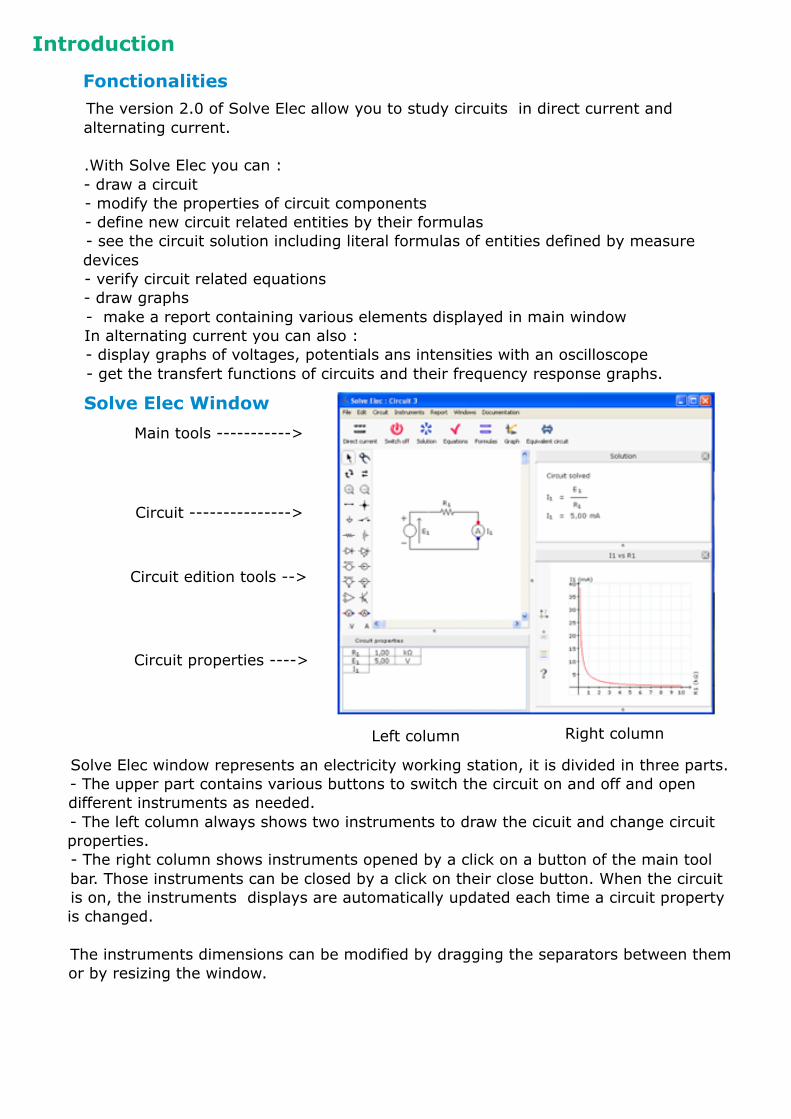
Solve Elec Window
Introduction
FonctionalitiesThe version 2.0 of Solve Elec allow you to study circuits in direct current and alternating current.
.With Solve Elec you can :- draw a circuit- modify the properties of circuit components- define new circuit related entities by their formulas- see the circuit solution including literal formulas of entities defined by measure devices- verify circuit related equations- draw graphs- make a report containing various elements displayed in main windowIn alternating current you can also :- display graphs of voltages, potentials ans intensities with an oscilloscope- get the transfert functions of circuits and their frequency response graphs.
Left column Right column
Solve Elec window represents an electricity working station, it is divided in three parts.- The upper part contains various buttons to switch the circuit on and off and open different instruments as needed. - The left column always shows two instruments to draw the cicuit and change circuit properties.- The right column shows instruments opened by a click on a button of the main tool bar. Those instruments can be closed by a click on their close button. When the circuit is on, the instruments displays are automatically updated each time a circuit property is changed.
The instruments dimensions can be modified by dragging the separators between them or by resizing the window.
Main tools ----------->
Circuit --------------->
Circuit edition tools -->
Circuit properties ---->
Direct current (DC) and alternating current (AC)
The button at top left corner of the window indicates the circuit operating mode. Click that button to change the operating mode : the window will display a new empty circuit, as some components can't be used in AC and DC.
Direct current
The circuit may contain the following components :switch, resistor, potentiometer, diodes, voltage and intensity sources, integrated amplifier, transistor. The voltage sources drive a constant voltage, the intensity sources drive a constant intensity.
Sinusoidal alternating current.
The voltages, intensities and potentials are sine waves of same frequency. Example for a voltage : u( t ) = Umax sin( ω t + θ ) with an amplitude Umax, a pulsation ω, a phase θ.
The rms value of u is
The frequency f is
The sine waves are represented as complex values visible in circuit properties.Complex quantities are written in bold. The complex representation is used to solve the circuit. The complex formulas, rms values and phases are computed and displayed in the solution.
In AC current all components must be linear to ensure that the voltages and intensities are sine waves. The circuit may contain the following components : switch, resistor, potentiometer, voltage and intensity sources, integrated amplifier in linear mode only.
Circuit drawing
The circuit is drawn and modified with the tools displayed in the box on the left of the drawing. The circuit is automatically switched off when it is modified.
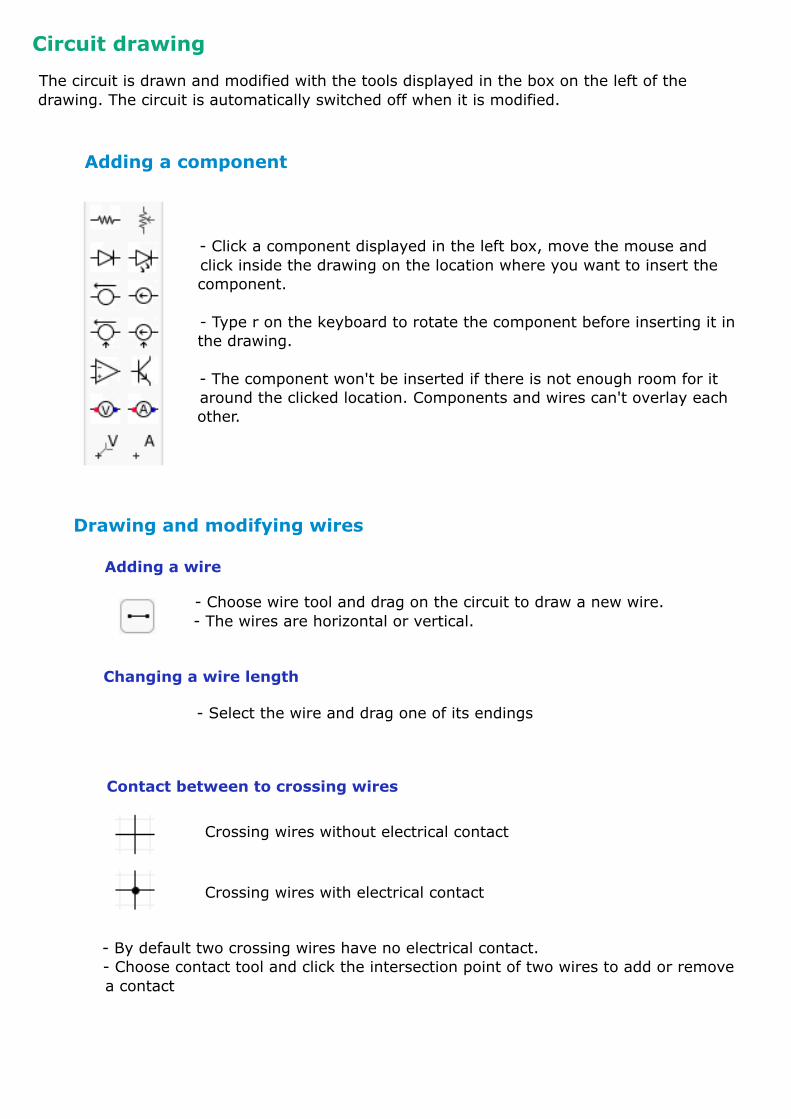
Adding a component
- Click a component displayed in the left box, move the mouse and click inside the drawing on the location where you want to insert the component.
- Type r on the keyboard to rotate the component before inserting it in the drawing.
- The component won't be inserted if there is not enough room for it around the clicked location. Components and wires can't overlay each other.
Drawing and modifying wires
- Choose wire tool and drag on the circuit to draw a new wire.- The wires are horizontal or vertical.
Adding a wire
Changing a wire length
Contact between to crossing wires
- Select the wire and drag one of its endings
- By default two crossing wires have no electrical contact.- Choose contact tool and click the intersection point of two wires to add or remove a contact
Crossing wires without electrical contact
Crossing wires with electrical contact
Selecting drawing elements
Click selection tool to select one or more elements in the drawing.
Selecting one element
Selecting several elements
- Click the element with select tool.- To select a component, you can also click one of its properties displayed in the circuit properties below the drawing.
- A selected element is drawn in blue. If it is a component, its properties are also selected in the circuit properties.
- Drag the mouse over the drawing to select several elements.- Choose menu Edit > Select all to select all the elements of the drawing.
Deselecting selected elements
- Click an empty location in the drawing with selection tool.
Moving elements
- Select one or several elements and drag the selection- You can also use the keyboard arrow keys to move the selected elements.
- In case the moved selection overlays another part of the drawing, the move is cancelled, the selection is redrawn at its initial location.
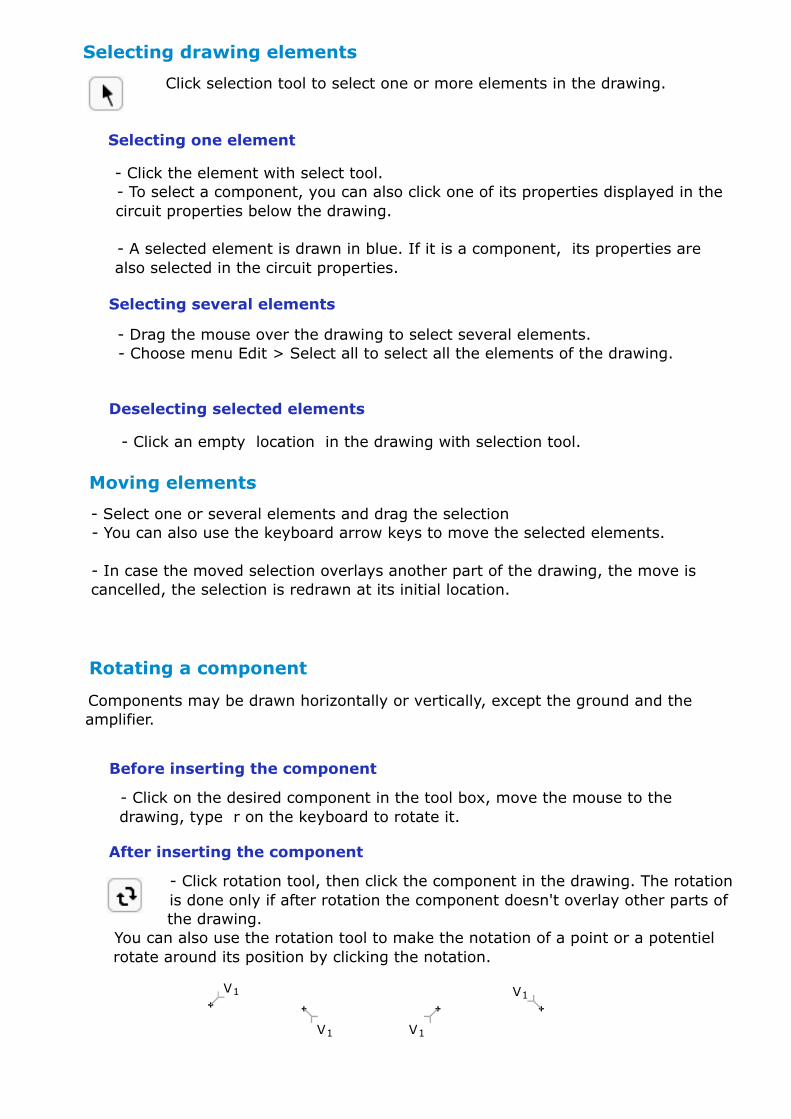
Rotating a component
Before inserting the component
After inserting the component
- Click on the desired component in the tool box, move the mouse to the drawing, type r on the keyboard to rotate it.
- Click rotation tool, then click the component in the drawing. The rotation is done only if after rotation the component doesn't overlay other parts of the drawing.
Components may be drawn horizontally or vertically, except the ground and the amplifier.
You can also use the rotation tool to make the notation of a point or a potentiel rotate around its position by clicking the notation.
V1V1
V1
V1 V1
V1
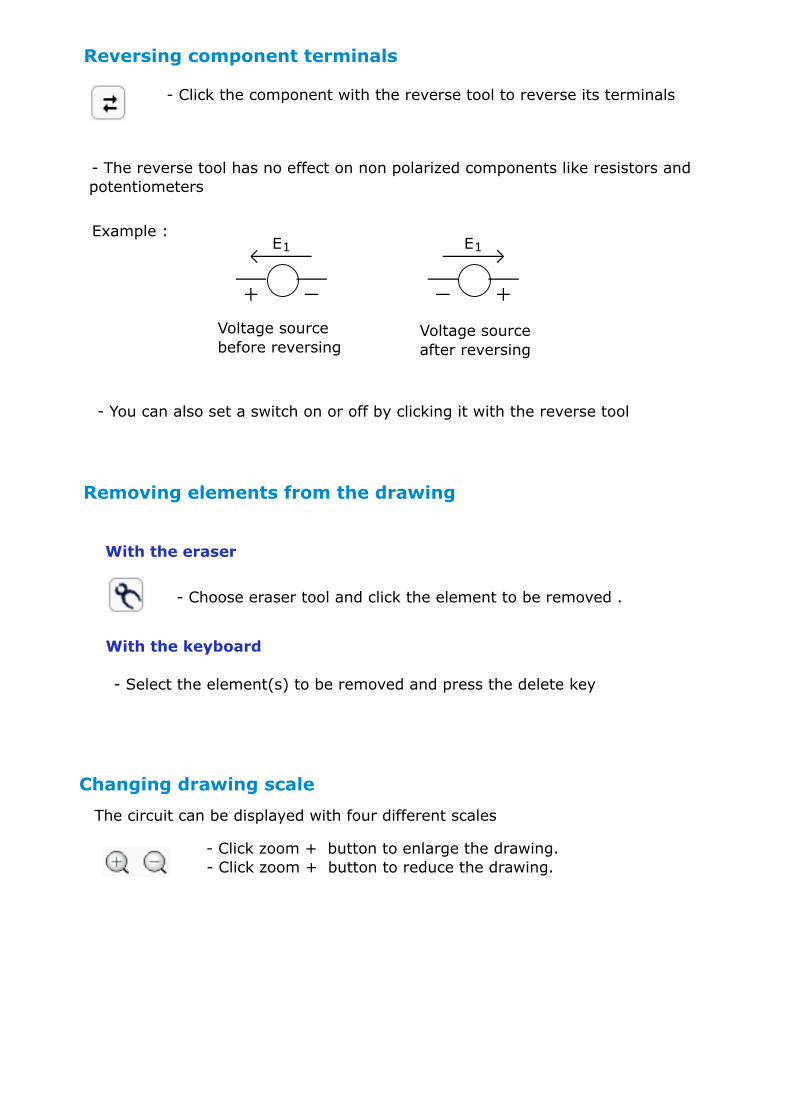
Reversing component terminals
- Click the component with the reverse tool to reverse its terminals
Example :
Voltage source before reversing
Voltage source after reversing
- The reverse tool has no effect on non polarized components like resistors and potentiometers
Removing elements from the drawing
With the keyboard
With the eraser
- Choose eraser tool and click the element to be removed .
- Select the element(s) to be removed and press the delete key
Changing drawing scale
The circuit can be displayed with four different scales
- Click zoom + button to enlarge the drawing.- Click zoom + button to reduce the drawing.
- You can also set a switch on or off by clicking it with the reverse tool
E1 E1

Using the clipboard
Copy
Cut
Paste
- Select drawing elements to be copied - Select menu Edit > Copy- The elements are stored in the clipboard and they remain in the drawing.
- Select menu Edit > Paste.- The clipboard content is pasted at the last clicked position in the drawing, if there is enough room for it.
Drawing norm
- The circuit can be drawn with the US or the European norm
- The norm can be changed in Solve Elec Preferences
- Select drawing elements to be cut - Select menu Edit > Cut- The elements are stored in the clipboard and they are removed from the drawing.
Save and open
Choose these menus to save the circuit in a file
Choose this menu to open a circuit.The previous circuit is replaced by the opened one.
Choose this menu to save the selected part of the circuit in a file.The exported file is different from the saved file, but has the same file format.
Choose this menu to import a circuit part inside the current circuit.The imported circuit is added to the current circuit at the last clicked position, if possible
The notations of the imported circuit which are already used in the current circuit are modfied to avoid having different components with the same notation.
You can quickly build a complex circuit by importing its parts from files.
Menu File > Save
Menu File > Save as...
Exportation and importation
Menu File > Export
Menu File > Import
Circuits files
Menu File > Open
Circuit elements
Components
Components properties
- Each component is described by a set of properties : notation(s), values(s) and unit(s), etc ... Those properties are displayed in the circuit properties list, below the drawing. When a component is selected in the drawing, the line showing its properties is also selected. When the mouse is over a property, the description of this property is displayed above the properties list.
- All the properties may be changed. For instance, to change a resistor value, click the cell containing this value, type the new value followed by the return key to validate the change.
- When a property is modified, the window display is updated. For instance, a displayed graph is automatically recomputed for the new value and redrawn.
Notations
- The first property of each component is its notation. It represents a typical quantity of the component or the name given to the component (for a switch, a diode, an amplifier and a transistor). Each component notation is displayed in the drawing and in the first column of the circuit properties list.Examples : E1 is the electromotive force of a voltage source, A1 is the name of an amplifier.
- To change a component notation, click the cell containing this notation and type the new notation
- A notation must begin with a letter, following characters must be letters or digits.
- Two components of the same kind may share the same notation, except switches, diods, amplifiers and transistors. For instance two voltage source can have the same electromotive force E, but two transistors can't have the same name T.
Numerical values
- To change the numerical value of a quantity, click the cell containing this value and type the new value.
- The number of significant digits used to display the numerical values can be changed in Solve Elec preferences.
Components description
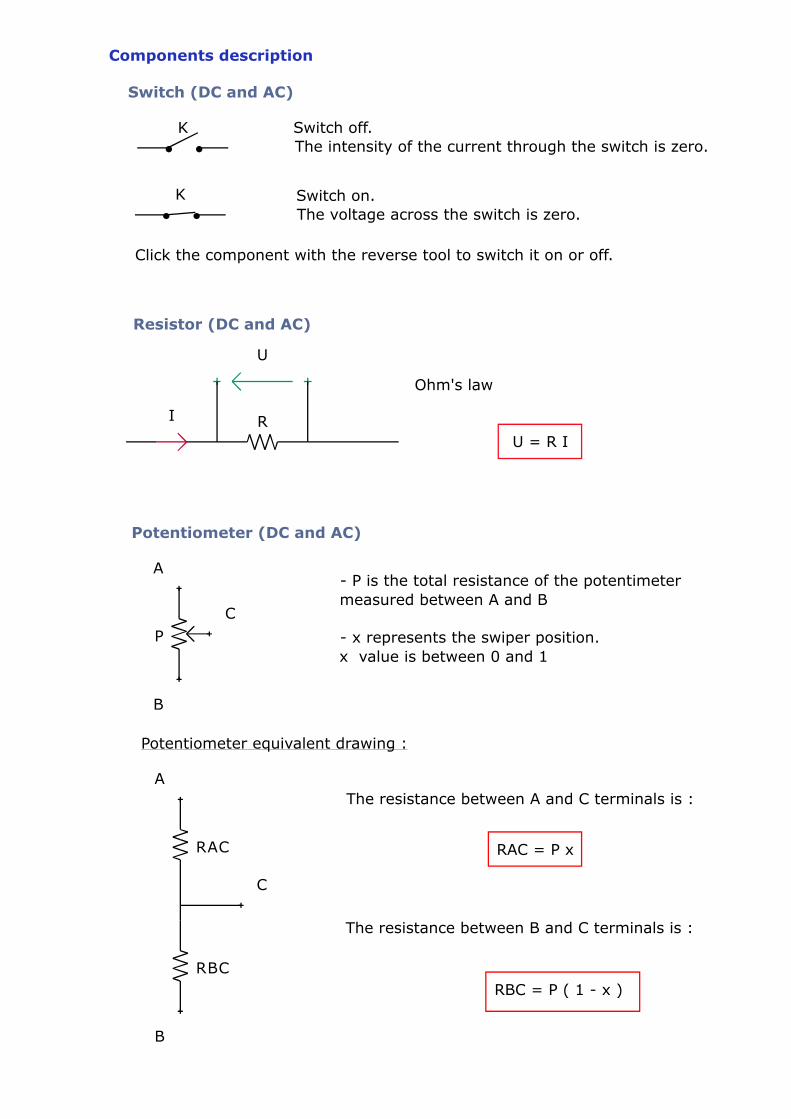
Switch (DC and AC)
Switch off.The intensity of the current through the switch is zero.
Switch on.The voltage across the switch is zero.
Click the component with the reverse tool to switch it on or off.
Resistor (DC and AC)
Ohm's law
U = R I
Potentiometer (DC and AC)
- P is the total resistance of the potentimeter measured between A and B
- x represents the swiper position. x value is between 0 and 1
Potentiometer equivalent drawing :
The resistance between A and C terminals is :
RAC = P x
The resistance between B and C terminals is :
RBC = P ( 1 - x )
K
K
R
U
I
P
C
B
A
RAC
RBC
A
B
C
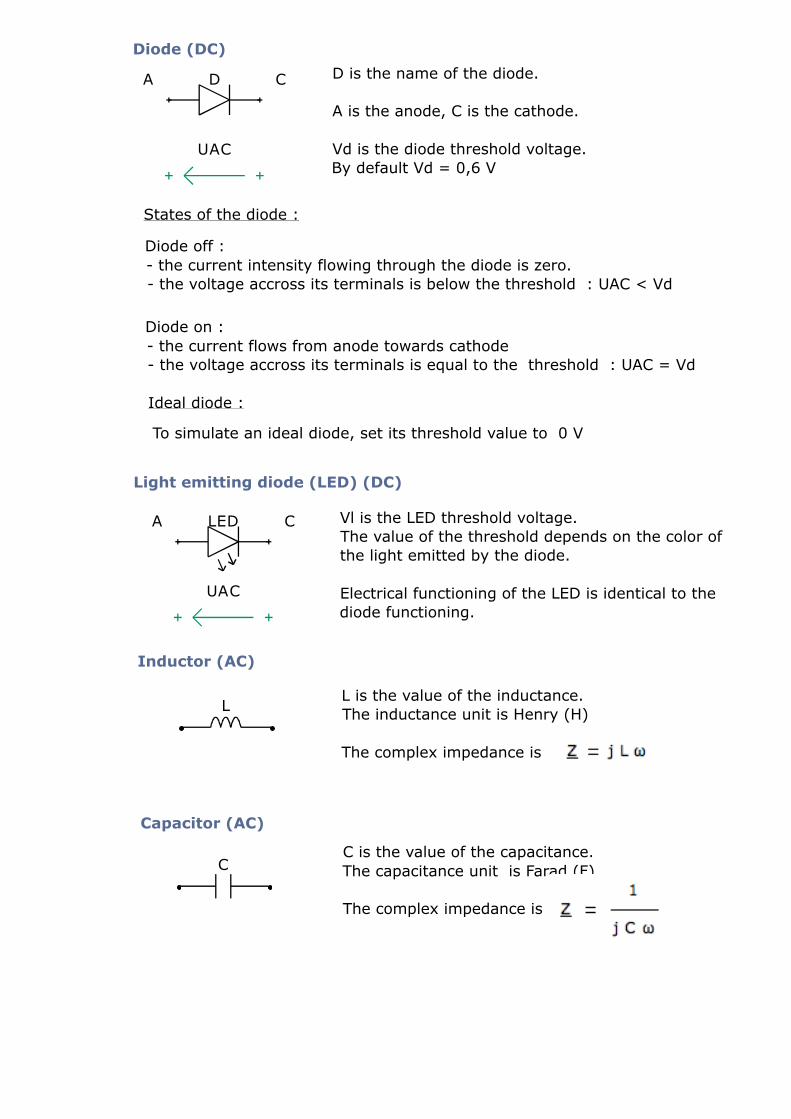
Diode (DC)
D is the name of the diode.
A is the anode, C is the cathode.
Vd is the diode threshold voltage. By default Vd = 0,6 V
States of the diode :
Diode off : - the current intensity flowing through the diode is zero.- the voltage accross its terminals is below the threshold : UAC < Vd
Diode on : - the current flows from anode towards cathode- the voltage accross its terminals is equal to the threshold : UAC = Vd
Ideal diode :
To simulate an ideal diode, set its threshold value to 0 V
Light emitting diode (LED) (DC)
Vl is the LED threshold voltage.The value of the threshold depends on the color of the light emitted by the diode.
Electrical functioning of the LED is identical to the diode functioning.
Inductor (AC)
L is the value of the inductance.The inductance unit is Henry (H)
The complex impedance is
Capacitor (AC)
C is the value of the capacitance.The capacitance unit is Farad (F)
The complex impedance is
A
UAC
D C
A
UAC
CLED
L
C
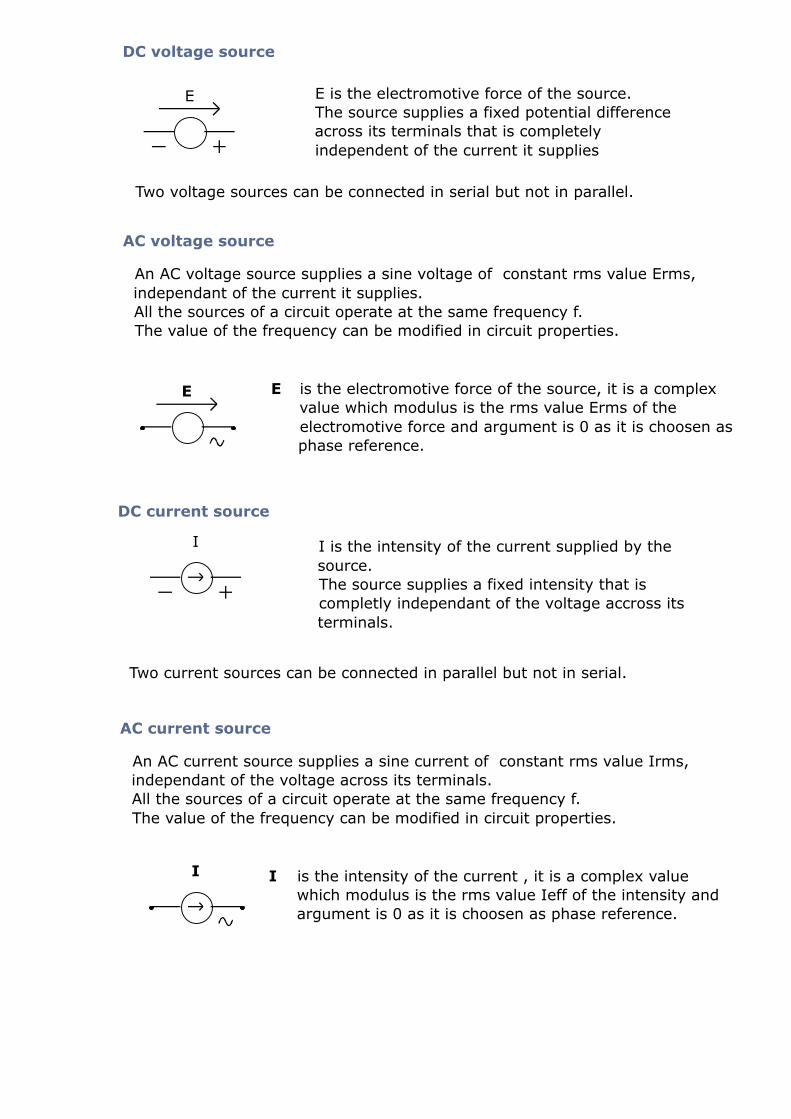
DC voltage source
E E is the electromotive force of the source.The source supplies a fixed potential difference across its terminals that is completely independent of the current it supplies
Two voltage sources can be connected in serial but not in parallel.
DC current source
I I is the intensity of the current supplied by the source.The source supplies a fixed intensity that is completly independant of the voltage accross its terminals.
Two current sources can be connected in parallel but not in serial.
AC voltage source
An AC voltage source supplies a sine voltage of constant rms value Erms, independant of the current it supplies.All the sources of a circuit operate at the same frequency f.The value of the frequency can be modified in circuit properties.
is the electromotive force of the source, it is a complex value which modulus is the rms value Erms of the electromotive force and argument is 0 as it is choosen as phase reference.
E E
An AC current source supplies a sine current of constant rms value Irms, independant of the voltage across its terminals.All the sources of a circuit operate at the same frequency f.The value of the frequency can be modified in circuit properties.
AC current source
is the intensity of the current , it is a complex value which modulus is the rms value Ieff of the intensity and argument is 0 as it is choosen as phase reference.
I I
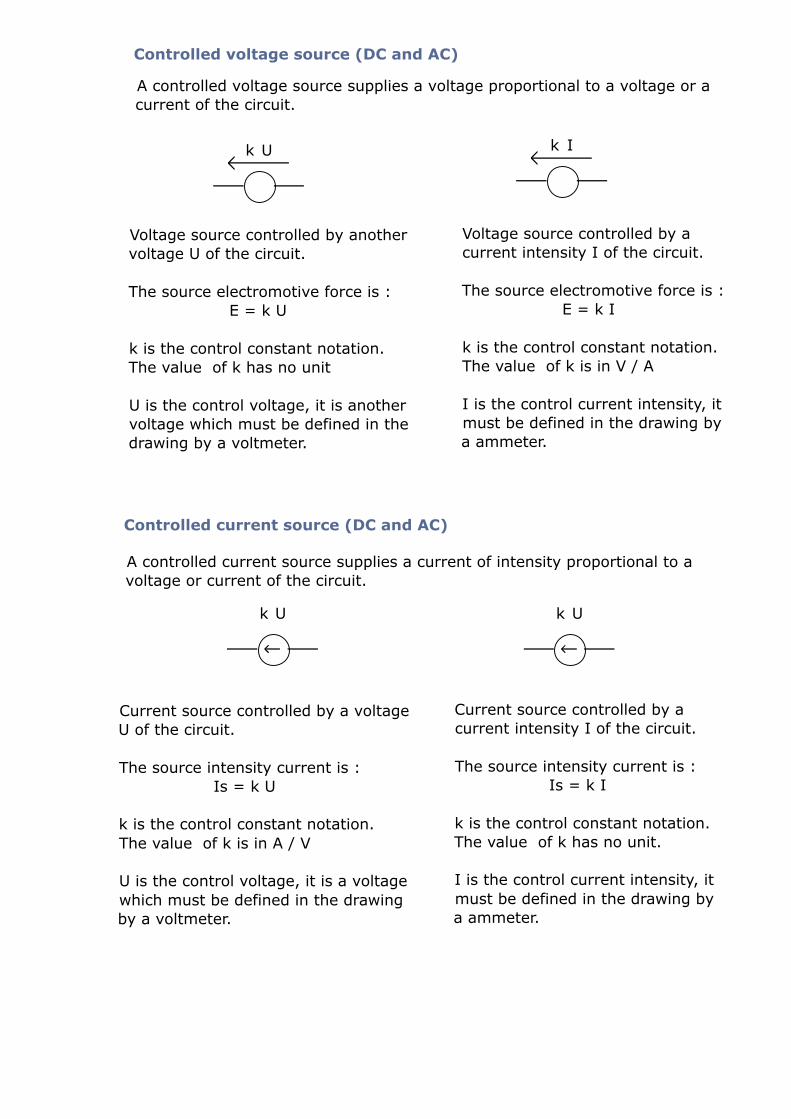
Controlled voltage source (DC and AC)
Voltage source controlled by a current intensity I of the circuit.
The source electromotive force is : E = k I
k is the control constant notation.The value of k is in V / A
I is the control current intensity, it must be defined in the drawing by a ammeter.
A controlled voltage source supplies a voltage proportional to a voltage or a current of the circuit.
Voltage source controlled by another voltage U of the circuit.
The source electromotive force is : E = k U
k is the control constant notation.The value of k has no unit
U is the control voltage, it is another voltage which must be defined in the drawing by a voltmeter.
Controlled current source (DC and AC)
Current source controlled by a current intensity I of the circuit.
The source intensity current is : Is = k I
k is the control constant notation.The value of k has no unit.
I is the control current intensity, it must be defined in the drawing by a ammeter.
A controlled current source supplies a current of intensity proportional to a voltage or current of the circuit.
Current source controlled by a voltage U of the circuit.
The source intensity current is : Is = k U
k is the control constant notation.The value of k is in A / V
U is the control voltage, it is a voltage which must be defined in the drawing by a voltmeter.
k U k I
k U k U
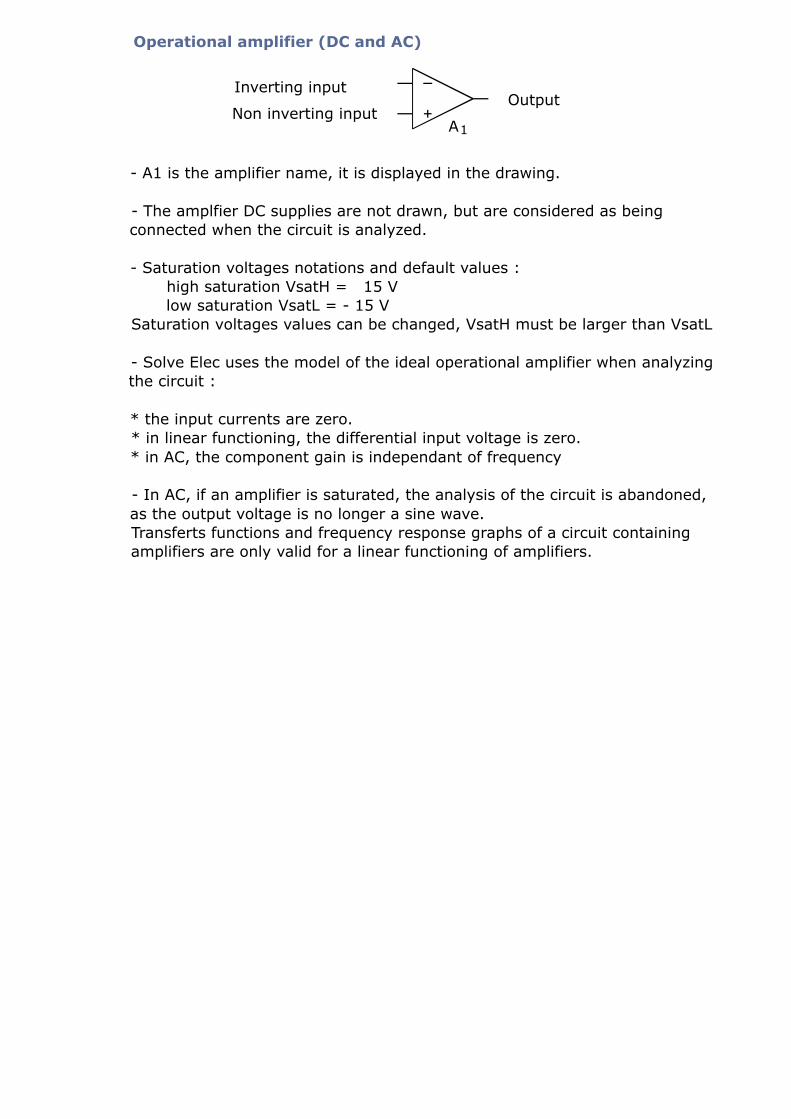
Operational amplifier (DC and AC)
Inverting input
Non inverting inputOutput
- A1 is the amplifier name, it is displayed in the drawing.
- The amplfier DC supplies are not drawn, but are considered as being connected when the circuit is analyzed.
- Saturation voltages notations and default values : high saturation VsatH = 15 V low saturation VsatL = - 15 VSaturation voltages values can be changed, VsatH must be larger than VsatL
- Solve Elec uses the model of the ideal operational amplifier when analyzing the circuit :
* the input currents are zero.* in linear functioning, the differential input voltage is zero.* in AC, the component gain is independant of frequency
- In AC, if an amplifier is saturated, the analysis of the circuit is abandoned, as the output voltage is no longer a sine wave.Transferts functions and frequency response graphs of a circuit containing amplifiers are only valid for a linear functioning of amplifiers.
A1
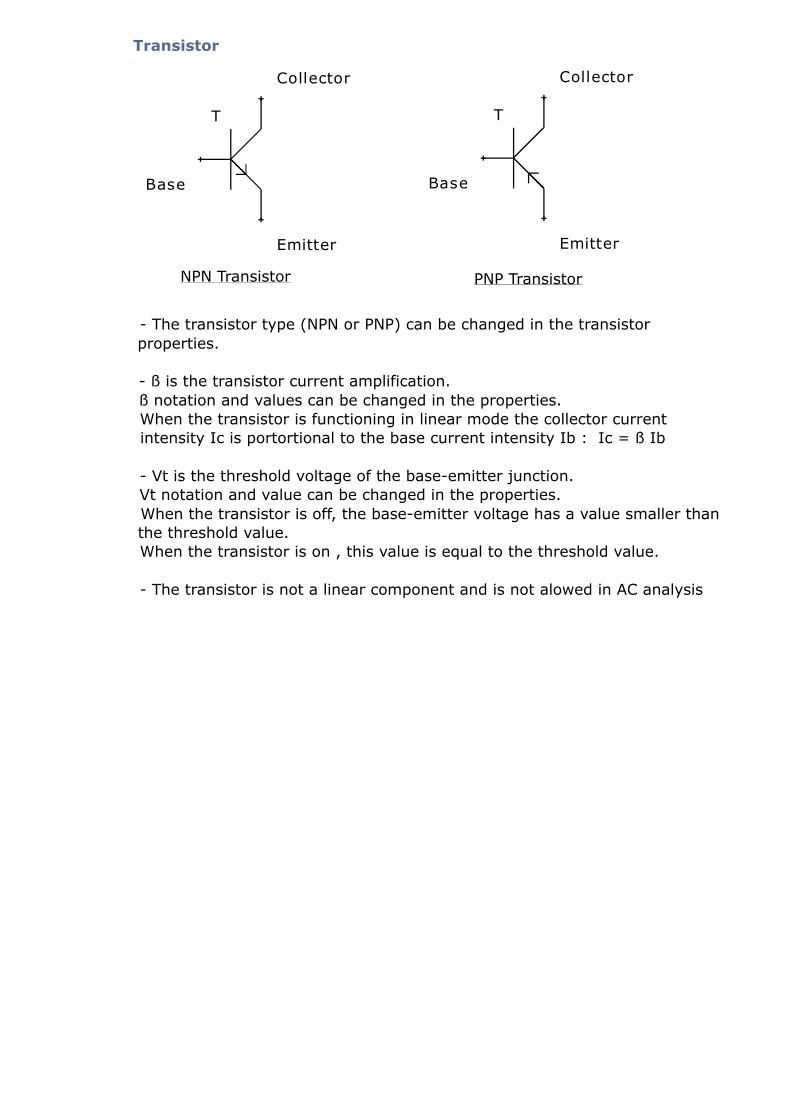
Transistor
T
Collector
Emitter
Base Base
Collector
Emitter
T
PNP TransistorNPN Transistor
- The transistor type (NPN or PNP) can be changed in the transistor properties.
- ß is the transistor current amplification.ß notation and values can be changed in the properties.When the transistor is functioning in linear mode the collector current intensity Ic is portortional to the base current intensity Ib : Ic = ß Ib
- Vt is the threshold voltage of the base-emitter junction.Vt notation and value can be changed in the properties.When the transistor is off, the base-emitter voltage has a value smaller than the threshold value.When the transistor is on , this value is equal to the threshold value.
- The transistor is not a linear component and is not alowed in AC analysis
Meters
Use of meters
Voltmeter
Ammeter
Probe
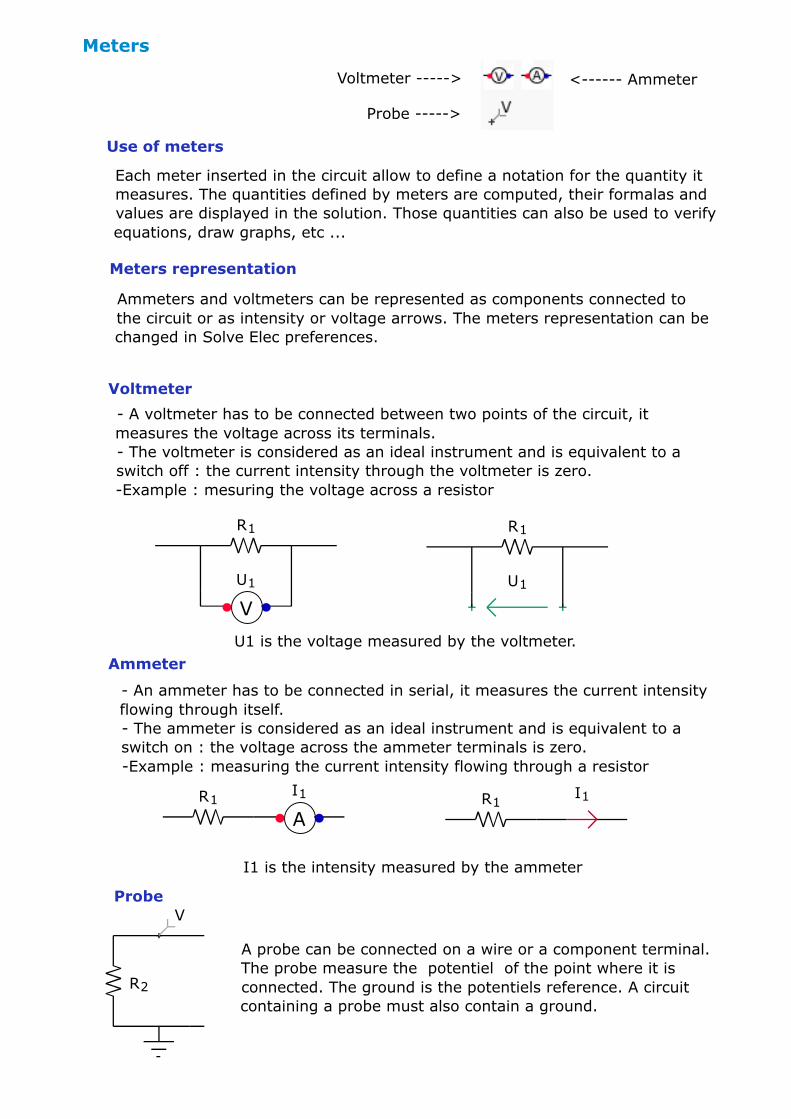
Each meter inserted in the circuit allow to define a notation for the quantity it measures. The quantities defined by meters are computed, their formalas and values are displayed in the solution. Those quantities can also be used to verify equations, draw graphs, etc ...
Voltmeter -----> <------ Ammeter
Probe ----->
- A voltmeter has to be connected between two points of the circuit, it measures the voltage across its terminals.- The voltmeter is considered as an ideal instrument and is equivalent to a switch off : the current intensity through the voltmeter is zero.-Example : mesuring the voltage across a resistor
U1 is the voltage measured by the voltmeter.
Meters representation
Ammeters and voltmeters can be represented as components connected to the circuit or as intensity or voltage arrows. The meters representation can be changed in Solve Elec preferences.
- An ammeter has to be connected in serial, it measures the current intensity flowing through itself.- The ammeter is considered as an ideal instrument and is equivalent to a switch on : the voltage across the ammeter terminals is zero.-Example : measuring the current intensity flowing through a resistor
I1 is the intensity measured by the ammeter
A probe can be connected on a wire or a component terminal. The probe measure the potentiel of the point where it is connected. The ground is the potentiels reference. A circuit containing a probe must also contain a ground.
V
U1
R1
U1
R1
R1I1R1
A
I1
R2
V
Ground
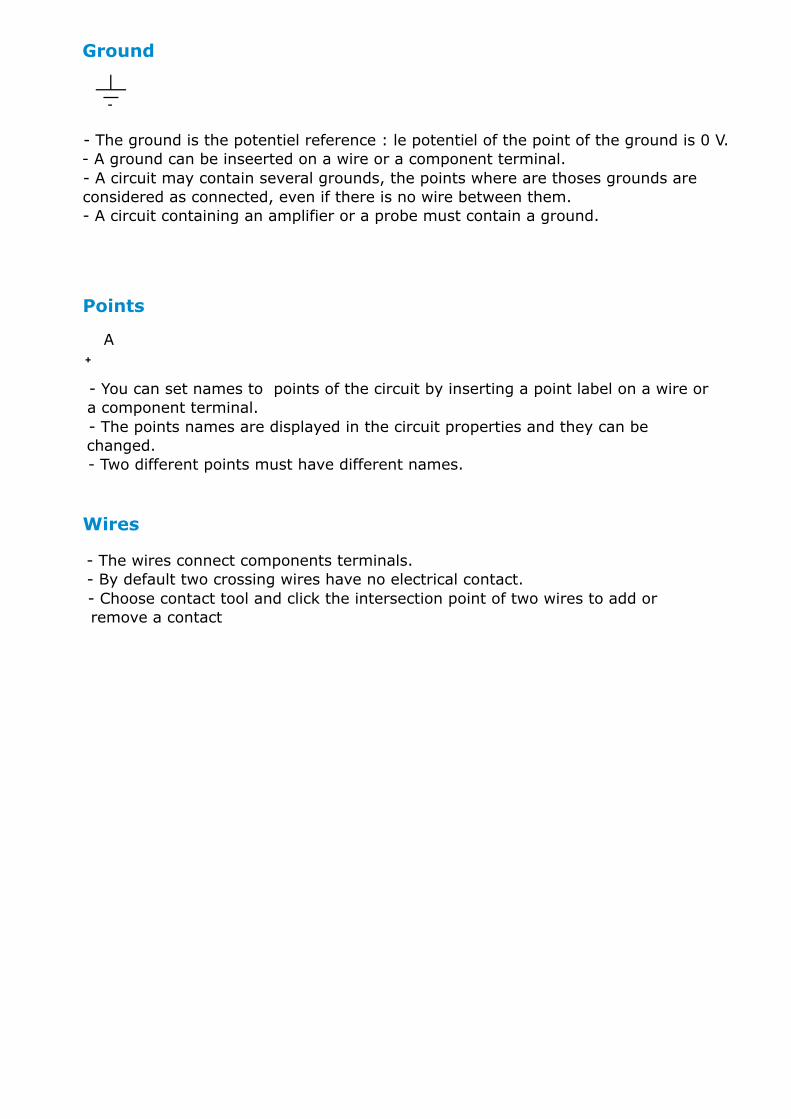
- The ground is the potentiel reference : le potentiel of the point of the ground is 0 V.- A ground can be inseerted on a wire or a component terminal.- A circuit may contain several grounds, the points where are thoses grounds are considered as connected, even if there is no wire between them.- A circuit containing an amplifier or a probe must contain a ground.
A
Points
- You can set names to points of the circuit by inserting a point label on a wire or a component terminal. - The points names are displayed in the circuit properties and they can be changed.- Two different points must have different names.
Wires
- The wires connect components terminals.- By default two crossing wires have no electrical contact.- Choose contact tool and click the intersection point of two wires to add or remove a contact
Formulas
Formulas tool
Formulas list
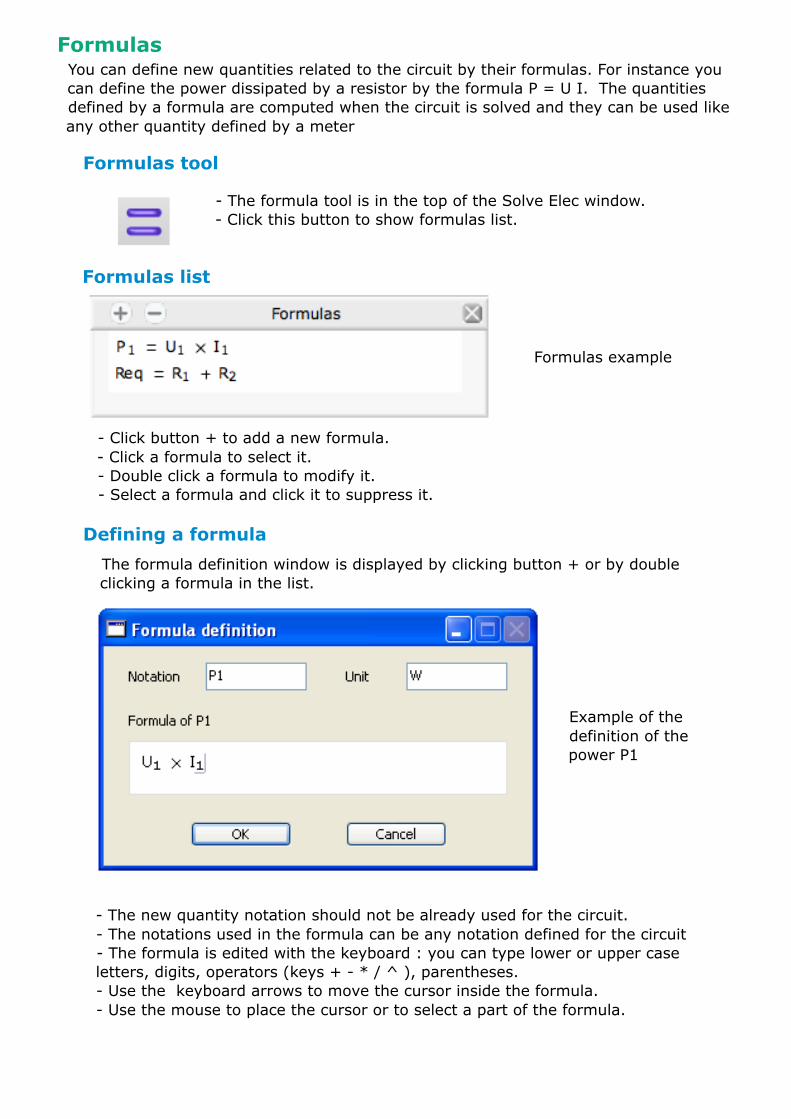
You can define new quantities related to the circuit by their formulas. For instance you can define the power dissipated by a resistor by the formula P = U I. The quantities defined by a formula are computed when the circuit is solved and they can be used like any other quantity defined by a meter
- The formula tool is in the top of the Solve Elec window.- Click this button to show formulas list.
- Click button + to add a new formula.- Click a formula to select it.- Double click a formula to modify it.- Select a formula and click it to suppress it.
Formulas example
Defining a formula
The formula definition window is displayed by clicking button + or by double clicking a formula in the list.
- The new quantity notation should not be already used for the circuit.- The notations used in the formula can be any notation defined for the circuit- The formula is edited with the keyboard : you can type lower or upper case letters, digits, operators (keys + - * / ^ ), parentheses. - Use the keyboard arrows to move the cursor inside the formula.- Use the mouse to place the cursor or to select a part of the formula.
Example of the definition of the power P1
Using formulas
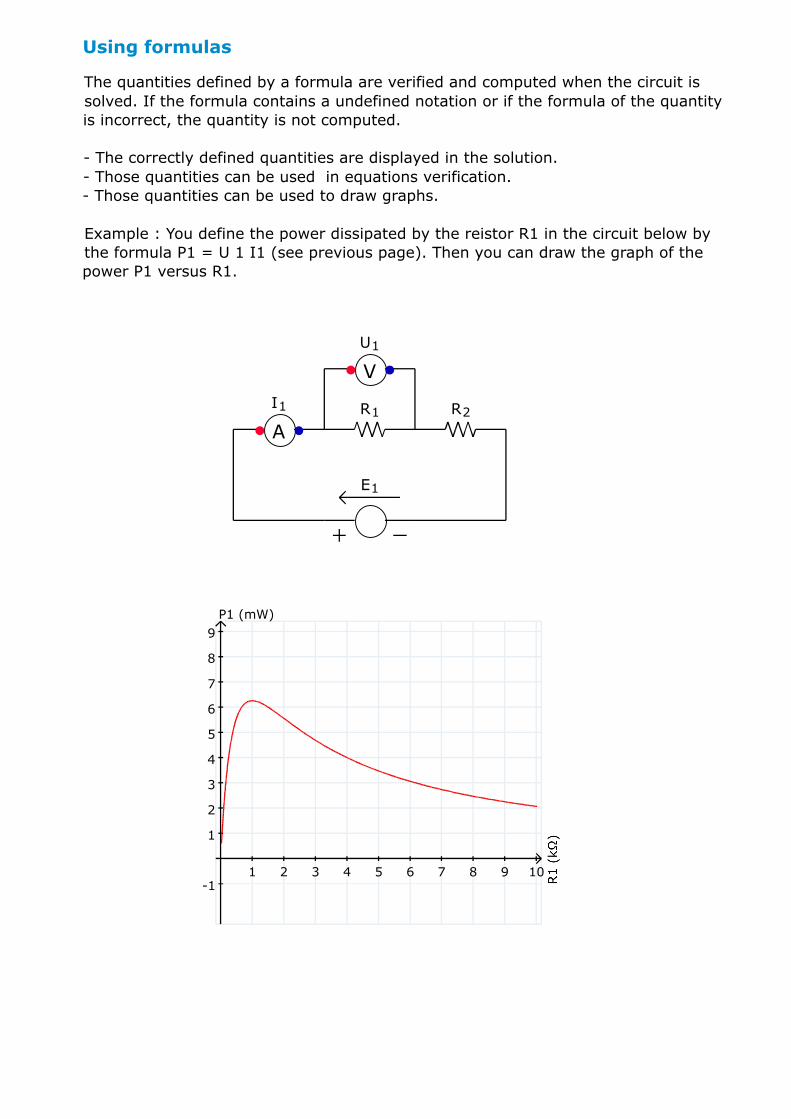
The quantities defined by a formula are verified and computed when the circuit is solved. If the formula contains a undefined notation or if the formula of the quantity is incorrect, the quantity is not computed.
- The correctly defined quantities are displayed in the solution.- Those quantities can be used in equations verification.- Those quantities can be used to draw graphs.
Example : You define the power dissipated by the reistor R1 in the circuit below by the formula P1 = U 1 I1 (see previous page). Then you can draw the graph of the power P1 versus R1.
1 2 3 4 5 6 7 8 9 10
P1 (mW)
-1
1
2
3
4
5
6
7
8
9
R1 R2
A
I1
V
U1
E1
Solution
Displaying the solution
Switching the circuit
Solution computation
When the circuit drawing is done, click the Solution button to display the solution.The solution indicates :- wether the circuit is solved or not- for a circuit containing components functioning in different states, the state of each of those components- the formulas and values of voltages, current intensities, potentials and user defined quantities.
When this button is displayed, the circuit is off, the solution is not computed.Click this button to switch the circuit on.- if the circuit is correct, the solution is computed and the display is updated for the new solution. The circuit becomes on, the button Switch on becomes Switch off- if the circuit is not correct, it remains off.
When this button is displayed, the circuit is on, the solution is computed.You can switch the circuit off by clicking this button, the solution is no longer available.
- When the circuit is off, the solution is computed when one of the buttons Switch on, Solution, Equations or Graph is clicked. If a solution is found, the circuit is switched on.- The circuit is automatically switched off after a circuit drawing modification, as the solution is no longer valid.
- Solve Elec computes the solution by the mean of a formal calculus engine : litteral formulas of intensities and potentials are first computed, then the numerical values are computed using the litteral formulas. The circuit is solved with the Kirchhoff method.
- The computation time might be long for a complex circuit. In such a case, a wait window is displayed, it is then possible to stop the computation by clicking the stop button of this window.
Equations
Example
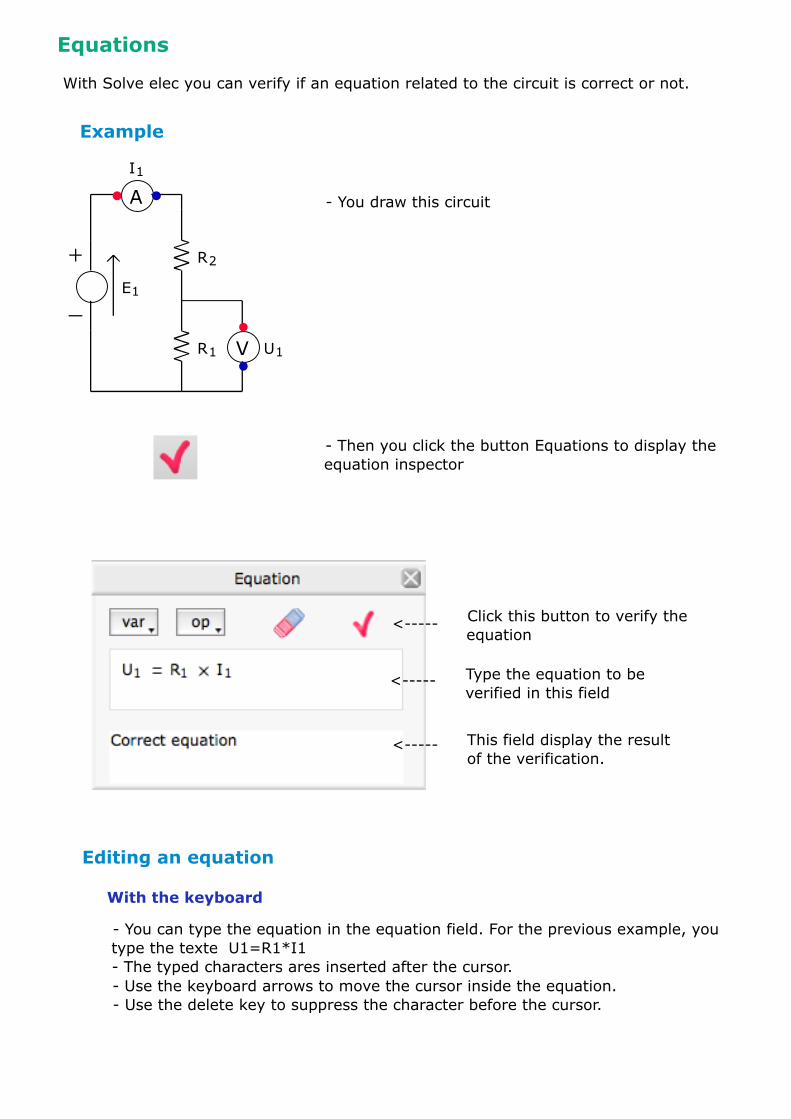
With Solve elec you can verify if an equation related to the circuit is correct or not.
- You draw this circuit
- Then you click the button Equations to display the equation inspector
Click this button to verify the equation
Type the equation to be verified in this field
This field display the result of the verification.
Editing an equation
With the keyboard
- You can type the equation in the equation field. For the previous example, you type the texte U1=R1*I1- The typed characters ares inserted after the cursor. - Use the keyboard arrows to move the cursor inside the equation.- Use the delete key to suppress the character before the cursor.
E1
A
I1
R1
R2
V U1
<-----
<-----
<-----
Using the mouse
Other tools
- Click inside the equation to set the cursor at this position.- Drag the mouse over a part of the equation to select this part.
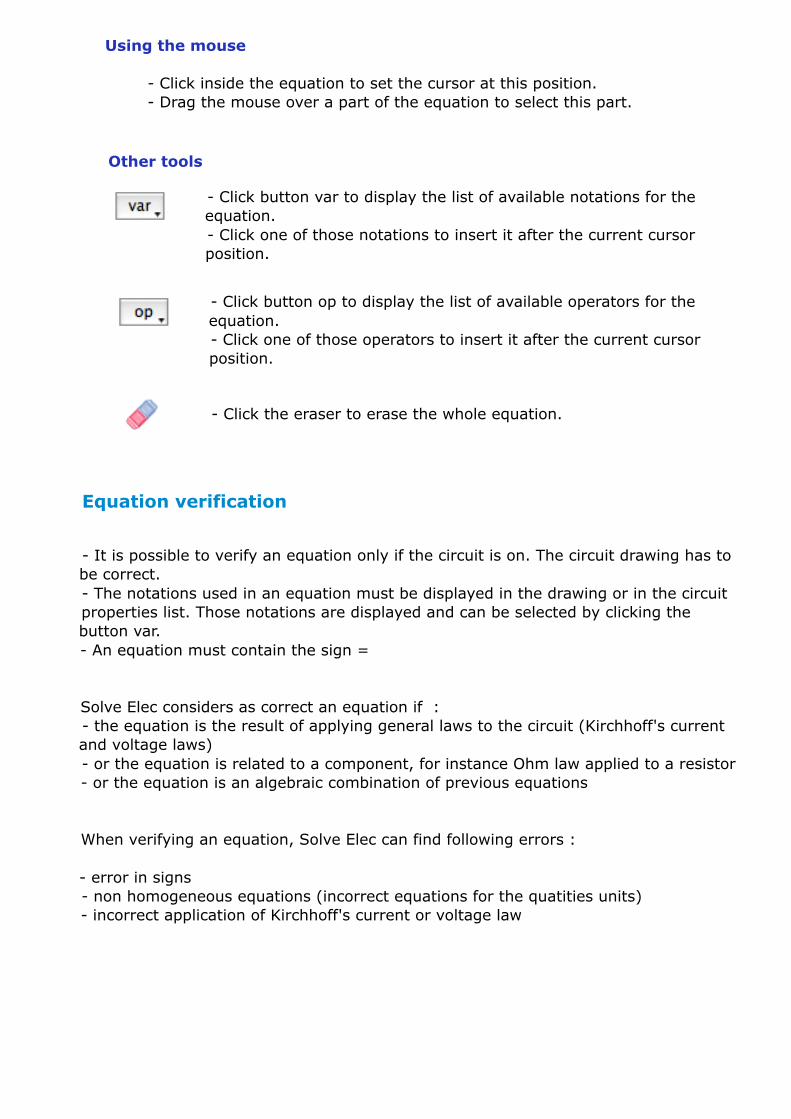
- Click button var to display the list of available notations for the equation.- Click one of those notations to insert it after the current cursor position.
- Click button op to display the list of available operators for the equation.- Click one of those operators to insert it after the current cursor position.
- Click the eraser to erase the whole equation.
Equation verification
- It is possible to verify an equation only if the circuit is on. The circuit drawing has to be correct.- The notations used in an equation must be displayed in the drawing or in the circuit properties list. Those notations are displayed and can be selected by clicking the button var.- An equation must contain the sign =
Solve Elec considers as correct an equation if : - the equation is the result of applying general laws to the circuit (Kirchhoff's current and voltage laws)- or the equation is related to a component, for instance Ohm law applied to a resistor- or the equation is an algebraic combination of previous equations
When verifying an equation, Solve Elec can find following errors :
- error in signs- non homogeneous equations (incorrect equations for the quatities units)- incorrect application of Kirchhoff's current or voltage law
Graphs
Graph plotter
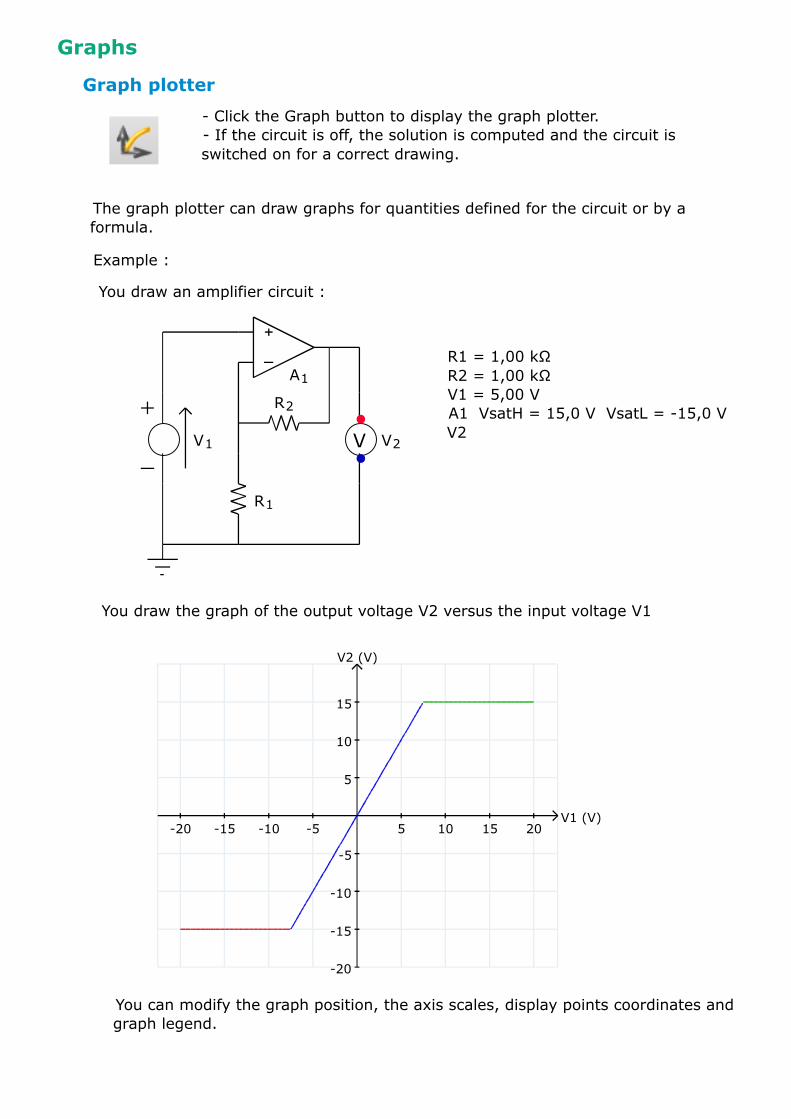
- Click the Graph button to display the graph plotter.- If the circuit is off, the solution is computed and the circuit is switched on for a correct drawing.
The graph plotter can draw graphs for quantities defined for the circuit or by a formula.
Example :
V1 (V)-20 -15 -10 -5 5 10 15 20
V2 (V)
-20
-15
-10
-5
5
10
15
You draw an amplifier circuit :
You draw the graph of the output voltage V2 versus the input voltage V1
R1 = 1,00 kΩR2 = 1,00 kΩV1 = 5,00 VA1 VsatH = 15,0 V VsatL = -15,0 VV2
You can modify the graph position, the axis scales, display points coordinates and graph legend.
R1
R2
A1
V V2V1
Axis definition
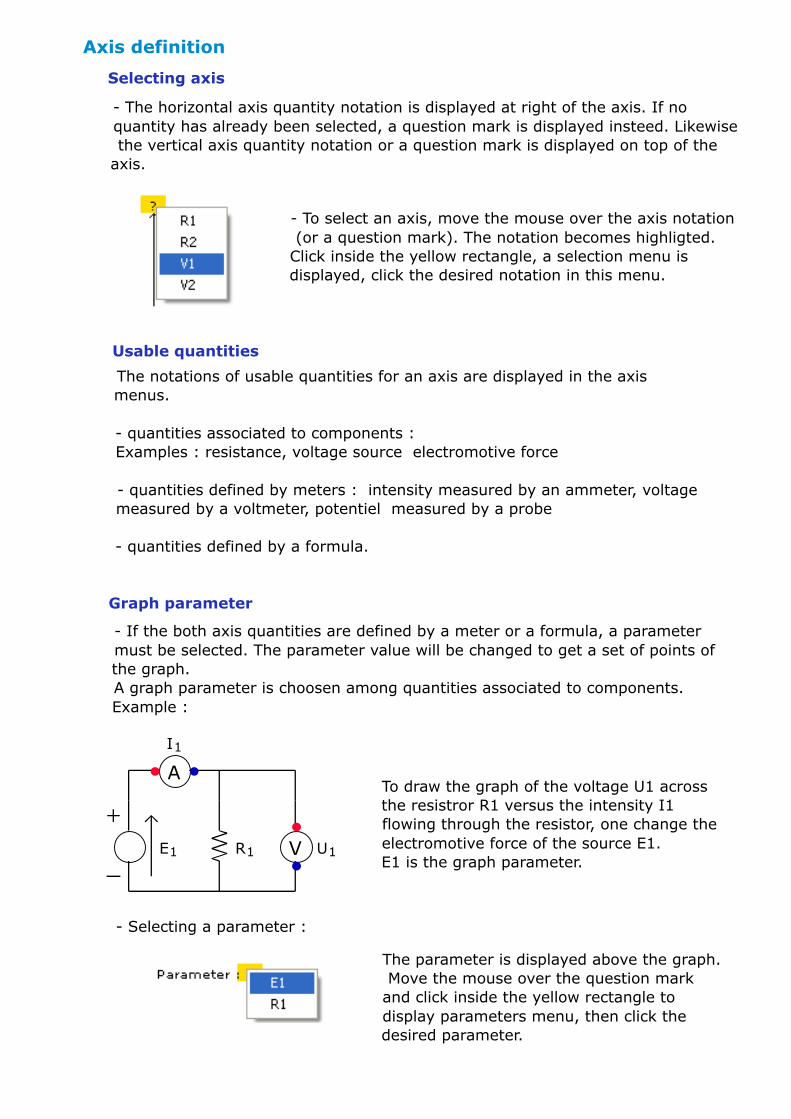
- The horizontal axis quantity notation is displayed at right of the axis. If no quantity has already been selected, a question mark is displayed insteed. Likewise the vertical axis quantity notation or a question mark is displayed on top of the axis.
- To select an axis, move the mouse over the axis notation (or a question mark). The notation becomes highligted. Click inside the yellow rectangle, a selection menu is displayed, click the desired notation in this menu.
Selecting axis
Usable quantities
The notations of usable quantities for an axis are displayed in the axis menus.
- quantities associated to components :Examples : resistance, voltage source electromotive force
- quantities defined by meters : intensity measured by an ammeter, voltage measured by a voltmeter, potentiel measured by a probe
- quantities defined by a formula.
Graph parameter
- If the both axis quantities are defined by a meter or a formula, a parameter must be selected. The parameter value will be changed to get a set of points of the graph.A graph parameter is choosen among quantities associated to components.Example :
To draw the graph of the voltage U1 across the resistror R1 versus the intensity I1 flowing through the resistor, one change the electromotive force of the source E1.E1 is the graph parameter.
- Selecting a parameter :
The parameter is displayed above the graph. Move the mouse over the question mark and click inside the yellow rectangle to display parameters menu, then click the desired parameter.
E1 R1
A
I1
V U1
Graph definition
You can define a graph by selecting its axis one after the other as described in previous page or you can open the graph definition window to define both axis.
Click the graph definition button to show the graph definition window.
For each axis : - click the button notation to select the axis quantity.- when the axis notation is selected, the default minimum and maximum values for the selected notation are displayed. You can change those values as well as their units.- click button OK to draw the graph.
It is not possible to define a new graph when the cursor coordinates or the legend is displayed, they must be hidden first by clicking the associated button (cf. next page)
Editing a graph
Shifting the graph
Changing axis scale
The diqplayed graph can be modfied if the cursor coordinates ans the legend are hidden. You can change axis notations, axis scales and graph position and grid
Drag the graph with the mouse to shift it inside its frame. The graph is drawn at its new location without changing the axis scales.
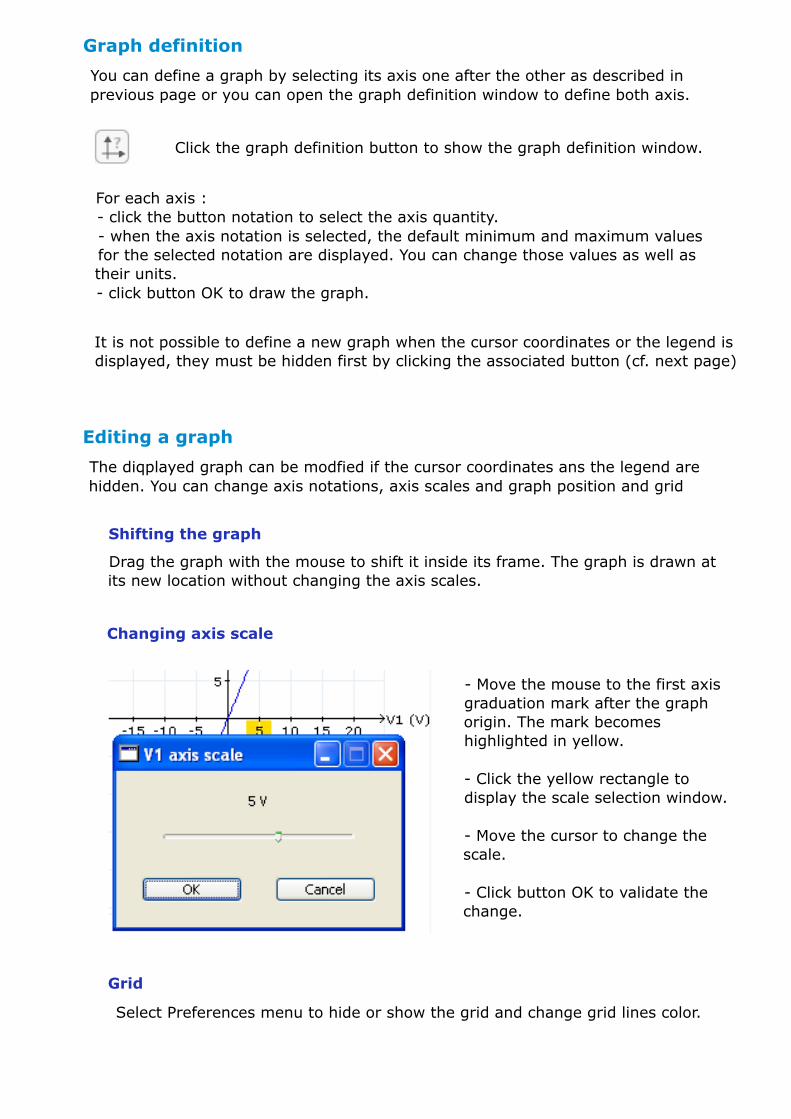
- Move the mouse to the first axis graduation mark after the graph origin. The mark becomes highlighted in yellow.
- Click the yellow rectangle to display the scale selection window.
- Move the cursor to change the scale.
- Click button OK to validate the change.
Grid
Select Preferences menu to hide or show the grid and change grid lines color.
Cursor coordinates
- Click the button Cursor coordinates to display the coordinates of the cursor, then move the cursor inside the graph frame. The button remains on.
- Click a point inside the graph frame to write its coordinates on the graph.
- Click a point coordinates to erase them.
- Click the button Cursor coordinatesr to hide cursor coordinates and erase written point coordinates. The button becomes off.
- It is not possible to change the graph (scales, axis or position ) when the cursor coordinates are displayed.
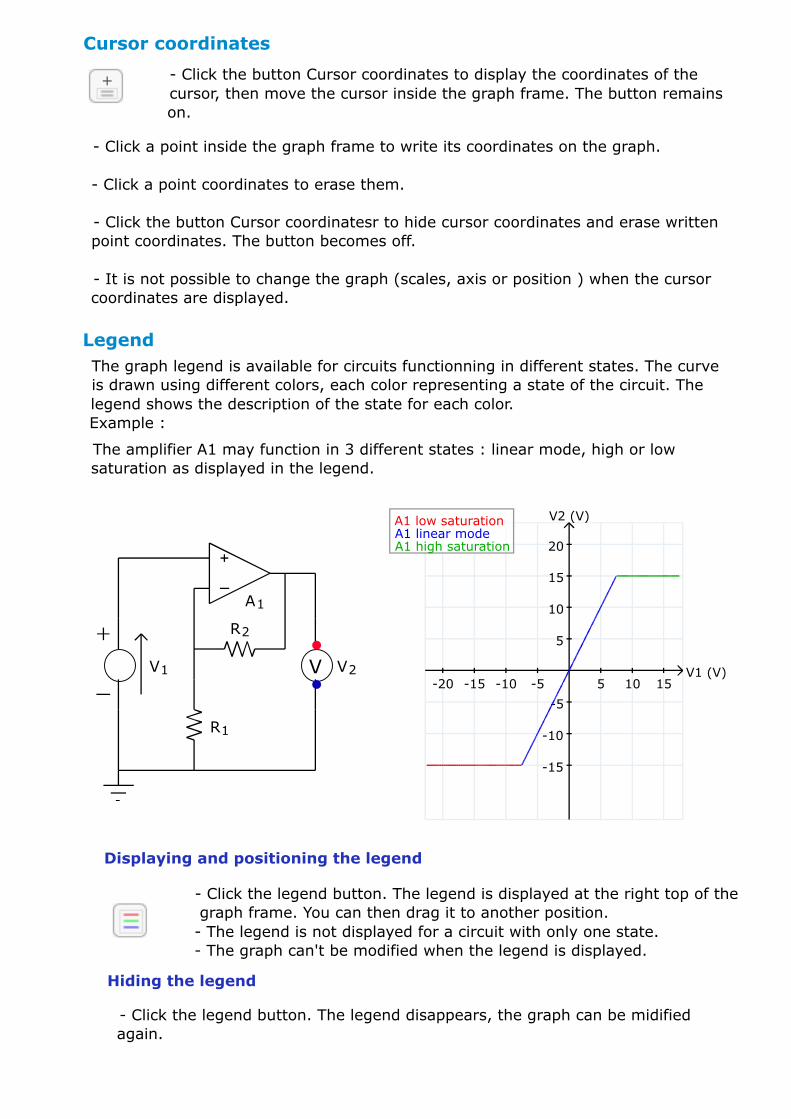
LegendThe graph legend is available for circuits functionning in different states. The curve is drawn using different colors, each color representing a state of the circuit. The legend shows the description of the state for each color.Example :
The amplifier A1 may function in 3 different states : linear mode, high or low saturation as displayed in the legend.
Displaying and positioning the legend
Hiding the legend
- Click the legend button. The legend is displayed at the right top of the graph frame. You can then drag it to another position.- The legend is not displayed for a circuit with only one state.- The graph can't be modified when the legend is displayed.
- Click the legend button. The legend disappears, the graph can be midified again.
R2
R1
A1
V V2V1 V1 (V)-20 -15 -10 -5 5 10 15
V2 (V)
-15
-10
-5
5
10
15
20
A1 low saturationA1 linear modeA1 high saturation
Equivalent circuit
With Solve Elec, you can get the equivalent circuit to any linear circuit as seen from two terminals, as well as the formulas of the equivalent circuit components. For instance, you can get the formula of the equivalent resistance of resistors combination or in case of a circuit containing a source you can get the Thevenin or Norton equivalent circuits.
Circuit drawing
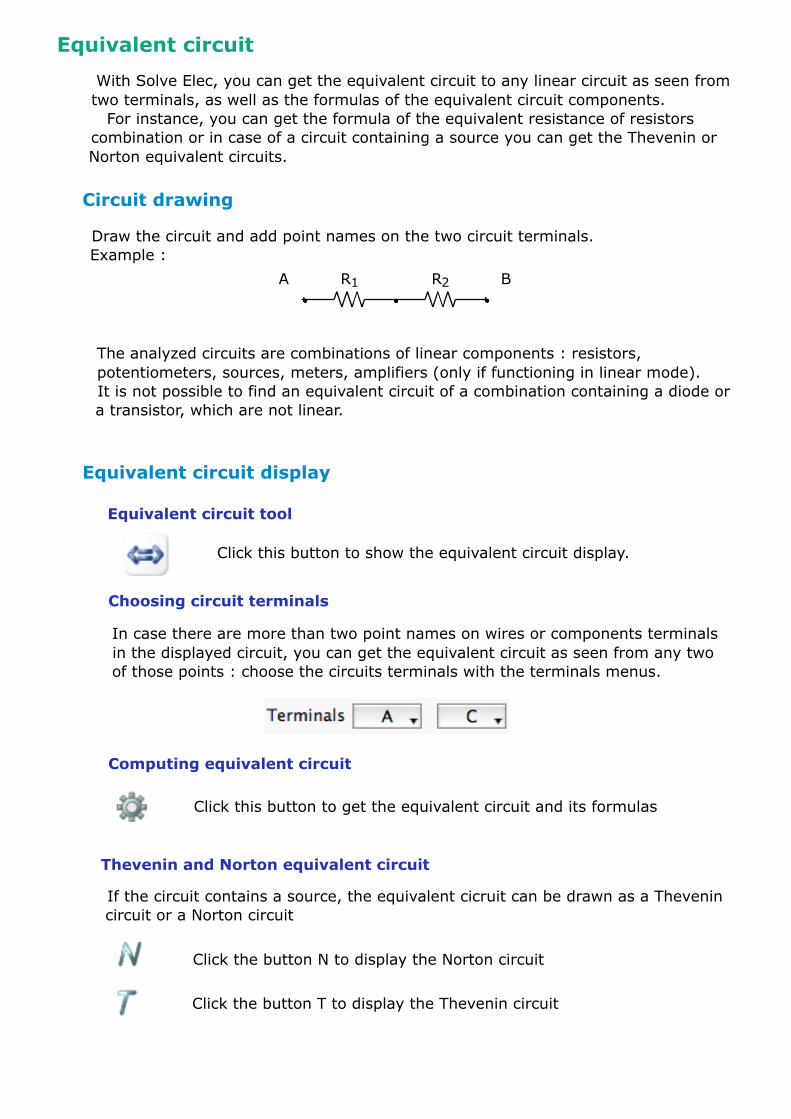
Draw the circuit and add point names on the two circuit terminals.Example :
The analyzed circuits are combinations of linear components : resistors, potentiometers, sources, meters, amplifiers (only if functioning in linear mode).It is not possible to find an equivalent circuit of a combination containing a diode or a transistor, which are not linear.
Equivalent circuit display
Equivalent circuit tool
Click this button to show the equivalent circuit display.
Choosing circuit terminals
In case there are more than two point names on wires or components terminals in the displayed circuit, you can get the equivalent circuit as seen from any two of those points : choose the circuits terminals with the terminals menus.
Computing equivalent circuit
Click this button to get the equivalent circuit and its formulas
Thevenin and Norton equivalent circuit
If the circuit contains a source, the equivalent cicruit can be drawn as a Thevenin circuit or a Norton circuit
Click the button N to display the Norton circuit
Click the button T to display the Thevenin circuit
R1 R2A B
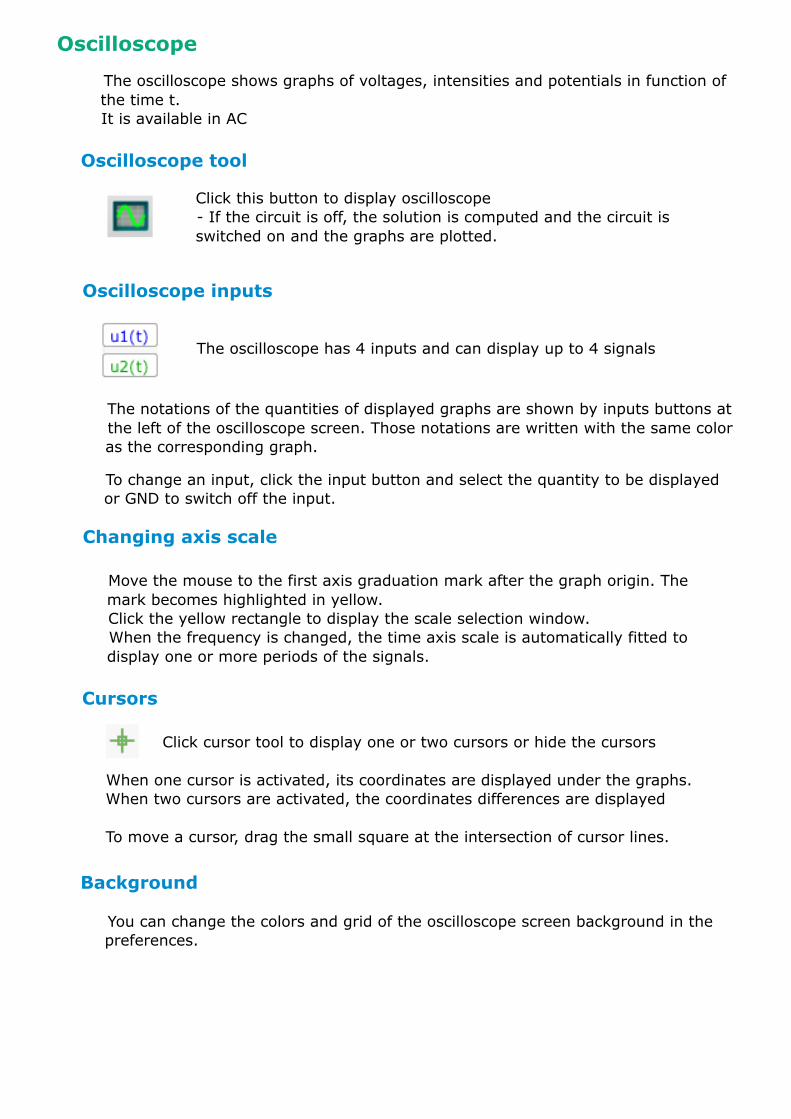
The oscilloscope shows graphs of voltages, intensities and potentials in function of the time t.It is available in AC
Oscilloscope
Oscilloscope tool
Click this button to display oscilloscope- If the circuit is off, the solution is computed and the circuit is switched on and the graphs are plotted.
Oscilloscope inputs
The oscilloscope has 4 inputs and can display up to 4 signals
The notations of the quantities of displayed graphs are shown by inputs buttons at the left of the oscilloscope screen. Those notations are written with the same color as the corresponding graph.
To change an input, click the input button and select the quantity to be displayed or GND to switch off the input.
Cursors
Click cursor tool to display one or two cursors or hide the cursors
When one cursor is activated, its coordinates are displayed under the graphs.When two cursors are activated, the coordinates differences are displayed
To move a cursor, drag the small square at the intersection of cursor lines.
Background
You can change the colors and grid of the oscilloscope screen background in the preferences.
Move the mouse to the first axis graduation mark after the graph origin. The mark becomes highlighted in yellow.Click the yellow rectangle to display the scale selection window.When the frequency is changed, the time axis scale is automatically fitted to display one or more periods of the signals.
Changing axis scale
Transfer function
Definition
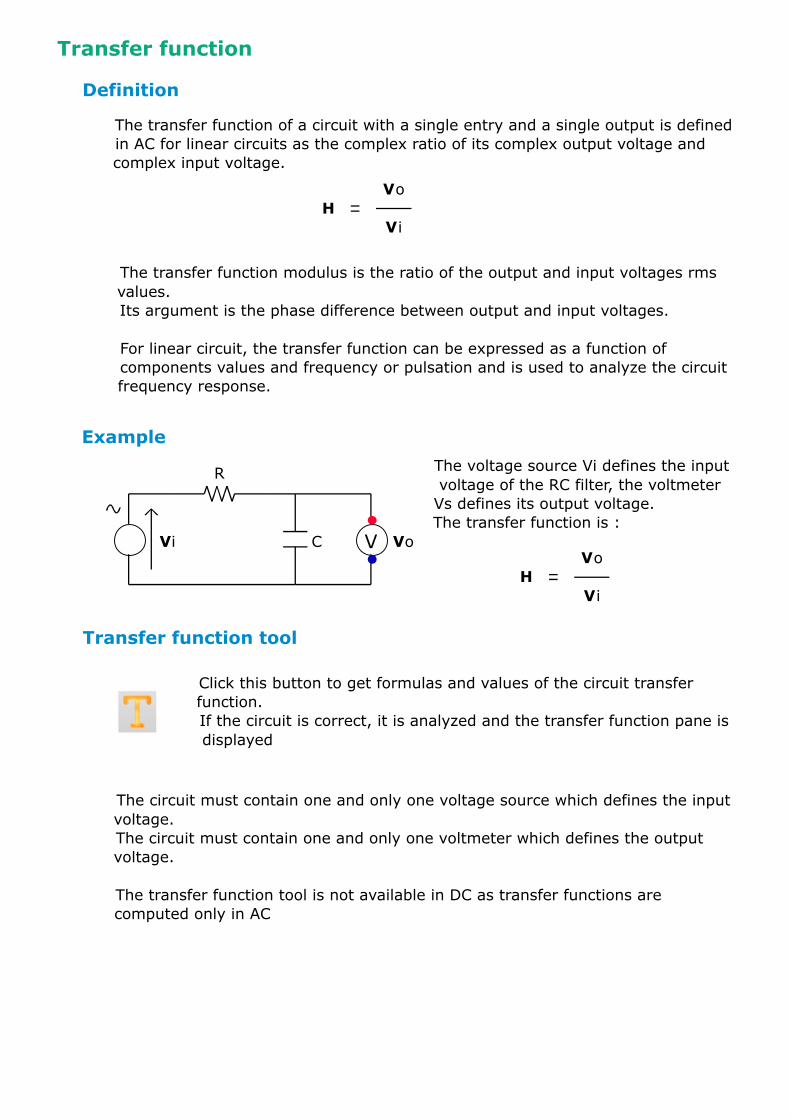
The transfer function of a circuit with a single entry and a single output is defined in AC for linear circuits as the complex ratio of its complex output voltage and complex input voltage.
H Vo
Vi
The transfer function modulus is the ratio of the output and input voltages rms values.Its argument is the phase difference between output and input voltages.
For linear circuit, the transfer function can be expressed as a function of components values and frequency or pulsation and is used to analyze the circuit frequency response.
Example
Vi V Vo
R
C
The voltage source Vi defines the input voltage of the RC filter, the voltmeter Vs defines its output voltage.The transfer function is :
H Vo
Vi
Transfer function tool
Click this button to get formulas and values of the circuit transfer function.If the circuit is correct, it is analyzed and the transfer function pane is displayed
The circuit must contain one and only one voltage source which defines the input voltage.The circuit must contain one and only one voltmeter which defines the output voltage.
The transfer function tool is not available in DC as transfer functions are computed only in AC
Transfer function pane
Example
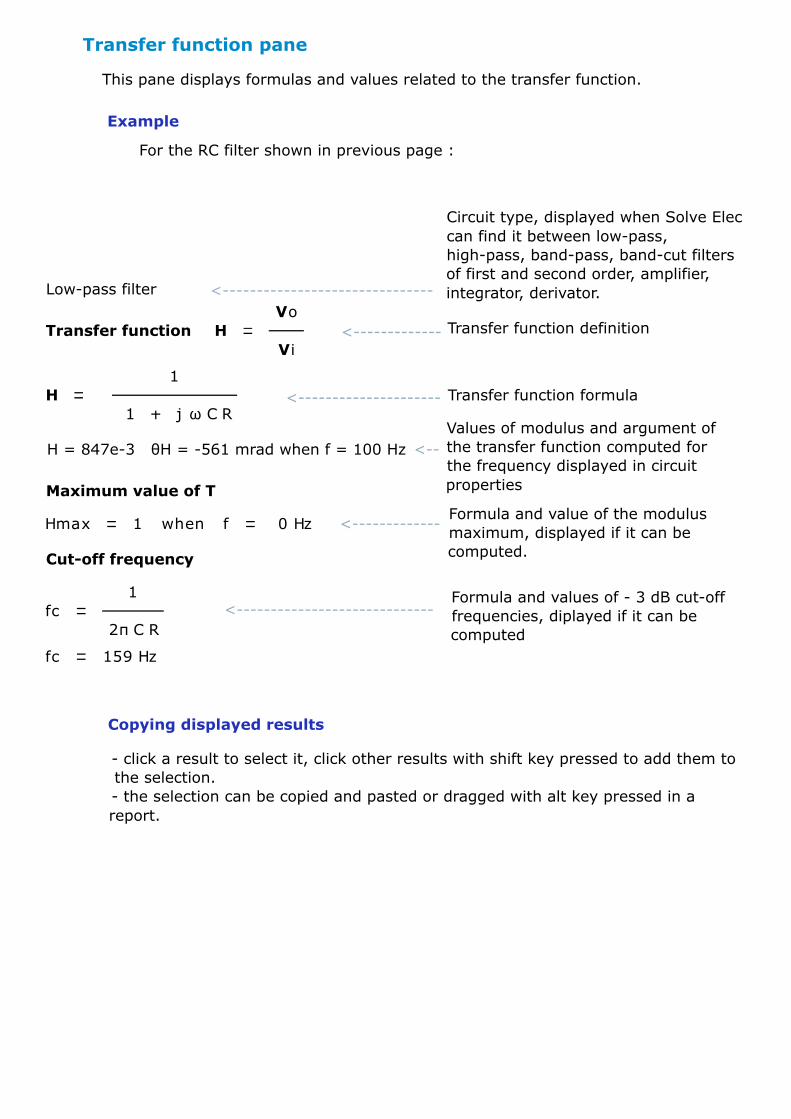
This pane displays formulas and values related to the transfer function.
For the RC filter shown in previous page :
Transfer function
Low-pass filter
H Vo
Vi
H 1
1 j ω C R
H = 847e-3 θH = -561 mrad when f = 100 Hz
Maximum value of T
Hmax 1 when f 0 Hz
Cut-off frequency
fc 1
2π C R
fc 159 Hz
Circuit type, displayed when Solve Elec can find it between low-pass, high-pass, band-pass, band-cut filters of first and second order, amplifier, integrator, derivator.
Transfer function definition
Transfer function formula
Values of modulus and argument of the transfer function computed for the frequency displayed in circuit properties
Formula and value of the modulus maximum, displayed if it can be computed.
Formula and values of - 3 dB cut-off frequencies, diplayed if it can be computed
<-----------------------------
<-------------------------------
<-------------
<---------------------
<--
<-------------
Copying displayed results
- click a result to select it, click other results with shift key pressed to add them to the selection.- the selection can be copied and pasted or dragged with alt key pressed in a report.
Frequency response
Frequency response tool
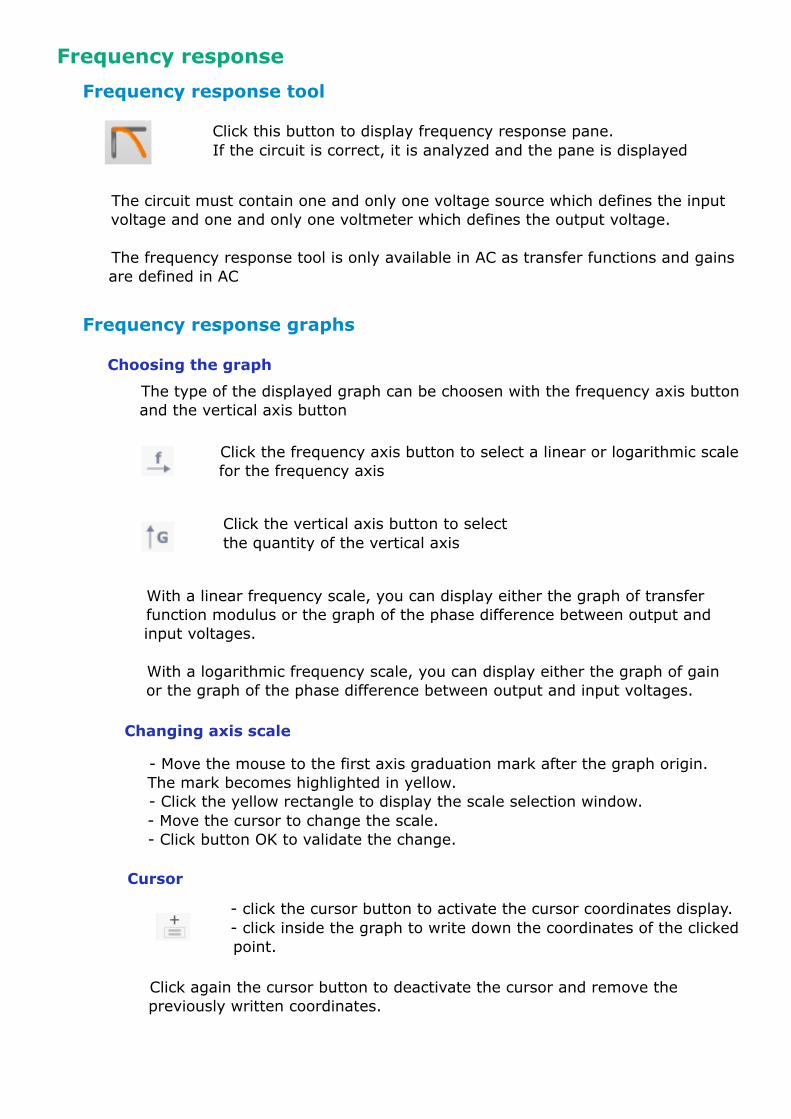
Click this button to display frequency response pane. If the circuit is correct, it is analyzed and the pane is displayed
The circuit must contain one and only one voltage source which defines the input voltage and one and only one voltmeter which defines the output voltage.
The frequency response tool is only available in AC as transfer functions and gains are defined in AC
Frequency response graphs
Choosing the graph
The type of the displayed graph can be choosen with the frequency axis button and the vertical axis button
Click the frequency axis button to select a linear or logarithmic scale for the frequency axis
Click the vertical axis button to select the quantity of the vertical axis
With a linear frequency scale, you can display either the graph of transfer function modulus or the graph of the phase difference between output and input voltages.
With a logarithmic frequency scale, you can display either the graph of gain or the graph of the phase difference between output and input voltages.
Changing axis scale
- Move the mouse to the first axis graduation mark after the graph origin. The mark becomes highlighted in yellow.- Click the yellow rectangle to display the scale selection window.- Move the cursor to change the scale.- Click button OK to validate the change.
Cursor
- click the cursor button to activate the cursor coordinates display.- click inside the graph to write down the coordinates of the clicked point.
Click again the cursor button to deactivate the cursor and remove the previously written coordinates.
Report
- A report is made of various elements displayed in Solve Elec main window : for instance, you can insert in a report graphical elements like the circuit drawing or a part of it, graphs, formulas displayed in the solution and circuit properties. It possible also to add editable text fields and images from other applications. The documentation you are reading now is a report made with Solve Elec.
- A report is divided in one or more pages, it may contain a plan.
- You can save and print any report.
Report menu
New report
Open a report
Save a report
Add a new page
Remove current page
Select the menu Report > New report to create a new empty report, with one page.
Select the menu Report > Open report to display a previously saved report.
Select the menu Report > Save report or Report > Save report as ... to save the displayed report.Reports files are independant from the circuit files saved by using the file menu. In particular, circuit drawing datas are not saved in report files
Select the menu Report > Print to print the report. Printed pages are identical to displayed pages.
Select the menu Report > Add a new page to insert a new page in the report. the new page is added after the current page.
Select the menu Report > Remove current page. The current page and its content are removed from the report.
Browsing a report
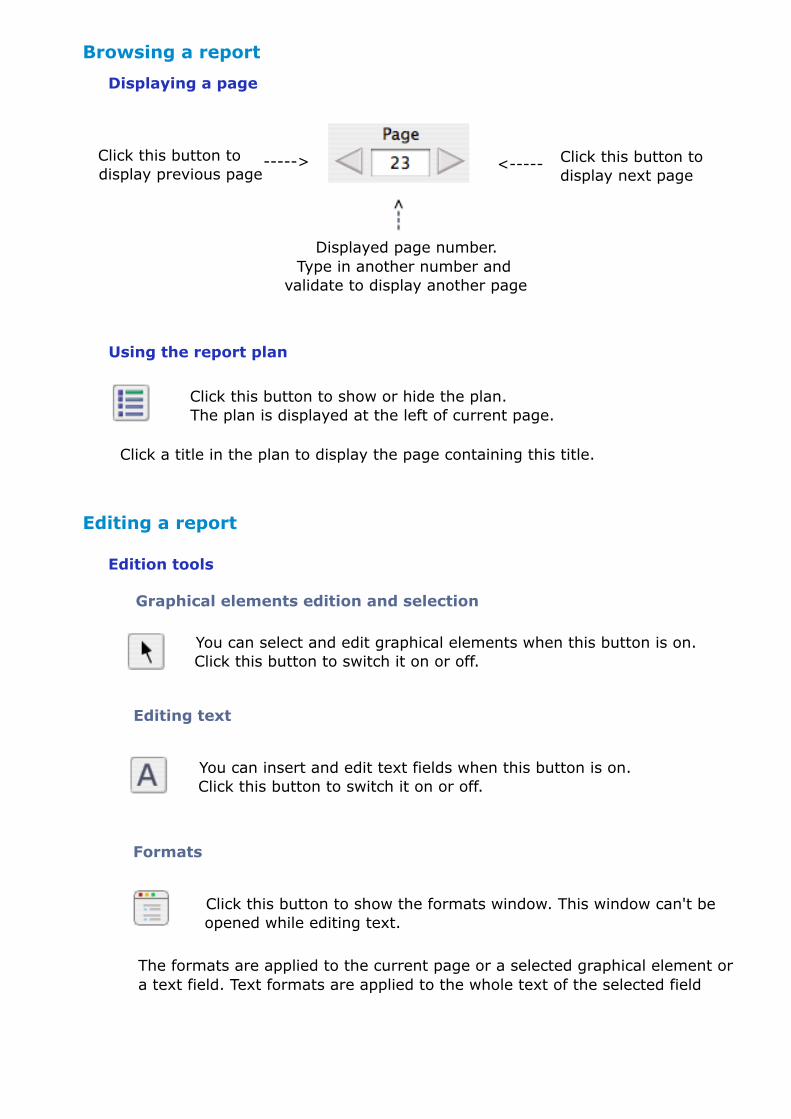
Displaying a page
Using the report plan
-----> <-----Click this button to display previous page
Click this button to display next page
Displayed page number.Type in another number and
validate to display another page
Click this button to show or hide the plan.The plan is displayed at the left of current page.
Click a title in the plan to display the page containing this title.
Editing a report
Edition tools
Graphical elements edition and selection
You can select and edit graphical elements when this button is on.Click this button to switch it on or off.
Editing text
You can insert and edit text fields when this button is on.Click this button to switch it on or off.
Formats
Click this button to show the formats window. This window can't be opened while editing text.
The formats are applied to the current page or a selected graphical element or a text field. Text formats are applied to the whole text of the selected field
- Select a part of the drawing- Press alt key and drag the selection to the displayed report page.- Or copy the selection in the clipboard, click inside the report page and paste the selection.
Drawing
Inserting graphical elements
Circuit properties
Graph
Solution and equivalent circuit
Insertion of all the properties of a circuit in a report :- Click one of the properties.- Press alt key and drag all the properties to the displayed report page.
Insertion of the properties of one component in a report :- Click the component properties.- Copy the properties in the clipboard.- Click inside the report page and paste the component properties.The properties inserted in a report are displayed as graphical elements, their text can't be edited in the report.
- Click the graph.- Press option alt and drag the selection to the displayed report page.- Or select the menu Copy graph, then click the report page and paste the graph.
- Select one or more elements displayed in the solution.- Press alt key and drag the selection to the displayed report page.- Or copy those elements, then click the report page and paste them.The solution elements inserted in a report are displayed as graphical elements, their text can't be edited in the report.
In order to insert graphical elements displayed in main window, click selection button in the upper tool bar of the report to switch it on.
Image
You can insert an image which has been previously copied in the clipboard from another application by using the menu Edit > Paste image.You can also drag an image from another application, if it supports drag and drop.
Inserting and editing text
Choose text tool ( A ) in upper tool bar of the report- Click at an empty position to insert a new text field and type the text.- Click an exixting text field to edit it.
In text mode it is possible to select text with the mouse, copy the selected text and paste text from the clipboard
All characters of a text field are displayed with the same format (font, font size, color, etc ...)
In order to change a text field format :
- Choose select tool- Click the text field to select it- Click format button in upper tool bar of the report- Choose the format of the text in the formats window.
Selecting elements
- Choose select tool in upper tool bar of the report
- Click an element to select it
- Click other elements while pressing shift key to add thoses elements to the selection or drag the mouse over the elements to be selected.
Moving elements
Select the elements you want to move and drag them to the desired position. The dragged elements remain inside the current page.
Changing graphics scale.
Select a graphical element and drag one of its corners.
Changing text fields dimensions
Select a text field ans drag one of its corners. The field dimensions are changed but the text format is unchanged.

Editing report plan
Plan display
Adding titles to the plan
Click this button to show or hide the report plan. The plan is displayed at the left of the current page. It contains titles at different levels.
- Type the title in a text field. - Choose select tool, select the title.- Click format button to display the formats window.- Check the button Title in the formats windowThe title is then automatically added to the plan.To suppress the title from the plan, uncheck the button Title