Embed Size (px)
Citation preview
budgetjustice
aidc
2013
AIDC
BUDGETJUSTICE
2014

2 BUDGET JUSTICE

3BUDGET JUSTICE
CONTENT
preface 5
1. TheBudget,SocialSecurityandtheBasicIncomeGrantalternativeSynopsis,Isobelfrye 7Introduction 8currentstatisticsonsocialgrants–numbersofbeneficiaries,currentcostsandvaluesofgrantsandprojectedexpenditure. 10reviewoflevelsofpoverty,inequalityandunemployment 11Objectivepoverty 12Subjectivepoverty 13expandedpublicWorksprogramme(epWp)andcommunityWorksprogramme(cWp)–effectivealternatives? 14areviewofDSDstrategicplanstoexpandsocialsecurity 16constitutionalcourtjurisprudenceabouttheobligationofthestatetoprogressivelyrealisetherighttosocialsecurity. 16argumentsinfavourofaBIG-evidencefromapilotStudyinNamibiaandothereconometricstudies. 19argumentsraisedagainstaBIG 21projectedcostingofaBIGinSouthafrica 21conclusion–weighingupoftheprosandconsandpolicychoicesandalternativeconsequences. 22
2 BudgetJusticeandtheNationalHealthInsurance,Dayganeagar 251.Introduction 272.Healthinequitiesandadividedhealthsystem 27
2.1Unequalhealthoutcomes 27 2.2Inequitableaccesstohealthcarebenefits 28
3.reformingthesystem:GluckmantotheNHIgreenpaper 30 3.11935-1994:goodintentions 30 3.21994-2007:failuretolaunch 31 3.32007-2011:NHIGreenpaper 32 3.4estimatingthecostoftheNHIandhowitwouldbefunded 34
4. Threeyearsin:whatprogresshasbeenmade? 35 4.1NHIpilotDistricts 35 4.2pHcre-engineering 35 4.3privatesectorcontracting 36 4.4OfficeofHealthStandardscompliance 36 4.5Legislativereform 36
5. Wherearewenow:policycommitmentsandthebudgetfortheNHIin2014/15 375.1Nationaldepartmentofhealthannualperformanceplan2014/15:re-statingNHIcommitments 375.2Budget2014/15-2016/17:IstheNHIfunded? 38
6.progressisaboutmorethanjustthemoney:whataretheotherrisks? 44 6.1Treasury’sreticenceandfinancingreform 44 6.2privatesectorresistance 45 6.3Separationofpowers:NationalMandatesVsprovincialcontrol 45 6.4Buy-infromthepublic(socialsolidarity) 46
7.Undoingcomplexityandbringingsocialjusticeback 478.references 47
3 HitsandMisses:Budget2014’sshotgunapproachtogender,Dr.christivanderWesthuizen 49 1.Introduction 50 2.Background 51 3.randomapproachtogender 51
4 BUDGET JUSTICE
4. Gender-relatedinterventionsinselecteddepartmentalbudgets 52 4.1Health 52 4.2WorkandSocialDevelopment 54 4.3Gender-basedviolence(GBV) 57
5.conclusion 61
4 aScLearaSMUD–eXpeNDITUreaNDpLaNNINGTreNDSINTHeprOVISIONINGOfScHOOLINfraSTrUcTUreINSOUTHafrIca,ZukiswaKota 63aBSTracT 66Glossary 67KeYNaTIONaLprIOrITIeSaNDTreNDSINeDUcaTIONINfraSTrUcTUre 67 BackgroundandconstitutionalObligations 67 priorities,Budgetsandrights 68NaTIONaLeXpeNDITUreTreNDS 69
TheNationalMinimumUniformNormsandStandardsforSchoolInfrastructure 73prOVINcIaLTreNDSININfraSTrUcTUrepLaNNINGaNDeXpeNDITUre 74
I. easterncape:StuckintheMud 74 II. Kwazulu-Natal:un-SMarTtargets 77 III. Limpopo:Shadyfinancesandnon-existentplans 77
InfrastructureMaintenanceandManagementplans 78TheacceleratedSchoolInfrastructureDeliveryInitiative 79 aLongHistoryofShiftingGoalpostsandconfusion 79conclusionandrecommendations 81
5 Transferpricingandprofitshifting,Dickforslund 821 Withoutatrace:Lonmin’sBermudaconnection 832. TransferpricingisaboutprofitShifting 85
6 THepeOpLe’SaLTerNaTIVeBUDGeTSpeecH2014–HONOUrINGOUrDUTIeSTOreaLISeHUMaNrIGHTSaNDSOcIaLJUSTIce 89 acknowledgements 90 HONOUrINGOUrDUTIeSTOreaLISeHUMaNrIGHTSaNDSOcIaLJUSTIce–THepeOpLe’SaLTerNaTIVeBUDGeTSpeecH 92 Introduction 92 Theconstitutionaldutytomeetpeople’sneeds 92 afocusOncorruptionandfinancialMismanagement 94 TaxJusticeforall 94 TheBudgetDeficit 96 apeople’sBudget 97 TakeSouthafricaoffausterityautopilot 98 Keepingoureyeontheconstitution–BudgetingforSocialInfrastructure 99 Health 99 fixtheprovincialHealthBudgets 100 Basiceducation 101 Socialprotectionandchild-focusedBudgetMonitoring 102 fixtheSocialSecuritySystem 103 Budgetforthedeliveryofequitableandsustainableaccessto,anduseof,safewaterandbasicsanitationservices 104 fixtheMunicipalities 104 formingacapableSouthafricanpublicService 105 protectWorkersratherthanSqueezingWorkers. 105 Greeneconomy–amillionclimatejobs 106 conclusion 107

5BUDGET JUSTICE
These rights include the right to education, healthcare, housing and social welfare. In order to effectively realise these rights through the delivery of public services, government departments and private service providers must implement effective accountability and service delivery systems. These include planning and resource systems for allocating resources, expenditure management systems, performance monitoring systems, integrity systems and oversight systems.
The budget reflects important choices that the government makes. It one of the most important tools the government has to achieve its economic and development goals without any major changes in existing legislation. To introduce a Basic Income Grant and/or a National Health Insurance (NHI) – two of the reforms discussed in this booklet by Isobel Frye and Daygan Eagar – would for example alter the context of the government’s budget work.
In the budget, the government sets out what it is going to spend (expenditure) and the income it believes it can collect (revenue), which pays for most of the expenditure. Governments can also finance a part of their expenditure with loans and usually do so. How large the loan financed part of the expenditure shall and can be – given the circumstances and given what ought to be collected in taxes instead – is one part of the budget discussion. Different kinds of taxes make up some 90% of the budget revenue.
It is important to measure the effectiveness of public spending and the manner in which resources are spent. The more immediate goals of applied budget work are to ensure that government budget priorities are consistent with declared policy objectives, and that the financial resources allocated to priority areas are
expended fully and properly.
From a civil society perspective, budget work has a larger purpose. It brings meaning to democracy through ensuring openness, transparency and accountability for public resources, and helps to ensure that broader goals of social, economic and ecological justice are attained.
Hence, the notion of budget justice used by the Budget Justice Campaign that came together before the budget 2012 the first time. In 2014 it brought together 11 organisations in a ’People’s Budget Speech‘ that was read out loud outside the parliament on the day before Finance Minister Pravin Gordhan’s budget speech in February in Cape Town.
The reader will find the speech at the end of this booklet.
At the end of May, the Budget Justice Campaign also gathered a one day seminar in Cape Town to discuss five different analyses of the 2014/15 budget and its context. These were: the case for a Basic Income grant, or BIG (Isobel Frye), the failed investment plans in school infrastructure in Eastern Cape (Zukiswa Kota), Women and budget priorities (Christi van der Westhuizen), Tax revenue lost from transfer pricing and corporate tax planning (Dick Forslund) and the delayed implementation of the national health insurance and rural health (Daygan Eager).
The engagement of civil society organisations in budget justice work cannot be a once-off annual commentary on the official release and presentation of the Budget by the minister of
prEFACEThe advent of democracy in South Africa introduced major changes in the nature of the public budget process. The new Constitution (1996) commits government departments to the progressive realisation of various socio-economic rights with-in the constraints of available resources.
6 BUDGET JUSTICE
finance in February. Effective budget justice advocacy processes must engage with the entire budget cycle, which is operational in phases throughout each year.
For progressive NGOs, social movements and trade unions to engage with the budget, we need a good understanding of the budgeting process. We also need to know about the post-1994 budget reforms, the structure of a typical government budget and the basics of budget analysis (including gender budgeting).
Budget justice is, however, inherently a political process. This booklet seeks to raise a fundamental starting point of engaging with public budgets. Progressive civil society must unite specific budget objectives, that make sense to mobilise around, and that strengthen the campaigns of the mass movement towards addressing power relations.
The government’s budget is not necessarily aligned to the top priorities of social movements, or indeed not always aligned even to the stated priorities of the government itself.
Currently government priorities include: education, health, rural development, food security and land reform, as well as decent work and sustainable livelihoods. Current priorities inform the government’s budget choices, and are also the basis from which 12 outcomes were determined by Cabinet to improve public service delivery.
Without contributing to changing power relations, public programmes however do little but ameliorate the plight of marginalised groups, the poor and the working class. That is why progressive budget analysis should also try to raise broader and larger longer-term political objectives in the spirit of ubuntu, which if they were reached would make room for a completely different and larger budget of the people. And a vibrant Public Service Delivery Sector to be proud of.
This booklet is published after the Mid Term Budget Policy Statement (MTBPS). The Treasury has taken the first steps on the road to so-called austerity. Policy makers obviously hope that a global upturn in the economy will save the budget from a new credit downgrading by the almighty credit ratings institutes. If this happens, it will make government loans even more expensive by increasing the interests that has to be paid on those loans.
In Europe, observers now talk about a third recession on its way. Europe is South Africa’s biggest export market. The call for a drastic change in the fiscal and economic policy pronounced by in the 2014 People’s Budget Speech has become even more timely.
Dick Forslund Alternative Information and Development Centre.
2013-11-08
7BUDGET JUSTICE / CHAPTER 1
The Budget, Social Security and the Basic Income Grant
Alternative Synopsis
ISoBEl FryEStudies in Poverty and Inequality Institute (SPII)
BUDGET JUSTICE
1
8 BUDGET JUSTICE / CHAPTER 1
The introduction of a universal cash transfer, a Basic Income Grant, has been hotly contested as a policy option aimed at addressing vulnerability and social and economic and political exclusion of working age people and their households in South Africa for over ten years.
This paper begins with a review of current spending on social assistance in South Africa. We then provide an overview of levels of unemployment, inequalities and poverty in South Africa in 2014. We also review policy options that have found favour within government in its efforts to address these challenges – anything, it would seem, rather than a BIG. We suggest that this is a false binary and that an array of options should be explored, given the urgency of the challenge.
We move on to consider a challenge to government policy based on certain constitutional findings with regard to the failure of the state to provide social security to poor working-age people. We provide a synopsis of the arguments that have been raised both in favour of, and against, a BIG and a calculation of the possible cost of a BIG.
We conclude by calling for a government rollout of a pilot of BIG in South Africa in partnership with other social partners as a demonstration of its commitment to the search for empirically-driven, rather than ideologically-driven policy options.
InTroDuCTIon
South Africa’s high levels of poverty, inequality and unemployment are frequently described as being unsustainable, and a central cause of the increasingly frequent and violent protests and strikes.
South Africa has one of the highest levels of income inequality globally. Attempts to create the necessary levels of decent work have failed for a variety of reasons. One of these is the highly monopolistic structure of the economy, much of which is still located in a stranglehold Minerals
Energy Complex (MEC) to the detriment of a (shrinking) manufacturing sector. Another is the poor quality of basic and secondary education and poor policy decisions with regard to further education and training, including the closing of many vocational training institutions.
The levels of polarised income distribution in the country are however also a critical element. Low levels of pay for those people who are employed dampen levels of disposable income, and thus demand. Furthermore, the inflationary levels of the main expenditure items for poor people, namely food and transport, are consistently above the mainstream Consumer Price Index, which adds to the burden of poverty on the shoulders of the poor. Increasing unemployment amongst the poor and working class has increased the dependency rate on wage earners amongst the poor.
The main reason for the high level of income inequality is quite simply that the state has failed to develop a comprehensive National Anti-Poverty Strategy and to follow up with appropriate intervention policies.
The social cash transfer or ‘grant’ system, part of the national social security system, has been hailed as the most effective poverty alleviation policy. Section 27(1)(c) of the South African Constitution guarantees every citizen the right to social security, or the right to social assistance or social grants to those who cannot afford to provide for themselves or their dependents1.
In 1998, just 2.5 million South Africans received social grants — a result of an inherited interweave of inherently racially discriminatory apartheid laws and policies. By early 2014, some 16 million South Africans were receiving social grants. Yet the state does not provide any form of social security for working-age poor people who are not eligible for, or have depleted, any contributory Unemployment Insurance. Access to social grants is means tested and targeted at people seen as being outside of the labour market: the aged, children and old aged pensions and people living with disabilities.
1 Socialsecurityismostcommonlyheldtoconsistofcontributorysocialinsur-ance,andnon-contributory,fiscallyfundedsocialassistance.
9BUDGET JUSTICE / CHAPTER 1
Cash transfers currently cost about 3.5% of GDP. As we have shown, there are big holes in the social security safety net. For some reason, the actual value of the grants is seldom critically evaluated against peoples’ actual needs.
It is important to frame any debate about access to social security and social assistance within an appreciation that these are rights under the Constitution. Access to social security is a justiciable right for everybody living in South Africa. It is not a charitable handout to the ‘deserving poor’, and neither is it a discretionary right based on temporary anti-poverty policy.
Social security, including social assistance can also be seen as a measure by which other interconnected rights can be accessed. For instance, section 27(1)(b) of the Constitution guarantees to all the right to ‘sufficient food and water’. Providing income security through social security can give poor people the means to realise this right, specifically given the significant cash-base of South Africa’s proletarianised society.
A committee of inquiry constituted by then-minister of social development into a comprehensive social security system (the ‘Taylor Committee’) released a report in 2002 called ‘Transforming the Present, Protecting the Future’. The report outlined a framework for a comprehensive social security system. It included a number of proposals: greater self-provisioning by means of an innovative contributory retirement fund; unemployment fund reforms; the introduction of a national health insurance; wide-ranging reforms to the contributory Road Accident Fund; and the introduction of a universal Basic Income Grant indexed in value to R100 in 2000 prices.
The universal Basic Income Grant would be accessed by all, and guarantee a minimum but regular income to every citizen of South Africa regardless of age or status. An adjustment to the income tax system would ensure that additional income received by the middle classes and elites was taxed at rates that would make the BIG affordable. Many of these recommendations have or are being considered. However, the BIG was rejected out of hand by the state for a number of reasons that are set out below.
Two other policy developments occurred during this period. The first was a gradual extension of the Child Support Grant (or CSG) to poor children between the ages of seven and 18 years. The second was the introduction and subsequent ‘massification’ of the Expanded Public Works Programme (EPWP).
The state has used both of these developments to justify its refusal to engage seriously with the idea of rolling out a BIG. Officials describe the CSG as a ‘mini-BIG’, notwithstanding the number of poor households that contained no eligible children. The EPWP ‘workfare’ programme provided working-age people with very short periods of paid work, typically between three and six months, and introduced as an alternative social protection programme for working-age people.
In comparison to the EPWP, it was argued, a BIG would undermine the dignity of working age people by providing access to income but no employment. But as we show in this paper, EPWP was in fact introduced to increase access to training and reduce unemployment.
This paper aims to contribute to the ongoing discussion around appropriate social security provisioning. This is a complex debate, as it incorporates rights- based provisions alongside considerations of sufficiency and affordability within an economy whose growth potential many argue is hamstrung by its very structure.
In the following section we move to a review of the current levels of financial commitments by the South African state towards social assistance spending and their quantitative take-up rates. In that context, we evaluate current levels of poverty, inequality and unemployment both with and without the grant income. We review both the policies of the EPWP and the more recent CWP and provide a critical account of recent jurisprudential rulings of the Constitutional Court regarding the state’s obligation to progressively realise the right to social security.
This is followed by a policy review of DSD strategic plans to expand social security into a comprehensive system, and an examination of BIG based on evidence from a BIG pilot study and other research. We then attempt a synopsis
10 BUDGET JUSTICE / CHAPTER 1
of projected costing and financing of a BIG. Our conclusion weighs up of the pros and cons and policy choices with regard to BIG and calls for a demonstration pilot in South Africa.
Throughout, we attempt to provide a gendered mainstreaming of the discussion of poverty, social security and BIG.
CurrEnT STATISTICS on SoCIAl GrAnTS – nuMBErS oF BEnEFICIArIES, CurrEnT CoSTS AnD vAluES oF GrAnTS AnD proJECTED ExpEnDITurE.
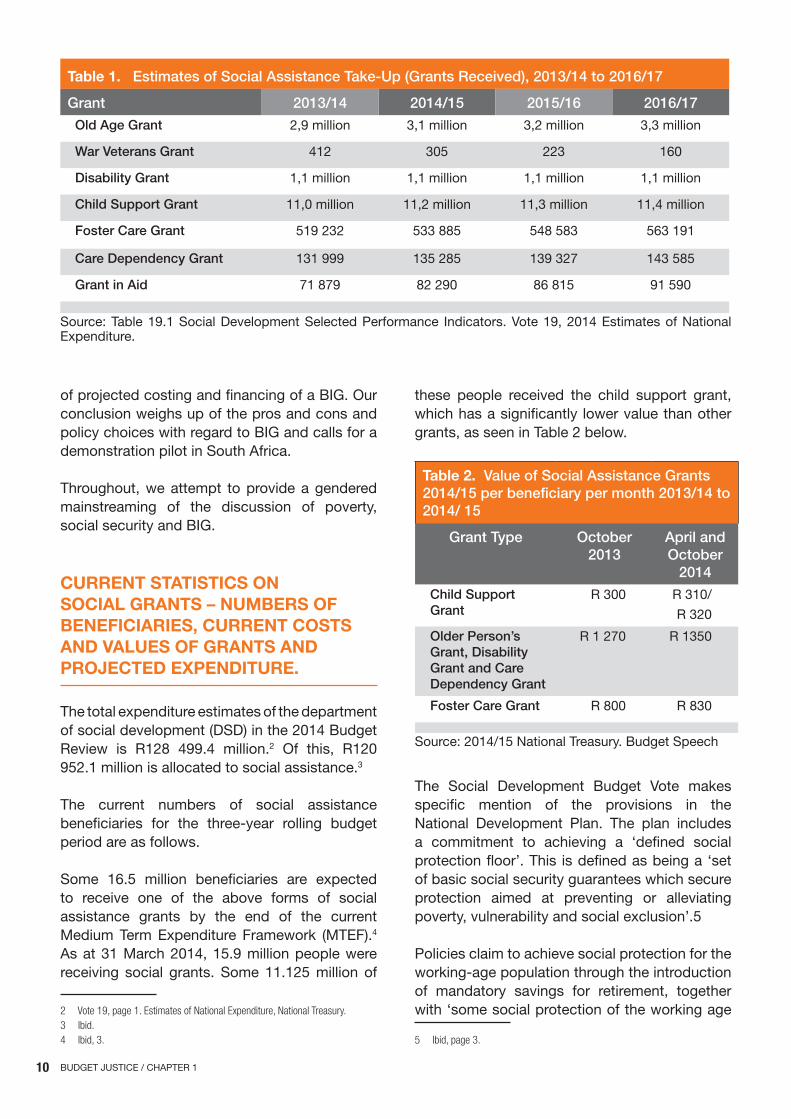
The total expenditure estimates of the department of social development (DSD) in the 2014 Budget Review is R128 499.4 million.2 Of this, R120 952.1 million is allocated to social assistance.3
The current numbers of social assistance beneficiaries for the three-year rolling budget period are as follows.
Some 16.5 million beneficiaries are expected to receive one of the above forms of social assistance grants by the end of the current Medium Term Expenditure Framework (MTEF).4
As at 31 March 2014, 15.9 million people were receiving social grants. Some 11.125 million of
2 Vote19,page1.estimatesofNationalexpenditure,NationalTreasury.3 Ibid.4 Ibid,3.
these people received the child support grant, which has a significantly lower value than other grants, as seen in Table 2 below.
Table 2. Value of Social Assistance Grants 2014/15 per beneficiary per month 2013/14 to 2014/ 15
Grant Type October 2013
April and October
2014
Child Support Grant
R 300 R 310/
R 320
Older Person’s Grant, Disability Grant and Care Dependency Grant
R 1 270 R 1350
Foster Care Grant R 800 R 830
Source: 2014/15 National Treasury. Budget Speech
The Social Development Budget Vote makes specific mention of the provisions in the National Development Plan. The plan includes a commitment to achieving a ‘defined social protection floor’. This is defined as being a ‘set of basic social security guarantees which secure protection aimed at preventing or alleviating poverty, vulnerability and social exclusion’.5
Policies claim to achieve social protection for the working-age population through the introduction of mandatory savings for retirement, together with ‘some social protection of the working age
5 Ibid,page3.
Table 1. Estimates of Social Assistance Take-Up (Grants Received), 2013/14 to 2016/17
Grant 2013/14 2014/15 2015/16 2016/17
Old Age Grant 2,9 million 3,1 million 3,2 million 3,3 million
War Veterans Grant 412 305 223 160
Disability Grant 1,1 million 1,1 million 1,1 million 1,1 million
Child Support Grant 11,0 million 11,2 million 11,3 million 11,4 million
Foster Care Grant 519 232 533 885 548 583 563 191
Care Dependency Grant 131 999 135 285 139 327 143 585
Grant in Aid 71 879 82 290 86 815 91 590
Source: Table 19.1 Social Development Selected Performance Indicators. Vote 19, 2014 Estimates of National Expenditure.

11BUDGET JUSTICE / CHAPTER 1
population[,] including through enhancing public employment programmes such as the expanded public works programme’.6 They do not envisage expansions of any form of social assistance grants to working-age people. The department’s policy choices seem to have moved entirely away from exploring the feasibility of introducing a BIG for unemployed people as mentioned in a previous strategic plan .
Concerns have been widely expressed both in government and in other sectors in society about the ongoing affordability of social assistance spending. In fact, according to National Treasury, cabinet approved a R530 million budget reduction on the 2014/15 estimates due to lower-than-expected increases in the take-up of social assistance transfers.7
The average rate of growth of the DSD budget between 2013/14 and 2016/17 is projected to be 7.4%, which is lower than the 8.3% average rate of growth between 2010/11 and 2013/14.8
The nominal increase during the MTEF in DSD’s expenditure is expected to increase from R120 952 101 to R137 556 422.
rEvIEW oF lEvElS oF povErTy, InEquAlITy AnD unEMployMEnT
Poverty in South Africa is closely interwoven with high levels of formal unemployment, low levels of ownership of income-producing assets (including productive land), and low wages for the majority of workers. Employment figures and income inequalities in terms of age, race and gender are set out below.
Unemployment continues to rise, according to Statistics South Africa (StatsSA)’s Quarterly Labour Force Survey (QLFS) (Quarter 1, 2014)9. Some 110 000 jobs were lost in the first quarter of 2014, mostly in the informal construction sector.10 The broader definition of unemployment, which includes ‘discouraged’ work seekers,
6 Vote19,2014estimatesofNationalexpenditure,page3.7 Vote19,estimatesofNationalexpenditure,page5.8 Vote19,estimatesofNationalexpenditure,Table19.79 StatisticsSouthafrica.QLfSp0211,Q1201410 QLfSp0211Q12014.
rose to 35.1%, with the narrow definition rising too to 25.2%. Some five million people were unemployed in the first quarter, which reflected a 4.9% increase from the previous quarter and a 4.2% increase year on year.
As compared to this, some 15 million people were employed. This figure reflected a 3.4% increase year-on-year, though it was a 0.8% fall from the previous quarter. There were slightly fewer unemployed women than men — 2.4 million women as compared to 2.6 million men.
Unemployment has a significant age bias. Of the 10.2 million people between the ages of 15 to 25, 53.2%, or 1.3 million people were not employed. This dropped to 29.5%, or just under two million people between the ages of 25 and 34 who were unemployed. Unemployment is lowest amongst those between the ages of 55 and 64, at 7.8%. This rises to 13.7 and 18.9% respectively for people in the 45 to 54 and 35 to 44 age cohorts respectively.11 Tackling youth poverty is clearly critical, especially given that access to the CSG ends when a young person turns 18.
Income inequality continues to reflect racial bias, even 20 years into the democratic South Africa. The intention to redress past racially-based exclusionary policies has clearly been only partially achieved. According to the 2010/11 Income and Expenditure Survey (IES), a black African-headed household spent on average R55 920 per year, while a household headed by a white South African spent R314 524 per annum, against a national average of R95 183.12
Furthermore, some 83.5% of households in the top income quintile were white- headed, compared to 8.8% of households in the top income quintile headed by a black African. The survey concluded that one out of every two black African households spent less than R28 per day. Statistics South Africa reported that the country’s Gini co-efficient, a measure of income inequality, was 0.7.13
Income inequality also has a gendered bias. According to the 2010/ 11 IES, the average income
11 StatisticsSouthafrica.QLfS,Statisticalreleasep0211,Q12014.12 StatisticsSouthafrica.IeS2010/11,Statisticalreleasep010013 TheGinico-efficientmeasureofinequalityrankstotalequalityat0,andtotal
inequalityat1.Southafricahasaveryhighmeasureofinequality.

12 BUDGET JUSTICE / CHAPTER 1
of women-headed households was R70 830 per annum, while that for male-headed households it was R151 186 per annum. That is, male-headed households had more than double the income enjoyed by households headed by women.
Finally, wage differentials are also a great driver of income inequality in South Africa. According to a recent study undertaken by the Labour Research Survey (LRS) released in 201314, the average annual salary for a low-paid worker was R44 496, while the average salary for an executive director was R3 785 789 for the same period, the average CEO’s salary was R5 966 396 and that of a part-time non-executive director was R685 978 per annum in 2012. These figures were based on a survey of directors’ fees in 83 companies across 14 sectors in South Africa..
According to the report, it would take the average low-paid worker 174 years to earn what the average executive director earned in one year, and 267 years to earn what the average CEO earned in one year. In their 2010 study on inequality in South Africa, Leibbrandt et al15 found that the labour market was a critical driver of inequality. One factor was the extremely high correlation between wage income and
total household income in South Africa; this is why the impact of unemployment is so devastating on households with no or few employed members. Another factor was the fact that wage income distribution is so deep and uneven.
Seekings suggests that the former is a greater driver of inequality than the latter, arguing that policies should focus on distributing income to the poorest households, either through redistribution (such as through fiscally funded social assistance) or through the creation of jobs, rather than supporting a redistribution of income to striking mine workers (whose income he classifies in the seventh or eighth income decile) through improved wages.16
14 Shumane,LandTaal,M.Directors’fees2013(coveringThe2012financial
Year) -DoubleDigit IncreasesforaDoubleDigit fall Inprofits. Labourre-searchService.
15 Leibbrandt,M.etal.(2010),‘TrendsinSouthafricanIncomeDistributionandpovertysincethefallofapartheid’,OecDSocial,employmentandMigrationWorkingpapers,No.101,OecDpublishing.
16 Seekings,J.Op-ed:TheIsaacanalysis,andtwohalvesoftheinequalitypuz-zle. Daily Maverick, South africa. www.dailymaverick.co.za/article/2014-07-
Poverty can be defined either subjectively or objectively. Below we set out findings from a recent study by Statistics South Africa that compares the results of both approaches.1718
oBJECTIvE povErTy
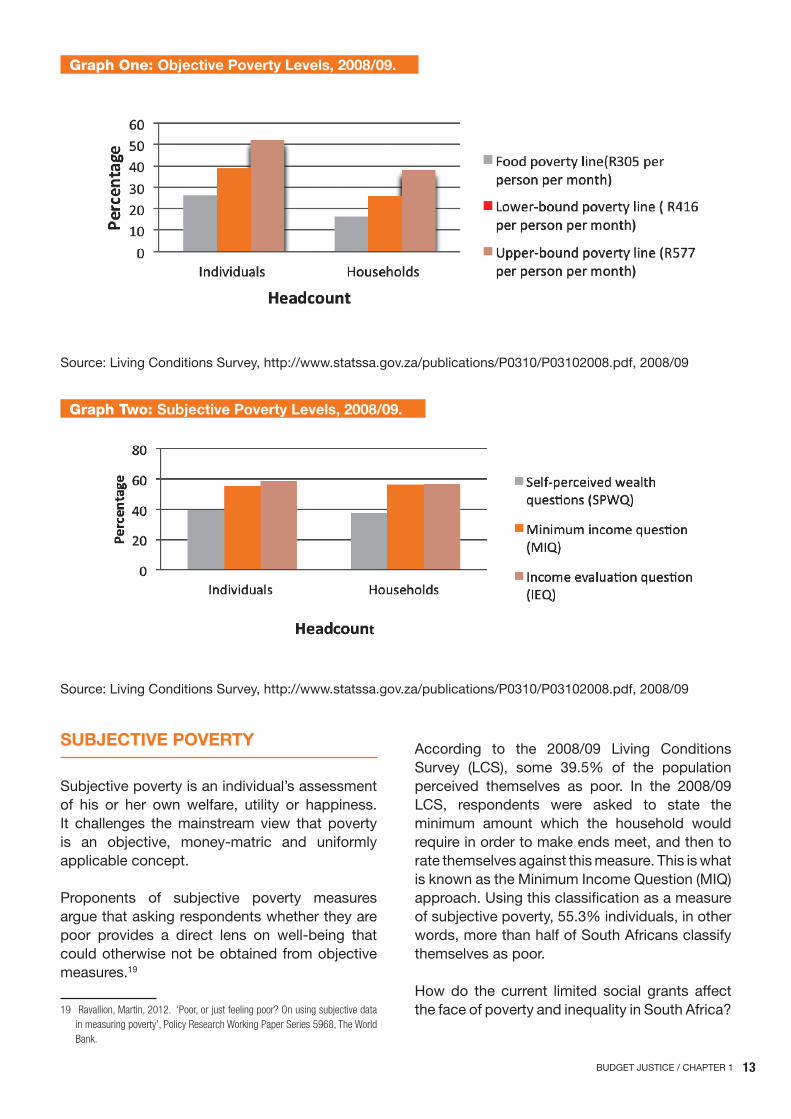
Objective poverty is based on an ‘expert’ or externalised definition of poverty. Stats SA used the objective, absolute money-metric poverty line approach but —for the first time in SA — it also used a subjective approach in its analysis of the 2008/09 Living Conditions Survey data—-..
To obtain the lower and upper-bound poverty lines of R416 and R577 per person per month (pppm) in 2009 prices, a food poverty line of R305 pppm was used, which was a costing of the calorific threshold of 2 261 kilocalories per person per day.
In 2008/09, 26.9% of households in SA lived below the poverty line of R416 per person per month. Some 52% of individuals lived below an income of less than R577 per person per month.
A comparison between individuals and households yields interesting results. Using all three measures of objective poverty, the LCS data shows that people living in a household are better off than those who alone. For example, if there are three people in a household and each person receives R577 per month, their combined total household income will be R1 731, while an individual living on their own relies only on an income of R577 per month.
31-op-ed-the-isaacs-analysis-and-two-havles-of-the-inequality-puzzle/#.U-c6kGuw3Ir
17 ThissectionisinformedbySpII.policyBrief2.TowardsaDecentLivingLevel,November2013.
18 However,SpIIbelievesthatthe‘objective’povertylevelsusedinthisstudybearnorealrelationtoaneeds-basedapproachtopeople’slivedrealities.TheuseofsuchmeasurescanresultinadangerousinterpretationofthereallevelsofpovertyandneedinSouthafrica.Inordertoaddressthis,SpII,withothersocialpartners,advocates for theadoptionofaneeds-based‘DecentLivingLevel’thattakesintoaccounttherealcostsofmeetingpeoples’basicneeds.
13BUDGET JUSTICE / CHAPTER 1
SuBJECTIvE povErTy
Subjective poverty is an individual’s assessment of his or her own welfare, utility or happiness. It challenges the mainstream view that poverty is an objective, money-matric and uniformly applicable concept.
Proponents of subjective poverty measures argue that asking respondents whether they are poor provides a direct lens on well-being that could otherwise not be obtained from objective measures.19
19 ravallion,Martin,2012.‘poor,orjustfeelingpoor?Onusingsubjectivedatainmeasuringpoverty’,policyresearchWorkingpaperSeries5968,TheWorldBank.
According to the 2008/09 Living Conditions Survey (LCS), some 39.5% of the population perceived themselves as poor. In the 2008/09 LCS, respondents were asked to state the minimum amount which the household would require in order to make ends meet, and then to rate themselves against this measure. This is what is known as the Minimum Income Question (MIQ) approach. Using this classification as a measure of subjective poverty, 55.3% individuals, in other words, more than half of South Africans classify themselves as poor.
How do the current limited social grants affect the face of poverty and inequality in South Africa?
Graph One: objective poverty levels, 2008/09.
Source: Living Conditions Survey, http://www.statssa.gov.za/publications/P0310/P03102008.pdf, 2008/09
Graph Two: Subjective poverty levels, 2008/09.
Source: Living Conditions Survey, http://www.statssa.gov.za/publications/P0310/P03102008.pdf, 2008/09
14 BUDGET JUSTICE / CHAPTER 1
In the OECD study of 2010 on income inequality, the authors conclude: ‘(N)ot only do the grants have a significant impact on poverty (at the lower poverty line) but they also make a significant impact on inequality. We find that the Gini coefficient on ‘pre-grant’ income is 0.03 higher than when calculated on either reported income or simulated income.’20
However, the low value of the CSG greatly reduces the actual ability of the grants to move people out of poverty. According to a micro-simulation undertaken by the authors and using a lower bound poverty line of R515 per person per month and an upper bound poverty line of R949 per person per month, the percentage of people falling below these lines in the bottom two income quintiles respectively fell from 100% to 96.4% and 89.9% using the lower bound poverty line, and only from 100% to 99.5 and 99% respectively using the upper bound poverty line.21
Is a BIG a solution that could address the needs of the unemployed and working poor? The authors of the OECD report conclude that it might provide temporary relief, but it should not be the final policy solution, which should be instead emphasise the creation of employment.
‘Most of the unemployed are unable to access unemployment benefits but are not provided for in the social assistance system which remains premised on the notion that unemployment is a temporary condition,’ the OECD says.
‘Consequently there are many that argue that the social grant system should be extended to focus directly on the unemployed. While strong economic growth supported the growth in the grants in the first fifteen years of democracy, we would argue that it is imprudent to argue for permanent income support for the unemployed. Many of the unemployed are young school leavers and while they clearly need some sort of social safety net or temporary social insurance, the longer term goal has to be directed at
20 OecD,page67paragraph183.21 OecD,page66.
assimilation into the labour market. In section 3.4 of this chapter, we presented a brief review of the body of literature which shows that the existing grant system seems to be promoting desirable education and health behaviours. This is true even though these grants are unconditional. Yet, the ultimate return to these positive human capital outcomes is an ability to become a productive citizen in the country. Again this turns on a more virtuous interaction with the labour market than we currently witness. ‘22
ExpAnDED puBlIC WorKS proGrAMME (EpWp) AnD CoMMunITy WorKS proGrAMME (CWp) – EFFECTIvE AlTErnATIvES?
Public works programs are often hailed as being the perfect solution for unemployment, providing basic income as well as a way into employment through the provision of training and work experience. Public works are preferred to social assistance grants, which are seen as constituting ‘hand- outs’ to the poor.
The design of the successive EPWP programmes in South Africa has typically included a training component, together with a limited period of work provided by the state, although the value of this training component has been heavily critisised.
The first EPWP was introduced in 2004 for a five-year period. Various public works had existed prior to this but they were run by different departments and spheres of government with the aim of achieving different aims23. Placements were typically temporary low skilled jobs, or in fact, ‘job opportunities’.
The targeted number of job opportunities (1 133 751) was achieved by 2007/8. However, Leibbrandt et al’s research demonstrates that a very small percentage of the total cost of the programme went towards wages for the EPWP
22 OecD,2010.page69.23 OecD
15BUDGET JUSTICE / CHAPTER 1
beneficiaries. In 2007/08, total expenditure on the EPW Programme was R30.2 billion, which led to the creation of 1.1 million job opportunities.24
The second phase of the EPW programme was introduced in 2009 for a further five-year period, with an aim of creating 400 000 jobs per annum, or 4.5 million work opportunities by 2014.25 26 The jobs in this period were divided into three types: home–based care and community health services, project–based employment in construction and broader environmentally-oriented programmes and the newly added Community Work Programme, which is implemented through a locally-based NGO or community-based organisation (see below).
According to a 2012 Development Indicator publication issued by the Presidency, of the 4.5 million job opportunities that formed the aim of the second phase of the EPWP, some 2 112 434 opportunities had been accessed by 2014.
The Community Work Programme (CWP) is a variation on the original design of the EPWP. It seeks to provide a guaranteed eight days of work per participant per month, funded by the state. Its objectives and design were based on the ‘100 day work guarantee scheme’ in India, which was introduced by the National Rural Employment Guarantee Act of 2005. It was started as a pilot project through the Presidency’s Second Economy Strategy Project Framework, which was approved by the cabinet in January 2009. The pilot was considered successful and the resultant CW programme is now run by the department of cooperative governance. According to the department’s website:
‘The CWP is designed as an employment safety net, not an employment solution for participants. The purpose is to supplement people’s existing livelihood strategies by offering a basic level of income security through work. It is an ongoing programme that does not replace government’s existing social grants programme but complements it.
CWP sites are being established in marginalised economic areas, both rural and urban, where 24 OecD,page50.25 DpMe,thepresidency.DevelopmentIndicators2012.26 OecD,2010.
unemployment is high. Unemployed and underemployed men and women qualify to apply for work. The daily rate paid at present is R63.18.
Communities are actively involved in identifying ‘useful work’ needed in the area. The first target is one site per municipality operating in at least two wards to reach 237 000 people by 2013/14’.27
How does the EPWP rate as a form of social protection?
The role of the EPWP scheme has historically been fudged between social protection, infrastructure development and skills training. According to the authors of the OECD report, EPWP was not introduced as a social protection scheme, but rather for the purpose of job creation and skills training. In addition, they found that in real terms, the value of the wage paid through the EPWP programmes (typically between R30 and R50 per day) fell by an average of 43% between 2004/5 and 2006/7, which calls into question its income support potential.
In its 2004 publication, Breaking the Poverty Trap, the BIG coalition commented as follows:
‘As the Taylor Committee report clearly illustrated, the BIG and EPWP should not be pitted against each other as they are, in fact, complementary interventions. They have very different roles to play in poverty alleviation as part of a comprehensive social protection package.’
Citing a paper delivered by Dr Anna McCord to the Basic Income Grant Coalition National Conference in December 200328, the authors of the BIG report question the cost-effectiveness of public works on the scale that would be required to address the needs of those currently falling outside of the social security safety net. They also question the government’s ability to implement schemes on that required scale.
The subsequent design and implementation of the CWP programme might in some way address the question of implementation because this is outsourced, as described above, to third parties.
27 http://www.cogta.gov.za/cwp/communityWorkprogramme,accessed5au-gust2014.
28 Mccord,a.‘publicWorksasacomponentofSocialprotectioninSouthafrica’.
16 BUDGET JUSTICE / CHAPTER 1
A rEvIEW oF DSD STrATEGIC plAnS To ExpAnD SoCIAl SECurITy
In its 2009-2012 Strategic Plan, the national department of social security committed itself to ‘develop policy options for basic income grant for unemployed adults’ as one of its ‘measurable objectives’ in the programme performance and targets for the MTEF.29
The ‘performance measure’ for this objective is listed as ‘Policy options presented to the Social Sector Cluster’. Its targets for 2009/10, 2010/11 and 2011/12 respectively were to:
y undertake broad consultation on the introduction of income support for the unemployed;
y prepare strategy for basic income grant linked to work activation and financial plan; and
y draft legislation to introduce basic income support for unemployed adults.
During a personal conversation between the author and the former deputy director-general for social security on 29 April 2014, the author was advised that the study and report had indeed been undertaken and submitted to the cabinet’s social security cluster as per the department’s performance measures, but that no actions appeared to have been taken arising from this study.
What then are the department’s current plans for expanding coverage to unemployed working age people?
Section 5.1 of the 2010-2015 Strategic Plan sets out various ‘sector-specific’ goals. Under the goal of ‘improve the incomes, assets and capabilities of poor families and communities’, the analysis focuses on inequality that has grown since apartheid. While social grants have increased the incomes of poor households, inequality has not been reduced; to achieve this, the focus must be on increasing equality through ‘community
29 DepartmentofSocialDevelopment.Strategicplan,2009to2012.programme3.4.5,page54
works, the social wage and co-operatives’ towards an outcome of ‘decent employment through inclusive economic growth’.
This does not appear to be a very robust or innovative strategy, given the dire growth predictions for the Medium Term Expenditure Framework period. Working-age unemployed people seem destined to be left to their own devices, as has been the case over the past twenty years.
ConSTITuTIonAl CourT JurISpruDEnCE ABouT ThE oBlIGATIon oF ThE STATE To proGrESSIvEly rEAlISE ThE rIGhT To SoCIAl SECurITy.
In this section we set out significant guidelines regarding the realisation of socio-economic rights in South Africa handed down by successive Constitutional Court judgments. We then weigh the legal case for the introduction of a BIG in South Africa.
South Africa’s final Constitution of 1996 (Act 108 of 1996) is considered internationally to be extremely progressive, not least due to the inclusion of a number of justiciable socio-economic rights. Section 26 of the Constitution provides for the right to have ‘access to adequate housing’. Section 27(1) bestows on everybody the rights to health care services, including reproductive health care, as well as the right to sufficient food and water and the right to social security, ‘including if they are unable to support themselves and their dependents, appropriate social assistance’.30
In addition, Section 7(2) of the Constitution states as follows: ‘The state must respect, protect, promote and fulfill the rights in the Bill of Rights’.
The obligations on the state are however subject to an internal limitations clause (Sections 26(2) and 27 (2)) that states that ‘the state must take reasonable legislative and other measures, within its available resources, to achieve the progressive realisation of this right/each one of these rights’.
30 Section27(1)(a),(b)and(c)respectively.
17BUDGET JUSTICE / CHAPTER 1
As indicated in the introduction, rights can be interpreted as being interconnected. Realising the right to social security and social security could in a significant way enable people to immediately realise a basic right to sufficient food.
The interpretation and application of these rights, including the ‘internal limitation’ clauses cited immediately above have been tested and pronounced on by the Constitutional Court in a number of matters. The most significant, in terms of the teasing out of the meaning of ‘progressive realisation’, was Grootboom and Others/ Government of South Africa and Others, Constitutional Court Order (CCT138/00) [2000] ZACC 14 (21 September 2000). Justice Zak Yacoob of the Constitutional Court sets out an interpretation of these rights in great detail, and what the nature of the obligations of the state was in this regard.
Central to the judgment was the introduction of the notion of ‘reasonableness’. Yacoob ruled that a policy passes muster only if its scope and its capacity to be implemented in such a way as to meet the objective of the policy are reasonable. This test of reasonableness was adopted by the court in favour of the principle of ‘core minimum’ is used by the UN Committee on Economic, Social and Cultural Rights, which oversees and reviews signatory states’ implementation of the International Covenant on Economic, Social and Cultural Rights of 1966.
According to Liebenberg31, the following five standards emerge from the jurisprudence (specifically from Grootboom and the TAC cases) for assessing reasonableness of any government policy or programme:
y the programme must be comprehensive, coherent and co-ordinated;
y appropriate financial and human resources must be made available for the programme;
y the programme must be balanced and flexible and make appropriate accomodation for short, medium and long –term needs;
y it must be reasonably conceived and implemented; and
31 Liebenberg,S.TheJudicialenforcementofSocialSecurityrights,page79.
y it must be transparent, and its contents must be effectively communicated to the public.
Justice Mokgoro, in the cases of Khosa and Others/The Minister of Social Development and Others (CCT 12/03) and Mahlaule and Another/The Minister of Social Development and Others (CCT 13/03), confirmed the following: ‘A court considering the reasonableness of legislative or other measures taken by the state will not enquire into whether other more desirable or favourable measures could have been adopted, or whether public resources could have been better spent. A wide range of possible measures could be adopted by the state to meet its obligations and many of these may meet the requirement of reasonableness. Once it is shown that the measures do so, this requirement would be met.’32
Justice Mokgoro’s judgment in these cases examined the question of the reasonableness of excluding permanent and temporary residents from the South African social assistance system. One of the grounds raised by the applicants was that the ground of residence was not reasonable and constituted unfair discrimination in terms of Section 9(3) of the Constitution. Section 9(3) of the Constitution reads as follows: ‘The state may not unfairly discriminate directly or indirectly against anyone on one or more grounds, including race, gender, sex, pregnancy, marital status, ethnic or social origin, colour, sexual orientation, age, disability, religion, conscience, belief, culture, language and birth’ (our emphasis).
Where grounds of unfairness are specifically listed in this section, a rebuttable presumption is created by Section 9(5) of the Constitution.33 The issue of resource considerations was also raised by the respondents in the matter. Justice Mokgoro ruled that while resource implications to the state of expanding access to social security and social assistance could be compelling, ‘(L)imiting the cost of social welfare is a legitimate government concern….but it must be done in accordance with the Constitution and its value’.34
32 KhosaandOthers/theMinisterofSocialDevelopmentandOthers(ccT12/03)andMahlauleandanother /TheMinisterofSocialDevelopmentandOthers(ccT13/03),paragraph48.
33 Section 9(5) of the constitution states: ‘Discrimination on one or more ofthegrounds listed insubsection(3) isunfairunless it isestablishedthatthediscriminationisfair’.
34 KhosaandOthers/theMinisterofSocialDevelopmentandOthers,ccT12/03
18 BUDGET JUSTICE / CHAPTER 1
Thus the issue of the rights to life35, dignity36 and equality or the unfairness of discrimination that excludes people from eligibility to social assistance based on age is critical to the argument in favour of a Basic Income Grant in South Africa.
Justice Mokgoro quoted from Justice Goldstone’s judgment in the matter of President of the Republic of South Africa and Another/ Hugo 1997 (4 )SA 1 (CC); 1997 (6) BCLR 1211 (CC) paragraphs 41-3 as follows: ‘At the heart of the prohibition of unfair discrimination lies a recognition that the purpose of our new constitutional and democratic order is the establishment of a society in which all human beings will be accorded equal dignity and respect regardless of their membership of particular groups. The achievement of such a society in the context of our deeply inegalitarian past will not be easy, but that that is the goal of the Constitution should not be forgotten or overlooked.’37
Justice Mokgoro in her judgment also examined the impact of the exclusion of permanent residents from social assistance, which can provide guidance to us in this paper.
She considered the question of the resultant dependency on extended family members that this exclusion created, the financial burden that this would create, as well as the impairment of the dignity of the applicants due to this state of dependency on said family or community members. The judge further cited the argument of the applicants with approval, that this denial of access to social assistance relegated them to the ‘margins of society’, and prevented them from enjoying other Constitutional rights.38
In her final evaluation of the impact of the denial of access to social assistance to the applicants and all eligible permanent residents, the judge began by restating that the Constitution guarantees the right to social security to ‘everyone’39. She
andMahlauleandanother/TheMinister ofSocialDevelopmentandOthers,ccT13/03,paragraph58.
35 TheconstitutionofSouthafrica,act108op1996,Section11.36 TheconstitutionofSouthafrica,act108of1996,Section10.37 KhosaandOthers/theMinisterofSocialDevelopmentandOthers,ccT12/03
andMahlauleandanother/TheMinister ofSocialDevelopmentandOthers,ccT13/03,paragraph69.
38 KhosaandOthers/theMinisterofSocialDevelopmentandOthers,ccT12/03andMahlauleandanother/TheMinister ofSocialDevelopmentandOthers,ccT13/03,paragraph76.
39 KhosaandOthers/theMinisterofSocialDevelopmentandOthers,ccT12/03
reiterated her previous findings that the exclusion of access would have a severe impact on the dignity of the applicants given the resultant dependency that this would create on others for the ‘necessities of life’.40
The judge concluded that the exclusion of permanent residents was neither reasonable nor justifiable, taking two compelling considerations into account, namely that the denial of access to social assistance for the applicants was absolute, and that the extension of these rights to all permanent residents in need would not pose too great a financial burden on the state, given the limited size of the group. Treasury estimated the size of the group to be about 2% of total social assistance spend, though the evidence submitted by the state in this regard was found to be ‘speculative’ at best.41
The South African BIG Coalition estimates the cost of a BIG to be in the region of R72.6 billion, based on payments of R100 per person per month (updated to 2014 purchasing power). It follows that the Constitutional Court would have to reconcile conflicting requirements if faced with a legal challenge on the absence of social assistance for working-age people.
On the other hand, the consideration of ensuring adequate resources to allow the state to realise the progressive nature of its provision of socio-economic rights should also include a critical evaluation of the successive annual income tax cuts that income earners have been allowed since 1994.
The universal aspect of the proposed BIG may not find favour with the court, despite the claw back mechanism advanced by the Coalition. Finally, the potential rollout of the CWP as an available alternative in every municipality for 2017 might persuade the court that there is no ‘absolute’ exclusion from social assistance for working-age people in current policy.
andMahlauleandanother/TheMinister ofSocialDevelopmentandOthers,ccT13/03,paragraph79.
40 KhosaandOthers/TheMinisterofSocialDevelopmentandOthers,ccT12/03andMahlauleandanother/TheMinister ofSocialDevelopmentandOthers,ccT13/03,paragraph80.
41 KhosaandOthers/TheMinisterofSocialDevelopmentandOthers,ccT12/03andMahlauleandanother/TheMinister ofSocialDevelopmentandOthers,ccT13/03,paragraph62.

19BUDGET JUSTICE / CHAPTER 1
ArGuMEnTS In FAvour oF A BIG - EvIDEnCE FroM A pIloT STuDy In nAMIBIA AnD oThEr EConoMETrIC STuDIES.
The pilot project undertaken in Namibia under the auspices of the civil society coalition, the Basic Income Grant Coalition provides a useful sources of data in respect of the likely impact and potential unintended consequences of a BIG. The pilot was located in the village of Otjivero in the district of Omitara.
In January 2008, all the inhabitants of the village (excluding those already receiving a state old age grant) were registered to receive a monthly BIG of Nam$100. The pilot ran for two years, after which time it was gradually phased out. There was subsequently some discussion regarding the availability of resources to reintroduce it sometime in 2014.
Why the BIG?
A number of stakeholders combined to launch the Coalition in April 2005 after a state-constituted committee was appointed to review the tax system in Namibia in around 2001. The recommendations of the Namibia Tax Consortium (NAMTAX) included a recommendation of the introduction of a BIG to all Namibians under the age of 60, in order to address the extremely high levels of income inequality in Namibia.
The NAMTAX committee recommended that the value of the BIG should not be less than 100 Namibian dollars per month. The Committee concluded that a BIG would cost between 2.2% and 3% of Namibia’s GDP. The NAMTAX Committee also recommended that a major source of the additional fiscal take needed to fund a BIG could come from an increase in Value Added Tax.42
The main findings of the pilot, assessed both through ongoing qualitative monitoring and assessments of administrative data from the local clinic, the school and the police, were as follows:43
42 Makingthedifference!TheBIGinNamibia.BasicIncomeGrantInformation–
english,June2009.BasicIncomeGrantcoalitionSecretariat.43 NaMBIG.MakingtheDifference!TheBIGinNamibia.BasicIncomeGrantpilot
projectassessmentreport,april2009,pages41to82
y Dignity. There was a completely heightened sense of dignity and hope amongst the community. Given the discussion of the possibility of the pilot being rolled out, the community formed a democratically elected community committee to ensure that its interests were protected, as well as to , address any unforeseen consequences arising out of the pilot.
y Alcohol. Critics of the pilot had argued that recipients would spend the value of the BIG on alcohol. Apparently this happened on the first pay-out, but the committee stepped in and negotiated several conditions with with the shebeens (informal taverns): they were not to open on pay-out day;their trading hours would be restricted; and no alcohol would be sold to youth.
y Crime. A comparison of the reported crime cases during the period between 15 January 2007 and 31 October 2007 as compared to the same period the following year, after the introduction of the BIG, demonstrated a decline from 85 cases to 54, confirmed by the acting police cCommander who visited Otjivero in April 2008.
y Poverty. Prior to the introduction of the BIG, 86% of residents at Otjivero fell below the lower bound national poverty line of N$220 per person per month, which rendered them as ‘severely poor’, and 76% of residents fell below the food poverty line of N$152 per person per month. After one year this fell to 68% and 37% respectively. However, after this period a 3% reversal of people falling under the lower bound poverty line was noted as a result of in-migration of people into Otjivero.
y Hunger. Prior to the pilot, 73% of households reported that they did not always have enough food; 30% said that they lacked sufficient food on a daily basis and this was experienced once a week for 39% of the residents. Some 42% of the children measured at the clinic were malnourished. Six months after the introduction of the BIG, child malnutrition rates had fallen to 17%, and to 10% a year later.
20 BUDGET JUSTICE / CHAPTER 1
y Health. The local clinic charged small user fees as per government policy (N$4). This prevented many people from attending the clinic. With the introduction of the BIG, the monthly income rose from about N$270 per month to N$1 300. Access to ARVs was enhanced and people had sufficient nutrition to enable them to benefit from the treatment.
y Education. Families’ inability to pay school fees (N$ 50 per annum) and school uniforms prevented many children (28%) from attending school regularly. After eleven months of the pilot, this figure had dropped by 42%, and drop-out rates, according to the principal, had reduced from an annual average of 30-40% to zero. Early childhood development also increased from 13 children in 2007 to 52 children in 2008. This also improving the income situation of the ECD providers.
y Employment and economic activity. Finally, the impact on economic activity was striking, and presents strong evidence to counter the arguments that a BIG would inhibit economic activity. In its initial twelve month assessment the coalition found that the rate of unemployed people at Otjivero had fallen from 60% prior to the introduction of the pilot, to 45%. Average per capita income rose from N$118 per capita prior to the BIG, to N$152 a year later, discounting for the BIG income. This suggested that the BIG had a strong multiplier or stimulus effect by creating opportunities and demand for additional economic activities. Most of this occured as self-employment in retail, brick-making and clothes manufacturing. A baker reported that he made and sold 100 bread rolls per day and made a monthly profit of N$400.
More people started saving as a result of receiving the BIG, which was confirmed by the employee of the NAMPOST Post Office at Otjivero, while 38 residents took out a funeral policy. Residents indicated that the bulk of the savings would be put towards fixing up their houses, 11% said that they would pay back debt and 9% reported that their savings would go towards the purchase of livestock.
The Coalition concluded that the pilot had demonstrated the direct and positive impact of a BIG in a highly impoverished and destitute community. Yet, despite this evidence and the findings of the NAMTX commission, the government was still reluctant to adopt the BIG as part of its social protection scheme nationally.
In a previous study undertaken by the South African BIG Coalition,44 the following arguments were offered in favour of a BIG:
y poverty, unemployment and inequality pose an ever-increasing crisis in South Africa that no policy seems able to have had any impact on;
y the existing social security net is unable to address this crisis given the ‘missing middle’ of working-age people, while the burden for caring for poor people rests extremely unfairly on the shoulders of the working poor;
y poverty undermines social delivery and results in poor health due to poor nutrition and high levels of hunger; and
y poverty is a fetter on economic development.
This report is based on modelling by four different economists that demonstrates that a BIG, inflation-indexed to the value of R100 in 2000 prices. Each study put forward different combinations of taxes to make the plan affordable. They are explored in more depth in the following section.
The Economic Policy Research Institute (EPRI) found that a BIG could grow economic growth as a result of three main effects. First, it would have a positive impact on both the supply and demand of the labour market by stimulating the accumulation of human and social capital Secondly, the increase in the investment in human capital would enhance productivity. And thirdly, a ‘dual macro-economic mechanism’ would stimulate economic growth by increasing the overall national income. This would change the composition of spending and moving it in the direction of more labour-absorbing sectors of the economy.45
44 BIGfinancingreferenceGroup.‘BreakingthepovertyTrap’:financingaBasic
IncomeGrantinSouthafrica,March200445 BIGfinancingreferenceGroup.‘BreakingthepovertyTrap’:financingaBasic
21BUDGET JUSTICE / CHAPTER 1
In addition, as against its many opponents, a BIG would not involve a disincentive to work because it would be universal, and not means-tested.46
In a gendered analysis of a BIG, Julieta Elgarte47 argues that a basic income grant could provide for a guaranteed minimum income security that would mitigate the disruption in many women’s working lives occasioned by child raising. In theory, she argues, a BIG would encourage more men to share the obligations of social reproduction more fairly, thus further contributing to a fairer division of the labour market and the domestic sphere.
However, she concludes that in practice the policy choices will not be between one system or the other. In any event, policies should aim at re-orienting the gendered division of the labour market through measures that protected care-givers and promoting a fairer division of labour.
ArGuMEnTS rAISED AGAInST A BIG
Government is obvious central in any discussion on the benefits or otherwise of a BIG, yet it is very difficult to obtain any primary government data relevant to the matter.
In 2004, a former minister of finance told members of the National Council of Provinces that the implementation of a BIG would ‘bankrupt the country’48 The issue of costing was used as a primary argument against the adoption of a BIG. The minister was cited as costing a BIG at R83 billion, which would require the raising of VAT by at least another 14%.
One argument against the BIG is that it would create dependency and dissuade people from working. According to another work that promotes the upskilling of unemployed people would be a preferable alternative. (This is an argument cited by both those on the left and on the right of the
IncomeGrantinSouthafrica,March2004,Section2.
46 http://www.economonitor.com/dolanecon/2014/01/03/the-economic-case-
for-a-universal-basic-income/47 elgarte,J.BasicIncomeandthegendereddivisionoflabour.paperpresented
atXIIBIeNcongress,Dublin,June2008.48 Southafrica:Debateragesoverproposedbasicincomegrant.IrIN,23No-
vember2004.
political or ideological spectrum)49. Yet another argument is that a BIG would crowd out other social spending.
In 2002, former minister of finance Trevor Manuel was reported to have questioned the affordability and administrative feasibility of a BIG during a budget briefing after delivering the 2002 Budget.50 , He reportedly described proponents of the idea as ‘populist’, which perhaps indicated an ‘ideological ground’ to his position.
In the same paper, Seekings and Matisonn refer to various reported dismissals by cabinet ministers and high ranking government officials of the BIG on various grounds ranging from dependency to the fact that receiving money without employment would undermine people’s dignity. They conclude by citing the minister of finance’s 2004 Budget Speech, in which he is reported as saying that government was committed to extending social security and income support through ‘targeted measures’ and to contribute to creating ‘work opportunities’ and ‘investing further in education, training, and health services’.
This approach takes us back to the previous discussion on EPWPs, in which the scope for sustained income support to the full gamut of unemployed working-age people must be questioned.
proJECTED CoSTInG oF A BIG In SouTh AFrICA
The models developed by the four economists who worked with the Coalition to produce the above report agree that the ‘financing the Basic Income Grant is clearly feasible’51. They calculated the total cost of the grant (excluding administration costs) at around R52 billion, based on 2003 prices and a BIG of R120 per person per month, and discounting the number of people who were already receiving some form of social assistance grant.
49 http://www.economonitor.com/dolanecon/2014/01/03/the-economic-case-for-a-universal-basic-income/
50 SeekingsandMatisonn,quotingaBusinessDayarticle.51 BIGfinancingreferenceGroup.‘BreakingthepovertyTrap’:financingaBasic
IncomeGrantinSouthafrica,March2004,page51.
22 BUDGET JUSTICE / CHAPTER 1
EPRI’s modeling included extensive work on the additional tax capacity in personal income tax, corporate tax, indirect taxes and VAT. According to EPRI, in 2003 BIG’s net cost would have been R27.3 billion if the reforms had been introduced then. This would thus have equalled 8.1% of total government spend; national expenditure for 2003/04 was estimated to be R333 965 000 000.52
It is interesting to note that in the same year ‘tax reforms’ (i.e. tax cuts) were estimated to equate to a reduction of R15 billion, from R325 billion to R310 billion. This calls into question the constitutionality of the successive tax cuts, given the Constitutional imperative to expand socio- economic rights within the scope of the state’s available resources. ‘The cumulative impact of the tax cuts made over the past decade accounts for a total of R75 billion in foregone revenue annually, or nearly a quarter (22.3%) of the tax revenue the Treasury expects to collect this year.’53
According to our own calculations, the 2014 value of R100 would equate to R220.69 per person per month in 2000 prices, based on an average inflation rate of 5%.
According to Stats SA’s 2013 Mid-Year Population Estimates54, there were then 52 981 991 people in South Africa. Based on the BIG coalition’s assumption that current grant recipients (16 068 488 people) would not receive an additional BIG, the total of people eligible for a BIG would have been 36 913 503 in 2013.
Excluding the number of people above the annual tax threshold of R70 000 (6.4 million people)55 as an estimate of those from whom the value of the BIG could be recovered through income tax, the total cost would therefore be an estimated R65.25 billion per year. This was 1.86% of GDP in 201356, which was just above 46% of the department of social development’s budget allocation in 2014.
52 NationalTreasury.NationalMediumTermexpenditureestimates.2003.53 people’sBudgetcampaign.people’sBudgetresponsetothe2004MTBpS.54 p0302,201355 NationalTreasury.2014Budgetreview,Table4,256 2013estimateofr3.5trillion
ConCluSIon – WEIGhInG up oF ThE proS AnD ConS AnD polICy ChoICES AnD AlTErnATIvE ConSEquEnCES.
We hope that the arguments outlined in this paper will contribute to critical discussion of the issue of social protection for South Africans.
The notion of a universal unconditional cash transfer – the Basic Income Grant – is not new. Much has been written about its objectives and application, but these issues were not within the remit of this paper.
Our argument is that the introduction of a BIG in South Africa could be a key policy that would improve the lives of people trapped in poverty, and reduce the scales of income inequality that are so prevalent in South Africa through a fiscal redistribution from the middle classes to the poor. This redistribution would contribute to breaking the stranglehold of unemployment by stimulating broadened demand in the South African economy.
We considered the levels of spending contained in the 2014/15 budgeted allocation to the department of social development, and looked at the figures on people who currently receive social grants. We showed that in the last year actual spending was less than that budgeted for, and not the runaway open fiscal exposure many feared from the social cash grant system.
We then provided an overview of current levels of unemployment, of several facets of inequality in South Africa and finally a review of poverty – both from the objective and subjective approaches. We highlighted the very low levels of the objective poverty measures, specifically in contrast to peoples’ lived realities and expectations in the face of such apparent inequalities and wealth, and suggested the need for a national discussion on what would constitute a decent living level.
The paper then considered the impact of the two stages of the Expanded Public Works Programmes, including the more recent Community Works Programme. We highlighted the apparent fuzziness that characterised the policy objectives of the first phase of EPWP, which might have contributed to the redesign of Phase Two
23BUDGET JUSTICE / CHAPTER 1
by including more training and greater ownership of the programmes within communities, We also reviewed the expansion of the time frame of the programs beyond the previous short term ‘job opportunities’ in the CWP.
Drawing on work undertaken for the Taylor Commission and other researchers, we argue that EPWP should not be seen in opposition to a BIG, but instead as complementary. We note, however, that the cost of the administration of a EPWP on the scale required to meet the needs of all people currently excluded from social protection would be prohibitive.
The paper then reviewed two distinct policy approaches in recent DSD strategic plans as regards options to include poor working-age people in the social security safety net. The earlier strategic plan makes reference to the possible rollout of a BIG for working age people. This appears to have got stuck at cabinet level under the previous administration.
Despite recent predictions of lower-than-expected growth levels and rising unemployment, the most recent strategic plan makes disappointing reference to the need to include working-age people in projects and the need for jobs to be provided for working-age people through accelerated economic growth.
We also considered the possible strength of a constitutional challenge to government policy based on working-age people’s constitutional right to adequate inclusion of in a social security
system, and highlight the critical choices that would face a court in its deliberations on the matter.
We included a synopsis of the main findings of a civil society coordinated BIG pilot undertaken in Namibia as empirical evidence of the possible impacts of a BIG, and demonstrated the beneficial effects of the pilot. We also traced some of the main objections of the South African government at the time of the BIG Coalition, but could not find conclusive arguments against the BIG.
Finally, to provide a context for the fiscal demands that a BIG would pose if introduced we provided a rough estimate of costing. The SPII will be undertaking comprehensive modelling of this issue during the coming year.
Other programmes might be able to assist the vulnerabilities of poor working age people in South Africa. But given the levels of poverty and unemployment that we set out at the beginning of this paper, we believe that it would be appropriate for the South African government, in partnership with social partners, to roll out at least one BIG pilot with clear and defined time frames for impact monitoring and evaluation, as they were for the CWP.
Bibliography
Basic Income Grant Coalition Secretariat. Making the difference! The BIG in Namibia. Basic Income Grant Information – English, June 2009.
BIG Financing Reference Group. ‘Breaking the Poverty Trap ‘: Financing a Basic Income Grant in South Africa, March 2004
Brockerhoff, S., 2013, A review of the Development of Social Security Policy in South Africa. Studies in Poverty and Inequality Institute (SPII). Working Paper 6.
Dicks, R, Brockerhoff, S and George Lwanda. Achieving a Decent Work Agenda in South Africa: Finding synergies between public employment schemes and social security interventions within a New Growth Strategy. NALEDI, September 2011
Du Preez, M. A Rumour of Spring. South Africa after 20 years of democracy. Zebra Press, 2013.
Reprinted 2014.
Elgarte, J. Basic Income and the gendered division of labour. Paper presented at XII BIEN Congress, Dublin, June 2008.
Leibbrandt, M. et al. (2010), ‘Trends in South African Income Distribution and Poverty since the Fall of Apartheid ‘, OECD Social, Employment and Migration Working Papers, No. 101, OECD Publishing. http://dx.doi.org/10.1787/5kmms0t7p1ms-en
S Liebenberg ‘The judicial enforcement of social security rights in South Africa: Enhancing accountability for the basic needs of the poor ‘ in E Riedel (ed) Social security as a human right:
24 BUDGET JUSTICE / CHAPTER 1
Drafting a General Comment on Art 9, ICESCR – Some challenges (2006) Springer 66 – 90
McCord, A. ‘Public Works as a Component of Social Protection in South Africa ‘.
NAMBIG. Making the Difference! The BIG in Namibia. Basic Income Grant Pilot Project Assessment Report, April 2009.
People’s Budget Campaign. People’s Budget Response to the 2004 MTBPS. http://www.pmg.org.za/docs/2004/appendices/041103cosatu.htm#_Toc87239973
Ravallion, Martin, 2012. ‘Poor, or just feeling poor? On using subjective data in measuring poverty, ‘ Policy Research Working Paper Series 5968, The World Bank.
Seekings, J and Matisonn, H. The continuing politics of basic income in South Africa. Centre For Social Science Research. Social Surveys Unit. CSSR Working Paper No. 286 November 2010.
Shumane, L and Taal, M. Directors’ Fees 2013 (Covering The 2012 Financial Year) - Double Digit Increases For A Double Digit Fall In Profits. Labour Research Service.
SPII. Policy Brief 2. Towards a Decent Living Level, November 2013.
Widerquist, K. The Basic Income Grant as Social Safety Net for Namibia: Experience and lessons from around the world. Undated.
Government publications.
Department of Social Development. Strategic Plan, 2009 to 2012.
Department of Social Development. Strategic Plan, 2010 to 2015.
Department: Performance Monitoring and Evaluation, The Presidency. Development Indicators 2012.
Financial and Fiscal Commission. Chapter Two. Economic and Social Value of Social Grants. Submission for the 2014/ 2015 Division of Revenue.
National Treasury. Estimate of National Revenue 2003.
National Treasury. National Medium Term Expenditure Estimates. 2003.
National Treasury. Budget Review 2014
National Treasury, Budget Speech 2014.
National Treasury. Budget 2014. A people’s guide.
National Treasury. Budget 2014, Estimates of National Expenditure.
The Constitution of South Africa, Act 108 of 1996.
South African Social Security Agency. Fact Sheet:
Issue no 3 of 2014 – 31 March 2014. A statistical summary of social grants in South Africa.
Statistics South Africa. Income and Expenditure Survey 2010/11. P0100
Statistics South Africa. Mid- year population estimates, 2013. P0302
Statistics South Africa. QLFS, Q1 2014. P0211.
Statistics South Africa. Living Conditions Survey. P0310. 2008
Court Cases:
Khosa and Others/ The Minister of Social Development and Others (CCT 12/03) and Mahlaule and Another / The Minister of Social Development and Others (CCT 13/03)
Websites
http://www.economonitor.com/dolanecon/2014/01/03/the-economic-case-for-a-universal-basic-income/. Three- part Blog by Ed Dolan.
http://www.irinnews.org/report/52167/south-africa-debate-rages-over-proposed-basic-income-grant
http://www.cssr.uct.ac.za/sites/cssr.uct.ac.za/files/pubs/WP286.pdf
The Community in South Work Programme Africa. Dr Kate Philip, The Second Economy Strategy Project: An initiative of the SA Presidency. http://www.levyinstitute.org/pubs/conf_june09/conf_june09_files/presentations/Session5b_Philip.pdf
http://www.cogta.gov.za/cwp/ Community Work Programme
http://www.treasury.gov.za
http://www.dsd.gov.za
www.dailymaverick.co.za/article/2014-07-31-op-ed-the-isaacs-analysis-and-two-havles-of-the-inequality-puzzle/#.U-C6kGuw3IR
newspaper Articles:
South Africa: Debate rages over proposed basic income grant. IRIN, 23 November 2004.
The Isaac analysis, and two halves of the inequality puzzle. Daily Maverick, 31 July 2014. Seekings, J. Op-Ed.

25BUDGET JUSTICE / CHAPTER 2
Budget Justice and the national health Insurance
July 2014
DAyGAn EAGAr Rural Health Advocacy Project
BUDGET JUSTICE
2

26 BUDGET JUSTICE / CHAPTER 2
Contents
1. Introduction
2. Health inequities and a divided health system
2.1 Unequal health outcomes 2.2 Inequitable access to health care benefits
3. Reforming the system: Gluckman to the NHI green paper
3.1 1935-1994: good intentions 3.2 1994-2007: failure to launch 3.3 2007-2011: NHI Green Paper
4. Three years in: what progress has been made?
4.1 NHI Pilot Districts 4.2 PHC re-engineering 4.3 Private sector contracting 4.4 Office of Health Standards Compliance 4.5 Legislative reform
5. Where are we now: policy commitments and the budget for the NHI in 2014/15
5.1 National department of health Annual Performance Plan 2014/15: re-stating NHI commitments5.2 Budget 2014/15-2016/17: Is the NHI funded?
6. Progress is about more than just the money: what are the other risks?
6.1 Treasury’s reticence and financing reform 6.2 Private sector resistance 6.3 Separation of powers: National Mandates Vs Provincial Control
6.4 Buy-in from the public (social solidarity)
7. Undoing complexity and bringing social justice back
8. References
27BUDGET JUSTICE / CHAPTER 2
1. InTroDuCTIon
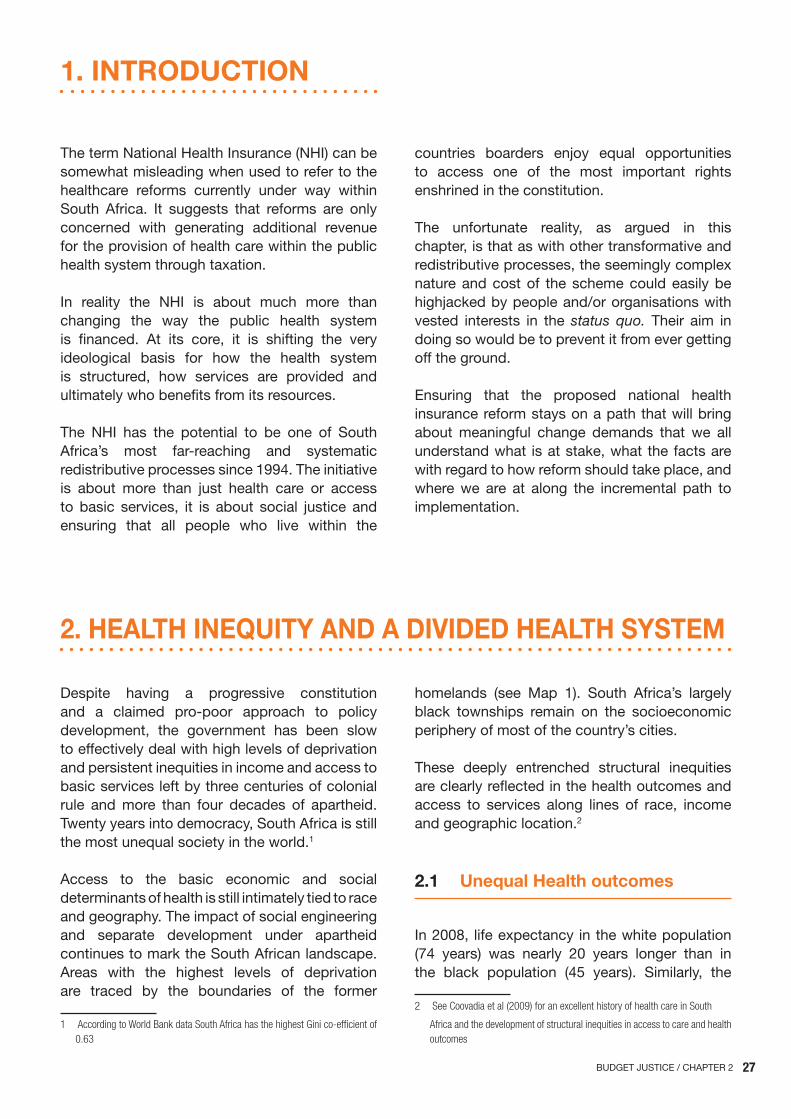
The term National Health Insurance (NHI) can be somewhat misleading when used to refer to the healthcare reforms currently under way within South Africa. It suggests that reforms are only concerned with generating additional revenue for the provision of health care within the public health system through taxation.
In reality the NHI is about much more than changing the way the public health system is financed. At its core, it is shifting the very ideological basis for how the health system is structured, how services are provided and ultimately who benefits from its resources.
The NHI has the potential to be one of South Africa’s most far-reaching and systematic redistributive processes since 1994. The initiative is about more than just health care or access to basic services, it is about social justice and ensuring that all people who live within the
countries boarders enjoy equal opportunities to access one of the most important rights enshrined in the constitution.
The unfortunate reality, as argued in this chapter, is that as with other transformative and redistributive processes, the seemingly complex nature and cost of the scheme could easily be highjacked by people and/or organisations with vested interests in the status quo. Their aim in doing so would be to prevent it from ever getting off the ground.
Ensuring that the proposed national health insurance reform stays on a path that will bring about meaningful change demands that we all understand what is at stake, what the facts are with regard to how reform should take place, and where we are at along the incremental path to implementation.
Despite having a progressive constitution and a claimed pro-poor approach to policy development, the government has been slow to effectively deal with high levels of deprivation and persistent inequities in income and access to basic services left by three centuries of colonial rule and more than four decades of apartheid. Twenty years into democracy, South Africa is still the most unequal society in the world.1
Access to the basic economic and social determinants of health is still intimately tied to race and geography. The impact of social engineering and separate development under apartheid continues to mark the South African landscape. Areas with the highest levels of deprivation are traced by the boundaries of the former
1 accordingtoWorldBankdataSouthafricahasthehighestGinico-efficientof0.63
homelands (see Map 1). South Africa’s largely black townships remain on the socioeconomic periphery of most of the country’s cities.
These deeply entrenched structural inequities are clearly reflected in the health outcomes and access to services along lines of race, income and geographic location.2
2.1 unequal health outcomes
In 2008, life expectancy in the white population (74 years) was nearly 20 years longer than in the black population (45 years). Similarly, the
2 Seecoovadiaetal(2009)foranexcellenthistoryofhealthcareinSouth
africaandthedevelopmentofstructuralinequitiesinaccesstocareandhealthoutcomes
2. hEAlTh InEquITy AnD A DIvIDED hEAlTh SySTEM
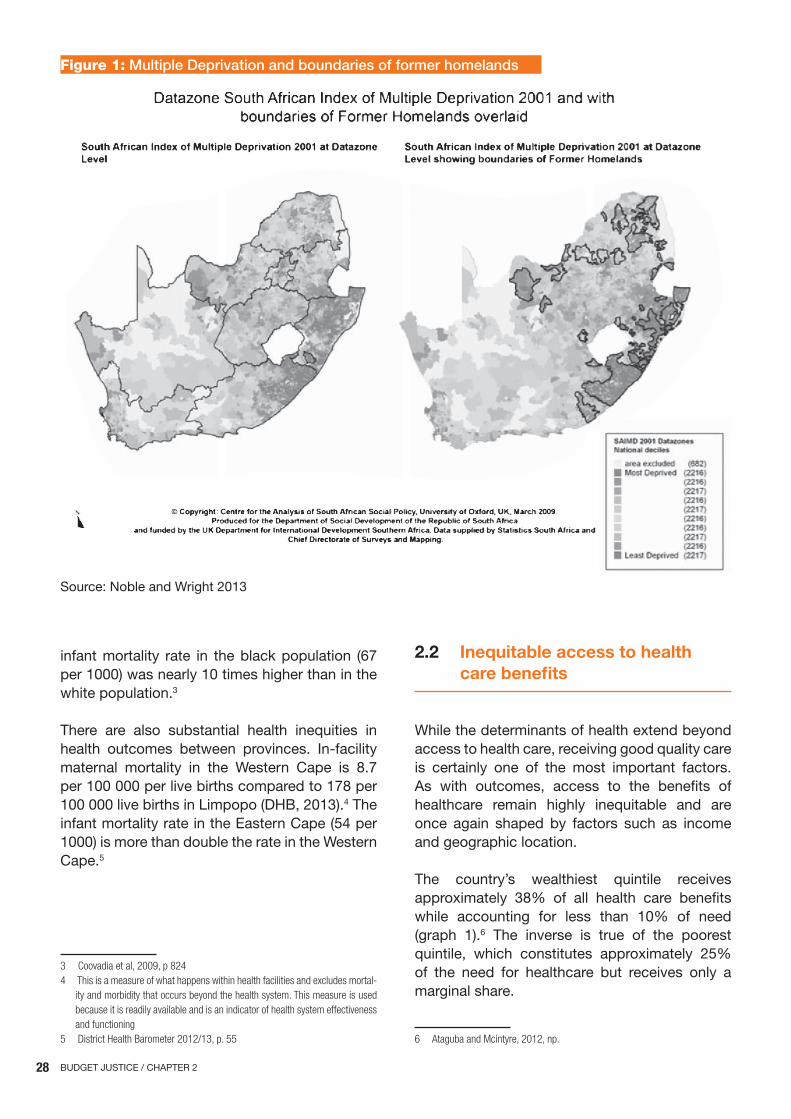
28 BUDGET JUSTICE / CHAPTER 2
infant mortality rate in the black population (67 per 1000) was nearly 10 times higher than in the white population.3
There are also substantial health inequities in health outcomes between provinces. In-facility maternal mortality in the Western Cape is 8.7 per 100 000 per live births compared to 178 per 100 000 live births in Limpopo (DHB, 2013).4 The infant mortality rate in the Eastern Cape (54 per 1000) is more than double the rate in the Western Cape.5
3 coovadiaetal,2009,p8244 Thisisameasureofwhathappenswithinhealthfacilitiesandexcludesmortal-
ityandmorbiditythatoccursbeyondthehealthsystem.Thismeasureisusedbecauseitisreadilyavailableandisanindicatorofhealthsystemeffectivenessandfunctioning
5 DistrictHealthBarometer2012/13,p.55
2.2 Inequitable access to health care benefits
While the determinants of health extend beyond access to health care, receiving good quality care is certainly one of the most important factors. As with outcomes, access to the benefits of healthcare remain highly inequitable and are once again shaped by factors such as income and geographic location.
The country’s wealthiest quintile receives approximately 38% of all health care benefits while accounting for less than 10% of need (graph 1).6 The inverse is true of the poorest quintile, which constitutes approximately 25% of the need for healthcare but receives only a marginal share.
6 atagubaandMcintyre,2012,np.
Figure 1: Multiple Deprivation and boundaries of former homelands
Source: Noble and Wright 2013
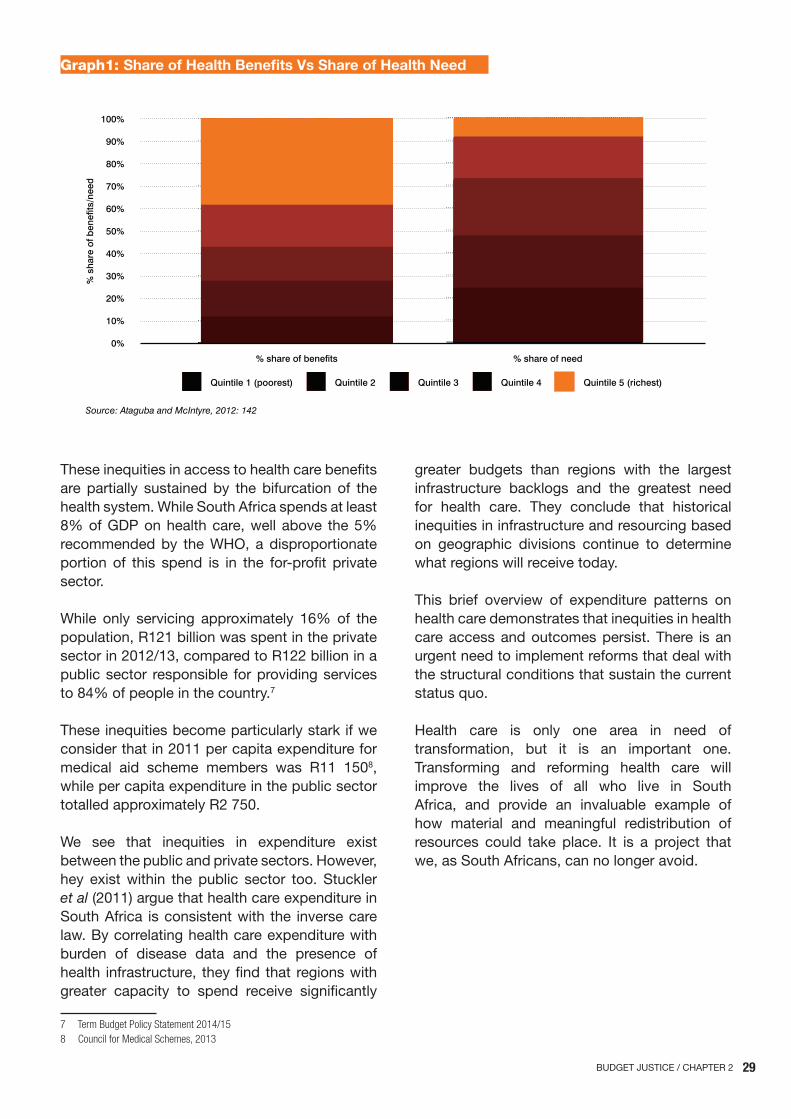
29BUDGET JUSTICE / CHAPTER 2
These inequities in access to health care benefits are partially sustained by the bifurcation of the health system. While South Africa spends at least 8% of GDP on health care, well above the 5% recommended by the WHO, a disproportionate portion of this spend is in the for-profit private sector.
While only servicing approximately 16% of the population, R121 billion was spent in the private sector in 2012/13, compared to R122 billion in a public sector responsible for providing services to 84% of people in the country.7
These inequities become particularly stark if we consider that in 2011 per capita expenditure for medical aid scheme members was R11 1508, while per capita expenditure in the public sector totalled approximately R2 750.
We see that inequities in expenditure exist between the public and private sectors. However, hey exist within the public sector too. Stuckler et al (2011) argue that health care expenditure in South Africa is consistent with the inverse care law. By correlating health care expenditure with burden of disease data and the presence of health infrastructure, they find that regions with greater capacity to spend receive significantly
7 TermBudgetpolicyStatement2014/158 councilforMedicalSchemes,2013
greater budgets than regions with the largest infrastructure backlogs and the greatest need for health care. They conclude that historical inequities in infrastructure and resourcing based on geographic divisions continue to determine what regions will receive today.
This brief overview of expenditure patterns on health care demonstrates that inequities in health care access and outcomes persist. There is an urgent need to implement reforms that deal with the structural conditions that sustain the current status quo.
Health care is only one area in need of transformation, but it is an important one. Transforming and reforming health care will improve the lives of all who live in South Africa, and provide an invaluable example of how material and meaningful redistribution of resources could take place. It is a project that we, as South Africans, can no longer avoid.
Graph1: Share of health Benefits vs Share of health need
In terms of access to health care the relationship is clear.
Research recently published by Ataguba and Mcintyre
(2012) on access to health care in South Africa provides
striking evidence for this. They found that the country’s
wealthiest quintile receives approximately 38% of all
health care benefits—largely through a well-resourced
private sector—while accounting for less than 10% of
need (graph 2). The inverse is true of the poorest quintile,
which constitutes approximately 25% of the need for
healthcare but receives only marginally more than 10%
of health benefits in a poorly functioning public system
(Ataguba and McIntyre, 2012).
graPh 1
share of benefits vs. share of need
Source: Ataguba and McIntyre, 2012: 142
% share of benefits
% s
hare
of b
enefi
ts/n
eed
100%
60%
70%
80%
90%
50%
40%
30%
20%
10%
0%
% share of need
Quintile 2Quintile 1 (poorest) Quintile 4 Quintile 5 (richest)Quintile 3
The inequities in access to benefits between these two
systems becomes even more apparent if we consider that
in 2011 per capita expenditure for medical aid scheme
members was R11 150 (Council for Medical Schemes,
2013) while per capita expenditure in the public sector
only totalled approximately R 2750.
Despite these clear inequities in expenditure the
government itself plays an active role in sustaining
inequities in expenditure. In terms of the current tax
regimen the government subsidises private medical aid
scheme membership by allowing taxpayers to claim tax
back for contributions to schemes. Figures provided by
the National Treasury reveal that in the 2008/09 financial
year alone the fiscal cost of these subsidies was R16.7
billion (National Treasury, 2011).
Even though this system has been reformed to ensure
greater equity between taxpayers through a shift to a
system of tax credits that are the same regardless of
tax-bracket, it fails to address inequities between those
who earn enough to pay tax and those who do not (see
Eagar, 2011 for an analysis of the tax treatment of medical
scheme membership).
62 / Budget Justice / health care financing reforM in south africa: equity, social Justice and the nhi

30 BUDGET JUSTICE / CHAPTER 2
South Africa has a history of investigations, proposals, commitments and resistance to comprehensive health system reform that extends nearly 80 years into the past. Indeed, South Africa was one of the first countries ever to consider broad reaching health system reforms under the banner of a unified National Health System. It is remarkable that we are still debating whether it is a good idea or not in 2014. More importantly, perhaps, this history reminds us of just how easily transformative programmes can be undone.
3.1 1935-1994: good intentions
The first proposal for reform came in 1935 when the department of public health of the Union of South Africa appointed a committee of inquiry to explore the possibility of introducing a unified national health system that would extend access to the entire population.9
The commission made a number of important recommendations on how a national health system should be organised and funded through a national health insurance scheme. But elements within government resisted the extension of the scheme to the black population, and nothing came of the commission’s proposals.10
The issue re-emerged in 1942 when the government established another commission of inquiry into the development of a National Health System. Chaired by Dr Henry Gluckman, the commission reviewed earlier proposals on reform, consulted with experts and stakeholders and undertook a four-month exploratory tour of the health care provision in the country.11 After two years, the commission published a report that set out a clear position with regard to the fundamental basis for reform. More specifically, the commission’s findings called for:
9 Harrison,199310 ibid11 phillips,1993
y a unitary health system under the control of a national department that would coordinate and oversee policy development and service delivery at all levels;
y coordination between government departments to ensure that all aspects of health - not just health care - were catered for in a health promotion strategy;
y health care would be organised in four dimensions: promotion of health; prevention of ill-health; cure or alleviate ill-health or injury; and the rehabilitation for the disabled; and
y the introduction of health centres as the basic unit of care. These health centres would focus on primary health care services that combine health promotion with curative services through a multi disciplinary team.
As with earlier recommendations, the Gluckman Commission findings failed to take hold within government. The only element of the recommendations that was implemented was the piloting of the health centres as the basis for primary health care (PHC).12
The National Party came to power in the early 1950s and for the next four decades public policy gave little social or political space to health care reforms of the kind proposed by Gluckman Commission.
By the mid-1980s, the Nationalist government was producing and implementing policies that resulted in the deregulation of the health system and opened up space for the privatisation of healthcare.13 This move was marked by amendments made to the National Health Act in 1984, which had the stated intention of establishing a private health insurance system that ‘everyone could afford’. However, the implicit intention was ‘preventing the socialisation of medicine’.14.
12 phillips,199313 KautzkyandTaulman,200814 vandenHeever,2011
3. rEForMInG ThE SySTEM: GluCKMAn To ThE nhI GrEEn pApEr
31BUDGET JUSTICE / CHAPTER 2
Further legislative reforms were made shortly before the elections in 1994, which further opened the market for the medical scheme industry by allowing government employees to move to open schemes and through the removal of a broad range of minimum benefits. The timing of these reforms ensured that when the ANC came to power that the private medical scheme industry would have sufficient membership and economic power to resist any attempts by the new government to introduce reforms that would result in the formation of a unified public health system.15
3.2 1994-2011: failure to launch
The ANC had been developing a health plan prior to coming to power. Made public shortly after the election in 1994, the ANC National Health Plan mapped out reforms that drew heavily on the Gluckman Commission report of 1994 and global health conventions such as the Declaration of Alma-Ata (1978). The plan called for the introduction of a mandatory Social Health Insurance (SHI) and a unitary health system built around primary health care (PHC). In essence the ANC’s plan envisioned the socialisation of medicine with a very small role for the private sector.
In 1995, a committee of inquiry into the National Health System was established to explore options for introducing an SHI scheme in South Africa. The committee proposed that the initial phases of the introduction of an SHI would involve increasing the accessibility of the private sector to a broader range of the population.16 This would be made possible, the party argued, by subsidising medical scheme coverage for low-income groups and enhancing equity and cross-subsidisation through a risk equalisation fund.17
In 1997, a Social Health Insurance working group was established by the national department of health to investigate options for taking earlier recommendations forward. The working group recommended that the SHI be limited to the
15 ibid16 Wadeeetal,200317 ibid
formally employed population who earned above the tax threshold. Risk pooling would be facilitated through a National SHI fund, which would cover a set package of care.18
Nothing came of the recommendations made by the 1995 inquiry into a NHS or those of the 1997 working group. This was largely because of increasing prominence given to liberalisation under policies such as the Growth Employment and Redistribution macro-economic framework, continued resistance by the private sector, and the government’s reluctance to implement a risk equalisation fund.19
In 2002, the need to re-examine the introduction of health system reforms under the banner of SHI were once again brought to the fore in the findings of the Taylor Committee of Inquiry into a comprehensive system of social security for South Africa. In fact, the Taylor Committee’s recommendations went a step further than those of the inquiries in 1995 and 1997 by asserting that in the long-term, South Africa should move towards a unitary system, or NHI, that integrated the public and private systems under a single contributory and benefits system.
The Taylor committee envisioned a phased approach to implementation with initial preparatory activities that included:
y strengthening of the public sector and improvements in quality of care at state facilities;
y addressing historical and persistent geographic inequities in the resourcing of health care;
y further regulation of the private sector in an effort to contain costs;
y the introduction of a state sponsored medical scheme for low-income groups;
y compulsory insurance coverage for state employees; and
y the implementation of the risk equalisation fund.20
18 McIntyreandvandenHeever,200719 Wadeeetal,200320 McIntyreandvandenHeever,2007
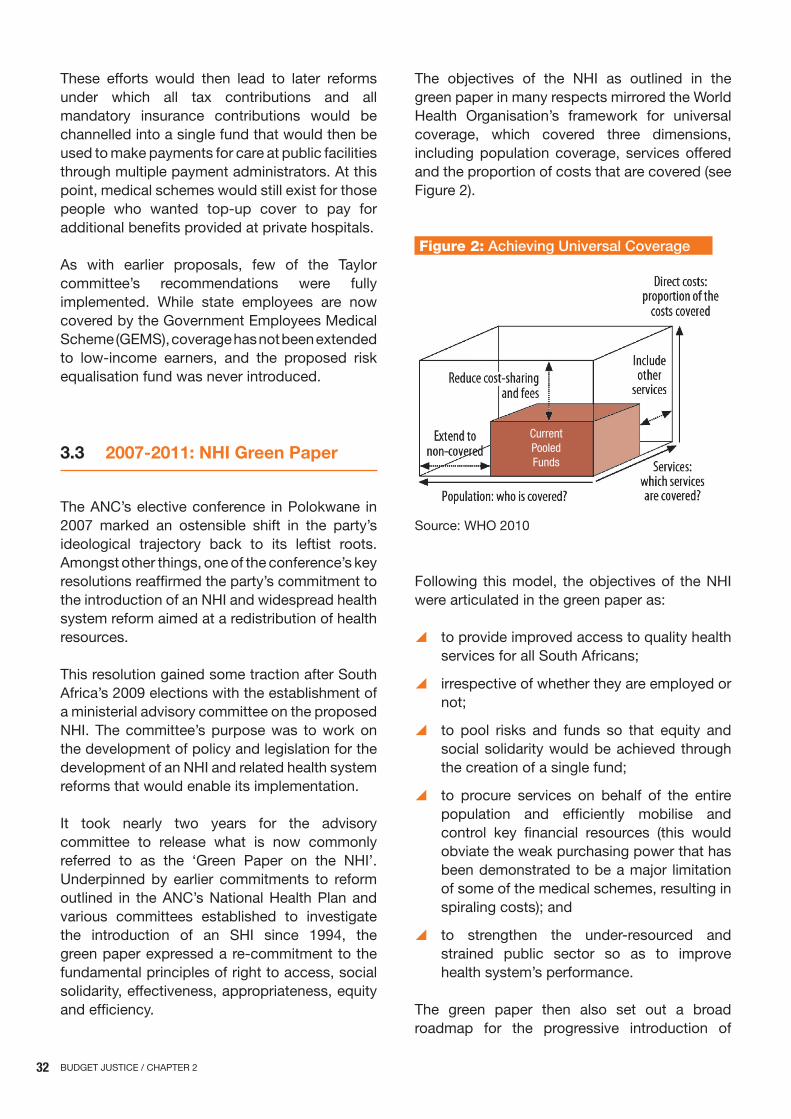
32 BUDGET JUSTICE / CHAPTER 2
These efforts would then lead to later reforms under which all tax contributions and all mandatory insurance contributions would be channelled into a single fund that would then be used to make payments for care at public facilities through multiple payment administrators. At this point, medical schemes would still exist for those people who wanted top-up cover to pay for additional benefits provided at private hospitals.
As with earlier proposals, few of the Taylor committee’s recommendations were fully implemented. While state employees are now covered by the Government Employees Medical Scheme (GEMS), coverage has not been extended to low-income earners, and the proposed risk equalisation fund was never introduced.
3.3 2007-2011: nhI Green paper
The ANC’s elective conference in Polokwane in 2007 marked an ostensible shift in the party’s ideological trajectory back to its leftist roots. Amongst other things, one of the conference’s key resolutions reaffirmed the party’s commitment to the introduction of an NHI and widespread health system reform aimed at a redistribution of health resources.
This resolution gained some traction after South Africa’s 2009 elections with the establishment of a ministerial advisory committee on the proposed NHI. The committee’s purpose was to work on the development of policy and legislation for the development of an NHI and related health system reforms that would enable its implementation.
It took nearly two years for the advisory committee to release what is now commonly referred to as the ‘Green Paper on the NHI’. Underpinned by earlier commitments to reform outlined in the ANC’s National Health Plan and various committees established to investigate the introduction of an SHI since 1994, the green paper expressed a re-commitment to the fundamental principles of right to access, social solidarity, effectiveness, appropriateness, equity and efficiency.
The objectives of the NHI as outlined in the green paper in many respects mirrored the World Health Organisation’s framework for universal coverage, which covered three dimensions, including population coverage, services offered and the proportion of costs that are covered (see Figure 2).
Figure 2: Achieving Universal Coverage
Source: WHO 2010
Following this model, the objectives of the NHI were articulated in the green paper as:
y to provide improved access to quality health services for all South Africans;
y irrespective of whether they are employed or not;
y to pool risks and funds so that equity and social solidarity would be achieved through the creation of a single fund;
y to procure services on behalf of the entire population and efficiently mobilise and control key financial resources (this would obviate the weak purchasing power that has been demonstrated to be a major limitation of some of the medical schemes, resulting in spiraling costs); and
y to strengthen the under-resourced and strained public sector so as to improve health system’s performance.
The green paper then also set out a broad roadmap for the progressive introduction of
Current Pooled Funds
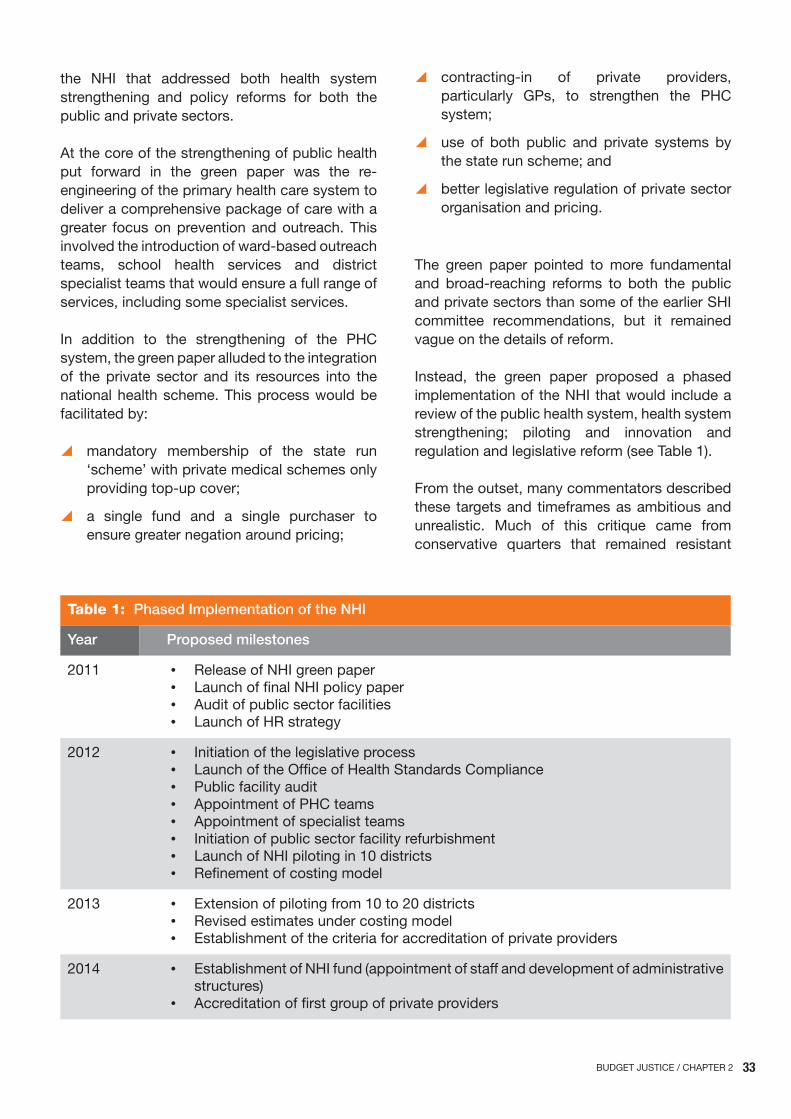
33BUDGET JUSTICE / CHAPTER 2
the NHI that addressed both health system strengthening and policy reforms for both the public and private sectors.
At the core of the strengthening of public health put forward in the green paper was the re-engineering of the primary health care system to deliver a comprehensive package of care with a greater focus on prevention and outreach. This involved the introduction of ward-based outreach teams, school health services and district specialist teams that would ensure a full range of services, including some specialist services.
In addition to the strengthening of the PHC system, the green paper alluded to the integration of the private sector and its resources into the national health scheme. This process would be facilitated by:
y mandatory membership of the state run ‘scheme’ with private medical schemes only providing top-up cover;
y a single fund and a single purchaser to ensure greater negation around pricing;
y contracting-in of private providers, particularly GPs, to strengthen the PHC system;
y use of both public and private systems by the state run scheme; and
y better legislative regulation of private sector organisation and pricing.
The green paper pointed to more fundamental and broad-reaching reforms to both the public and private sectors than some of the earlier SHI committee recommendations, but it remained vague on the details of reform.
Instead, the green paper proposed a phased implementation of the NHI that would include a review of the public health system, health system strengthening; piloting and innovation and regulation and legislative reform (see Table 1).
From the outset, many commentators described these targets and timeframes as ambitious and unrealistic. Much of this critique came from conservative quarters that remained resistant
Table 1: Phased Implementation of the NHI
Year Proposed milestones
2011 • Release of NHI green paper• Launch of final NHI policy paper• Audit of public sector facilities• Launch of HR strategy
2012 • Initiation of the legislative process• Launch of the Office of Health Standards Compliance• Public facility audit• Appointment of PHC teams• Appointment of specialist teams• Initiation of public sector facility refurbishment• Launch of NHI piloting in 10 districts• Refinement of costing model
2013 • Extension of piloting from 10 to 20 districts• Revised estimates under costing model• Establishment of the criteria for accreditation of private providers
2014 • Establishment of NHI fund (appointment of staff and development of administrative structures)
• Accreditation of first group of private providers

34 BUDGET JUSTICE / CHAPTER 2
to reforms in principle, but there were legitimate concerns around the existing capacity within the public sector to take on such a mammoth task. Questions concerning political will, technical capacity, public sector readiness and financial constraints were raised in many, if not all, stakeholder submissions on the green paper.
That said, it seems that there is still the political will within the national department of health to take the process forward. Even so, it is impossible to ignore the difficulties and risks that confront what is arguably the most significant reform process aimed at redistribution of resources and equity since 1994.
3.4 Estimating the cost of the nhI and how it would be funded
One of the most controversial aspects of the NHI as outlined in the green paper has been estimating its cost and identifying sources of income for the plan. Competing views have been offered on the affordability of the NHI. Some stakeholders have argued that trade-offs with regard to spending on other critical priorities, such as education, would be significant and unsustainable.21
Estimating what the NHI will cost involves modelling based on certain basic assumptions with regard to the benefits package and utilisation. The green paper estimated that the total cost of the NHI by the time it was fully functional in 2025 would be R255 billion (2010 prices).22
This is substantially more than the R110 billion that was available in the public sector in the 2010/11 financial year. But if private sector expenditure is included, total health care expenditure in South Africa in 2010/11 increased to R227 billion or 8.5% of GDP.23
Based on the estimates, there is a shortfall of R23 billion (2010 prices), but it is not as significant as some interest groups opposed to health financing reform would lead us to believe.24
21 econex,201122 NHIGreenpaper2011,p4723 ibid,p.4824 econex has been a particularly vociferous opponent to the NHI.Their view
onthecostofreformscanbefoundhere:http://www.mediclinic.co.za/about/
The NHI green paper does not go into the details of revenue generation, or how funds would flow, but it does note that additional taxes, preferably mandatory NHI levies in the form of additional income taxes rather than regressive VAT, would be the most appropriate option.
There are obviously some significant barriers to meeting these resource needs. While the green paper argues that public sector expenditure on health care under the NHI will only increase to 6.5% of GDP by 2025, this would still demand a shift away from conservative fiscal policy and face a persistent reluctance to increase taxes. There is also no guarantee that funds currently in the private sector will automatically flow into the NHI as it expands and the space for medical aid schemes diminishes.
The green paper states that resources generated through mechanisms such as an NHI payroll tax would flow into a single risk pool in the form of a NHI Fund that would be independent of the national department of health. The NHI Fund would act as a single payer purchasing services from both public and private providers.
Generating additional funding would require that all the parties involved in healthcare re-think their priorities and approaches to generating revenue for health services. As the next section will show, it takes more than just political will on the part of the national department of health to generate sufficient momentum to get a national health scheme off the ground.
Documents/ecONeX%20NHI%20note%207.pdf
35BUDGET JUSTICE / CHAPTER 2
In the three years since the release of the green paper in 2011, progress on the progressive implementation has been somewhat mixed.
As table 1 indicates, certain milestones would have to be reached by the end of the year an indication that the country is finally on track for the kind of reform envisioned in 1944 by the Gluckman commission and then again in 1994 in the ANC’s National Health policy paper.
But, while progress has been steady in some areas, in others it has not.
4.1 nhI pilot districts
Early in 2012, a total of 11 NHI pilot districts were established around the country with the purpose of testing whether they could manage greater delegation and levels of responsibility, piloting of service delivery innovations and assess the feasibility of contracting with private sector. The pilot districts were chosen based on their socio-economic and epidemiological profiles with a view to establishing how rolling out the NHI would work, particularly within particularly difficult service delivery contexts.
Initially, the districts were established as semi-autonomous pilot projects with the provincial departments and district management teams having a great deal of control over implementation. Funds for piloting were transferred through a conditional grant from the national level, and so could only be used for specific activities, but day-to-day responsibilities were delegated to districts.
After the first year of piloting, however, it was apparent that provincial and district authorities were uncertain about what piloting involved. They also lacked the technical capacity to coordinate and implement innovations. By the end of the
2012/13 financial year, most of the pilot districts had underspent their grants; five of them had spent less than half of what was made available to them.25 Where spending did take place, it was often on goods, services and equipment only peripherally related to piloting.
By the beginning of the 2013/14 financial year, the national department appointed NHI coordinators at the national level to oversee the district level projects, essentially bypassing provincial structures and authority. This included the centralisation of funding for piloting. The measure was an indication of perceived capacity constraints to implement reforms at the provincial and district levels.
The department has not extended piloting to 20 districts as envisaged in the green paper. There is no indication of whether or not this was even still being considered.
4.2 phC re-engineering
This appears to be the area that the national department of health has focused much of its attention during the initial phases of implementation. District specialist teams, ward based outreach teams and school health services have been established in all districts.
The extent to which these structures are functional is unclear. The department does not report on progress in this area in publically available documentation. However, a number of reports have lamented the difficulties experienced in the recruitment of specialists, budget constraints limiting staff appointments and a continued lack of clarity around the role and position of community health workers (CHWs).26
25 parliamentaryMonitoringGroup,201426 SouthafricanHealthreview,2013p.65
4. ThrEE yEArS In: WhAT proGrESS hAS BEEn MADE?
36 BUDGET JUSTICE / CHAPTER 2
4.3 private sector contracting
An aspect of the proposed NHI is that the system will draw on private sector resources through a contracting arrangement with various elements of the private system. Over the short term the goal is to draw on general practitioners to provide services at PHC facilities (contracting in) with the long-term aim of drawing on a full range of services including private hospitals and specialists.
By the end of the 2013/14 financial year much of the groundwork in terms of developing criteria for contracting and reimbursement had been completed and the national department of health had started contracting GPs to deliver services at clinics and district hospitals in pilot districts. As with the DSTs, difficulties in recruiting health professionals to this programme appear to be the major barrier to implementation. By the middle of 2014, only 140 GPs had been contracted directly by the national department of health to the programme to provide services in more than 52 health districts.27
4.4 office of health Standards Compliance (ohSC)
The Office of Health Standards Compliance (OHSC) was established in 2013. It has been mandated with monitoring health establishments, including private establishments, in terms of meeting norms and standards established by the minister. For 2014/15, the office will have an operational budget of R109 million, which increases to R135 million in 2016/17.28 The 2014/15 budget is approximately R50 million more than the previous year. The OHSC has also filled 84 internal posts and a constituted board oversees operations. Taken together, these elements indicate a shift to active monitoring of the health system rather than the establishment of systems and infrastructure.
A baseline audit of all 3 880 public health facilities was completed by the middle of 2013. This baseline audit was followed by an assessment
27 departmentofhealthNationaldepartmentofhealthpersonalcorrespondence28 “NationaldepartmentofHealth:personalcorrespondence.”
of facilities in NHI districts, which found that mean scores across most assessment domains had declined, including cleanliness (-6%), the availability of medicines and supplies (-8.7%), staff attitudes (-3.6%) and patient safety (-5.8%). The review found that only a third of NHI pilot site facilities had the necessary staffing levels, infrastructure, pharmacy services, and equipment to provide a comprehensive package of PHC services.29
4.5 legislative reform:
Initial commitments suggested that legislative reform would start with the release of a final NHI policy paper (white paper) at the end of 2011, with a draft NHI Bill ready for consultation as early as the beginning of 2013. These commitments have been pushed back a number of times. The content of proposed legislative reforms remains as opaque as it was at the start of the process.
Also, communications around progress in meeting targets initially outlined in the NHI Green Paper have generally been poor. It is uncertain if this is because progress has been slow or if the department of health is working quietly behind the scenes and good progress is in fact being made.
29 NationaldepartmentofHealth,2013
37BUDGET JUSTICE / CHAPTER 2
In the absence of an open process that involves all stakeholders along the NHI path, we need to dig a little deeper to determine what the true priorities are and what is planned for the near future.
Two key government documents provide some insight into where the department of health is at with regard to meeting its NHI milestones. The first is the department’s annual performance plan (APP), which outlines its goals and broad objectives for the NHI, and at the same time outlines concrete time-frames for the implementation of key activities. The second, and arguably more important document, is the department’s budget, which outlines the resources committed to the implementation of activities.
5.1 national department of health Annual performance plan 2014/15: re-stating nhI commitments
Each year, government departments at the national and provincial levels are required to publish strategic plans detailing their priority objectives, programmes, activities and service delivery targets. These plans must provide a clear roadmap for each department’s activities over the coming year and give an indication of what the priorities are over the next three years.
The increased centralisation of NHI piloting, innovation and legislative reform means that we need only look at the national department’s APP for 2014/15 to get a sense of where NHI currently is.
The department of health has established the National Health Insurance, Health Planning and Systems Enablement programme at the national level to oversee and coordinate the development
and implementation of NHI-related activities. The programme’s mandate is clear:
‘Improve access to quality health services through the development and implementation of policies to achieve universal coverage, health financing reform, integrated health systems planning, reporting, monitoring and evaluation and research’.30
As Table 2 overleaf (adapted from the 2014/15 APP) indicates, this mandate encompasses all aspects of the NHI and its progressive implementation as outlined in the green paper, with the exception of PHC-re-engineering, which remains a provincial function.
As regards the commitments outlined in this plan, the NHI white paper is due to be released in 2014 as a draft bill for consultation. If the APP is to be believed, this is also the year when the structures of the NHI Fund are to be established and the funding model developed.
The plan also commits the department to the expansion of the NHI pilot districts from ten in 2014/15 to 26 by 2016/17. This is still far off the initial target set out in the green paper, but progress nonetheless.
In terms of private sector regulation, the APP commits important reforms to pricing in this sector with the drafting and publication of a National Pricing Bill in 2014/15, with promulgation as early as 2016/17.
To judge by the APP, the department is forging ahead with the implementation of the NHI. While it is behind schedule in many areas, particularly
30 NationaldepartmentofHealth,2014,p.22
5. WhErE ArE WE noW: polICy CoMMITMEnTS AnD ThE BuDGET For ThE nhI In 2014/15
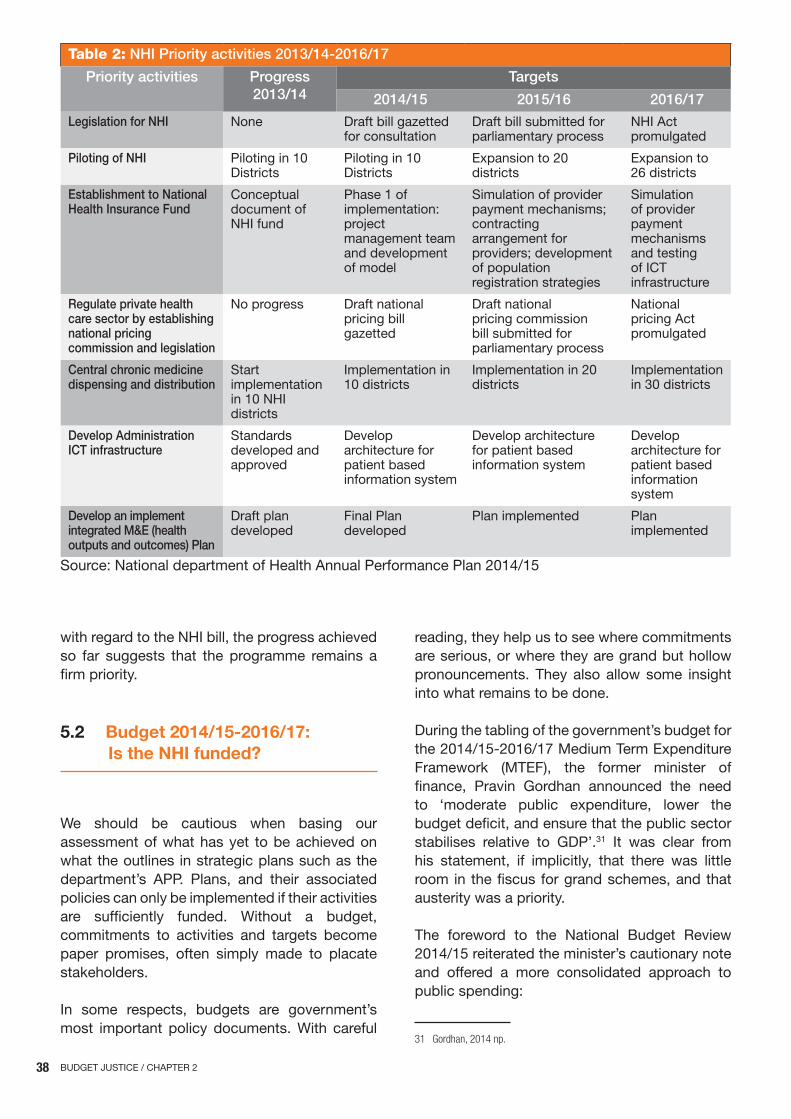
38 BUDGET JUSTICE / CHAPTER 2
with regard to the NHI bill, the progress achieved so far suggests that the programme remains a firm priority.
5.2 Budget 2014/15-2016/17: Is the nhI funded?
We should be cautious when basing our assessment of what has yet to be achieved on what the outlines in strategic plans such as the department’s APP. Plans, and their associated policies can only be implemented if their activities are sufficiently funded. Without a budget, commitments to activities and targets become paper promises, often simply made to placate stakeholders.
In some respects, budgets are government’s most important policy documents. With careful
reading, they help us to see where commitments are serious, or where they are grand but hollow pronouncements. They also allow some insight into what remains to be done.
During the tabling of the government’s budget for the 2014/15-2016/17 Medium Term Expenditure Framework (MTEF), the former minister of finance, Pravin Gordhan announced the need to ‘moderate public expenditure, lower the budget deficit, and ensure that the public sector stabilises relative to GDP’.31 It was clear from his statement, if implicitly, that there was little room in the fiscus for grand schemes, and that austerity was a priority.
The foreword to the National Budget Review 2014/15 reiterated the minister’s cautionary note and offered a more consolidated approach to public spending:
31 Gordhan,2014np.
Table 2: NHI Priority activities 2013/14-2016/17
Priority activities Progress 2013/14
Targets
2014/15 2015/16 2016/17
Legislation for NHI None Draft bill gazetted for consultation
Draft bill submitted for parliamentary process
NHI Act promulgated
Piloting of NHI Piloting in 10 Districts
Piloting in 10 Districts
Expansion to 20 districts
Expansion to 26 districts
Establishment to National Health Insurance Fund
Conceptual document of NHI fund
Phase 1 of implementation: project management team and development of model
Simulation of provider payment mechanisms; contracting arrangement for providers; development of population registration strategies
Simulation of provider payment mechanisms and testing of ICT infrastructure
Regulate private health care sector by establishing national pricing commission and legislation
No progress Draft national pricing bill gazetted
Draft national pricing commission bill submitted for parliamentary process
National pricing Act promulgated
Central chronic medicine dispensing and distribution
Start implementation in 10 NHI districts
Implementation in 10 districts
Implementation in 20 districts
Implementation in 30 districts
Develop Administration ICT infrastructure
Standards developed and approved
Develop architecture for patient based information system
Develop architecture for patient based information system
Develop architecture for patient based information system
Develop an implement integrated M&E (health outputs and outcomes) Plan
Draft plan developed
Final Plan developed
Plan implemented Plan implemented
Source: National department of Health Annual Performance Plan 2014/15
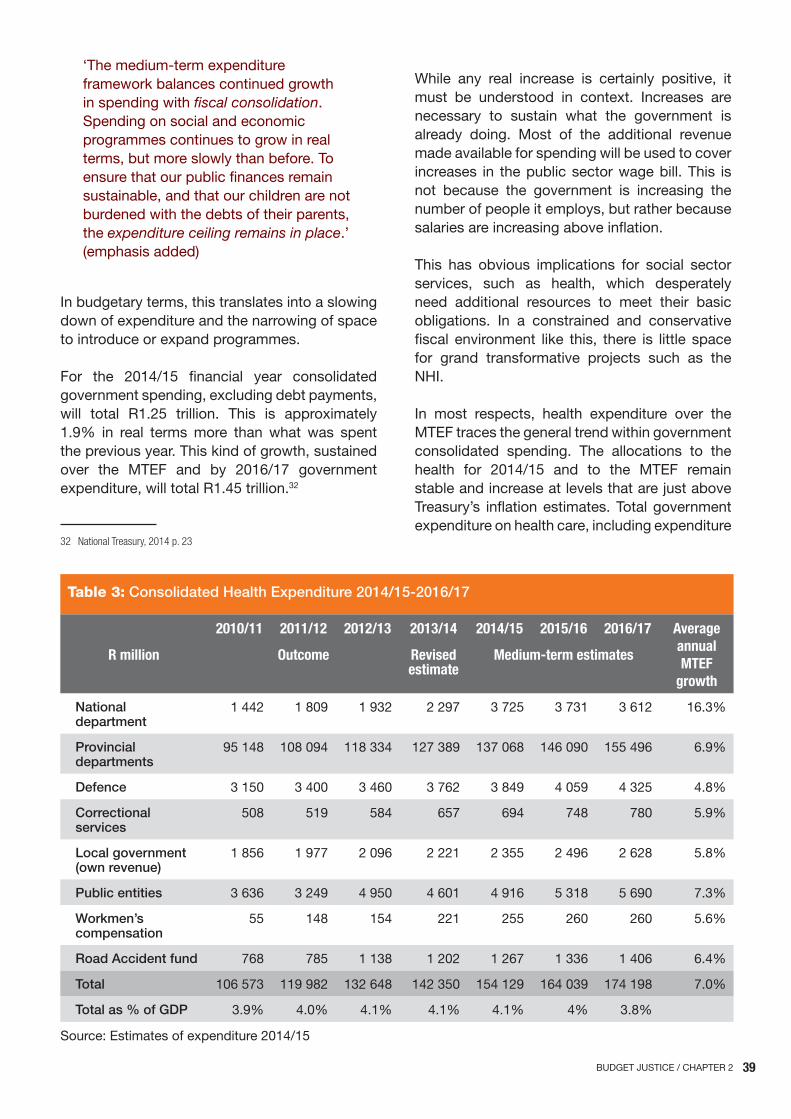
39BUDGET JUSTICE / CHAPTER 2
‘The medium-term expenditure framework balances continued growth in spending with fiscal consolidation. Spending on social and economic programmes continues to grow in real terms, but more slowly than before. To ensure that our public finances remain sustainable, and that our children are not burdened with the debts of their parents, the expenditure ceiling remains in place.’ (emphasis added)
In budgetary terms, this translates into a slowing down of expenditure and the narrowing of space to introduce or expand programmes.
For the 2014/15 financial year consolidated government spending, excluding debt payments, will total R1.25 trillion. This is approximately 1.9% in real terms more than what was spent the previous year. This kind of growth, sustained over the MTEF and by 2016/17 government expenditure, will total R1.45 trillion.32
32 NationalTreasury,2014p.23
While any real increase is certainly positive, it must be understood in context. Increases are necessary to sustain what the government is already doing. Most of the additional revenue made available for spending will be used to cover increases in the public sector wage bill. This is not because the government is increasing the number of people it employs, but rather because salaries are increasing above inflation.
This has obvious implications for social sector services, such as health, which desperately need additional resources to meet their basic obligations. In a constrained and conservative fiscal environment like this, there is little space for grand transformative projects such as the NHI.
In most respects, health expenditure over the MTEF traces the general trend within government consolidated spending. The allocations to the health for 2014/15 and to the MTEF remain stable and increase at levels that are just above Treasury’s inflation estimates. Total government expenditure on health care, including expenditure
Table 3: Consolidated Health Expenditure 2014/15-2016/17
2010/11 2011/12 2012/13 2013/14 2014/15 2015/16 2016/17 Average annual MTEF
growth
R million Outcome Revised estimate
Medium-term estimates
National department
1 442 1 809 1 932 2 297 3 725 3 731 3 612 16.3%
Provincial departments
95 148 108 094 118 334 127 389 137 068 146 090 155 496 6.9%
Defence 3 150 3 400 3 460 3 762 3 849 4 059 4 325 4.8%
Correctional services
508 519 584 657 694 748 780 5.9%
Local government (own revenue)
1 856 1 977 2 096 2 221 2 355 2 496 2 628 5.8%
Public entities 3 636 3 249 4 950 4 601 4 916 5 318 5 690 7.3%
Workmen’s compensation
55 148 154 221 255 260 260 5.6%
Road Accident fund 768 785 1 138 1 202 1 267 1 336 1 406 6.4%
Total 106 573 119 982 132 648 142 350 154 129 164 039 174 198 7.0%
Total as % of GDP 3.9% 4.0% 4.1% 4.1% 4.1% 4% 3.8%
Source: Estimates of expenditure 2014/15
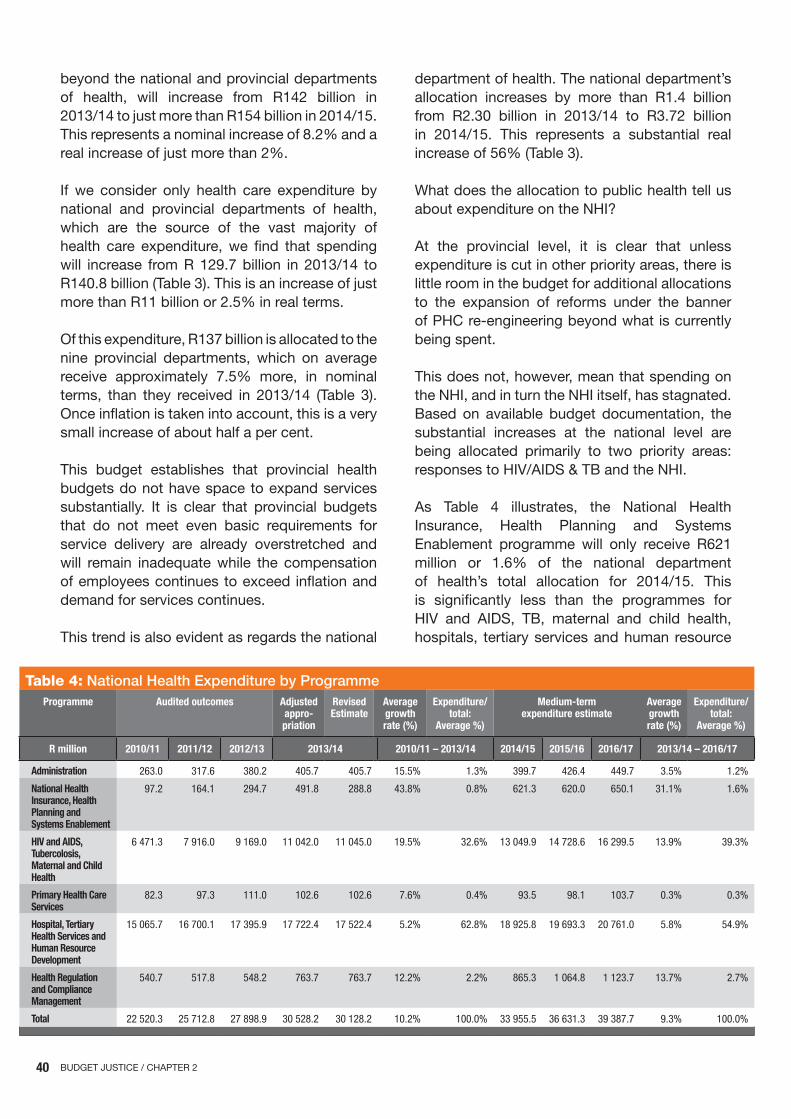
40 BUDGET JUSTICE / CHAPTER 2
beyond the national and provincial departments of health, will increase from R142 billion in 2013/14 to just more than R154 billion in 2014/15. This represents a nominal increase of 8.2% and a real increase of just more than 2%.
If we consider only health care expenditure by national and provincial departments of health, which are the source of the vast majority of health care expenditure, we find that spending will increase from R 129.7 billion in 2013/14 to R140.8 billion (Table 3). This is an increase of just more than R11 billion or 2.5% in real terms.
Of this expenditure, R137 billion is allocated to the nine provincial departments, which on average receive approximately 7.5% more, in nominal terms, than they received in 2013/14 (Table 3). Once inflation is taken into account, this is a very small increase of about half a per cent.
This budget establishes that provincial health budgets do not have space to expand services substantially. It is clear that provincial budgets that do not meet even basic requirements for service delivery are already overstretched and will remain inadequate while the compensation of employees continues to exceed inflation and demand for services continues.
This trend is also evident as regards the national
department of health. The national department’s allocation increases by more than R1.4 billion from R2.30 billion in 2013/14 to R3.72 billion in 2014/15. This represents a substantial real increase of 56% (Table 3).
What does the allocation to public health tell us about expenditure on the NHI?
At the provincial level, it is clear that unless expenditure is cut in other priority areas, there is little room in the budget for additional allocations to the expansion of reforms under the banner of PHC re-engineering beyond what is currently being spent.
This does not, however, mean that spending on the NHI, and in turn the NHI itself, has stagnated. Based on available budget documentation, the substantial increases at the national level are being allocated primarily to two priority areas: responses to HIV/AIDS & TB and the NHI.
As Table 4 illustrates, the National Health Insurance, Health Planning and Systems Enablement programme will only receive R621 million or 1.6% of the national department of health’s total allocation for 2014/15. This is significantly less than the programmes for HIV and AIDS, TB, maternal and child health, hospitals, tertiary services and human resource
Table 4: National Health Expenditure by ProgrammeProgramme Audited outcomes Adjusted
appro-priation
Revised Estimate
Average growth rate (%)
Expenditure/ total:
Average %)
Medium-term expenditure estimate
Average growth rate (%)
Expenditure/ total:
Average %)
R million 2010/11 2011/12 2012/13 2013/14 2010/11 – 2013/14 2014/15 2015/16 2016/17 2013/14 – 2016/17
Administration 263.0 317.6 380.2 405.7 405.7 15.5% 1.3% 399.7 426.4 449.7 3.5% 1.2%
National Health Insurance, Health Planning and Systems Enablement
97.2 164.1 294.7 491.8 288.8 43.8% 0.8% 621.3 620.0 650.1 31.1% 1.6%
HIV and AIDS, Tubercolosis, Maternal and Child Health
6 471.3 7 916.0 9 169.0 11 042.0 11 045.0 19.5% 32.6% 13 049.9 14 728.6 16 299.5 13.9% 39.3%
Primary Health Care Services
82.3 97.3 111.0 102.6 102.6 7.6% 0.4% 93.5 98.1 103.7 0.3% 0.3%
Hospital, Tertiary Health Services and Human Resource Development
15 065.7 16 700.1 17 395.9 17 722.4 17 522.4 5.2% 62.8% 18 925.8 19 693.3 20 761.0 5.8% 54.9%
Health Regulation and Compliance Management
540.7 517.8 548.2 763.7 763.7 12.2% 2.2% 865.3 1 064.8 1 123.7 13.7% 2.7%
Total 22 520.3 25 712.8 27 898.9 30 528.2 30 128.2 10.2% 100.0% 33 955.5 36 631.3 39 387.7 9.3% 100.0%

41BUDGET JUSTICE / CHAPTER 2
development , which receive 39% and 55% of the total allocation respectively.
Even though the allocation is small when compared to other programmatic areas, the allocation for 2014/15 is more than double the 2012/13 allocations of R295 million for NHI planning and piloting.
The department’s budget documentation for 2014/15 outlines the programmes expenditure priorities for the 2014/15 as follows:
y monitor the prevalence of HIV and AIDS by conducting the 2014 national HIV survey in October and November 2014, and publishing the reports of the 2013 national HIV survey by December 2014;
y complete the system design for a national integrated patient based information system by March 2019, to progressively implement an electronic health record system required for the national health insurance;
y improve the use of information for planning
by progressively expanding access to the national health information repository and data warehouse over the MTEF period;
y improve access to essential medicines by maintaining a less than 3 per cent stock out level for drugs on the essential drugs list, tuberculosis drugs and antiretroviral medicines over the medium term;
y implement the building blocks of the national health insurance by piloting components of the insurance policy in 10 health districts over the MTEF period; and
y regulate the cost of health care in South Africa by establishing a pricing commission that will create a platform for funders and providers of health services to negotiate prices of service providers in the private health sector by 2016/1733
While these spending priorities are in line with those outlined in the APP, not all priorities are equally important. If we consider projected expenditure within this programme (Table 5), we are able to determine the relative importance of 33 estimatesofexpenditure2014/15
Table 5: National Health Insurance Programme Expenditure 2014/15Sub-programme Audited outcomes Adjusted
appropriationAverage growth rate (%)
Expenditure/ total Average (%)
Medium expenditure estmate Average growth rate (%)
Expenditure/ total Average (%)
R thousand 2010/11 2011/12 2012/13 2013/14 2010/11 – 2013/14 2014/15 2015/16 2016/17 2014/15 – 2016/17
Programme Management
2 994 1 393 2 961 0.7% 2 989 3 146 3 326 4.05 0.5%
Technical Policy and Planning
2 552 12 399 3 947 1.8% 2 084 2 184 2 305 -16.4% 0.4%
Health Information Management, Monitoring and Evaluation
21 631 51 918 41 721 44 934 27.6% 15.3% 53 725 24 848 26 572 -16.1% 6.3%
Setor-wide Procurement
13 059 15 569 19 838 21 697 18.4% 6.7% 22 987 24 113 25 392 5.4% 4.0%
Health Financing and National Health Insurance
26 593 39 807 166 337 370 329 140.6% 57.6% 487 210 511 182 535 035 13.0% 79.9%
International Health and Development
35 933 51 246 52 951 47 958 10.1% 18.0% 52 257 54 540 57 430 6.2% 8.95
Total 97 216 164 086 294 679 491 826 71.7% 100.0% 621 252 620 013 650 060 9.7% 100.0%
Source: Estimates of expenditure 2014/15
42 BUDGET JUSTICE / CHAPTER 2
each component of NHI planning and piloting.
As Table 4 indicates, the Health Financing and National Health Insurance sub-programme will receive the bulk of available revenue, with 58% of the total allocation to the programme. Some R487 million has been allocated for 2014/15 and this will increase to R535 million by 2016/17. This is a real average increase of 10% over the MTEF and will remain the most significant allocation for NHI planning and piloting by a long way.
Drilling down into the budget to identify those aspects of this sub-programme that have been prioritised is difficult, but there are important trends that are worth noting. In the Estimates of National Expenditure 2014/15, the department reflects on spending priorities within this sub-programme and states that:
‘The pilot projects began in 2012/13 and were funded through transfer payments. however, in 2013/14, the national health conditional grant was established to provide funding for the pilot projects and funds were shifted accordingly, from spending on transfers to spending on contractors to provide for general medical practitioners contracted to the projects’34
This alludes to a shift in how the department is approaching NHI piloting and what its priorities are now. A review of allocations through the National Health Insurance Conditional Grant, which is used to fund the NHI pilot districts, reveals that funding for pilot districts has decreased by more than half from R150 million in 2012/13 (first year of piloting) to R70 million in 2014/15. This means that each pilot district will only receive approximately R7million for the financial year for piloting at district level.
The allocation for the budget line ‘contractors’, which is largely used to fund GP contracting as part of strengthening the healthcare system, increases from R68 million in 2012/13 to more than R395 million in 2014/15. This is an increase
34 ibid
of 480% in nominal terms. Over the MTEF, this level of spending on contractors is sustained with the total allocation increasing by on average 14% over the MTEF. By 2015/16 this allocation will total R438 million. By then, spending on contractors (largely GPs) will amount to 67% of the national department of health’s total expenditure on NHI planning and piloting.
This tells us that the department’s current strategy with regard to the NHI rests heavily on the contracting in of private GPs to provide services at the PHC level, and not the expansion of piloting beyond the current ten districts.
The sub-programme with the next largest allocation in 2014/15 is the Health Information Management and Monitoring sub-programme, which will receive approximately R54 million or 9% of total programmatic funding (Table 5). This sub-programme is responsible for developing and maintaining a national health information system, commissioning and coordinating research, implementing disease notification surveillance and monitoring programmes, and monitoring and evaluating strategic health programmes.
This allocation appears to be in line with the relative importance given to developing NHI M&E architecture and information systems. The allocation for 2014/15 is deceptive, however, and actually decreases to R27 million in 2015/16. The difference is due to a once-off allocation of R30 million for the South African Demographic Health Survey rather than the introduction of M&E systems.35
While the Demographic Health Survey will certainly add value to understanding the structure of the health system, as well as how people access services and what kind of need is out there, it is only peripherally relevant to establishing the basis for the NHI.
Some 8% of total programmatic funding has been allocated to the International Health and Development sub-programme, which will receive R52 Million in 2014/15 (Table 5). The purpose of this funding is to develop and maintain bilateral and multilateral international agreements to facilitate health system strengthening, technical
35 estimatesofexpenditure2014/15
43BUDGET JUSTICE / CHAPTER 2
capacity development and to lobby for South Africa’s policy position internationally. According to the department, spending priorities in this area over the MTEF are to ‘fund a new health attaché position in Cuba, provide for more students sent to Cuba for medical training, and cover an increase in annual membership fees to the World Health Organisation (WHO).’36
The remaining 5% of the NHI budget at the national level is allocated sector-wide procurement (4% or R22 million), programme management (0.5% or R3 million) and technical policy and planning (0.4% or R2 million) (Table 5). The allocation to technical policy and planning sub-programme is almost exclusively for the maintenance and functioning of the department’s National Health Information Repository and Database (NHIRD), with little or no room for technical support on policy and implementation.
When we link budget allocations with policy level commitments made in the APP, several observations can be made with some confidence on the department’s progress in the phased implementation of the NHI.
The first thing that becomes apparent is that there is little room in the budget for the scale-up of interventions at the provincial level for NHI-related priorities such as PHC re-engineering. Beyond increases for inflation-based salary adjustments, there is no budget for the expansion of district specialist teams, ward based outreach teams and community health care workers.
While the budget does indicate that the NHI remains a priority at the national level, its allocation is relatively small compared to commitments made in the NHI green paper, public statements and departmental strategic planning documentation.
Allocations for piloting at the district level will in fact decrease substantially for the ten existing pilots. The green paper and strategic planning documentation commits to the expansion of piloting, but it is clear that this will not take place in the near future and that the allocations will only become available over the medium term.
36 ibid
It is also clear that the national department of health is directing most of its available resources for the NHI to GP contracting. Drawing on these health care professionals is certainly important, but it is not the kind of broad structural change that is needed. Difficulties in recruiting GPs into the system have shown that it can only have very limited impact on improving access to care for the most vulnerable populations. It does not fundamentally shift how care is distributed and accessed for the majority of people in need.
Beyond GP contracting, a number of smaller systemic interventions are being funded as preparation for various components of the NHI. But the allocations suggest that these are either for once-off interventions that are only peripherally related to the NHI, or budgets assigned for the testing of innovations, rather than implementation.
Ultimately, the NHI budget tells us that progress in phasing the scheme inis extremely slow and will continue to be so. Health system reforms such as PHC re-engineering are wholly inadequate. Other critical elements, such as the NHI fund and private sector regulation, appear to be inadequately funded.
The budget tells us that the NHI now involves a very limited number of interventions that will not result in the transformation of the health system in the near future. Piloting now appears to be a process of fiddling at the margins while the rest is worked out at the national level.
The lack of funding for key NHI related interventions and reforms slows phased implementation, and it puts the scheme at risk of failure before it has even started.

44 BUDGET JUSTICE / CHAPTER 2
Aside from policy commitments, a number of other elements must be considered when assessing progress in transforming the health system and in introducing the kinds of reform that will lead to universal coverage. These include the following questions: whether all sectors of government have the necessary policy commitment to the NHI; if there are external points of resistance to transformation; and whether or not the public broadly supports the NHI more generally.
Each of these is a difficult question to answer and there is not the space to give each issue full attention here. But it is important to mention the kinds of obstacles facing the NHI.
6.1 Treasury’s reticence and financing reform
Arguably one of the most important stakeholders that must support the NHI, if it is going to work, is the National Treasury. The Treasury will be primarily responsible for the finance reform necessary to ensure that the NHI is provided with the resources it needs to function. This includes identifying and implementing the tax mechanisms for the collection of contributions to the NHI fund.
Past experience has shown that National Treasury has taken a conservative stance when it comes to financing large-scale reforms such as the NHI. Treasury has been reluctant to support earlier attempts at health financing reforms. One reason was that they required action that was contrary to its own fiscal policy positions. This is largely because these reforms require the implementation of additional taxes that must be earmarked for a specific purpose. Since the introduction of GEAR, the Treasury has resisted any changes to TAX policy that would be perceived to place an additional financial burden on the middle class.37
37 McIntyreandvandenHeever,2007
We note that the NHI white paper has seen considerable delay. It is possible that Treasury has been reluctant to introduce the kinds of tax reforms necessary to generate the additional revenue necessary to fund the NHI.
As Forslund (2013) has argued, economic growth is unlikely to exceed 3%-4% until 2025. Financing the NHI will demand that government increases its tax to GDP ratio to above 27%, to account for the additional cost – and this increase only takes account of the NHI. This would force Treasury to act counter to its policy of pegging tax at 25% of GDP— an requirement that will no doubt be met with scepticism and resistance.
Treasury’s preparedness to accept increasing expenditure on the NHI, and the associated additional taxes needed to generate revenue for the reform, may very well rest on the rate of economic growth and perceptions of growth of the fiscal space. As Graph 2, supplied by the Treasury (2014), demonstrates, its model for funding for NHI is based on the country’s economic performance over the next couple of decades.
6. proGrESS IS ABouT MorE ThAn JuST ThE MonEy: WhAT ArE ThE oThEr rISKS?
Graph 2: NHI under three economic scenarios
Source: National Treasury, 2014
8.0
7.5
7.0
6.5
6.0
5.5
5.0
4.5
4.0
3.5
3.0 2010 2015 2020 2025 2030 2035 2040
Per
cent
age
of
GD
P
— Low growth
— High growth
— Baseline
45BUDGET JUSTICE / CHAPTER 2
The funding of the NHI could be shaped by the country’s economic performance, as well as on competing economic priorities, rather than by long-term commitments to health reform.
6.2 private sector resistance
As with earlier attempts at reorganising the organisation of health care, private sector interests pose a significant threat to the full implementation of the NHI.
Medical aid schemes are not-for-profit, but their administrations work for profit. If reforms are structured in such a way as to ensure a single purchaser and payer under a single NHI fund, the entire medical scheme administration industry would naturally disappear.
To be fair, medical scheme administrators have not overtly contested the fundamental premise of the NHI, but rather have proposed that resources from the NHI flow through multiple administrators rather than a single fund administrator. Even though this may have some merit, it is a decision that must be based on what is best for promoting equitable access for the entire population.
Private hospital groups arguably have the most to lose from the establishment of an NHI. They may still be allowed to function under the scheme, with the NHI as the only purchaser of their services. But tighter regulations and pricing controls will mean that their profit margins are likely to come under some pressure.
In the past we have seen the Hospital Association of Southern Africa successfully use litigation to counter pricing regulations as part of the implementation of the National Health Reference Price List (NHRPL). More recently Netcare has tried to hinder the interrogation of private hospital operations and make profits by trying to obtain an interdict against KPMG to prevent it from providing services to the Competition Commission. The outcome of the case has yet to be decided, but its effect has been to delay our understanding of how and why the private sector should be regulated
If NHI reforms do not weigh in their favour, private hospital groups have the resources to continue to use litigation to hinder attempts at regulation and control.
6.3 Separation of powers: national Mandates vs provincial Control
South Africa is essentially a federalist state where the government at the national level is largely responsible for legislation, identifying policy priorities and the coordination of service delivery across various levels. Responsibility for planning, budgeting and service delivery, however, largely resides at the provincial and local government levels.
With regard to health care, provinces have largely had the responsibility for strategic planning, budgeting and service delivery. The national department of health has more control over priorities that are funded through conditional grants, such as the response to HIV and AIDS and now the NHI, but day-to-day control remains firmly in the hands of provincial governments.
This poses significant threats to the progressive implementation of the NHI. The NHI is a policy priority that has been developed at the national level. It requires coordination across national, provincial and district levels with some shifting of control and responsibilities between these levels. In many respects the NHI should result in diminishing control over the health system for provinces, with greater delegation of authority to the district level. The national level would become increasingly responsible for prioritisation and control over financial elements.
Responsibility for piloting at the district level has been shifted almost entirely to the national level. Provinces now only have control of a small fraction of what is being spent on piloting at the district level, and they have almost no control over the pilot programme content.
The exclusion of the provinces has resulted in uncertainty around their role in the NHI. At best, it has contributed to growing indifference concerning pilot programme content. This
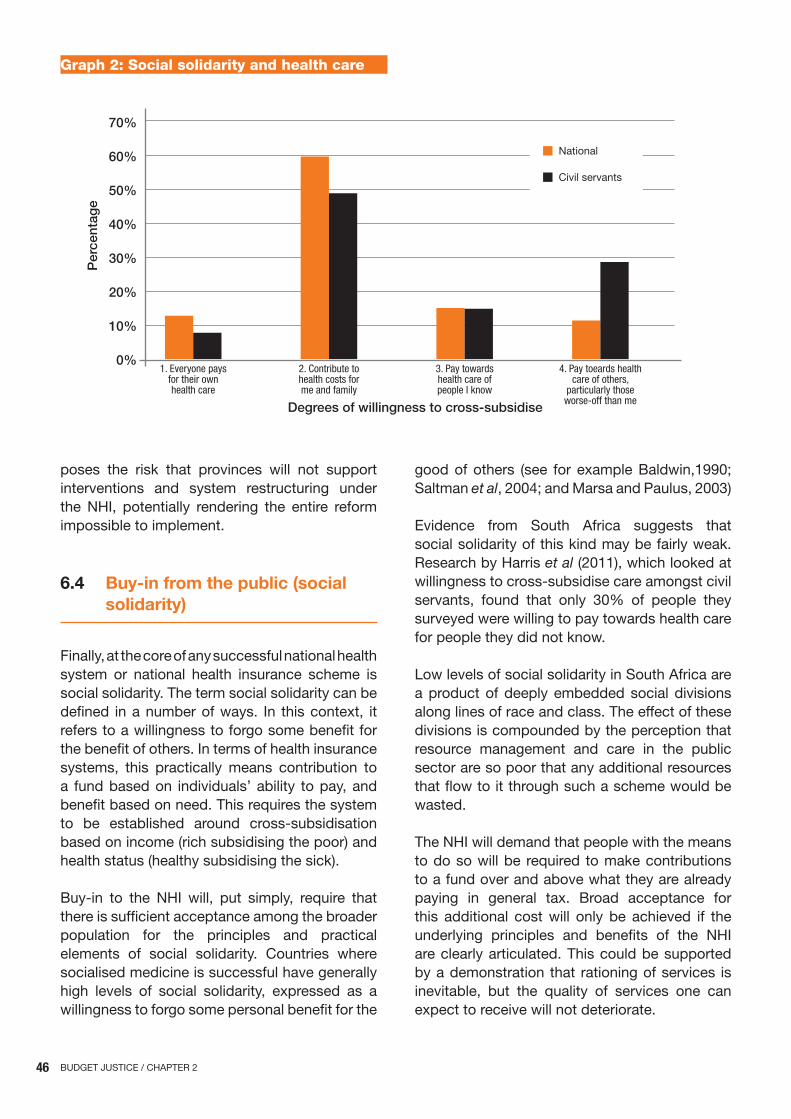
46 BUDGET JUSTICE / CHAPTER 2
poses the risk that provinces will not support interventions and system restructuring under the NHI, potentially rendering the entire reform impossible to implement.
6.4 Buy-in from the public (social solidarity)
Finally, at the core of any successful national health system or national health insurance scheme is social solidarity. The term social solidarity can be defined in a number of ways. In this context, it refers to a willingness to forgo some benefit for the benefit of others. In terms of health insurance systems, this practically means contribution to a fund based on individuals’ ability to pay, and benefit based on need. This requires the system to be established around cross-subsidisation based on income (rich subsidising the poor) and health status (healthy subsidising the sick).
Buy-in to the NHI will, put simply, require that there is sufficient acceptance among the broader population for the principles and practical elements of social solidarity. Countries where socialised medicine is successful have generally high levels of social solidarity, expressed as a willingness to forgo some personal benefit for the
good of others (see for example Baldwin,1990; Saltman et al, 2004; and Marsa and Paulus, 2003)
Evidence from South Africa suggests that social solidarity of this kind may be fairly weak. Research by Harris et al (2011), which looked at willingness to cross-subsidise care amongst civil servants, found that only 30% of people they surveyed were willing to pay towards health care for people they did not know.
Low levels of social solidarity in South Africa are a product of deeply embedded social divisions along lines of race and class. The effect of these divisions is compounded by the perception that resource management and care in the public sector are so poor that any additional resources that flow to it through such a scheme would be wasted.
The NHI will demand that people with the means to do so will be required to make contributions to a fund over and above what they are already paying in general tax. Broad acceptance for this additional cost will only be achieved if the underlying principles and benefits of the NHI are clearly articulated. This could be supported by a demonstration that rationing of services is inevitable, but the quality of services one can expect to receive will not deteriorate.
Graph 2: Social solidarity and health care
70%
60%
50%
40%
30%
20%
10%
0%2. Contribute tohealth costs forme and family
3. Pay towardshealth care ofpeople I know
4. Pay toeards healthcare of others,
particularly those worse-off than me
1. Everyone paysfor their ownhealth care
Degrees of willingness to cross-subsidise
National
Civil servants
Per
cent
age
47BUDGET JUSTICE / CHAPTER 2
Despite having what is widely viewed as the most progressive constitution in the world, South Africa has been unable to deal with entrenched inequality. In every aspect of our society, lines of race, class, gender and even geographic location mark individuals’ opportunities to meet even the most basic needs for health, education and basic services.
We can trace these structural inequalities to origins in colonisation and apartheid but also, more recently, to the implementation of neoliberal macro- economic and policy frameworks that have relied on the market and liberalisation for redistribution and the ‘normalisation’ of our society.
In the last 20 years we have seen that this approach has failed; not only has it failed to ensure that all people have equitable access to the basic necessities of life but it has failed our social justice project.
This failure can clearly be seen in differential access to health care, again based on the markers of race, income and geography. Those who can afford to access services do so in a well-resourced private sector, while those who are socially and economically most vulnerable have to compete for resources in an overburdened public sector.
The health system and access to it need not be this unequal. The first proposals for radical transformation of the health system were first mooted seven decades ago. Yet we are still debating whether it is a good idea or not.
In the last twenty years the government seems to have toyed with ideas, but it has not taken any real steps at the policy level to get a reform process off the ground. The green paper seems to be the first genuine attempt at forging ahead with the development and introduction of an NHI.
But as with any grand transformative project, there will always be risks and resistance from vested interests. We have already seen the private sector voice concerns over choice, quality and capacity. They have quietly gone about identifying ways to slow the process long enough until it fails. Litigation over the market inquiry into pricing in the private sector and opposing pricing regulations is some evidence of this.
As regards government, there seems to be a great deal of reticence from Treasury to buy in to the scheme. Its concerns over affordability and potential financial burdens being placed on the middle class are no small obstacle to be overcome. National Treasury is ultimately a gatekeeper that still needs some convincing.
Treasury is not the only role-player that needs convincing. Any successful reform of this kind depends on the acceptance of the general public of the fundamental principle of social solidarity and a willingness to forgo some benefits so that others can enjoy better access to care. As a country we seem to have missed key opportunities in this regard. We have done little to foster a sense of urgency and commitment to working together to overcome inequality. Few people understand or appreciate just how important the NHI is as a social justice project.
So what can budget 2014/15 tell us?
The NHI has not been abandoned in principle, but the resources it has allocated to piloting, innovation testing and readying infrastructure for implementation suggests that we are still a long way off from any meaningful progress.
The budget suggests that we are still whittling at the margins. There is a lack the urgency and commitment to do what is necessary to get things done. GP contracting, while an invaluable intervention is not sufficient and does not
7. unDoInG CoMplExITy AnD BrInInG SoCIAl JuSTICE BACK In.

48 BUDGET JUSTICE / CHAPTER 2
8. references
Ataguba, John E., and Di McIntyre. ‘Paying for and receiving benefits from health services in South Africa: is the health system equitable?.’ Health policy and planning 27.suppl 1 (2012): i35-i45.
Baldwin, Peter. The politics of social solidarity: class bases of the European welfare state, 1875-1975. Cambridge University Press, 1990.
Coovadia, Hoosen, et al. ‘The health and health system of South Africa: historical roots of current public health challenges.’ The Lancet 374.9692 (2009): 817-834.
Council for Medical Schemes (2013). Annual Report 2011-2012: Council for Medical Schemes. Available at: http://www.medicalschemes.com/files/Annual%20Reports/ReminderARRoadShows2012.pdf
District Health Barometer 2012/13.(2013). Health Systems Trust: Johannseburg
Day and Grey. ‘Health and Related Indicators.’ The South African Health Review (2011)
Evans, David B., and Carissa Etienne. ‘Health systems financing and the path to universal coverage.’ Bulletin of the World Health Organization 88.6 (2010): 402-403.
Forslund, Dick (2012). ‘Personal income taxation and the struggle against poverty and income inequality: tax policy and personal income taxation in South Africa since 1994’. AIDC: Cape Town available http://www.aidc.org.za/media-room/publications/taxation/finish/8-taxation/20-taxation/0
Gordhan, P. ‘National Budget Speech 2014’ (2014). Available at http://www.skillzhub.co.za/files/documents/Gordhan-budget-speech-2014.pdf
Harrison, D. ‘The National Health Services Commission, 1942-1944--its origins and outcome.’ South African medical journal. 83.9 (1993): 679-684.
Maarse, Hans, and Aggie Paulus. ‘Has solidarity survived? A comparative analysis of the effect of social health insurance reform in four European countries.’ Journal of Health Politics, Policy and Law 28.4 (2003): 585-614.
McIntyre, Di, and Alex Van den Heever. ‘Social or national health insurance: pooling of resources and purchasing of health care.’ South African health review (2007): 71-87.
National department of Health. ‘South Africa’s National Health Insurance: The first 18 Months’ (2013) available at http://www.health-e.org.za/documents/4480ccdcfcfaeb3f95c470896dea5455.pdf
National department of Health South Africa. Annual Performance Plan 2014/15. (2014) department of healthNational department of health: Pretoria
National Treasury. Review of National Budget 2014/15. (2014) National Treasury: Pretoria
National Estimates of Revenue and Expenditure 2014/15. National Treasury (2014)
Noble, Michael, and Gemma Wright. ‘Using indicators of multiple deprivation to demonstrate the spatial legacy of apartheid in South Africa.’ Social indicators research 112.1 (2013): 187-201.
Parlamentary Monitoring Group (PMG). ‘NHI Pilot Phase Progress: Health Conditional Grants’ (2014). Cape Town available: http://db3sqepoi5n3s.cloudfront.net/files/140305nhigrants.pdf
Phillips, Hany T. ‘The 1945 Gluckman Report and the establishment of South Africa’s health centers.’ American journal of public health 83.7 (1993): 1037-1039.
Saltman, Richard B., and Hans FW Dubois. ‘The historical and social base of social health insurance systems.’ Series editors’ introduction (2004): 21.
Stuckler, David, Sanjay Basu, and Martin McKee. ‘Health Care Capacity and Allocations Among South Africa’s Provinces: Infrastructure–Inequality Traps After the End of Apartheid.’ American journal of public health 101.1 (2011).
Van den Heever, Alex. ‘Evaluation of the green paper on national health insurance.’ Helen Suzman Foundation (2011).
constitute the kind of redistribution of resources as envisioned by the Gluckman Commission, ANC National Health Plan or the NHI green paper.
Ultimately, as a national project the NHI will require urgency and pressure from below. It is too
easy to get caught up in complexity, in questions of economics and reports on the failings of the public sector. What we should be caught up in is how do to communicate that projects such as the NHI are fundamentally about social justice.
49BUDGET JUSTICE / CHAPTER 3
hits and Misses: Budget 2014’s shotgun approach to gender
Dr. ChrISTI vAn DEr WESThuIZEn Dr Christi van der Westhuizen is an author, researcher and political analyst.
E-mail: [email protected]
BUDGET JUSTICE
3

50 BUDGET JUSTICE / CHAPTER 3
All government functions have a gendered impact. Needless to say, space limitations in this chapter render analysis of all departments impossible. Therefore, it focuses in on specific themes. These are health, especially maternal mortality; work and social development; and gender-based violence.
The department of women, children and people with disabilities (DWCPD) is not included in this analysis, as it was scrapped in the cabinet reshuffle after the May 2014 election. In its place, a ministry on women has been created within the presidency — the third institutional permutation of gender in government.
This change will involve a reduction in the overall budget and a reallocation of budgetary items because the mandates with regards children and people with disabilities have been incorporated into the department of social development. It is unclear whether the funding for the commission for gender equality (CGE) will be routed through the new women’s ministry, as was the case with the DWCPD, which added to the confusion between the roles of the two entities.
The new women’s ministry suggests an admission on government’s side that the creation of the DWCPD was a mistake, as many critics argue.1 Previously, up to 2009, an office on the status of women existed in the presidency. The new women’s ministry marks a return of the gender function to the presidency, but with ministerial status. However, whether this implies a resurrection of the so-called gender machinery —consisting of the CGE, OSW, departmental gender focal points and parliament’s joint standing committee on the improvement of the quality of life and status of women2 — is unclear.
1 partoftheargumentagainstaministryisthatthegendermachinerywascre-atedinthe1990stoenablegendermainstreaming,whileaseparateministryhasaghettoisingeffect.TheDWcpD’sfirst fewyearswerecharacterisedbyconfusion,asitsmandateinrelationtothecGewasunclear.Thesetting-upofthedepartmentwasbesetwithproblems.eventually thefirst incumbentwasreplaced.
2 aparliamentaryportfoliocommitteeonwomenhassincebeencreated.
The budget is the most important policy of government because, without
money, government cannot implement any other policy successfully.
(Budlender and hewitt, 2003: 14)
1. InTroDuCTIon

51BUDGET JUSTICE / CHAPTER 3
Following a proposal by then-ANC MP Pregs Govender in 1994 (Govender, 2007:162-3), non-governmental organisations, in collaboration with parliament’s joint standing committee on finance, launched the Women’s Budget in 1996.
The initiative focused on the gender implications of policy, particularly how the national budget might affect the lives of women and girls, boys and men differently (Budlender, 1996). The benefits of gender-responsive budgets are manifold (Budlender and Hewitt, 2003: 7-8): they can improve economic governance and financial management and help with changing policies and allocation of resources to achieve gender equality. At the same time, for those outside government, gender-responsive budgets can encourage transparency and accountability of government by providing data that can be used for advocacy.
Gender-responsive budgets are not about a 50–50 division of government money between men and boys on the one hand, and women and girls on the other., Instead they look at the complete picture of government revenue and expenditure
from a gender perspective (p8). The aim of this approach is not to create separate budgets to address women’s or gender concerns. This is counterproductive if the rest of the budget still advantages some citizens above others (p.8).
In South Africa, the involvement of role-players both inside and outside of government enhanced the impact of the Women’s Budget of 1996 to the extent that the Budget speech of that year contained a number of promises:
y a statistical database to provide information on the impact of expenditures disaggregated by gender;
y targets and indicators of gender equity in spending; and
y a performance review mechanism in respect of gender (Budlender, 1996).
The finance ministry embarked on a process of creating a gender-responsive budget, but it was not sustained (Budlender and Hewitt, 2003; Govender, 2007: 166-9).
2. BACKGrounD
Moving to the Budget for2014, this paper is based on a scan of the Treasury’s Estimates of National Expenditure for 2014.
It finds the document to be generally gender-blind, in that it fails to consistently acknowledge the differential consequences for women and men of gender. Due to this obliviousness, the budget lacks gender-disaggregated data.
Gender-disaggregated data are essential to facilitate focused allocations of state monies aimed at reversing gender inequities. Without such data, gaps and challenges cannot be identified. It becomes impossible to track the implementation of laws and policies and the real
effects of such laws and policies on women and girls’ lives. Unintended negative gender effects of legislation are also difficult to ascertain without this data.
Each departmental vote in Budget 2014 refers to the National Development Plan (NDP), which contains mentions of gender in some instances and in others not. This creates the impression that the NDP serves as an add-on that has not been integrated into departmental programmes. The implications for programmes are unclear. The NDP itself has also been criticised as gender-blind (Gouws, 2013), which would explain its inconsistency with reference to gender.
3. rAnDoM ApproACh To GEnDEr
52 BUDGET JUSTICE / CHAPTER 3
The absence of a concerted overall focus on gender means that gender features in the budget in a random and ad hoc way that appears to be contingent on departmental whims. Gender interventions seem to be made in a shotgun fashion, determined by a combination of laws aimed at advancing gender equality and, seemingly, by arbitrary decisions taken by political principals or departmental bureaucrats.
The arbitrariness of the inclusion or exclusion of gender is suggested by two elements. First, gender is included as factor in some departmental programmes but not in others, whether or not the latter have gender implications. Second, gender-based objectives are in some instances not backed up programmatically, while in others the results of gender-based interventions are not reported.
It is therefore difficult to determine whether interventions aimed at gender equality are indeed supported with sufficient budgetary allocations, and what the tangible outcomes are of these interventions. The arbitrary approach to gender translates into inconsistencies in implementation of policies, or plain lack of implementation in certain instances.
The gender-blind approach of the 2014 Budget’s Estimates of National Expenditure is inconsistent in its allocations aimed at advancing gender equality, which contributes to the haphazard and incomplete implementation of policies and laws, with similarly haphazard and incomplete effects on women and girls’ lives.
The next section discusses Budget 2014’s Estimates of National Expenditure and the detailed individual budget reports provided for each budget vote.
Gender impinges on every portfolio in government. Particular flashpoints have been identified for analysis: health, especially maternal mortality; work and social development; and gender-based violence. ’We recognise that ‘gender’ should not to be conflated with ‘women’, but our analysis pays particular attention to the gendered disadvantage of women and girls and the extent to which budget allocations address the resultant inequities.
4.1 health
Overall, the health budget for the national and provincial level did not keep track with growth in the national budget. It grew by only 0.5% in 2013/14 in real terms, as compared with 3,5% for the overall budget. However, the health budget
allocation is due to increase by 3% in real terms in 2014/15 (Ndlovu, Vilakazi, Majozi, Sithole, Mbatha and Guthrie, 2013).
Health is gendered. Women remain burdened with care of children and the elderly. Because of their reproductive capacity, they are also more dependent on public health care services than men.
In a 2011 survey, Stats SA found that South African men are more likely than women to assess their own health as good (48,5% vs 46,8%) or very good (35,2% vs 32,6%), while more women than men assess their personal health as poor (7% vs 4,9%) or fair (12,7% vs 10.2%). A major contributing factor, among others, is that more women than men live in poverty in South Africa, with associated conditions that affect health detrimentally.
Though the health department does not apply a gender lens to its objectives, its programmes explicitly refer to women. The department’s strategic plan is linked to the NDP:
4. GEnDEr-rElATED InTErvEnTIonS In SElECTED DEpArTMEnTAl BuDGETS

53BUDGET JUSTICE / CHAPTER 3
[i]n line with the plan’s vision for the reduction of mortality, the department will be implementing a number of interventions to address the causes of maternal, child and infant mortality. over the medium term, the department will scale up family planning services to reduce unplanned pregnancies and improve women’s health (Treasury, 2014a: 325).
As part of the interventions to stem mortality, some 55.4% of women older than 30 years had been screened for cervical cancer at least once in the last decade (Treasury, 2014b: 14). These efforts will be boosted by additional allocations of R200 million in both 2014/15 and 2015/16 to vaccinate women and girls against the human papilloma virus and thus protect them against cervical cancer. This will be achieved by means of a newly-formed component of the national health grant. The sustainability of the rollout is ensured by the fact that funding in 2016/17 will be drawn from the provincial equitable share.
4.1.1 Maternal mortality rate
South Africa’s inordinately high maternal mortality rate persists as a considerable challenge.
International pressure to improve maternal mortality has provided impetus to additional funding of services that would enhance pregnant women’s chances of survival. However, the maternal mortality figures have been contentious, in part due to variances in the figures themselves.
For example, according to a report published by the government in the late 2000s, the maternal mortality rate increased from 150 women per 100 000 live births in 1998 to 369 deaths per 100 000 live births in 2001, and then to 625 per 100 000 live births in 2007 (RSA, n.d.:6).
These figures were revised in a subsequent country report on progress in relation to the United Nations Millennium Development Goals (MDGs), released in 2013.
It confirmed that the maternal mortality rate increased between 2002 and 2009 but decreased in 2010, providing the following numbers: 133 women per 100 000 live births in 2002, compared
to 299 in 2007, 300 in 2008 and 312 in 2009 (RSA, 2013:73). In 2010, according to the 2013 country report, deaths dropped to 269 per 100 000 live births. This was still light years removed from the MDG target of 38 deaths per 100 000 live births, as the report admits.
In the ENE for 2014, the stated goal is to reduce the maternal mortality ratio to 215 deaths per 100 000 live births by 2019. Of particular relevance is Programme 3 for HIV and AIDS, TB and Maternal and Child Health, tasked with HIV and AIDS and sexually transmitted infections, tuberculosis, maternal and child health, and women’s health.
According to Treasury (2014a:327), the ‘spending focus over the medium term will continue to be on increasing life expectancy and reducing the burden of disease’. The emphasis will be on hospital services, specialised tertiary services, and preventing and treating HIV and AIDS.
Within this programme, spending on the item ‘women’s maternal and reproductive health’ grew by 12,8% between 1010/11-2013/14. As shown above, maternal death rates reversed in 2010.
It would seem that spending choices enabled this turnaround. The emphasis on substantively reducing maternal mortality is clear from the items of expenditure: ‘the expansion of women’s health activities, such as supporting the deployment of obstetric ambulances, strengthening family planning services and establishing maternity waiting homes to ensure that the relevant millennium development goals are being met’ (Treasury, 2014a:337).
However, while spending on ‘women’s maternal and reproductive health’ will continue to grow over the medium term 2013/14-2016/17, it will occur at the lower rate of 4%, which will be below projected inflation. Planned interventions during this period include: deploying obstetric ambulances, strengthening family planning services, establishing maternity waiting homes, establishing ‘‘kangaroo’’ mother care facilities, taking essential steps in managing obstetric emergency training for doctors and midwives, and strengthening infant feeding practices.
The target of 215 maternal deaths per 100 000
54 BUDGET JUSTICE / CHAPTER 3
live births by 2019 seems modest. It translates to a reduction of only 54 deaths per 100 000 live births, spaced over a period of nine years. Moreover, it is still far short of the MDG target of 38 deaths per 100 000 live births. Surely a more ambitious target could be set?
Worryingly, Budget 2014 makes no mention of termination of pregnancy. Unsafe abortions cause preventable deaths and are one of the causes of the soaring maternal mortality rate. The health department’s report on maternal mortality for 2005-2007 showed an increase in abortion-related deaths (Department of Health, 2009).
Inexplicably, the latest report, which covers the period 2008-2010, has no separate category to count deaths from septic abortions (Department of Health, 2012). Instead, it uses the term ‘‘septic miscarriage’’ as including abortion but also non-abortion related miscarriages. This change in the categorisation encumbers comparisons with the previous reports. Even so, deaths due to septic miscarriage increased during 2008-2010.
However, the health budget vote is silent on measures to improve access to safe abortion services, as determined by the Choice on Termination of Pregnancy Act of 1996. The increase in these unnecessary deaths is partly due to a drop in the number of designated sites that are operational: from a peak of 67% in 2004/5 to the current 53% (Van der Westhuizen, 2014).
As can be seen from the above outline of the services that money is spent on, the bias in health service provision is towards women who carry their pregnancies to term, in contrast to women who opt to end pregnancies.
Finally, overall the allocation to HIV and AIDS, TB and Maternal and Child Health programme grew by 19.7% between 2010/11 - 2013/14, and is due to rise by another 13.9% between 2013/14 and 2016/17. Most of the increase will go towards HIV and AIDS.
Concerns have been raised that HIV and AIDS funding should not crowd out other pressing priorities. Still, it is also true that women are disproportionately affected by HIV and AIDS,
which also contribute to South Africa’s high maternal mortality. Women will therefore benefit from the additional allocation, including the extra R1 billion in 2016/17 intended to expand access to antiretroviral treatment.
4.2 Work and Social Development
Unemployment affects women disproportionately. Fewer women than men are employed, and more women than men are not economically active (StatsSA, 2013: 26).
Women’s labour force participation rate, at 44.2% in 2012, is low by international standards (OECD, n.d.) Using the narrow definition of unemployment,3 the national unemployment rate for women was 5.4 percentage points higher than the rate for men — 27.6% compared to 22.2% (StatsSA, 2013:30).
Black women are least likely to be employed compared to any other group. They have been most affected by the international economic crisis: their employment dropped from 34.6% in 2001 to 30.8% in 2011 (StatsSA, 2013: 28).
In the light of these facts, the expanded benefits of the Unemployment Insurance Fund Amendment Bill of 2012, as reported in Budget 2014, are to be welcomed. Apart from providing social protection to people who have lost jobs, it also includes the provision of full benefits to women who miscarry (Treasury, 2014a: 413). In 2012/13, R765.9 million was paid to 106 339 claimants for maternity and adoption benefits (Treasury, 2014a: 413).
As regards employment, more women than men find themselves in the informal sector, which is characterised by insecure work, according to Statistics SA (2013: 32). Women are also more likely to supply unpaid work in a household context (StatsSA, 2013: 32), while more men than women are employers. To get a sense of unpaid work due to the continuing burden of care placed on women, the latest available figures show that women do twice as much unpaid work as men, at 165 minutes per day (OECD, n.d.).
3 excludingpeoplewhohavestoppedlookingforwork.

55BUDGET JUSTICE / CHAPTER 3
Just as unemployment chiefly affects black women, poverty is also more prevalent among this group, at 52% (OECD, n.d.). Women and girls far exceed the number of men and boys in the lowest two quintiles when measuring household income.
Some 27.1% of women compared to 15.6% of men live in households with an income up to R325 (first quintile), while 26.1% of women as opposed to 16.4% of men live in households with an income between R326 and R650 (second quintile). In contrast, on the opposite end of the income scale, men and boys ‘are twice as likely as women to be living in households where the household income is R3 206 or more’ (StatsSA, 2013: 48).
This context is recognised in Budget 2014, which provides for grants with the ‘aim to boost the income of poor households, which bear the brunt of unemployment, poverty and inequality that persists in South African society’ (Treasury, 2014a: 421). As has been noted, grants ‘provide an important source of income to households that would otherwise face devastation’ (Brockhoff, 2013:33).
Given the gendered nature of poverty, greater numbers of women than men receive social grants (StatsSA, 2013: 49). In Budget 2014, grants provided through the department of social development’s social assistance programme take up 94% of its total allocation over the medium term. The department expects to pay social grants to 16.5 million beneficiaries by the end of 2016/17. (Treasury, 2014a: 421).
4.2.1 Child support grant
Some 2.9 million people were receiving the old age grant by 30 September 2013 (Treasury, 2014a: 423). However, the child support grant (CSG) is the most commonly accessed grant.
Some 10.9 million children up to the age of 18 received the CSG by 30 September 2013. Given the continued gender division of labour, with the unpaid labour of care preponderantly being performed by women, 98% of the primary
caregivers receiving the grant are women (CASE, 2008:25). These households are the poorest, with the CSG on average accounting for 40% of reported household income (CASE, 2008:2).
In contexts where income is limited and low, grant money such as the CSG is usually pooled to cover general household expenses rather than specifically spent on the targeted child. This is due to the exclusion of the unemployed or working poor from social security, as no protection is available for South Africans above the age of 18 (the maximum age for receiving the CSG) and below the age of 60 (the minimum age for receiving the old age grant).
As Brockhoff (2013) observes, the current model of social security has largely been retained from the apartheid era, when social security only aimed to protect particular vulnerable groups in a white population ‘which experienced near complete employment’ (p.33). Given the conditions of structural unemployment that disproportionately affect black South Africans during their most productive years, such a system is inadequate.
Thus, ‘unemployed adults of working age cannot access social security and can only hope to live off the grants awarded to a member of their household, typically an old age grant or a child support grant’ (Brockerhoff, 2013:10). The 2008 CASE study finds the CSG to be a ‘lifeline’ for households caught up in the high level of unemployment, compounded by few economic opportunities (p.2).
The Financial and Fiscal Commission (FFC) detects a positive correlation between receipt of the CSG and entry into the labour market, increased consumption and production of education and nutritious food (FFC, 2013). According to treasury, the CSG grew by 9.9% between 2010/11 - 2013/14. The Studies in Poverty and Inequality Institute (SPII) refutes the claim that grants keep pace with inflation (Brockerhoff, 2013: 34, 38). For example, inflation trumped the increases in value in CSG and the other social grants in 2012/13 (ibid.).
The trend identified by the SPII continues: 9.9% growth between 2010/11 and 2013/14 is still lower than the real rate of inflation for the years 2010 to
56 BUDGET JUSTICE / CHAPTER 3
2014 (www.inflation.eu; statssa.gov.za). Growth in spending on grants is due to subside to 6.2% between 2013/14 - 2016/17 (Treasury, 2014c:9). The increase over the medium term can mostly be attributed to inflation-related adjustments to grant values, combined with a slight expansion in beneficiaries, according to treasury.
Treasury’s forecast is that, by the end of March 2017, approximately 16.5 million children will be receiving the grant (Treasury, 2014c:9). However, the 2008 CASE study found that 21% of eligible children were not receiving the CSG, particularly in the more urbanised provinces of the Western Cape (34%) and Gauteng (29%) (p.19).
The social development department’s intention to ensure that grants are not unduly awarded is faring well, halting 640 000 illegitimate grants (Treasury, 2014a: 10). However, guaranteeing access to those who rightfully qualify for the grant remains a problem.
Households without any employed members, and which did not receive any remittances or grants, increased from 11.8% to 16.9% between 1997 and 2008 (Brockhoff, 2013:33). With regards the CSG, 2.35 million children continue to be excluded (Proudlock and Martin, 2014). One reason is means-testing, which leads to mistakes in inclusion and exclusion (Brockerhoff, 2013: 34).
The 2007 ‘Review of Targeting Mechanisms and Means Test’ commissioned by the social development department recommended that the means test be scrapped. The FFC (2013) recommends universalisation – ‘that government expands coverage and makes resources available to enable the progressive realisation of an ideal child-support system’ (p.4).
The FFC defines such a system as one that ‘relaxes the existing means test and moves towards faster universalisation of the CSG, while laying foundations for future growth and development. This expansion should happen, even under fiscal consolidation, because of the social and economic benefits’ (p.4).
CASE (2008: 55), among other studies, identified delays in the issuing of birth certificates and
other documentation as a problem that prevents potential recipients from applying for the CSG directly after birth. In particular, guardians who are not the biological parent of a child may run up against problems in accessing documents from government departments.
The Alliance for Children’s Entitlement to Social Security’s court challenge in 2008 on behalf of vulnerable children led to an amendment to the regulations allowing for an affidavit to be presented as part of an application for a grant (Proudlock and Martin, 2014: 18-9). Another intervention to expedite access is online birth registrations at health facilities (Martin, 2014: 65-6).
Nevertheless, new obstacles loom, as created by the Births and Deaths Registration Amendment Act 18 of 2010 and its 2014 regulations on registration of births.
A birth certificate is required for children to access healthcare services, social grants, education, protection services or alternative care (Proudlock, 2014: 2). The regulations place a number of onerous demands on applicants that do not reflect the realities of families in 21st century South Africa.
For example, parents are required to be deceased before another family member can register a child’s birth. This ignores the fact that in excess of three million children do not live with their biological parents despite their parents being alive (Proudlock and Martin, 2014:32-3). Foreign nationals face another burdensome requirement: they must present both proof of residence and passports when applying for birth certificates (p.33).
As Proudlock (2014) remarks, ‘the birth registration law and practice at a service delivery level favours the married, “nuclear” family, while requiring other caregivers who do not fit that mould to navigate increasingly complex checks and burdens of proof’ (p.2). Treasury’s projected expansion to 16.5 million recipients over the medium term suggests that government does not foresee any active attempt to include the missing 3.5 million eligible children.
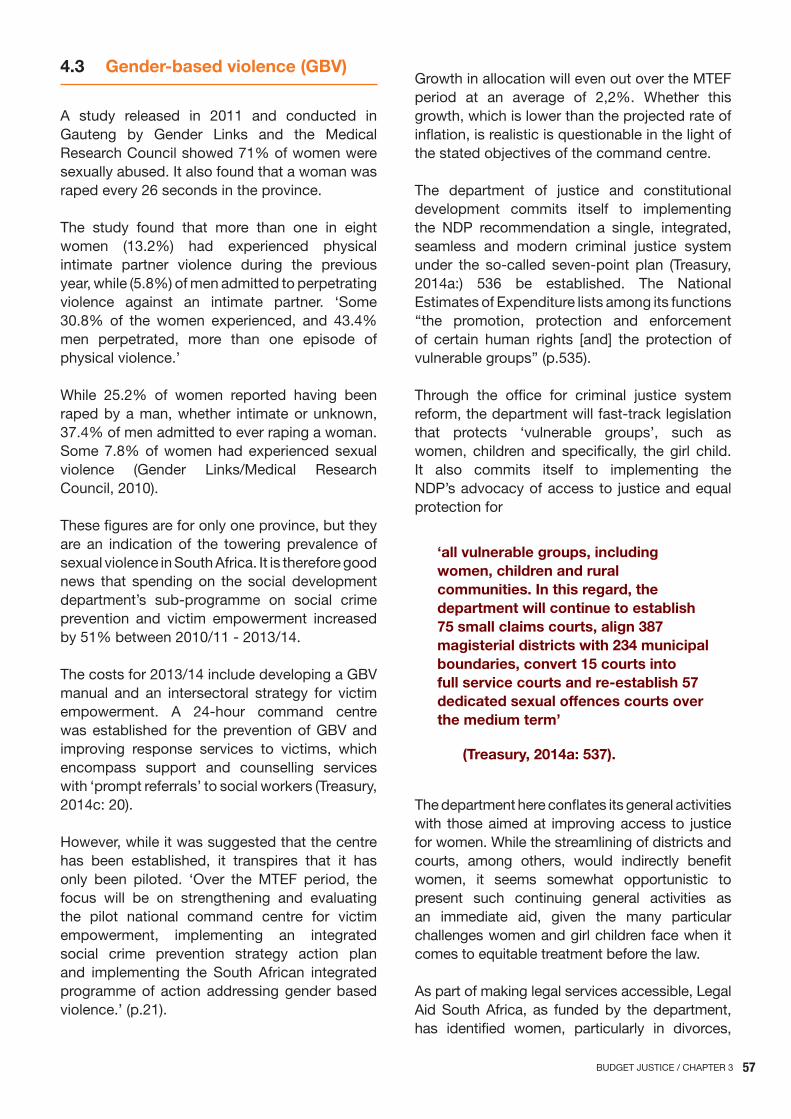
57BUDGET JUSTICE / CHAPTER 3
4.3 Gender-based violence (GBv)
A study released in 2011 and conducted in Gauteng by Gender Links and the Medical Research Council showed 71% of women were sexually abused. It also found that a woman was raped every 26 seconds in the province.
The study found that more than one in eight women (13.2%) had experienced physical intimate partner violence during the previous year, while (5.8%) of men admitted to perpetrating violence against an intimate partner. ‘Some 30.8% of the women experienced, and 43.4% men perpetrated, more than one episode of physical violence.’
While 25.2% of women reported having been raped by a man, whether intimate or unknown, 37.4% of men admitted to ever raping a woman. Some 7.8% of women had experienced sexual violence (Gender Links/Medical Research Council, 2010).
These figures are for only one province, but they are an indication of the towering prevalence of sexual violence in South Africa. It is therefore good news that spending on the social development department’s sub-programme on social crime prevention and victim empowerment increased by 51% between 2010/11 - 2013/14.
The costs for 2013/14 include developing a GBV manual and an intersectoral strategy for victim empowerment. A 24-hour command centre was established for the prevention of GBV and improving response services to victims, which encompass support and counselling services with ‘prompt referrals’ to social workers (Treasury, 2014c: 20).
However, while it was suggested that the centre has been established, it transpires that it has only been piloted. ‘Over the MTEF period, the focus will be on strengthening and evaluating the pilot national command centre for victim empowerment, implementing an integrated social crime prevention strategy action plan and implementing the South African integrated programme of action addressing gender based violence.’ (p.21).
Growth in allocation will even out over the MTEF period at an average of 2,2%. Whether this growth, which is lower than the projected rate of inflation, is realistic is questionable in the light of the stated objectives of the command centre.
The department of justice and constitutional development commits itself to implementing the NDP recommendation a single, integrated, seamless and modern criminal justice system under the so-called seven-point plan (Treasury, 2014a:) 536 be established. The National Estimates of Expenditure lists among its functions ‘‘the promotion, protection and enforcement of certain human rights [and] the protection of vulnerable groups’’ (p.535).
Through the office for criminal justice system reform, the department will fast-track legislation that protects ‘vulnerable groups’, such as women, children and specifically, the girl child. It also commits itself to implementing the NDP’s advocacy of access to justice and equal protection for
‘all vulnerable groups, including women, children and rural communities. In this regard, the department will continue to establish 75 small claims courts, align 387 magisterial districts with 234 municipal boundaries, convert 15 courts into full service courts and re-establish 57 dedicated sexual offences courts over the medium term’
(Treasury, 2014a: 537).
The department here conflates its general activities with those aimed at improving access to justice for women. While the streamlining of districts and courts, among others, would indirectly benefit women, it seems somewhat opportunistic to present such continuing general activities as an immediate aid, given the many particular challenges women and girl children face when it comes to equitable treatment before the law.
As part of making legal services accessible, Legal Aid South Africa, as funded by the department, has identified women, particularly in divorces,

58 BUDGET JUSTICE / CHAPTER 3
maintenance and domestic violence cases, as one of a number of priority groups (Treasury, 2014a: 554). Expenditure is set to accelerate to expand the provision of legal aid to vulnerable groups.
Spending grew by 11,8% between 2010/11 and 2013/14. Over the MTEF, allocations to ‘special projects’ are set to grow by 8,9% (Treasury, 2014d: 25). According to the department, the ‘budget allocations over this period will enable Legal Aid South Africa to increase the number of cases finalised from 437 641 in 2013/14 to 458 663 in 2016/17’ (p.27).
The particular focus on cases where women are more at risk – maintenance,4 divorce and domestic violence – means that the accelerated finalisation of cases should benefit them. However, sexual offences are not included in the list, even though the Shukumisa campaign (2013: 12) identified clearing the backlog in such cases as a priority.
Under the state legal services programme, a commitment is made to ‘[p]romote and strengthen constitutional development through the enhancement of the implementation of the Promotion of Equality and Prevention of Unfair Discrimination Act (2000) [PEPUDA] and the rollout of the training programme for civil society organisations in all 9 provinces on an ongoing basis’ (Treasury, 2014d:15).
Gender is one of the grounds on which unfair discrimination in terms of PEPUDA is prohibited. The advancement of the act though training, albeit belated, can be of benefit.
The sub-programme ‘constitutional development’ includes a programme on the promotion and protection of the rights of lesbian, gay, bisexual, transgender and intersex persons (LGBTI), launched by the end of the 2012/13 period (p.15). Yet again, particular allocations and programme details cannot be determined from the tables provided.
4 apart from the reference tomaintenance under the Legalaid Southafricabudget,nootherreferenceismadetotheimplementationoftheMaintenanceact of 1998. Its execution was hobbled because maintenance investigatorswereappointedin2005,fouryearsaftertheenactmentofthelegislation(Gen-derLinks,n.d.).Whetheradequateprovision isbeingmade formaintenanceinvestigatorsisunclear.Littleresearchseemstoexistinthisregard.
Notably, LGBTI civil society organisations in 2013 requested details on the operationalisation of a task team established and led by the justice department to address violence against LGBTI people (OUT LGBT Well-Being, 2013). The budget contains no further details in this regard.
Treasury has presented a table with selected performance indicators as part of justice budget vote documentation for 2014. Among these is the ‘total number of operational Thuthuzela care centres’5.
Analyses, conducted shortly after the first Thuthuzela centres opened, showed that the centres contributed significantly to the improvement of early care and treatment of victims. Moreover, research showed that while courts prosecuting Thuthuzela cases have low rates of prosecution (12%), they have higher prosecution-to-conviction rates (83%) (DSD, 2008: 77). These grew from 27 in 2010/11 to 43 in 2013/14. Over the MTEF, the number is projected to increase to 60 by 2016/17 (Treasure, 2014d:3). This expansion is stated as an explicit objective of the NPA.
No separate budgetary line item exists for the Thuthuzela centres, which makes their funding difficult to track. However, given that the centres had their genesis in foreign funding (DSD, 2008: 78), concerns about the sustainability of the project (Vetten et al., 2010) may be unfounded, as the planned expansion suggests that the Thuthuzela project has become a wholesale part of the department’s programme.
However, it must be noted that some TCCs are not fully operational, in that they do not provide all of the services. Shukumisa (2013:8) points out that their effectiveness is difficult to ascertain due to the lack of formal policy regulating TCCs,. Indications are that the provision of psycho-social services is haphazard, partly due to lack of clarity about civil society organisations’ involvement and funding of such services (p.8).
5 ‘Thuthuzelacarecentresare24-hourone-stopcentreswherevictimshaveaccesstoallservicessuchasthepolice,counselling,doctors,courtpreparationandprosecution.Themainobjectiveofthesecentresistoeliminatesecondaryvictimization, reducecase cycle timeand increase convictions.’ (presidency,2008:158).
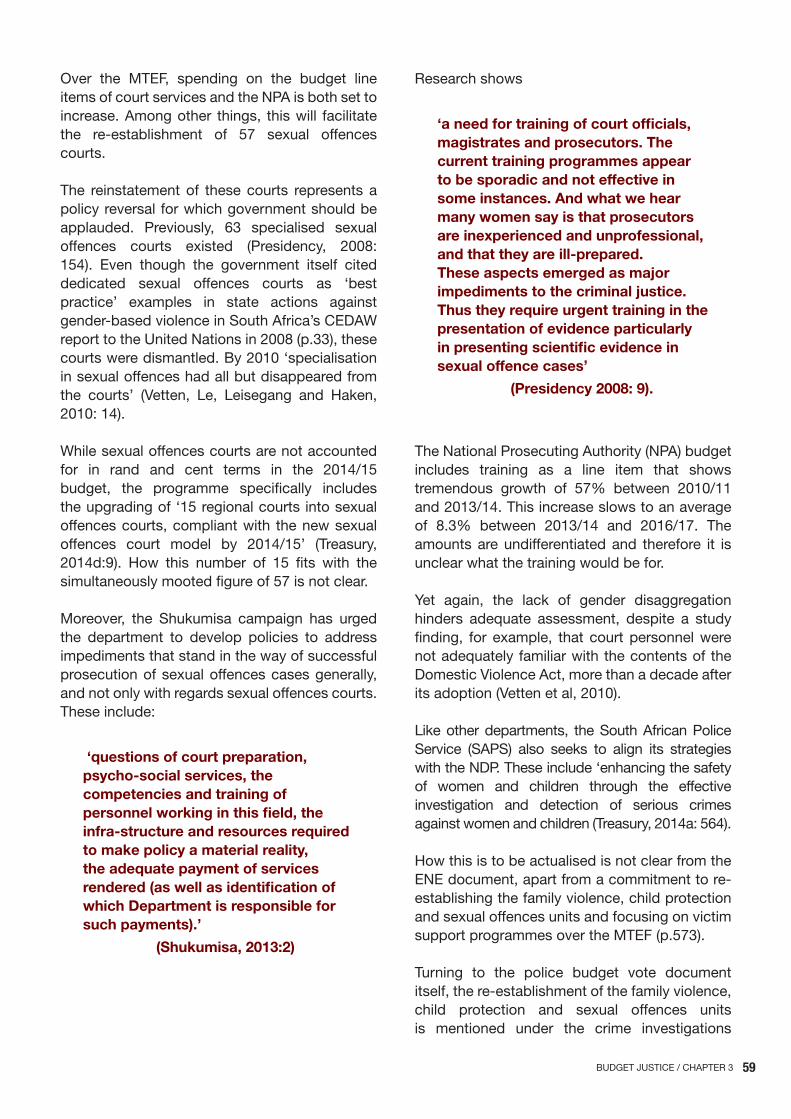
59BUDGET JUSTICE / CHAPTER 3
Over the MTEF, spending on the budget line items of court services and the NPA is both set to increase. Among other things, this will facilitate the re-establishment of 57 sexual offences courts.
The reinstatement of these courts represents a policy reversal for which government should be applauded. Previously, 63 specialised sexual offences courts existed (Presidency, 2008: 154). Even though the government itself cited dedicated sexual offences courts as ‘best practice’ examples in state actions against gender-based violence in South Africa’s CEDAW report to the United Nations in 2008 (p.33), these courts were dismantled. By 2010 ‘specialisation in sexual offences had all but disappeared from the courts’ (Vetten, Le, Leisegang and Haken, 2010: 14).
While sexual offences courts are not accounted for in rand and cent terms in the 2014/15 budget, the programme specifically includes the upgrading of ‘15 regional courts into sexual offences courts, compliant with the new sexual offences court model by 2014/15’ (Treasury, 2014d:9). How this number of 15 fits with the simultaneously mooted figure of 57 is not clear.
Moreover, the Shukumisa campaign has urged the department to develop policies to address impediments that stand in the way of successful prosecution of sexual offences cases generally, and not only with regards sexual offences courts. These include:
‘questions of court preparation, psycho-social services, the competencies and training of personnel working in this field, the infra-structure and resources required to make policy a material reality, the adequate payment of services rendered (as well as identification of which Department is responsible for such payments).’
(Shukumisa, 2013:2)
Research shows
‘a need for training of court officials, magistrates and prosecutors. The current training programmes appear to be sporadic and not effective in some instances. And what we hear many women say is that prosecutors are inexperienced and unprofessional, and that they are ill-prepared. These aspects emerged as major impediments to the criminal justice. Thus they require urgent training in the presentation of evidence particularly in presenting scientific evidence in sexual offence cases’
(presidency 2008: 9).
The National Prosecuting Authority (NPA) budget includes training as a line item that shows tremendous growth of 57% between 2010/11 and 2013/14. This increase slows to an average of 8.3% between 2013/14 and 2016/17. The amounts are undifferentiated and therefore it is unclear what the training would be for.
Yet again, the lack of gender disaggregation hinders adequate assessment, despite a study finding, for example, that court personnel were not adequately familiar with the contents of the Domestic Violence Act, more than a decade after its adoption (Vetten et al, 2010).
Like other departments, the South African Police Service (SAPS) also seeks to align its strategies with the NDP. These include ‘enhancing the safety of women and children through the effective investigation and detection of serious crimes against women and children (Treasury, 2014a: 564).
How this is to be actualised is not clear from the ENE document, apart from a commitment to re-establishing the family violence, child protection and sexual offences units and focusing on victim support programmes over the MTEF (p.573).
Turning to the police budget vote document itself, the re-establishment of the family violence, child protection and sexual offences units is mentioned under the crime investigations
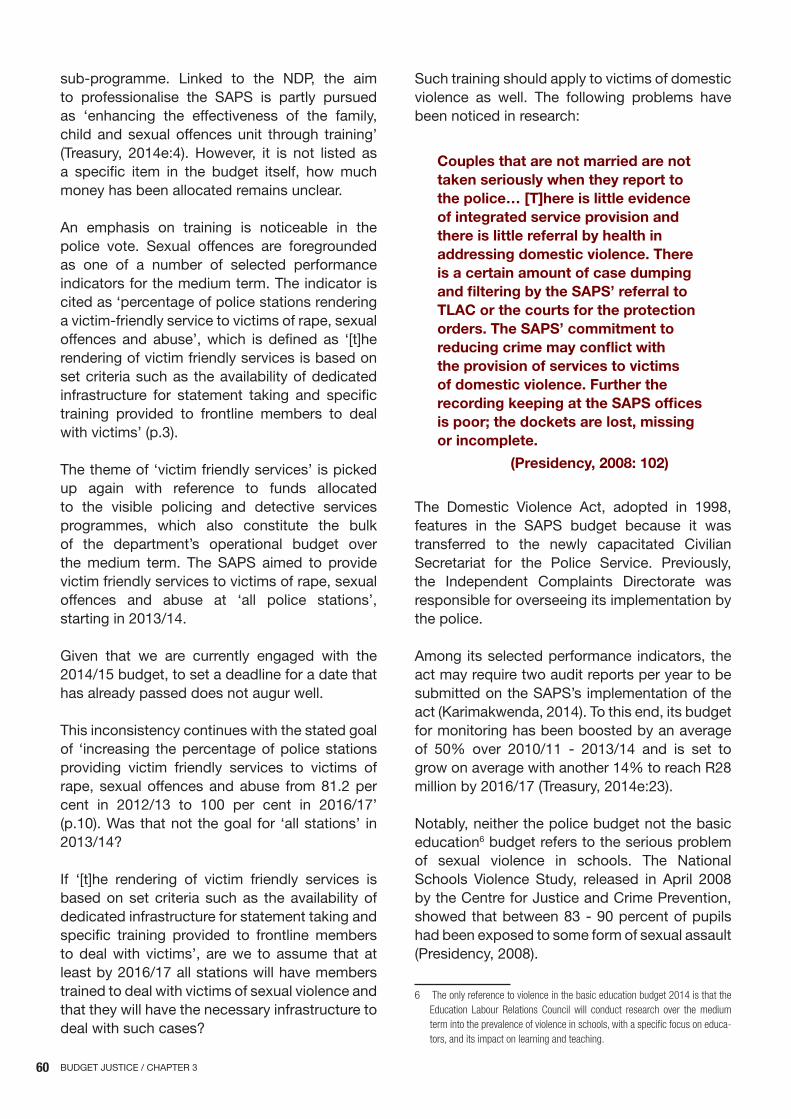
60 BUDGET JUSTICE / CHAPTER 3
sub-programme. Linked to the NDP, the aim to professionalise the SAPS is partly pursued as ‘enhancing the effectiveness of the family, child and sexual offences unit through training’ (Treasury, 2014e:4). However, it is not listed as a specific item in the budget itself, how much money has been allocated remains unclear.
An emphasis on training is noticeable in the police vote. Sexual offences are foregrounded as one of a number of selected performance indicators for the medium term. The indicator is cited as ‘percentage of police stations rendering a victim-friendly service to victims of rape, sexual offences and abuse’, which is defined as ‘[t]he rendering of victim friendly services is based on set criteria such as the availability of dedicated infrastructure for statement taking and specific training provided to frontline members to deal with victims’ (p.3).
The theme of ‘victim friendly services’ is picked up again with reference to funds allocated to the visible policing and detective services programmes, which also constitute the bulk of the department’s operational budget over the medium term. The SAPS aimed to provide victim friendly services to victims of rape, sexual offences and abuse at ‘all police stations’, starting in 2013/14.
Given that we are currently engaged with the 2014/15 budget, to set a deadline for a date that has already passed does not augur well.
This inconsistency continues with the stated goal of ‘increasing the percentage of police stations providing victim friendly services to victims of rape, sexual offences and abuse from 81.2 per cent in 2012/13 to 100 per cent in 2016/17’ (p.10). Was that not the goal for ‘all stations’ in 2013/14?
If ‘[t]he rendering of victim friendly services is based on set criteria such as the availability of dedicated infrastructure for statement taking and specific training provided to frontline members to deal with victims’, are we to assume that at least by 2016/17 all stations will have members trained to deal with victims of sexual violence and that they will have the necessary infrastructure to deal with such cases?
Such training should apply to victims of domestic violence as well. The following problems have been noticed in research:
Couples that are not married are not taken seriously when they report to the police… [T]here is little evidence of integrated service provision and there is little referral by health in addressing domestic violence. There is a certain amount of case dumping and filtering by the SApS’ referral to TlAC or the courts for the protection orders. The SApS’ commitment to reducing crime may conflict with the provision of services to victims of domestic violence. Further the recording keeping at the SApS offices is poor; the dockets are lost, missing or incomplete.
(presidency, 2008: 102)
The Domestic Violence Act, adopted in 1998, features in the SAPS budget because it was transferred to the newly capacitated Civilian Secretariat for the Police Service. Previously, the Independent Complaints Directorate was responsible for overseeing its implementation by the police.
Among its selected performance indicators, the act may require two audit reports per year to be submitted on the SAPS’s implementation of the act (Karimakwenda, 2014). To this end, its budget for monitoring has been boosted by an average of 50% over 2010/11 - 2013/14 and is set to grow on average with another 14% to reach R28 million by 2016/17 (Treasury, 2014e:23).
Notably, neither the police budget not the basic education6 budget refers to the serious problem of sexual violence in schools. The National Schools Violence Study, released in April 2008 by the Centre for Justice and Crime Prevention, showed that between 83 - 90 percent of pupils had been exposed to some form of sexual assault (Presidency, 2008).
6 Theonlyreferencetoviolenceinthebasiceducationbudget2014isthattheeducation Labour relations council will conduct research over the mediumtermintotheprevalenceofviolenceinschools,withaspecificfocusoneduca-tors,anditsimpactonlearningandteaching.
61BUDGET JUSTICE / CHAPTER 3
Regarding the resurgence of ukuthwala – the forced abduction of a female minor, frequently accompanied by rape (Karimakwenda, 2014) – the budget vote on cooperative governance and traditional affairs mentions that research had been conducted (Treasury, 2014f:30) and a concept paper finalised (Treasury, 2014a:43) but omits to mention any direct action and related budget allocation to stem this practice.
5. ConCluSIon
As we have shown, budgetary allocations to particularly redress gender iniquities exist, but they do not correspond with any overarching policy commitment of the kind last seen with the Women’s Budget in 1998.
The latest change in government’s institutional make-up — a new women’s ministry — may present an opportunity to campaign for the reintroduction of the Women’s Budget.
This would be the only way to ensure the consistent application of a gender lens throughout the national budget, which could ultimately result in optimal pairing of policies with money to bring real changes to women’s lives.
References
Brockerhoff, S (2013). ‘A Review of the Development of Social Security Policy in South Africa.’ Studies in Poverty and Inequality Institute. Working Paper 6. July.
Budlender, D (1996). ‘‘South Africa: The Women’s Budget.’’ In Southern Africa Report 12:1. November.
Budlender, D, and Hewitt, G (2003). Engendering Budgets. A Practitioners’ Guide to Understanding and Implementing Gender-Responsive Budgets. London: Commonwealth Secretariat.
CASE (Community Agency for Social Change), (2008). Review of the Child Support Grant: Uses, implementation and obstacles. June.
Department of Health, (2012). ‘‘Saving Mothers 2008-2010: Fifth report on the Confidential Enquiries into Maternal Deaths in South Africa’. Pretoria.
Department of Health, (2009). ‘Saving Mothers 2005-2007: Fourth report on the Confidential Enquiries into Maternal Deaths in South Africa’. Pretoria.
DSD (Department of Social Development), (2008). Victim Empowerment Programme (VEP) Tenth Anniversary Conference Report. 22 September.
FFC (Financial and Fiscal Commission), (2013). ‘Myths and Facts about the Economic Impacts of Child Support Grants.’ Financial and Fiscal Commission Policy Brief 12/2013.
Gouws, A, (2013). ‘Agenda’s Fourth Feminist Dialogue: Critical Absence of Women and Gender in the National Development Plan.’ April. Accessed at: http://www.agenda.org.za/absence-of-women-and-gender-in-national-development-plan/
Govender, P, (2007). Love and courage. A story of insubordination. Auckland Park: Jacana.
Karimakwenda, N (2014). ‘Violent forms of ukuthwala reveal longstanding brutality against women.’ 27 February. Accessed at www.customcontested.co.za.
Martin, P, (2014). ‘Children’s rights to social assistance: A review of South Africa’s Child Support Grant’. In Proudlock P (ed), South Africa’s Progress in Realising Children’s Rights: A Law Review. Cape Town: Children’s Institute, University of Cape Town & Save the Children South Africa.
Ndlovu, N, Vilakazi, M, Majozi, M, Sithole, F, Mbatha, K, Guthrie, T (2013). ‘Trends in national and provincial health and HIV/AIDS budgeting and spending in South Africa.’ Centre for Economic Governance and AIDS in Africa Occasional Paper 1. December.
62 BUDGET JUSTICE / CHAPTER 3
OECD, (n.d.). ‘Closing the Gender Gap: South Africa.’ Accessed at www.oecd.org/gender/closingthegap.htm.
OUT LGBT Well-Being/Triangle Project/HRW/GALA/FEW/Unisa, (2013). ‘OUT concerned at lack of communication regarding LGBT violence task team.’ Accessed at www.out.org.za.
Presidency, (2008). ‘South African Periodic Report: United Nations Convention on the Elimination of Discrimination Against Women (CEDAW) 1998-2008’.
Proudlock, P (2014). ‘Foreword and summary of findings.’ In Proudlock, P (ed), South Africa’s Progress in Realising Children’s Rights: A Law Review. Cape Town: Children’s Institute, University of Cape Town & Save the Children South Africa.
Proudlock, P, and Martin, P, (2014). ‘Children’s rights to birth registration: A review of South Africa’s law.’ In Proudlock, P (ed) South Africa’s Progress in Realising Children’s Rights: A Law Review. Cape Town: Children’s Institute, University of Cape Town & Save the Children South Africa.
RSA, (2013). ‘Millennium Development Goals. Country Report 2013.’ Pretoria.
RSA, (n.d.). ‘Millennium Development Goals. Goal 5. Improving maternal health.’ Pretoria.
Shukumisa Campaign, (2013). ‘Submission to the Portfolio Committee on Justice and Constitutional Development on the strategic plans and budget of the Department of Justice and Constitutional Development and the National Prosecuting Authority.’ 13 April.
Statistics South Africa, (2013). Gender Statistics in South Africa, 2011. Pretoria.
Treasury, (2014a). ‘Estimates of National Expenditure 2014. Abridged version.’
Treasury, (2014b). ‘Budget 2014. Estimates of National Expenditure. Health Vote 16.’
Treasury, (2014c). ‘Budget 2014. Estimates of National Expenditure. Social Development Vote 19.’
Treasury, (2014d). ‘Budget 2014. Estimates of National Expenditure. Justice and Constitutional Development Vote 24.’
Treasury, (2014e). ‘Budget 2014. Estimates of National Expenditure. Police Vote 25.’
Treasury, (2014f). ‘Budget 2014. Estimates of National Expenditure. Cooperative Governance and Traditional Affairs Vote 3.’
Van der Westhuizen, C (2014). ‘Deaths from unsafe abortions must stop.’ In Mail & Guardian. June 20-26. pp. 38-9.
Vetten, L, Le, T, Leisegang, A and Haken, S (2010). The Right and the Real: A Shadow Report Analysing Selected Government Departments’ Implementation of the 1998 Domestic Violence Act and 2007 Sexual Offences Act. Johannesburg: Tshwaranang Legal Advocacy Centre.

63BUDGET JUSTICE / CHAPTER 4
AS ClEAr AS MuDExpEnDITurE AnD plAnnInG TrEnDS In ThE provISIonInG
oF SChool InFrASTruCTurE In SouTh AFrICA
ZuKISWA KoTA
BUDGET JUSTICE
4
Zukiswa Kota is a researcher at the Public Service Accountability Monitor (PSAM) in Grahamstown, a member of the Eastern Cape Department of Education’s Research Committee
and active in Awethu! – a people’s platform for Social Justice.
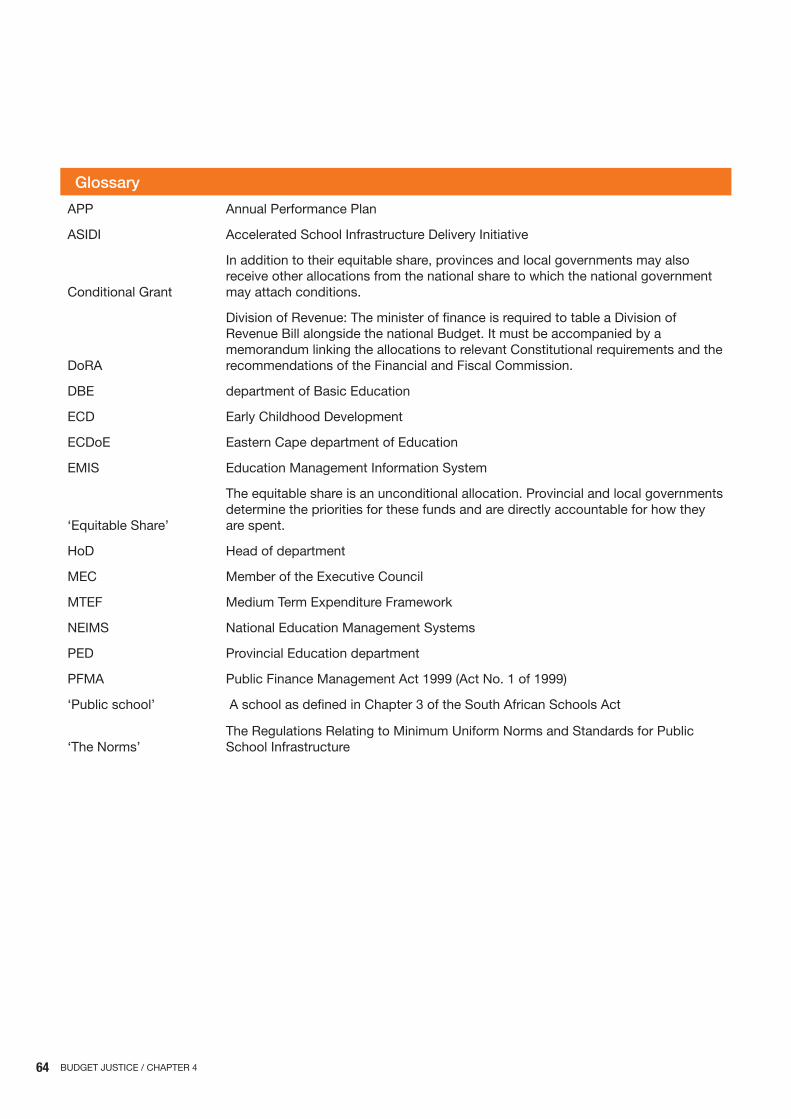
64 BUDGET JUSTICE / CHAPTER 4
Glossary
APP Annual Performance Plan
ASIDI Accelerated School Infrastructure Delivery Initiative
Conditional Grant
In addition to their equitable share, provinces and local governments may also receive other allocations from the national share to which the national government may attach conditions.
DoRA
Division of Revenue: The minister of finance is required to table a Division of Revenue Bill alongside the national Budget. It must be accompanied by a memorandum linking the allocations to relevant Constitutional requirements and the recommendations of the Financial and Fiscal Commission.
DBE department of Basic Education
ECD Early Childhood Development
ECDoE Eastern Cape department of Education
EMIS Education Management Information System
‘Equitable Share’
The equitable share is an unconditional allocation. Provincial and local governments determine the priorities for these funds and are directly accountable for how they are spent.
HoD Head of department
MEC Member of the Executive Council
MTEF Medium Term Expenditure Framework
NEIMS National Education Management Systems
PED Provincial Education department
PFMA Public Finance Management Act 1999 (Act No. 1 of 1999)
‘Public school’ A school as defined in Chapter 3 of the South African Schools Act
‘The Norms’The Regulations Relating to Minimum Uniform Norms and Standards for Public School Infrastructure

65BUDGET JUSTICE / CHAPTER 4
Content
aBSTracT 66Glossary 67KeYNaTIONaLprIOrITIeSaNDTreNDSINeDUcaTIONINfraSTrUcTUre 67 BackgroundandconstitutionalObligations 67 priorities,Budgetsandrights 68NaTIONaLeXpeNDITUreTreNDS 69
TheNationalMinimumUniformNormsandStandardsforSchoolInfrastructure 73prOVINcIaLTreNDSININfraSTrUcTUrepLaNNINGaNDeXpeNDITUre 74
I. easterncape:StuckintheMud 74 II. Kwazulu-Natal:un-SMarTtargets 77 III. Limpopo:Shadyfinancesandnon-existentplans 77
InfrastructureMaintenanceandManagementplans 78TheacceleratedSchoolInfrastructureDeliveryInitiative 79 aLongHistoryofShiftingGoalpostsandconfusion 79conclusionandrecommendations 81
Above: An example of mud-and-zinc classrooms at Manganise Junior Secondary School in Umtata, Eastern Cape 2005 (Source: D. Dalton: The Classroom Crisis)
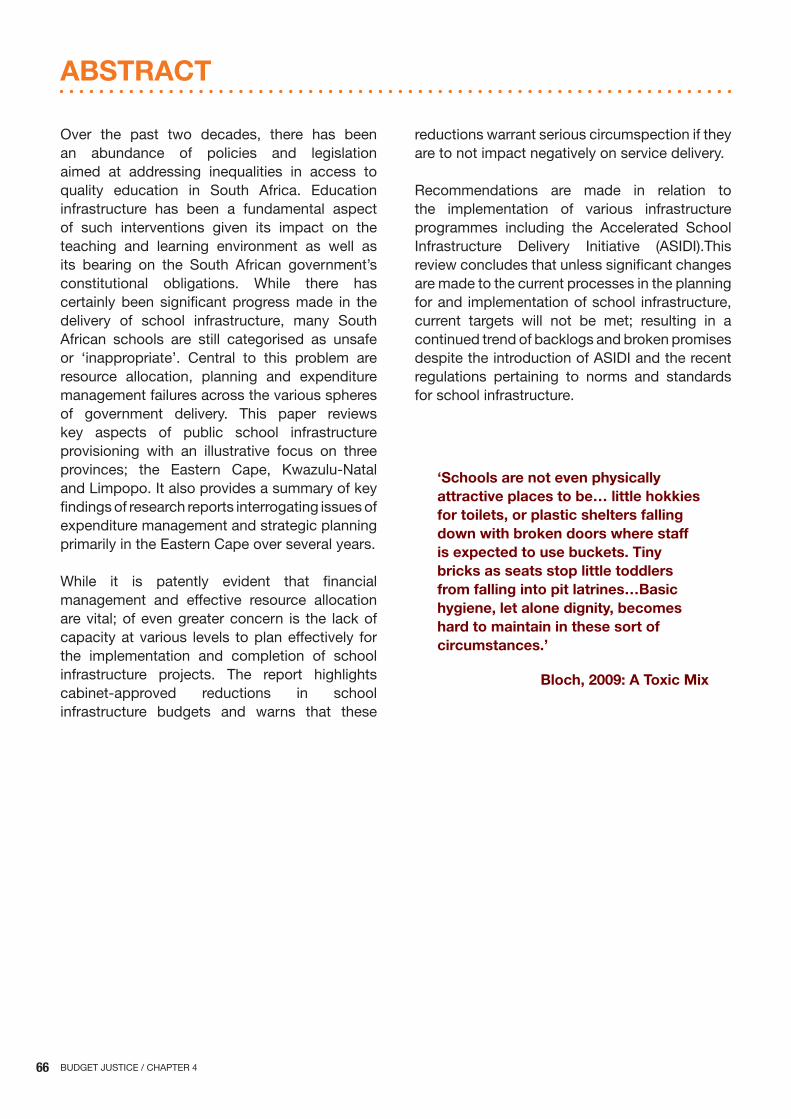
66 BUDGET JUSTICE / CHAPTER 4
Over the past two decades, there has been an abundance of policies and legislation aimed at addressing inequalities in access to quality education in South Africa. Education infrastructure has been a fundamental aspect of such interventions given its impact on the teaching and learning environment as well as its bearing on the South African government’s constitutional obligations. While there has certainly been significant progress made in the delivery of school infrastructure, many South African schools are still categorised as unsafe or ‘inappropriate’. Central to this problem are resource allocation, planning and expenditure management failures across the various spheres of government delivery. This paper reviews key aspects of public school infrastructure provisioning with an illustrative focus on three provinces; the Eastern Cape, Kwazulu-Natal and Limpopo. It also provides a summary of key findings of research reports interrogating issues of expenditure management and strategic planning primarily in the Eastern Cape over several years.
While it is patently evident that financial management and effective resource allocation are vital; of even greater concern is the lack of capacity at various levels to plan effectively for the implementation and completion of school infrastructure projects. The report highlights cabinet-approved reductions in school infrastructure budgets and warns that these
reductions warrant serious circumspection if they are to not impact negatively on service delivery.
Recommendations are made in relation to the implementation of various infrastructure programmes including the Accelerated School Infrastructure Delivery Initiative (ASIDI).This review concludes that unless significant changes are made to the current processes in the planning for and implementation of school infrastructure, current targets will not be met; resulting in a continued trend of backlogs and broken promises despite the introduction of ASIDI and the recent regulations pertaining to norms and standards for school infrastructure.
‘Schools are not even physically attractive places to be… little hokkies for toilets, or plastic shelters falling down with broken doors where staff is expected to use buckets. Tiny bricks as seats stop little toddlers from falling into pit latrines…Basic hygiene, let alone dignity, becomes hard to maintain in these sort of circumstances.’
Bloch, 2009: A Toxic Mix
ABSTrACT
67BUDGET JUSTICE / CHAPTER 4
In eleven years’ time; is the South African government envisages that all South African schools will meet international best practice in terms of the standard of provisioning for teaching and learning (National Planning Commission, 2012). This includes infrastructure provisioning.1 In three years’ time (2016/17), all schools should have water, electricity and sanitation. In three years’ time there should be no mud structure of any sort in any South African school. In seven years’ time all school structures should be in compliance with the norms and standards for school infrastructure. In 10 years’ time; the provisioning of school libraries and science laboratories should be a lived reality for all South African learners within the system.
The eradication of mud schools in South Africa is long overdue. In 2004, former president Thabo Mbeki announced that
“…by the end of this year (2004/05) we shall ensure that there is no pupil learning under a tree, mud school or any dangerous conditions that expose pupils and teachers to the elements”.2
Following failure by the DBE to meet the 2004/05 eradication target, the PSAM released a press statement surmising that the targets were “unlikely” to be met by 2009 (the 2004/05 deadline had been subsequently shifted to 2009) (Fumba, 2007). Two decades into the democratic dispensation and ten years after Mbeki’s promise mud schools are still a reality in South Africa. Not surprisingly, the highest numbers of mud structures exist in the rural districts of the Eastern Cape, with the large majority of these being in Libode (16% in 2013). The districts of
1 DepartmentofBasiceducationactionplanto2014:Towardstherealisationof §Schooling2025.
Goal24oftheactionplanreadasfollows:“ensurethatthephysicalinfrastruc-tureandenvironmentofeveryschoolinspirelearnerstowanttocometoschoolandlearn,andteacherstoteach”
2 address of the president of South africa, Thabo Mbeki, to thefirst joint sitting of the third democratic parliament, cape Town21st May 2004. available Online: http://www.info.gov.za/speech-es/2004/04052111151001.htm
Butterworth and Libode together are where 30% of all schools made entirely of mud are located in the province; both of which are rural districts.
This report will take specific cognisance of priority areas outlined by the South African government over the past decade in the education sector. In addition to analysing public budgets for education in the 2014/15 fiscus, this report will provide a reflection on trends thus far in order to potentially inform advocacy by highlighting areas of deficiencies in the upcoming MTEF. Scrutinising the composition of government budgets is an important tool that can be used to translate policy into desired outcomes3 and, according to Wildeman and Hemmer-Vitti “…to assess the whether the spending framework is credible to enable genuine service delivery” (Wildeman and Hemmer-Vitti, 2010).
Infrastructure has been, and continues to be at the core of education development and discourse in South Africa. Improving the quality of basic education in South Africa is a priority espoused within the National Planning Commission’s National Development Plan (NDP 2030). In relation to infrastructure; the NDP specifically articulates the goal of ensuring that all schools meet the minimum standards by 2016. Over the past decade, a myriad of policy, planning and legislative documents (in addition to the South African Schools Act) have illustrated the prioritisation of education in national development. These include the National Education Management Systems (NEIMS), White Paper 5, 2001 and White Paper 6 and the National Policy on an Equitable Provision of an Enabling School Physical Teaching and Learning Environment, surveys such as the School Register of Needs, Action Plan 2014/Schooling 2025 and the Education Sector Plan 2009-2014. Aligned with the prioritisation of education is the provision of adequate infrastructure in all public schools.
3 The International Budget partnership (IBp):OpenBudgets.TransformLives.2012.Budgetanalysis.availableOnline:http://internationalbudget.org/budget-analysis/
KEy nATIonAl prIorITIES AnD TrEnDS In ED-uCATIon InFrASTruCTurE

68 BUDGET JUSTICE / CHAPTER 4
priorities, Budgets and rights
Core to the state’s constitutional obligation is the need to provide schools that are conducive to teaching and learning and that are safe and well-maintained.4 In addition to the operational problems in the provisioning of water, sanitation and other infrastructure services, there are budget and planning challenges that, unless expressly addressed, are likely to further hinder infrastructure progress in education. Further to this; health risks related to exposure to the elements, unhygienic conditions and generally inadequate infrastructure provisioning all have an adverse impact on learners’ performance. Such environments contribute to learner absenteeism and dropout rates.5 It is for these reasons that progressive infrastructure provisioning is fundamental to the right to a basic education as articulated in Section 29 of the South African Constitution.6 The ECDoE’s vision, for instance, is to offer a quality education and training system that transforms schools into centres of community life and promote shared moral values, good governance and sustainable development.7
There is an abundance of media coverage and civil society action highlighting the dire state of South African basic education. In recent years; the focus on school infrastructure provisioning has illustrated the severe backlogs in rural areas and township schools in particular, exposing the inherent inequalities in access to quality basic education in South Africa. The School Register of Needs (SRN) survey was launched as early as 1996 by the Department of Basic Education
4 SouthafricanHumanrightscommission.2012.charter ofchildren’sBasiceducationrights
The South african Human rights commission charter of children’s Basiceducationrightspublished in2012outlines thestate’sobligation toensurethateducationisavailable,accessible,acceptableandadaptable.Thisis‘4a’framework and related indicators include several infrastructure-specific re-quirements.Theseincludethefollowing:
ensureallschoolshaveessentialandbasicservicesincludingsafestructures,fencing,ventilation,lighting,safepotablewater,adequateandhygienicsanita-tion,electricityandinformationtechnologysoastocreateasafeandenablinglearningandteachingenvironment
ensurethatallschoolsandschoolinfrastructurecomplywithUniversalDesign(UD)standardsforchildrenwithdisabilitiestoensureequalaccessto,andtheenjoymentof,allschoolsfacilitiesandbuildings.
TheSouthafricanHumanrightscommission.2012.charterofchildren’sBa-siceducationrights:TherightofchildrentoBasiceducation.p.20.
5 SouthafricanGovernmentNotice1438of2008.6 constitutionoftherepublicofSouthafrica,1996.7 easterncapeprovincialTreasury,BudgetStatementII2009/10,p.189.
(DBE) as a means of creating a baseline of school infrastructure needs across the country (DBE, 2011). While significant strides have been made in mapping school infrastructure needs, it is widely accepted that the speed and rigour with which this been done has been critically inadequate. This sentiment is replicated in popular commentary on the general state of education in South Africa;
“…there is no shortage of evidence showing how badly the South African Education system is performing”.8
In the Eastern Cape, the provincial department of Education (ECDoE) highlighted the connection between quality education and integrated planning for infrastructure; “ (A) consequence of poor infrastructure is an environment that does not promote effective teaching and learning”.9
The 2010/11 ECDoE Infrastructure Plan outlined the national obligation (White Paper 5) to have facilities for Grade R attached to all primary schools by 2014. While this priority was identified as early as then; budget allocations for Early Childhood Development (ECD/Grade R) have not reflected this priority area sufficiently. Instead, this has only recently (2012) become a concerted government focus, as evidenced by improvements in budget allocations to comply with policy prioritisation.
On both the national and provincial scale, spending on education remains the single largest government budget allocation; commensurate with the cabinet-led delivery agreements. Education is ranked as a top priority; Outcome 1 being “Improved quality of basic education”.10 In light of the current commemoration of 20 years of democracy– it is pertinent to interrogate key budget and service delivery trends in education. What, in particular, are the budgetary and
8 Bloch,G.2009.TheToxicMix;whatiswrongwithSouthafrica’sSchoolsand
Howtofixit.Tafelberg,capeTown.9 eastern cape Department of education. Infrastructure plan 2005-2014.
201/11Version-Draft 1.0. prepared by chief Directorate: Infrastructure andfacilitiesManagement:e.D.fray.
10 TheDeliveryagreement is related toGovernment’sactionplan to2014; adocumentdetailingthe12outcomesforworktobedonebytheSouthafricanGovernmentinconsultationwithvariousstakeholders”Thedeliveryagreementisintendedtobe“animportantinputintothebudgetingprocessfor2011/12”andreviewedonanannualbasis.DepartmentofBasiceducation,republicofSouthafrica.Deliveryagreement forOutcome1: ImprovedQuality ofBasiceducation(undated).

69BUDGET JUSTICE / CHAPTER 4
planning trends for infrastructure in the Eastern Cape, Kwazulu-Natal and Limpopo in addition to national trends? Do allocation and expenditure
patterns reflect government priorities? What are the current trends in infrastructure delivery and will all these be met over the 2014 MTEF?
nATIonAl ExpEnDITurE TrEnDS
That there are many competing demands that place pressure on the education budget is indubitable. Over several years, the payment of personnel has placed a significant strain on the budget across PEDs; often resulting in over spending (Kota, 2013b). Infrastructure, maintenance and learner teacher support materials are also additional competing factors. Infrastructure– as with compensation of employees– is a significant policy and budget priority. The education infrastructure grant is intended to be supplementary to provincial infrastructure programmes. The grant also has the purpose of enhancing the speed with which infrastructure delivery happens. It is inclusive of maintenance, rehabilitation and upgrading of new and existing infrastructure. This is especially critical in the Eastern Cape and provinces with maintenance backlogs as well as where a high number of new schools are to be built.
However– despite its importance, there is no indication in the national estimates as to the allocations specifically dedicated to ‘Maintenance and Repairs’ as this is supposedly categorised in the larger education infrastructure conditional grant. This is unfortunately not provided to any substantial detail either in the Estimates of National Expenditure on Vote 15 (Education) nor within the budget spreadsheet made available online via National Treasury. Between 2012/13 and 2013/14, the decrease in the overall national budget for infrastructure in real terms equated to 1.71% (Kota, 2013a). This may be attributable to previous under expenditure on infrastructure projects resulting in the ‘reprioritisation’ of funds. There is no detailed explanation made available in budget documents available from National Treasury nor from DBE planning documents
available in the public domain. Of even greater concern, however, is the decrease in the average provincial infrastructure budgets over the MTEF of 18.67% (Table 1) despite a lack of clarity regarding overall performance towards the end of the a MTEF.
Positive growth was experienced over the 2010 MTEF (2010/11-2012/13) in relation to new school infrastructure (Wildeman and Hemmer-Vitti, 2010). On the contrary for the 2014 MTEF, the DBE intends to decrease expenditure on new infrastructure (Table 3). This report argues that more evidence is required to show that service delivery will not be adversely affected by these reductions. On a national level, previous poor performance in addressing school infrastructure was highlighted in the 2014/15 Estimates of National Expenditure. This resulted, for example, in “significant underspending in education” in 2012/13.11 This kind of poor performance regarding infrastructure expenditure is mirrored at the provincial level– as will be discussed in the province-specific sections of this report. Regarding national trends; the 2013/14 budget estimates illustrated that infrastructure was a priority spending area over the 2013/14 to 2015/16 MTEF.12 This was outlined in the form of transfers to provincial infrastructure grants with a DBE commitment to increase spending on infrastructure.
11 National Treasury, republic of Southafrica. Budget review 2014. february2014. available Online: http://www.treasury.gov.za/documents/national%20budget/2014/review/fullreview.pdf
12 National Treasury estimates of National expenditure Vote 15: Basic educa-tion.p.5.availableOnline:http://www.treasury.gov.za/documents/national%20budget/2013/enebooklets/Vote%2015%20Basic%20education.pdf
70 BUDGET JUSTICE / CHAPTER 4
In the 2014/15 financial year, however, further decreases to the infrastructure budget are evident. Within the Schools Infrastructure Backlogs Grant, the allocation for 2014 has been decreased from R3.17 billion to R 2.91 billion; equating to a decrease of approximately R258.2 million (Tables 2 and 3). In total, over the MTEF R1.2 billion is set to be reduced from this grant. From the Education Infrastructure Grant, R1.4 billion is to be shifted away in 2014/15; a reduction of R 231.8 million is evident between 2013 and 2014. While this is said to be a cabinet-approved reduction, this is not a satisfactory explanation for reductions in these programme areas particularly when maintenance needs are taken into account. There is no clear justification for these budget shifts. This appears to be at odds with the DBE’s obligations in relation to progressive infrastructure delivery and the state’s commitment to eradicating sources of inequality in access to quality basic education. As will be articulated below, the potential argument that the decreases are a logical response to expected infrastructure project completion is not sufficiently supported by the DBEs own reports. The overall real average increase of 3.78% for PED’s infrastructure allocations raises several questions (Table 1). Clear explanations must accompany the national expenditure statements that will allow the following questions to be answered;
1 What trade-offs have been made in terms of long term infrastructure delivery backlogs and maintenance?
2 What has informed the ‘reprioritisation’ of the Schools Infrastructure Backlog and Education Infrastructure Grant in this way?
What is of particular concern in relation to the reductions is the omission of a situational analysis detailing the implications on the eradication of backlogs. The 2004-2014 Infrastructure Plan of the ECDoE highlighted the alarming costs of eradicating backlogs13 at 2009 building prices. The Infrastructure Unit estimated that it would cost approximately R23.39 billion to eradicate all school infrastructure backlogs in the Eastern Cape alone and R1.55 billion to replace all mud structures. Thus, given failures to date to meet targets (Figure 1) while accounting for inflationary increases, the cost of these backlogs is likely
13 Thiswasinclusiveofthefollowingcategoriesofbacklogs:computercentres,water,sanitation,
to have negative implications for meeting the current targets in the given period within available resources. In consideration of the United Nations’ International Covenant on Economic, Social and Cultural Rights (ICESCR), the extent to which the South African government is utilising maximum available resources to progressively address equal access to quality basic education is highly questionable.14 Although the South African government has only signed–not ratified the Covenant– the majority of the rights outlined in the ICESCR have already been committed to through the Constitution and other international agreements.15 This report outlines how the South African government is failing to comply with the obligation to spend effectively by, amongst other things, failing to effectively use maximum available resources (Blyberg and Hofbauar, 2014).
Table 1 outlines the expenditure and estimates for infrastructure development across all South African provinces.16 It is evident that allocations for school infrastructure will decrease across all PEDs over the MTEF with the sole exception of Gauteng. In some cases the expected budget decreases are drastic; examples being the Eastern Cape (26.10%) and Western Cape (26.27%) provinces. The Eastern Cape and Limpopo are particularly noteworthy given the status of school infrastructure backlogs in both provinces. The changes in the various PED’s budgets between 2014/15 and 2016/17 do not reflect government priorities in terms of concerted efforts to eradicate backlogs in the worst affected areas. The highest expected increases in PED’s infrastructure budgets between 2013 and 2014
14 article2ofTheInternationalcovenantforeconomic,Socialandculturalrights
(IceScr)of1976statesthat
“(e)achStatepartytothepresentcovenantundertakestotakesteps,individu-allyandthroughinternationalassistanceandco-operation,especiallyeconomicandtechnical,tothemaximumofitsavailableresources,withaviewtoachiev-ingprogressivelythefullrealizationoftherightsrecognizedinthepresentcov-enantbyallappropriatemeans,includingparticularlytheadoptionoflegislativemeasures”
forpurposesof this report; the recognized right is that of access toqualitybasiceducation.
15 Seminar proceedings: 28thMarch2014.comparing the Internationalcov-enantoneconomic,SocialandculturalrightstoSouthafrica’sconstitutionalandInternationalObligationsonSocio-economicrights.“Southafricahasal-readycommittedtotherightsintheIceScr-Nowit’sTimetoratifythecov-enant.availableOnline:file:///c:/Users/s08wa008/Downloads/comparing%20the%20IceScr%20-%20the%20South%20african%20constitution.pdf
16 Thisfigureshavebeenadjustedusingthe2014cpIindex(technicalbaselineyear=2008)sourcedfromNationalTreasury.ThefiguresovertheMTef,how-ever,remainnominal.
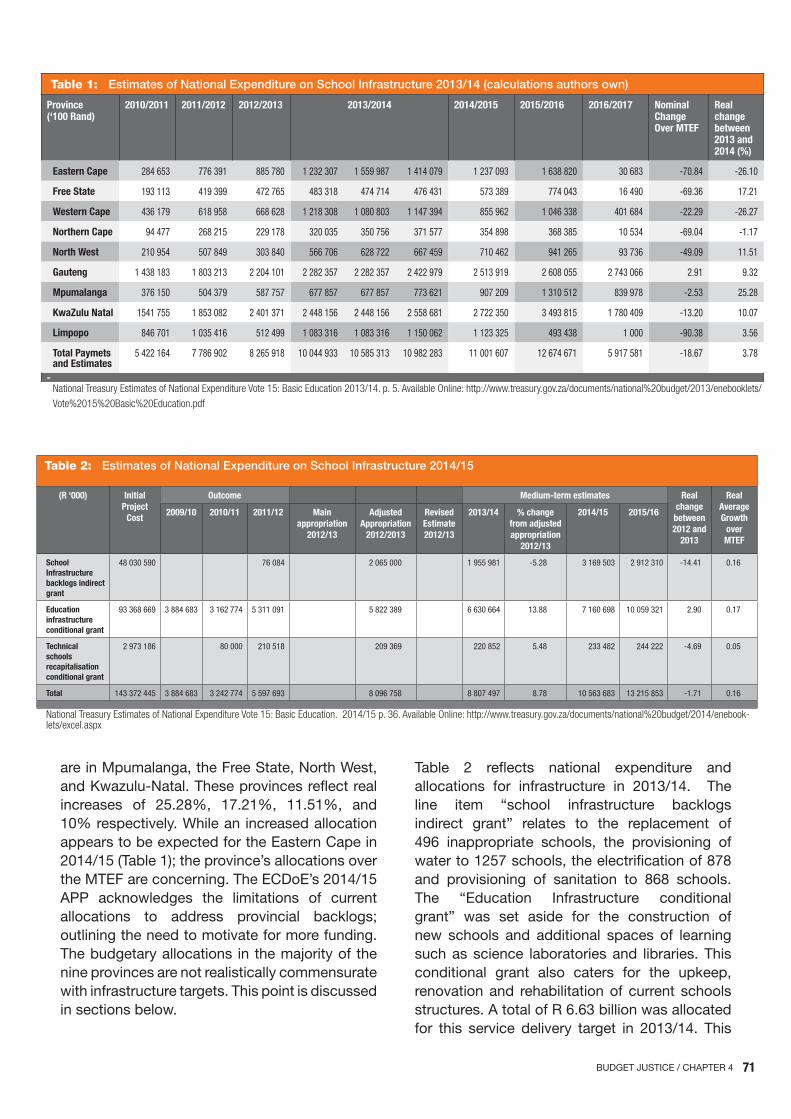
71BUDGET JUSTICE / CHAPTER 4
are in Mpumalanga, the Free State, North West, and Kwazulu-Natal. These provinces reflect real increases of 25.28%, 17.21%, 11.51%, and 10% respectively. While an increased allocation appears to be expected for the Eastern Cape in 2014/15 (Table 1); the province’s allocations over the MTEF are concerning. The ECDoE’s 2014/15 APP acknowledges the limitations of current allocations to address provincial backlogs; outlining the need to motivate for more funding. The budgetary allocations in the majority of the nine provinces are not realistically commensurate with infrastructure targets. This point is discussed in sections below.
Table 2 reflects national expenditure and allocations for infrastructure in 2013/14. The line item “school infrastructure backlogs indirect grant” relates to the replacement of 496 inappropriate schools, the provisioning of water to 1257 schools, the electrification of 878 and provisioning of sanitation to 868 schools. The “Education Infrastructure conditional grant” was set aside for the construction of new schools and additional spaces of learning such as science laboratories and libraries. This conditional grant also caters for the upkeep, renovation and rehabilitation of current schools structures. A total of R 6.63 billion was allocated for this service delivery target in 2013/14. This
Table 1: Estimates of National Expenditure on School Infrastructure 2013/14 (calculations authors own)
Province (‘100 Rand)
2010/2011 2011/2012 2012/2013 2013/2014 2014/2015 2015/2016 2016/2017 Nominal Change Over MTEF
Real change between 2013 and 2014 (%)
Eastern Cape 284 653 776 391 885 780 1 232 307 1 559 987 1 414 079 1 237 093 1 638 820 30 683 -70.84 -26.10
Free State 193 113 419 399 472 765 483 318 474 714 476 431 573 389 774 043 16 490 -69.36 17.21
Western Cape 436 179 618 958 668 628 1 218 308 1 080 803 1 147 394 855 962 1 046 338 401 684 -22.29 -26.27
Northern Cape 94 477 268 215 229 178 320 035 350 756 371 577 354 898 368 385 10 534 -69.04 -1.17
North West 210 954 507 849 303 840 566 706 628 722 667 459 710 462 941 265 93 736 -49.09 11.51
Gauteng 1 438 183 1 803 213 2 204 101 2 282 357 2 282 357 2 422 979 2 513 919 2 608 055 2 743 066 2.91 9.32
Mpumalanga 376 150 504 379 587 757 677 857 677 857 773 621 907 209 1 310 512 839 978 -2.53 25.28
KwaZulu Natal 1541 755 1 853 082 2 401 371 2 448 156 2 448 156 2 558 681 2 722 350 3 493 815 1 780 409 -13.20 10.07
Limpopo 846 701 1 035 416 512 499 1 083 316 1 083 316 1 150 062 1 123 325 493 438 1 000 -90.38 3.56
Total Paymets and Estimates
5 422 164 7 786 902 8 265 918 10 044 933 10 585 313 10 982 283 11 001 607 12 674 671 5 917 581 -18.67 3.78
- NationalTreasuryestimatesofNationalexpenditureVote15:Basiceducation2013/14.p.5.availableOnline:http://www.treasury.gov.za/documents/national%20budget/2013/enebooklets/
Vote%2015%20Basic%20education.pdf
Table 2: Estimates of National Expenditure on School Infrastructure 2014/15
(R ‘000) Initial Project
Cost
Outcome Medium-term estimates Real change
between 2012 and
2013
Real Average Growth
over MTEF
2009/10 2010/11 2011/12 Main appropriation
2012/13
Adjusted Appropriation
2012/2013
Revised Estimate 2012/13
2013/14 % change from adjusted appropriation
2012/13
2014/15 2015/16
School Infrastructure backlogs indirect grant
48 030 590 76 084 2 065 000 1 955 981 -5.28 3 169 503 2 912 310 -14.41 0.16
Education infrastructure conditional grant
93 368 669 3 884 683 3 162 774 5 311 091 5 822 389 6 630 664 13.88 7 160 698 10 059 321 2.90 0.17
Technical schools recapitalisation conditional grant
2 973 186 80 000 210 518 209 369 220 852 5.48 233 482 244 222 -4.69 0.05
Total 143 372 445 3 884 683 3 242 774 5 597 693 8 096 758 8 807 497 8.78 10 563 683 13 215 853 -1.71 0.16
NationalTreasuryestimatesofNationalexpenditureVote15:Basiceducation.2014/15p.36.availableOnline:http://www.treasury.gov.za/documents/national%20budget/2014/enebook-lets/excel.aspx

72 BUDGET JUSTICE / CHAPTER 4
accounted for 75% of the national infrastructure budget of R 8.81 billion. The budget for addressing backlogs accounted for 22% of the total infrastructure budget while the technical schools recapitalisation grant accounted for the remaining 3%.
The 2014/15 Estimates of National Expenditure (ENE) outlines budget allocations to replace inappropriate infrastructure in 510 schools, provide water to 1120 schools, electricity to 916 schools and provide sanitation in 741 schools. These figures, released by Treasury on 26th February 2014 are corroborated by those outlined in the report by the DBE to the Standing Committee on Appropriations (SCOA) on 18th February 2014 with the exception of the intention to replace inappropriate structures (510 in the ENE versus 522 in the SCOA report). Assuming that the DBE did not build 12 schools in a matter of days within the month of February in 2014, one can posit that there is a discrepancy in the reported targets.
While such discrepancies may seem inconsequential, read in conjunction with several other conflicting figures relating to targets and backlog baselines in national and provincial planning and budget documents over the years this is cause for some concern. Greater rigour in ensuring that at the most basic levels plans
utilise the same targets and baselines to allow for thorough monitoring and evaluation is crucial. In a similar vein, it is also vital that the terminology used is uniform across all departmental spheres; from the DBE to all 9 PED’s. Examples of this relate to the use of the terms “mud structures”. Inappropriate structures”, “mud classrooms”, “mud schools”, “unsafe structures” at times synonymously and at other times to signify distinctly different types of structures with different baselines and budgetary implications. For example, reporting against a backlog of 140 schools for a province in one document versus several hundreds of classrooms in another within the same planning period can create– and has created– some confusion within the public domain in relation to definitively answering the core question: what has been achieved in eradicating inappropriate school infrastructure in South Africa? This is particularly true at the provincial level.
Additionally, the renaming of programmes and shifting of responsibilities and using different reporting templates within a given MTEF has the effect of creating some confusion and hinders effective monitoring and evaluation. One such instance is the differences in MTEF reporting by the DBE for school infrastructure (compare Tables 2 and 3). These confusions are also evident at the highest operational and oversight
Table 3 : Estimates of National Expenditure on School Infrastructure 2014/15
Project name Service delivery outputs Current project stage
Total project cost
Audited outcome Adjusted appropriation
Medium-term expenditure estimate
R thousand 2010/11 2011/12 2012/13 2013/14 2014/15 2015/16 2016/17
Departmental infrastructure
School Infrastructure backlogs indirect grant
Replace 496 schools with inappropriate infrastructure, of which 395 are ud schools; provide water to 1 257 schools, sanitation to 868 schools and electricity to 878 schools
Various 13 911 712 76 084 859 628 1 955 981 2 911 303 2 402 587 2 578 311
Infrastructure transfers to other spheres, agencies and departments
Education infrastructure conditional grant
Build new schools and additional educational spaces like libraries, laboratories and administration blocks; provide basic services such as water, sanitation and electricity; upgrade and rehabilitate existing schools infrastructure; maintain new and existing schools
Various 132 782 358 3 162 774 5 311 091 5 802 390 6 643 267 6 928 908 9 469 408 10 037 961
Technical schools recapitalisation conditional grant
31 new workshops built, 228 existing workshops refurbished, equipment delivered and installed at 300 workshops, and 4 590 technology teachers trained
Various 1 650 248 64 467 210 518 198 689 231 532 233 482 244 222 257 166
Total 148 344 318 3 227 241 5 597 693 6 860 707 8 830 780 10 073 693 12 116 217 12 873 438
National Treasury Estimates of National Expenditure Vote 15: Basic Education. 2014/15 p. 36. Available Online: http://www.treasury.gov.za/documents/national%20budget/2014/en-ebooklets/excel.aspx

73BUDGET JUSTICE / CHAPTER 4
levels. In response to a question during a DBE parliamentary briefing on progress in ASIDI relating to actual versus planned expenditure and delivery, the DBE was not able to explicitly and accurately outline programme performance.
In the process of compiling this and similar reports, there was clear evidence of poor reporting on inappropriate infrastructure eradication. Each of the PEDs, implementing agents (for ASIDI) and the DBE provide little by way of coherent quantitative and narrative information. This is not a novel problem. At times, seemingly discordant information is provided. The 2008 figures state that there were 142 mud schools in the Eastern Cape at that time (Table 4) while ECDoE EMIS figures outlined the existence of 141 mud schools (in 2012). This implies that between 2008 and 2012, the Department only managed to eradicate one mud school or alternatively that the quantification of mud schools in 2008 was incomplete OR that the definitions of inappropriate and mud schools were at times used synonymously. It is not unreasonable to surmise that this lack of coherence in infrastructure plans and statistics even in a single programme will have negative consequences on expenditure throughout the Department. While civil society organisations and oversight entities have, over the years, sought to advocate for the availability of credible, up to date information– this continues to be a problem.
The Accelerated School Infrastructure Delivery Initiative
The Accelerated School Infrastructure Delivery Initiative (ASIDI) was introduced through a cabinet directive in 2011. The ASIDI was introduced as a measure to eradicate and replace inappropriate or unsafe school buildings. 17 Although progress has been made in ensuring that more and more schools comply with the basic standards of infrastructure; deep-rooted problems still persist. The Department of Basic Education aims, by 2016/17, to have eradicated all inappropriate schools in South Africa. 18 However, as has been 17 NationalTreasuryestimatesofNationalexpenditure2014/15Vote15:Basic
education. p. 7. available Online: http://www.treasury.gov.za/documents/na-tional%20budget/2014/enebooklets/Vote%2015%20Basic%20education.pdf
18 NationalTreasuryestimatesofNationalexpenditure2014/15Vote15:Basiceducation. p. 3. available Online: http://www.treasury.gov.za/documents/na-
discussed in preceding section and in sections to follow; not only is the DBE behind schedule; there have been significant hindrances in the worst affected provinces. In order that this very significant target is reached; several systemic planning problems must be addressed urgently within the DBE and in all nine PEDs.
A long history of Shifting Goal posts and Confusion
Education infrastructure spending and provisioning continue to be problematic in South Africa. The completion deadlines for the eradication of mud structure schools have been shifted several times over the past decade. At its inception, the Accelerated Schools Infrastructure Delivery Initiative aimed to eradicate 50 mud structures in 2011/12, 100 in 2012/13 and 346 in 2013/14.19 In response to these plans, the Public Service Accountability Monitor- a civil society organisation- projected in 2012 that “given the rate of project completion at the time, that was an unrealistic target. This prediction was unfortunately accurate. Through an assessment of the plans and related budgets of the DBE and ECDoE, the PSAM and other CSOs reported not only that the likelihood of the Department meeting its targets was low but also that there was confusion surrounding actual provisioning (Kota, 2012). This has been a recurring theme in the DBE and individual PEDs’ performance.
The ASIDI targets of 50, 100 and 346 schools to be replaced imply that there were at least 496 mud (or inappropriate) structure schools in the Eastern Cape and that between 2011/12 and 2012/13 all of the schools made entirely of mud would have been eradicated. In 2009, the Action Plan to 2014 outlined as a milestone- the intention to ensure that “every school has access to safe drinking water, hygienic and sufficient toilet facilities and water” (Figure 1).
In October 2012, the Director-General of Education, Mr. Bobby Soobrayan reported to
tional%20budget/2014/enebooklets/Vote%2015%20Basic%20education.pdf19 report on progress on accelerated Schools Infrastructure Delivery Ini-
tiative (aSIDI). 6th february 2012.available Online: http://www.pmg.org.za/report/20120214-department-basic-education-their-quarterly-reports-3rd-quarter-201112
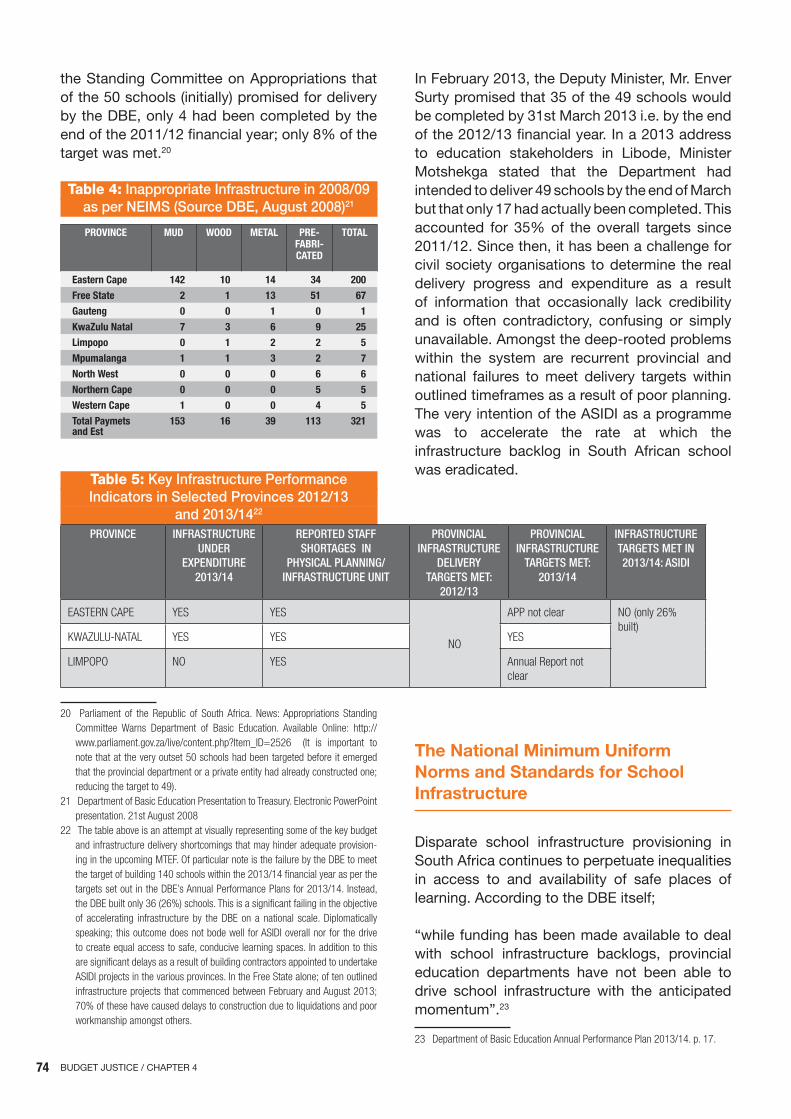
74 BUDGET JUSTICE / CHAPTER 4
the Standing Committee on Appropriations that of the 50 schools (initially) promised for delivery by the DBE, only 4 had been completed by the end of the 2011/12 financial year; only 8% of the target was met.20
Table 4: Inappropriate Infrastructure in 2008/09 as per NEIMS (Source DBE, August 2008)21
PROVINCE MuD WOOD METAL PRE-FAbRI-CATED
TOTAL
Eastern Cape 142 10 14 34 200
Free State 2 1 13 51 67
Gauteng 0 0 1 0 1
KwaZulu Natal 7 3 6 9 25
Limpopo 0 1 2 2 5
Mpumalanga 1 1 3 2 7
North West 0 0 0 6 6
Northern Cape 0 0 0 5 5
Western Cape 1 0 0 4 5
Total Paymets and Est
153 16 39 113 321
Table 5: Key Infrastructure Performance Indicators in Selected Provinces 2012/13
and 2013/1422
PROVINCE INFRASTRUCTURE UNDER
EXPENDITURE 2013/14
REPORTED STAFF SHORTAGES IN
PHYSICAL PLANNING/INFRASTRUCTURE UNIT
PROVINCIAL INFRASTRUCTURE
DELIVERY TARGETS MET:
2012/13
PROVINCIAL INFRASTRUCTURE
TARGETS MET: 2013/14
INFRASTRUCTURE TARGETS MET IN 2013/14: ASIDI
eaSTerNcape YeS YeS
NO
appnotclear NO(only26%built)
KWaZULU-NaTaL YeS YeS YeS
LIMpOpO NO YeS annualreportnotclear
20 parliament of the republic of Southafrica. News:appropriations Standingcommittee Warns Department of Basic education. available Online: http://www.parliament.gov.za/live/content.php?Item_ID=2526 (It is important tonotethatattheveryoutset50schoolshadbeentargetedbeforeitemergedthattheprovincialdepartmentoraprivateentityhadalreadyconstructedone;reducingthetargetto49).
21 DepartmentofBasiceducationpresentationtoTreasury.electronicpowerpointpresentation.21staugust2008
22 Thetableaboveisanattemptatvisuallyrepresentingsomeofthekeybudgetandinfrastructuredeliveryshortcomingsthatmayhinderadequateprovision-ingintheupcomingMTef.OfparticularnoteisthefailurebytheDBetomeetthetargetofbuilding140schoolswithinthe2013/14financialyearasperthetargetssetoutintheDBe’sannualperformanceplansfor2013/14.Instead,theDBebuiltonly36(26%)schools.Thisisasignificantfailingintheobjectiveof accelerating infrastructure by theDBe on a national scale.Diplomaticallyspeaking;thisoutcomedoesnotbodewellforaSIDIoverallnorforthedrivetocreateequalaccesstosafe,conducivelearningspaces.InadditiontothisaresignificantdelaysasaresultofbuildingcontractorsappointedtoundertakeaSIDIprojectsinthevariousprovinces.InthefreeStatealone;oftenoutlinedinfrastructureprojectsthatcommencedbetweenfebruaryandaugust2013;70%ofthesehavecauseddelaystoconstructionduetoliquidationsandpoorworkmanshipamongstothers.
In February 2013, the Deputy Minister, Mr. Enver Surty promised that 35 of the 49 schools would be completed by 31st March 2013 i.e. by the end of the 2012/13 financial year. In a 2013 address to education stakeholders in Libode, Minister Motshekga stated that the Department had intended to deliver 49 schools by the end of March but that only 17 had actually been completed. This accounted for 35% of the overall targets since 2011/12. Since then, it has been a challenge for civil society organisations to determine the real delivery progress and expenditure as a result of information that occasionally lack credibility and is often contradictory, confusing or simply unavailable. Amongst the deep-rooted problems within the system are recurrent provincial and national failures to meet delivery targets within outlined timeframes as a result of poor planning. The very intention of the ASIDI as a programme was to accelerate the rate at which the infrastructure backlog in South African school was eradicated.
The national Minimum uniform norms and Standards for School Infrastructure
Disparate school infrastructure provisioning in South Africa continues to perpetuate inequalities in access to and availability of safe places of learning. According to the DBE itself;
“while funding has been made available to deal with school infrastructure backlogs, provincial education departments have not been able to drive school infrastructure with the anticipated momentum”.23
23 DepartmentofBasiceducationannualperformanceplan2013/14.p.17.
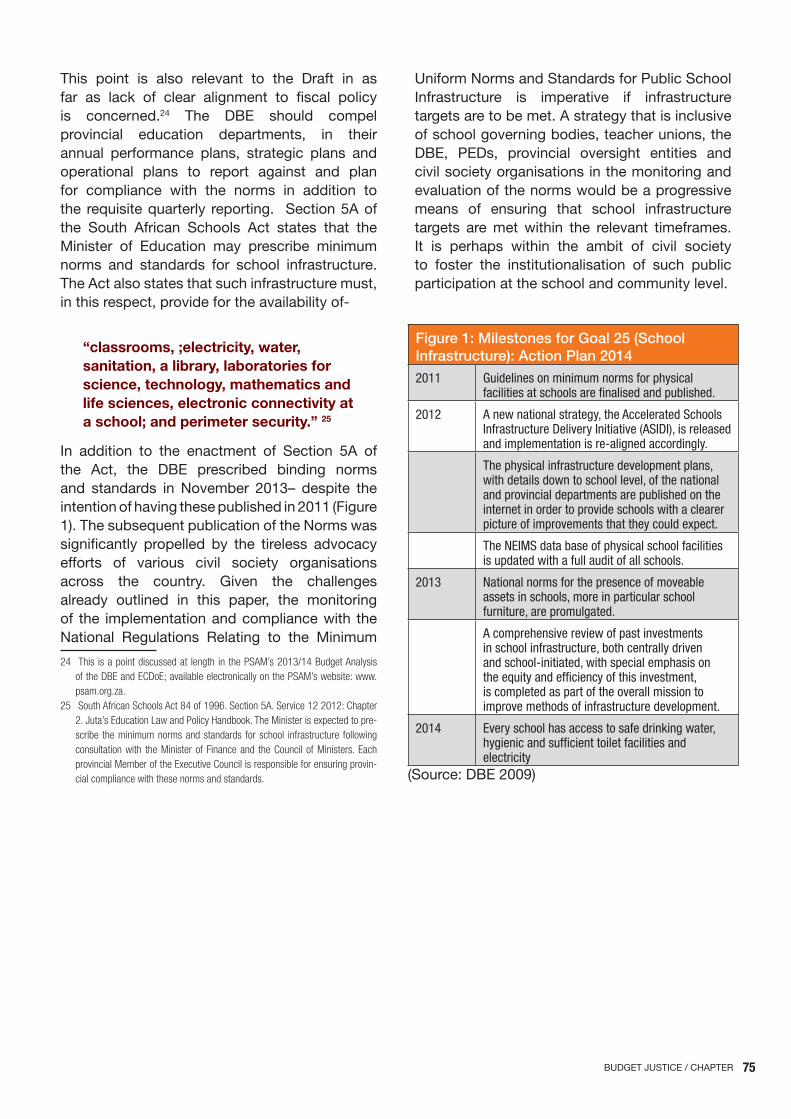
75BUDGET JUSTICE / CHAPTER
This point is also relevant to the Draft in as far as lack of clear alignment to fiscal policy is concerned.24 The DBE should compel provincial education departments, in their annual performance plans, strategic plans and operational plans to report against and plan for compliance with the norms in addition to the requisite quarterly reporting. Section 5A of the South African Schools Act states that the Minister of Education may prescribe minimum norms and standards for school infrastructure. The Act also states that such infrastructure must, in this respect, provide for the availability of-
“classrooms, ;electricity, water, sanitation, a library, laboratories for science, technology, mathematics and life sciences, electronic connectivity at a school; and perimeter security.” 25
In addition to the enactment of Section 5A of the Act, the DBE prescribed binding norms and standards in November 2013– despite the intention of having these published in 2011 (Figure 1). The subsequent publication of the Norms was significantly propelled by the tireless advocacy efforts of various civil society organisations across the country. Given the challenges already outlined in this paper, the monitoring of the implementation and compliance with the National Regulations Relating to the Minimum
24 This isapointdiscussedat length inthepSaM’s2013/14BudgetanalysisoftheDBeandecDoe;availableelectronicallyonthepSaM’swebsite:www.psam.org.za.
25 SouthafricanSchoolsact84of1996.Section5a.Service122012:chapter2.Juta’seducationLawandpolicyHandbook.TheMinisterisexpectedtopre-scribe theminimumnormsandstandards forschool infrastructure followingconsultationwith theMinisteroffinanceand thecouncilofMinisters.eachprovincialMemberoftheexecutivecouncilisresponsibleforensuringprovin-cialcompliancewiththesenormsandstandards.
Uniform Norms and Standards for Public School Infrastructure is imperative if infrastructure targets are to be met. A strategy that is inclusive of school governing bodies, teacher unions, the DBE, PEDs, provincial oversight entities and civil society organisations in the monitoring and evaluation of the norms would be a progressive means of ensuring that school infrastructure targets are met within the relevant timeframes. It is perhaps within the ambit of civil society to foster the institutionalisation of such public participation at the school and community level.
Figure 1: Milestones for Goal 25 (School Infrastructure): Action Plan 2014
2011 Guidelines on minimum norms for physical facilities at schools are finalised and published.
2012 A new national strategy, the Accelerated Schools Infrastructure Delivery Initiative (ASIDI), is released and implementation is re-aligned accordingly.
The physical infrastructure development plans, with details down to school level, of the national and provincial departments are published on the internet in order to provide schools with a clearer picture of improvements that they could expect.
The NEIMS data base of physical school facilities is updated with a full audit of all schools.
2013 National norms for the presence of moveable assets in schools, more in particular school furniture, are promulgated.
A comprehensive review of past investments in school infrastructure, both centrally driven and school-initiated, with special emphasis on the equity and efficiency of this investment, is completed as part of the overall mission to improve methods of infrastructure development.
2014 Every school has access to safe drinking water, hygienic and sufficient toilet facilities and electricity
(Source: DBE 2009)
76 BUDGET JUSTICE / CHAPTER
1 Eastern Cape: Stuck in the Mud
The MEC for Education in the Eastern Cape, Mandla Makupula highlighted several national and universal policies and frameworks guiding his Department’s work. These include the Dakar Framework, the UN Millennium Development Goals, the National Planning Commission’s National Development Plan 2030 (NDP 2030), Action Plan 2014, Schooling 2025, the Education Sector Plan 2009-2014 and the Freedom Charter.26 In particular, the MEC highlighted the vision laid out in the NDP 2030 relating to education. Of the ten aspects of the NDP 2030 vision highlighted, the provisioning of basic education infrastructure “across the board” also forms a central component of this budget analysis.
According to MEC Masualle, of the total of R1.2 billion adjustments made in 2012/13 to the provincial budget, approximately R 619.6 million accounted for allocations to education. The Department of Education also benefitted from rollovers for conditional grants. As has been the trend in previous years, budgetary allocations continue to illustrate the prioritisation of the education sector nationally. Despite these allocations, however, there are still questions to be addressed relating not only to the adequacy of the budgets but also to their management and the context within which planning happens. The provinces of Limpopo and the Eastern Cape are of particular concern (Table 1).
There are contradictory statistics relating to progress in eradicating inappropriate structures in the country. In his 2013 State of the Nation Address President Zuma stated the following: “…with regard to social infrastructure, a total of 98 schools will have been built by the end of March, of which more than 40 are in the Eastern Cape that are replacing mud schools”.27
26 2013/14BudgetandpolicySpeech,Vote6,educationeasterncapeprovince
DeliveredbytheMecforeducationandTrainingHonourableMandlaMakupulaintheprovincialLegislature20thMarch2013.
27 14thfebruary2013.StateoftheNationaddressbyHisexcellencyJacobG.
The erstwhile Eastern Cape Premier, Noxolo Kiviet then stated in the same year that there has been “…good progress in eliminating mud structures” and that “Schools constructed under the Accelerated Schools Infrastructure Development programme are nearing completion”.28 According to the Premier, work was expected to begin in the 2013/14 financial year on “a new batch of 50 schools” following the completion of the current 49 schools targeted by the ASIDI programme.29 The ECDoE MEC’s 2013 Policy Speech recorded that within the “ASIDI basic services…40 of the original planned 50 mud schools have been completed. The remaining 10 schools will be completed by (the) end of May 2013”.30
In the Eastern Cape, according to a report presented in Parliament of the ASIDI, there existed a total of 442 mud schools in 2013.31 In 2012/13, 49 of these schools were targeted for replacement with appropriate structures and in 2013/14, 50 of these were to be replaced in 2013/14, a reduction in the initial targets mentioned above and an extension of project timelines.32 The 2013/14 expenditure statement for the Department of Basic Education outlined the plan to replace 496 schools across the country; of which 395 were mud schools to be addressed within the 2012/13 MTEF..
Zuma,presidentoftherepublicofSouthafricaontheoccasionoftheJointSit-tingofparliament,capeTown.availableOnline:http://www.info.gov.za/speech/Dynamicaction?pageid=461&sid=34250&tid=98676
28 22nd february 2013. Speech of the Honourable premier Noxolo Kiviet ontheoccasionoftheStateoftheprovinceaddress,easterncapeLegislature,Bhisho,easterncapeprovince(emphasisadded).
29 22nd february 2013. Speech of the Honourable premier Noxolo Kiviet ontheoccasionoftheStateoftheprovinceaddress,easterncapeLegislature,Bhisho,easterncapeprovince.(emphasisadded).
30 2013/14BudgetandpolicySpeech,Vote6,educationeasterncapeprovinceDeliveredbytheMecforeducationandTrainingHonourableMandlaMakupulain theprovincialLegislature20thMarch2013.p.7. (emphasisadded).ThisreportisatsevereoddswiththeNationalaSIDItargetsreportedattheendofthe2013/14financialyear-morethanayearafterthepremier’sstatement.
31 Theterm’mudschool’-whilenotexplicitlydefinedbytheDBeortheecDoeinanyroutinemannerinplanningdocuments;relatestoanyschoolsthatmayhaveoneorallstructuresconstructedofmud.
32 parliamentoftherepublicofSouthafrica.researchUnit.analysisand
Summary of theacceleratedSchools InfrastructureDelivery Initiative (aSIDI)progressreport2013.
provInCIAl TrEnDS In InFrASTruCTurE plAnnInG AnD ExpEnDITurE This section briefly examines key budget trends in the Eastern Cape, Kwazulu-natal and limpopo.
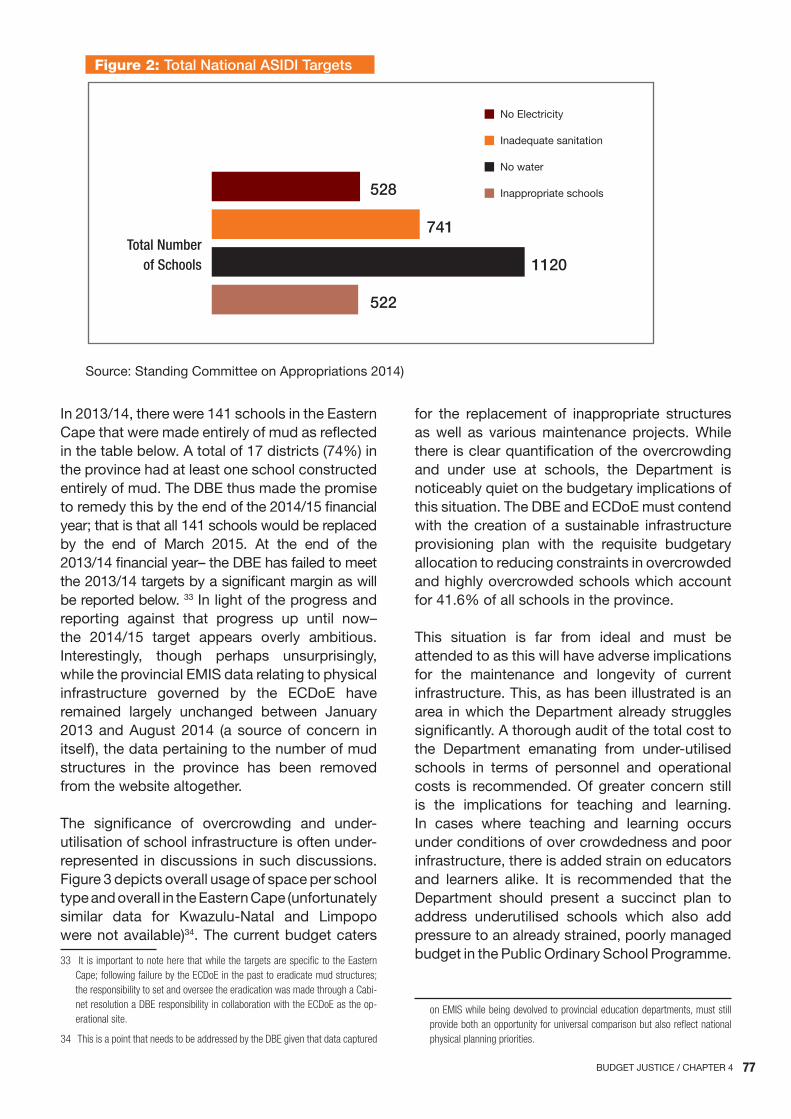
77BUDGET JUSTICE / CHAPTER 4
Figure 2: Total National ASIDI Targets
Source: Standing Committee on Appropriations 2014)
In 2013/14, there were 141 schools in the Eastern Cape that were made entirely of mud as reflected in the table below. A total of 17 districts (74%) in the province had at least one school constructed entirely of mud. The DBE thus made the promise to remedy this by the end of the 2014/15 financial year; that is that all 141 schools would be replaced by the end of March 2015. At the end of the 2013/14 financial year– the DBE has failed to meet the 2013/14 targets by a significant margin as will be reported below. 33 In light of the progress and reporting against that progress up until now– the 2014/15 target appears overly ambitious. Interestingly, though perhaps unsurprisingly, while the provincial EMIS data relating to physical infrastructure governed by the ECDoE have remained largely unchanged between January 2013 and August 2014 (a source of concern in itself), the data pertaining to the number of mud structures in the province has been removed from the website altogether.
The significance of overcrowding and under-utilisation of school infrastructure is often under-represented in discussions in such discussions. Figure 3 depicts overall usage of space per school type and overall in the Eastern Cape (unfortunately similar data for Kwazulu-Natal and Limpopo were not available)34. The current budget caters
33 Itisimportanttonoteherethatwhilethetargetsarespecifictotheeasterncape;followingfailurebytheecDoeinthepasttoeradicatemudstructures;theresponsibilitytosetandoverseetheeradicationwasmadethroughacabi-netresolutionaDBeresponsibilityincollaborationwiththeecDoeastheop-erationalsite.
34 ThisisapointthatneedstobeaddressedbytheDBegiventhatdatacaptured
for the replacement of inappropriate structures as well as various maintenance projects. While there is clear quantification of the overcrowding and under use at schools, the Department is noticeably quiet on the budgetary implications of this situation. The DBE and ECDoE must contend with the creation of a sustainable infrastructure provisioning plan with the requisite budgetary allocation to reducing constraints in overcrowded and highly overcrowded schools which account for 41.6% of all schools in the province.
This situation is far from ideal and must be attended to as this will have adverse implications for the maintenance and longevity of current infrastructure. This, as has been illustrated is an area in which the Department already struggles significantly. A thorough audit of the total cost to the Department emanating from under-utilised schools in terms of personnel and operational costs is recommended. Of greater concern still is the implications for teaching and learning. In cases where teaching and learning occurs under conditions of over crowdedness and poor infrastructure, there is added strain on educators and learners alike. It is recommended that the Department should present a succinct plan to address underutilised schools which also add pressure to an already strained, poorly managed budget in the Public Ordinary School Programme.
oneMISwhilebeingdevolvedtoprovincialeducationdepartments,muststillprovidebothanopportunityforuniversalcomparisonbutalsoreflectnationalphysicalplanningpriorities.
No Electricity
Inadequate sanitation
No water
Inappropriate schools528
741
1120
522
Total Numberof Schools

78 BUDGET JUSTICE / CHAPTER 4
Figure 3: utilisation of Space by Education phase: ECDoE 2013 and 2014
HighlyOvercrowded
Overcrowded Normal Under Used Highly Under Used
6.3%
11.1%
4.1%
21.4%
10.5%8.8%
0.9%
20.2%
16.6%
21.2%
4.7%
42.5%
2.2%1.6%
1.5%5.4% 1.9%
1.7%3.8%
10.4%
National Combined Secondary All Schools
2 Kwazulu-natal: un-SMArT targets
According to the MEC of Kwazulu-Natal, in 2013, there were a total of 2 478 school building projects of various types as well as the construction of 14 new schools and the provisioning of piped water by the KZNDoE to 50 rural schools.35 The MEC made no mention of the exact number of mud schools amongst those nor how many of the outlined schools would fall within the ambit of ASIDI. Additionally, while the KZNDoE MEC identified 7 priority areas for the KZNDoE; curriculum management, transformation of the schooling system, teacher supply and capacity, classroom resources, infrastructure, management and finances; the specific achievements towards addressing each within the reporting timeframes were unclear. While is patently clear that much has been achieved by way of computerised infrastructure planning and data capturing systems that are also made publicly available; the content still leaves much to be desired. The 2014 Infrastructure Plans lack clear timeframes of project commencement and completion; making monitoring progress difficult. The lack of detailed reporting on infrastructure targets by the KZNDoE is also evident in the Annual Performance Plan (APP) for 2013/14. While this is an example of a single PED; there is a strong need for all PEDs to ensure that plans contain sufficient quantitative and qualitative information.
35 2013/14BudgetandpolicySpeech,Kwazulu-NatalDepartmentofeducationDeliveredbytheMecforeducation,HonourableSizweMchunu(undated).
3 limpopo: Shady finances and non-existent plans
The Limpopo Department of Education (LDoE), like the ECDoE was the subject of a national administrative intervention as per Section 100 (1)(b) of the South African Constitution as a result of provincial financial maladministration amongst other things.36
A total of R 225 million of the LDoE’s budget for the Education Infrastructure Grant for 2012/13 was held back by Treasury owing to slow spending by the department of its approximately R 942 million infrastructure budget. Despite this, a further under expenditure of the allocated budget amounting to R 377 million was incurred. Reasons for this under expenditure relate to delays in the appointments of service providers, contractors and signing of service level agreements.37 Three recurring themes in the LDoE are poor financial controls across several programme areas, a
36 chapter 5, Section100 (1) (b) of theconstitution of republic Southafricaprovidesthat:
Whenaprovincecannotordoesnotfulfilanexecutiveobligationintermsoftheconstitutionorlegislation,thenationalexecutivemayintervenebytakinganyappropriatestepstoensurefulfilmentofthatobligation,including–(…)
(b)assumingresponsibilityfortherelevantobligationinthatprovincetotheextentnecessaryto-
(i)maintain essential national standards or meet established minimumstandardsfortherenderingofaservice...
(iv)preventthatprovincefromtakingunreasonableactionthatisprejudicialtotheinterestsofanotherprovinceortothecountryasawhole.
37 LimpopoDepartmentofeducationannualreport2012/13:partB:perform-anceInformation.p75.
79BUDGET JUSTICE / CHAPTER 4
lack of adequate skills and technical expertise and poor planning resulting in late delivery on infrastructure projects. An area of skills deficiency highlighted in the LDoE’s 2012/13 Annual Report is the lack of critical monitoring and evaluation. Poor planning resulted in 2013 in the delivery of only 19 of 510 classrooms (4%); 18 of 208 specialist rooms (9%) and none of 18 full service schools were built. The LDoE has admitted that at that point– there were no plans at all to supply priority schools with water and electricity owing to “budgetary constraints” and that projects completed were those deferred from preceding years.38 This is despite national targets (Figure 1). It is therefore further concerning to note a 90.38% real decrease for the LDoE’s 2014 budget in the first instance and a miniscule increase from the 2013 budget in real terms of 3.56% (Table 1). The results of these budget decisions will likely become painfully evident towards the end of the current financial year.
4 Infrastructure Staff Shortages and poor project Management
It has been shown that amongst the problems related to infrastructure planning at the provincial level is understaffing in infrastructure units. Both the ECDoE and LDoE Eastern Cape continue
38 LimpopoDepartmentofeducationannualreport2012/13:partB:perform anceInformation.p79.
to be prime examples. In November 2005, researcher Debbie Dalton wrote of the ECDoE;
“It is imperative that the Department prioritise the provision of infrastructure over the next ten years by ensuring that the Physical Resources Directorate is provided with adequate human and financial resources” (Dalton, 2005)
Almost 15 years after this recommendation was made, the realities have scarcely changed. Human and financial resource shortages continue to hinder planning in the ECDoE and place undue stress on current staff. Amongst the areas of need are technical expertise specific to infrastructure planning and implementation in the first instance and rigorous monitoring and evaluation in the second as well as improvement in national, provincial and district infrastructure planning and implementation of the user asset management systems across all districts as recommended by Treasury.39 The DBE cannot hope to eradicate infrastructure backlogs if the worst affected areas are also governed by some of the worst performing PED’s in terms of planning, financial management and technical capacity. The termination of the national intervention in Limpopo on 30 July 2014 is cause for some deep circumspection.
39 presentationonbehalfofMs.MarionMbina-MthembubyMr.JamieDeJager;easterncapeprovincialTreasuryandplanning,OfficeoftheHeadofDepart-ment: Infrastructure planning: 2015/16. 15th July 2014: Implementation ofNorms and Standards for School Infrastructure, WITS University educationcampus,parktown,Johannesburg
InFrASTruCTurE MAInTEnAnCE AnD MAnAGEMEnT plAnS Under spending on infrastructure maintenance is amongst the core elements of poor project management. In 2012/13, for example, the ECDoE under spent on the main appropriation of R 95 million for maintenance and repairs by R 23.2 million (Kota, 2012). It is a fact that hardly needs highlighting that maintenance problems that remain unattended will merely increase the pressure on the infrastructure budget in years to come as those schools gradually fall into states of greater disrepair. According to the DBE, the standard of routine maintenance to prolong the
life span of physical infrastructure at schools is “generally unacceptable” (DBE, 2011). The 2010/11 Draft Infrastructure Plans for the ECDoE acknowledged that the budget was not sufficient to allow for maintenance in alignment with industry standards; between 1.5% and 2% of the replacement value of physical assets must be set aside for infrastructure or between 2% and 4% of the asset value for preventative maintenance.40 In addition; the department highlighted the difficulty
40 eastern cape Department of education. 2010/11. Infrastructure plan (2004-2014)Draft.
80 BUDGET JUSTICE / CHAPTER 4
in channelling funds to maintenance in the face of the recurrent infrastructure backlogs. While this assertion is valid given oft inevitable budget trade-offs; there has been inadequate evidence that the ECDoE and other PED’s have sought to plan and motivate for the requisite allocations to tackle this problem. Central to this noted lack of evidence is PEDs’ failure to regularly produce costed, coherent and up-to-date infrastructure plans.
The responsibility to budget for and implement physical infrastructure maintenance at schools is designated to PEDs and their district offices. It would seem, however that for some PEDs (the Eastern Cape being one); despite the acknowledgement of inadequate budgets; there is no strong evidence to show that attempts to address this situation throughout the financial cycle.
Little is done to mitigate against increasing maintenance backlogs which will undoubtedly contribute to the current backlog of unsafe structures in the long-term. Underestimating– and under budgeting for- the need for routine maintenance can have devastating impacts in the long term.
It is especially important all PEDs to adhere to the norms relating to annual allocations to maintenance of infrastructure so as to avoid unnecessary losses due to poorly planned and haphazard maintenance procedures as has been the trend. There is a dire need for the DBE to institutionalise best practice in the upkeep of all its buildings and fixed assets and of schools in particular.
ConCluSIon AnD rECoMMEnDATIonS
The current infrastructure planning and expenditure trends do not augur well for the deadlines set for the DBE to eradicate South Africa’s school infrastructure backlog. Given the past and present trends, it is not unreasonable to feel a sense of alarm for the future of education in the country. It is not unreasonable, when contemplating the outlined infrastructure targets and objectives to get a sense that these may not be met within the timeframes. If infrastructure interventions at the highest possible level of planning are hindered and buckled in similar ways to the lower level interventions they are intended to improve upon; what is needed to accelerate the eradication of mud structure schools in the short term? Below are recommendations directed primarily at the DBE in response to the findings of this report.
recommendation 1: Support provincial infrastructure directorates in physical planning, budgeting and monitoring and evaluation.
recommendation 2: Allocate (and spend) adequate budgets for infrastructure maintenance.
The DBE must provide public explanations and justifications for the reduction in key budget areas relating to education infrastructure in 2014/15 and the upcoming MTEF given the long list of incomplete projects.
recommendation 3: Improve planning alignment between PEDs and the DBE with a specific focus on maintaining accurate asset management databases to allow rigorous monitoring and evaluation as well as allow close public scrutiny. In addition to being responsible for ensuring delivery at the local level PEDs and Districts are accountable to the communities within which they exist and must accordingly make information available.
recommendation 4: Implement (and monitor) the Norms and Standards through implementation of community participation processes as well as complying with the Regulations. As an initial step, copies of the reports produced on 29th November 2014 must be made available on the public domain.
81BUDGET JUSTICE / CHAPTER 4
Address of the President of South Africa, Thabo Mbeki,tothefirstjointsittingofthethirddemo-craticparliament,capeTown,21May2004,http://www.info.gov.za/speeches/2004/04052111151001.htm(accessed25March2014).
Bloch,G.TheToxicMix;whatiswrongwithSouthafrica’sSchoolsandHowtofixit,Tafelberg,capeTown,2009.
Blyberg.a.andHofbauer,H.,article2andGovernment’sBudgets:TheUseofMaximumavailableresources,article2project,2014.
BudgetandpolicySpeech2013/14,Vote6,educationeasterncapeprovinceDeliveredbytheMecforeducationandTrainingHonourableMandlaMakupulaintheprovincialLegislature,20March2013.
constitutionoftherepublicofSouthafrica,actNo.108of1996.Dalton,D.,classroomcrisis:TheStateofSchoolInfrastructurein
theeasterncape,publicServiceaccountabilityMonitor,2005.DeJager,J.,(presentationonbehalfofMs.MarionMbina-Mthem-
bubyeasterncapeprovincialTreasuryandplanning,OfficeoftheHeadofDepartment),Infrastructureplanning:2015/16,Im-plementationofNormsandStandardsforSchoolInfrastructure,WITSUniversityeducationcampus,parktown,Johannesburg,15July2014.
DepartmentofBasiceducation(DBe),actionplanto2014:To-wardstherealisationofSchooling2025,pretoria,2011.
DepartmentofBasiceducation(DBe),annualperformanceplan2013/14.2013.
DepartmentofBasiceducation(DBe),DiscussionDocument:roll-ingoutSchoolInfrastructureMaintenance,September2011.
DepartmentofBasiceducation(DBe),republicofSouthafrica,DeliveryagreementforOutcome1:ImprovedQualityofBasiceducation,undated.
Departmentofthepresidency,republicofSouthafrica,Nationalplanningcommission,NationalDevelopmentplan2030:Ourfuture–MakeitWork,2012.
easterncapeDepartmentofeducation(ecDoe),annualperform-anceplan2013/14,2013.
easterncapeDepartmentofeducation(ecDoe),Infrastructureplan(2004–2014)DraftVersion-Draft1.0,chiefDirectorate:InfrastructureandfacilitiesManagement,e.D.fray,2010.
easterncapeprovincialTreasury,BudgetStatementII2009/10,2009.
fumba,L.,(pressrelease):MudStructuresUnlikelytobeeradi-catedby2009,publicServiceaccountabilityMonitor,27June2007.
Kota,Z.,Budgetanalysis:easterncapeDepartmentofeducation2012/13,publicServiceaccountabilityMonitor,2012.
Kota,Z.,Budgetanalysis:easterncapeDepartmentofeducation2013/14,publicServiceaccountabilityMonitor,2013a.
Kota.Z.,expenditureTrackingreport:easterncapeDepartmentofeducation2013/14,publicServiceaccountabilityMonitor,2013b.
Kwazulu-NatalDepartmentofeducation(KZNDoe),annualperformanceplan2013/14,http://www.kzneducation.gov.za/Linkclick.aspx?fileticket=IgccdZpDxeQ%3d&tabid=104&mid=389(accessed24april2014)
LimpopoDepartmentofeducation(LDoe),annualreport2012/13:partB:performanceInformation,2012.
NationalTreasury,republicofSouthafrica,Budgetreview2014,february2014,http://www.treasury.gov.za/documents/na-tional%20budget/2014/review/fullreview.pdf(accessed28
June2014).NationalTreasury,republicofSouthafrica,NationalTreasury
estimatesofNationalexpenditureVote15:Basiceducation,2013http://www.treasury.gov.za/documents/national%20budget/2013/enebooklets/Vote%2015%20Basic%20educa-tion.pdf(accessed14September2013).
parliamentoftherepublicofSouthafrica,analysisandSummaryoftheacceleratedSchoolsInfrastructureDeliveryInitiative(aSIDI)progressreport2013,parliamentaryresearchUnit,2013.
parliamentoftherepublicofSouthafrica.News:appropriationsStandingcommitteeWarnsDepartmentofBasiceducation,October2012,http://www.parliament.gov.za/live/content.php?Item_ID=2526(accessed25March2013).
Seminarproceedings:comparingtheInternationalcovenantoneconomic,SocialandculturalrightstoSouthafrica’sconstitu-tionalandInternationalObligationsonSocio-economicrights.“SouthafricahasalreadycommittedtotherightsintheIceScr–Nowit’sTimetoratifythecovenant,28March2014.
SouthafricanGovernmentNotice1438of2008.SouthafricanHumanrightscommission(SaHrc),charterof
children’sBasiceducationrights,2012.SouthafricanSchoolsact84of1996,Section5a,Service12
2012:chapter2.Juta’seducationLawandpolicyHandbook.StateoftheNationaddressbyHisexcellencyJacobG.Zuma,
presidentoftherepublicofSouthafricaontheoccasionoftheJointSittingofparliament,capeTown,14february2013,http://www.info.gov.za/speech/Dynamicaction?pageid=461&sid=34250&tid=98676(accessed20february2013).
StateoftheprovinceaddressbyHonourablepremierNoxoloKiviet,easterncapeLegislature,Bhisho,easterncapeprov-ince,22february2013.
TheInternationalBudgetpartnership(IBp):OpenBudgets.Trans-formLives,Budgetanalysis,2012,http://internationalbudget.org/budget-analysis/(accessed25March2013).
Wildeman,r.andHemmer-Vitti,r.,Wheretoforprovincialeduca-tionBudgets:2006to2012.IDaSa:anafricanDemocracyIn-stitute,2010,http://www.ansa-africa.net/uploads/documents/publications/IDaSa-education-Where_to_for_provincial_edu-cation.pdf(accessed16July2014).
rEFErEnCES
82 BUDGET JUSTICE / CHAPTER 5
TrAnSFEr prICInG and
proFIT ShIFTInG
DICK ForSlunD Dick Forslund is senior economist at Alternative Information and Development Centre
BUDGET JUSTICE
5

83BUDGET JUSTICE / CHAPTER 5
1. Without a trace: lonmin’s Bermuda connection
The story to emerge from cross examination during the Marikana Commission hearings shows Social labour plans for lonmin’s mines are affordable if producers aren’t involved in profit shifting.
It’s time to lift the veil of secrecy from the financial statements of multinational companies’ South African subsidiaries and bring these truly unaffordable practices into the open.
‘A structure like this is normally set up to be optimal from a tax perspective,’ said director Mahomed Seedat, Lonmin’s second respondent during the Marikana Commission hearings 16 September.
Seedat was appointed as executive director (chairman and president) of Western Platinum Ltd (WPL), one of Lonmin’s key subsidiaries in South Africa, in September 2007.
Despite this, Seedat didn’t know much about WPL’s payment of sales commission to a Bermuda subsidiary, Western Metal Sales Ltd (WMS). He hadn’t been directly involved in the matter, he said. When asked during cross examination why WMS has been (supposedly) closed down, starting from 2007, he said costs could start to outweigh benefits.
‘I suspect that’s the logic that was applied at the time but I can’t give you the exact reasons,’ he said.
Seedat could only provide general information about how these things are usually done in the mining industry. It would get worse during the cross examination.
The story told by Lonmin to the Marikana Commission is that the marketing services of the Bermuda outfit were phased out from 1 April 2007, from which date only half of the sales commissions were paid to WMS in Bermuda. No commissions were paid to WMS from the start of the 2009 financial year, Lonmin says in a document titled ‘Lonmin Agreed Facts’ that was made public during the cross examination.
The sales commission was instead paid to the Lonmin Plc’s head office via its external South African company, LMS.
All Western Platinum’s audited financial statements delivered to SARS between 2007 and 2010, as well as the 2012 financial statement, report ‘Sales Commissions paid to Western Metal Sales’ as a separate item. The only statement that ‘redirects’ the flow to Bermuda of R1.228-billion during these years is the 2011 statement. It was signed on 4 October 2012.
According to Seedat, five out of six financial statements audited by KPMG contained an error. As financial statements also account for the preceding year, the 2011 statement is contradicted by the 2010 and the 2012 statements.
It would seem that in 2012 both the managers and the auditor forgot what was supposed to have been a change in 2011 – or was there ever a change?
1 WIThouT A TrACE: lonMIn’S BErMuDA ConnECTIon
The following two articles were published in other versions on www.dailymaverick.co.za in October 2014. The report ‘The Bermuda Connection: Profit Shifting and Unaffordability at Lonmin 1999-2012’ is
available at the website www.aidc.org.za
84 BUDGET JUSTICE / CHAPTER 5
Then there is an extra twist. The alleged change in 2007 actually happened in 2012, but retroactively, as it were.
After Seedat suggested there was an ‘error’ in almost all financial statements, Lonmin’s lawyer Schalk Burger intervened by pointing to the Lonmin Agreed Facts document. In this version, Western Platinum’s financial statements were indeed correct (well, save for the 2012 statement that is entirely inexplicable). The ‘dormant’ company on Bermuda hadn’t been dormant at all when those payments were made.
No, Western Metal Sales was declared dormant in 2012. In June and July 2012, an agreement was signed that redirected the Bermuda flows to Lonmin’s South African company, LMS.
At this point, we must assume the marketing team on Bermuda had to pay back over R1 billion to LMS and dissolve,. ‘From now on’, the marketing and sales of Lonmin’s PGMs would be done by LMS. And this ‘from now on’ was to be implemented much earlier in Lonmin’s business history, financially speaking and for some reason.
Evidence leader Matthew Chaskalson impolitely suggested that the reason for this late decision, reflected only in the 2011 statement (again, the 2012 statement doesn’t acknowledge any change), was that Lonmin was then exploring the possibility of a bond issue in US. The exploration compelled the company to show investors more than required in its public financial statements.
No, Burger replied. He was told by Lonmin’s finance department that Incwala Resources, Western Platinum’s BEE partner had objected to the change during all these years. Incwala’s resistance was finally broken in June 2012.
Now Seedat agreed this might well be true, because a structural change of such a magnitude would have to be approved by the BEE partner that holds 18% of the voting shares in Western Platinum.
If this is so, one might wonder why the change itself doesn’t merit any comment in the 2011 statement, audited by KPMG like all the other statements, and allegedly the only statement in six years that got it right.
Aside from this mess, was any marketing of Lonmin platinum ever carried out from an office on Bermuda?
In three separate written responses to Mail & Guardian investigative reporting unit AmaBhunghane, Lonmin said that all sales have been carried out from Western Platinum Ltd in South Africa. This contradicted later assertions that the head office company, Lonmin Management Services (LMS) was doing the sales from 2008, and been rightfully paid commissions for this.
It is notoriously difficult to find any trace of Western Metal Sales on the web. The Bermuda address, Canon’s Court on 22 Victoria Street, is the same as the address of Appleby Services, a big law firm specialising in offshore business with branches in tax havens all over the world.
On 1 October 2003, the above address was lodged at the Company Registry of Bermuda as the ‘registered office’ of Western Metal Sales. A 25 March 1999 verdict (T-102/96) in the European Commission refers to ‘the fact that LPD’s [short for Lonmin’s Western Platinum and Eastern Platinum Ltd in SA] worldwide sales are carried out through Western Metal Sales, a Belgian subsidiary of Lonrho [Lonmin’s name at this time] based in Brussels’.
All this matters. Western Platinum has committed to a Social Labour Plan for the surrounding mining community but the parent company Lonmin Plc has not done so. Excessive invoicing of a South African subsidiary, legal or not, reduces this subsidiary’s ability to pay for this, and for wages.
Impala Platinum chose to engage with AIDC’s questions in June on what appeared to be excessive sales rebates. At a meeting, they also said their platinum group metals are sold by an insourced team of four to five people. The cost for this is barely R200 million to R300 million per year, the size of the sales commissions paid to the Bermuda outfit.
Western Platinum also pays annual management fees of almost the same size to LMS, the branch of Lonmin Plc in South Africa. Lonmin Plc’s 2013 annual report adds to the question of fees and
85BUDGET JUSTICE / CHAPTER 5
commissions charged internally by Lonmin and what is supposedly affordable.
In the section ‘A Deeper Look’ 2009-2013, an item, ‘Management and Marketing Service’ appears. The group accounts should reflect what is paid to service providers outside the Lonmin Group. Internally we take for granted that Bermudian Western Metals is a part of the group accounts.
Western Platinum Ltd paid R1.742 billion for the two services, marketing and management during the years 2009-2012, to Bermuda and to LMS. In addition, the public 2013 ‘Deeper Look’ reveals that the Lonmin Group paid R1.029 billion to external providers of the same two services.
Both August 2012 and the platinum strike 2014 showed that transfer pricing and the depletion of the funds of South African subsidiaries are unaffordable. Decent wages for workers and the fulfilment of SLP plans are affordable if the producing companies, the subsidiaries that pay wages and taxes, are not involved in chains of profit shifting.
We have to lift the veil of secrecy from the financial statements of multinational companies’ subsidiaries in South Africa. So called ‘independent auditing’ is not doing its job.
Bring these practices out into the open. They are unaffordable — for the mine workers, the mining communities and South Africa at large.
2. TrAnSFEr prICInG IS ABouT proFIT ShIFTInG
lonmin, in one of its responses to the Alternative Information and Development Centre’s (AIDC) report, The Bermuda Connection: Profits shifting and unaffordability at Lonmin 1999-2012, says the idea that it hid profits from shareholders while asking them for a total of r17-billion [2009-2013] is ‘not credible’.
AIDC didn’t accuse the mining company of hiding profits, but of shifting them.
Some of Lonmin’s statements in September have been confusing and contradictory. To say so is not ‘defamation’. Mail & Guardian’s centre for investigative journalism, AmaBhunghane, has done an excellent job in pointing to them.1
Transfer pricing arrangements are never advertised – they usually remain below the radar. Nevertheless, the AIDC report doesn’t argue that profits are necessarily ‘hidden’ from present or
1 http://amabhungane.co.za/article/2014-10-16-questions-lonmin-must-answer
prospect shareholders of Lonmin Plc, the parent company in United Kingdom.2
The report speaks of profit shifting. Shareholders in Lonmin Plc will suffer economically only if transfers are made to entities whose books are not integrated in Lonmin Plc’s public group accounts. Another possibility would be that a subsidiary located in a tax haven also pays ‘commissions’, ‘consultancy fees’ or salaries to a group of beneficiaries to the extent that such costs eat up the revenue earned by billing subsidiaries in South Africa.
Normally, however, if the shifted profits don’t “get lost” on the way – shareholders in a multinational mining company with a main listing in London and running operations in South Africa would benefit from transfer pricing, if they have their shares in the parent company.
What is sure is that a transfer pricing arrangement of this type shifts money upwards, away from local subsidiaries, and that local interests always are negatively affected. Profit shifting is done at the expense of both mine workers fighting for
2 www.aidc.org.za
86 BUDGET JUSTICE / CHAPTER 5
a living wage of R12,500, for example, and the South African Revenue Services (SARS) which collects tax on the profits of these subsidiaries. In the case of Lonmin the revenues of its tax haven company Western Metals Sales Ltd have amounted to the equivalent of R250mn per year on average.
Transfer pricing also moves money away from Black Economic Empowerment (BEE) minority shareholders. They expect to be paid dividends from the local entities – the subsidiaries that produce all new value in the group and where they hold shares.
Seen from this view – where transfer pricing arrangements are an integrated part of a multinational empire and the tax haven subsidiary makes a profit – the two transfer arrangements criticised in the AIDC report are one part of a flexible organisation that can convince Lonmin Plc shareholders around the world that they will, eventually, get a hefty return on investments.
Evidently, old and new incoming investors have been convinced of that, even after the killings and the massacre in Marikana in August 2012.
Before 2012 they voted with their money to bring in Shanduka as the majority owner of the BEE partner Incwala Resources. They gladly contributed new risk capital to a net of $229-million in 2010, as a part of the $304-million loan (about R2.3 billion at the time) that made it possible for Shanduka to take control of Incwala by buying out some old BEE shareholders: This is where that cash went.
One exception to the rule of narrowly focused profit-making was the decision by the International Finance Cooperation (IFC) to invest in Lonmin Plc. The IFC is a part of the World Bank Group.
According to a report (30 August 2013) by the Compliance Advisor Ombudsman (CAO), the IFC favoured such an investment because Lonmin was ‘undertaking an aggressive programme of housing development and hostel conversion so as to be able to provide improved living conditions of its staff’.
This was ‘expected to be complete by 2011’, adds the CAO.
IFC provided new equity of $50 million to Lonmin, starting from 2007.
The housing programme referred to by the IFC was an obligation under the Mining Charter. It has been scrutinised by the Marikana Commission of Inquiry. Lonmin’s local subsidiaries, Western Platinum Ltd (WPL) and Eastern Platinum Ltd (EPL) committed to build 5,500 new houses for mine workers and their families.
To date only three show houses have been built. This blatant failure also corrupted the hostel conversion programme. If no houses are built in parallel to the conversion of hostels, then some three out of four workers staying in a hostel move to the informal settlements after a conversion is done.
The unsustainability of the situation was already clear in 2011 when Lonmin was hit by ‘community unrest’. Lonmin dismissed 9 000 workers after a two week wild cat strike for higher wages in May, and then again rehired 8 200 workers.
Lonmin doesn’t provide a cost figure in dollars or rand for the 2011 strike in its annual reports, but the monetary cost for the worker upheaval in 2012 was $159-million, according to Lonmin, or close to R1.3-billion.
The local subsidiaries hold the mining licences, and they are obliged to honour their Social Labour Plan commitments. In addition, they face increasing pressure to end low-wage labour.
In this situation, instead of financing their legal obligations, Lonmin, via its local subsidiaries, has to ‘afford’ huge bills sent from a tax planning outfit in Bermuda in ‘sales commissions’ and from the head office company LMS in ‘management fees’.
Even after accepting a part of the exorbitant management fees, we calculate that these two arrangements imposed a cost on the local subsidiary Western Platinum of well over R400 million per year.

87BUDGET JUSTICE / CHAPTER 5
There are several strong criticisms of this arrangement. The question of whether the ‘structure’ in Bermuda has been nothing but a bank account guarded by the law firm Appleby Services is one of them.
In addition to Western Platinum paying more than R1.7-billion internally in ‘commissions’ and ‘fees’ 2009-2012, Lonmin also paid over R1 billion for marketing and management services to external providers over the same period, according to the 2013 annual report (page 174).
When asked why by the Mail & Guardian, Lonmin repeated twice that it doesn’t have any external service providers of these two services, while not clarifying why the annual report points to the opposite.
The transfer pricing arrangements of South African mining companies are not at all only a matter of lower taxes and tax planning. While a R100 million ‘transfer’ from South Africa to a tax haven gains R28-million in lower tax obligations, the rest (R72 million) is potentially at the expense of better wages and effective implementation of social labour plans. In that context it matters little if a transfer arrangement is ‘in no way illegal’, even if it is not seen as being in the least unusual (as testified at the Commission hearings by Lonmin director Mr M Seedat) and fully accepted, or at least tolerated by SARS in terms of current legislation.
The legal issues are complicated, but the effect these practices have on the workers, on the mining communities and on the SA economy, calls, in our opinion, for a major overhaul of corporate governance, capital controls and tax legislation.
Finally, Lonmin says the ‘structure’ of Western Metal Sales (WMS), registered in 1987 in Bermuda,
‘did not benefit Lonmin from a tax perspective as Lonmin remained liable for the payment of taxes in the UK arising from legitimate and reasonable commission paid to WMS’(letter to the Mail & Guardian, 26 September).
Lonmin here refers to the ‘Controlled Foreign Company’ legislation in the UK, which makes a UK parent company liable for tax on dividends distributed by a subsidiary in a tax haven. Despite this legislation, Lonmin has paid no (zero) tax in UK from 2000 to 2013 and obviously found a way out.
To be liable for tax isn’t the same thing as actually having to pay tax. This also goes for Lonmin Insurance Ltd (LIL) in Bermuda, to which Lonmin subsidiaries have paid, and are paying premiums.
In 2013 LIL was moved from Bermuda to another legendary tax haven: Guernsey in the English Channel. Lonmin told Mail & Guardian’s AmaBunghane that LIL doesn’t have any staff on Guernsey. Asked for the commercial motive for the move of LIL, Lonmin says that it moved to the same time zone as Lonmin’s other companies and adds, ‘It is more practical to have LIL located in Guernsey so that these Board meetings can be held at the same time as the relevant Lonmin executives responsible for LIL are travelling to London on other Lonmin business’.
Tax authorities around the world are increasingly questioning registrations in tax havens if there are no real activities on the site. ‘Where does the board have its meetings?’ has become one of the test questions.
To Lonmin’s assertion that we are not tax legislation experts, we have to admit we are neither experts of geography, but if the motive for the relocation was only geographic, isn’t London closer to London than Guernsey?
88 BUDGET JUSTICE / CHAPTER 5
Aggressive tax planning and the consequences for the South African budget
Illicit capital outflows from SA are massive. Ashman, Newman and Fine (2011) estimate them to be in the region of 20% of GDP in 2007. This is over R400 billion rand.
Among the industrial sectors, they put the SA mining sector in the lead when it comes to trade mis-invoicing, and estimate about US$31.7 million in 2006. Dev Kar and Brian LeBlanc (2013) rank South Africa number 11 among the 15 developing countries with the highest illicit capital export. For the ten years from 2002 to 2011, they calculate that illicit capital flows from South Africa amounted to US$100.7 billion or US$10.073 billion on average per year. At the current exchange rate, this corresponds to over R100 billion per year.
That is an average. 2011 is the last recorded year in their study. That year they estimate that illicit capital outflows from South Africa amounted to staggering US$23.732. At the 2011 aver-age exchange rate of about R7 per US dollar, this is the equivalent of R166 billion.
If R166 billion were taxed by SARS at a 28% corporate income tax (tax on profits), it would yield R47 billion in tax revenue. This would have added over 6 percent to all the government’s revenue in 2011 (which was R765.5bn in taxes and other incomes). The rest, R119 billion, is lost to South African society at large. This is much higher than the loss in tax revenue. Illegal capital outflows from companies are a major concern for workers and they should concern the union officials who sit in wage bargaining.
Indeed, illicit capital export is growing. ‘Controlled for inflation, illicit flows from developing countries increased by 10.2 percent per annum between 2002 and 2011,’ according to Kar and LeBlanc. In Africa it grew by 20.2 percent per annum.
AIDC has not gone into the issue of whether the transfer pricing arrangement organised by Lonmin was illegal. Transfer pricing is often legal. In SA the final verdict rests with SA Revenue Service (SARS).
To ‘under-invoice’ something that you sell to a subsidiary outside a country, or to ‘over-invoice’ something that you buy from a subsidiary outside a country is however illegal. Also this is not clear-cut. As we write, the multinational company Proctor & Gamble has been stopped from doing business in Argentina because of alleged ‘under-invoicing’.
According to Kar and LeBlanc, 80 percent of the illicit outflows in the world take the form of mis-invoicing when doing business between subsidiaries of transnational companies.

89BUDGET JUSTICE / CHAPTER 6
ThE pEoplE’S AlTErnATIvE
BuDGET SpEECh 2014
honourInG our DuTIES
To rEAlISE huMAn rIGhTS
AnD SoCIAl JuSTICE
.
BUDGET JUSTICE
6
90 BUDGET JUSTICE / CHAPTER 6
Acknowledgements
This speech is dedicated to those communities who unite peacefully to protest against poverty, lack of service delivery and who struggle for their human dignity in South Africa. As the late Nelson Mandela said “as long as poverty, injustice and gross inequality persist in our world, none of us can truly rest...Massive Poverty and obscene inequality are such scourges of our times...Overcoming poverty is not a gesture of charity. It is an act of justice. It is the protection of a fundamental human right, the right to dignity and a decent life. While poverty persists, there is no true freedom.”
The People’s Alternative Budget Speech is the first publication developed by the Budget Expenditure Monitoring Forum and the Alternative Information Development Centre (AIDC). This speech has been years in the making, drawing on the success and lessons of the People’s Budget Campaign
and more recently the Call for Budget Justice campaign and the work of many organisation incorporating budget work to advance social justice in South Africa.
This speech could not have been written without the invaluable support of the Budget Expenditure Monitoring Forum’s (BEMF) Steering Committee 2014 who assisted in conceptualising the speech and recommending what the speech needed to cover. A great deal of gratitude is given to the many people from the member organisations of BEMF who also assisted in writing, fact-checking and proofing the different sections of the speech.
Finally, the speech would not have been possible without the financial support of the Open Society Foundation – South Africa and OXFAM who provide generous support to our efforts to protect, promote and advance human rights.
91BUDGET JUSTICE / CHAPTER 6
The Budget Expenditure and Monitoring Forum and Call For
Budget Justice imagined, for Budget 2014/15 what we would
say to the nation if we were the Minister of Finance. We
canvassed the views of a team of economists, activists, social
scientists and researchers. Most importantly, we listened to
the needs and demands being expressed by communities the
length and breadth of our country. After careful consideration,
we were able to prepare a people’s Budget Speech for a
people’s Finance Minister.

92 BUDGET JUSTICE / CHAPTER 6
Introduction
I have the honour to present to you the first People’s Budget Speech. This Budget is dedicated to Nelson Mandela and all those who fought and died for equality and dignity in South Africa, and those who continue this fight until today.
In the 20th year of our democracy, after careful thought and study of the results of previous Budgets, we have decided to take a fundamentally different approach to Budget 2014.
We want to admit our past mistakes in the way we have budgeted in South Africa. I draw on the words of the late, great Martin Luther King, African American civil rights leader. It is obvious that we have given, in so far as the poor and marginalised in South Africa are concerned, a bad cheque, a cheque which frequently comes back marked ‘insufficient funds’.
We believe that it is time that all in South African get handed a cheque that can and will be cashed, that will give especially the poor and marginalised their fair share in the riches of our country. This is the approach we are taking for our 2014 People’s Budget Speech.
We have taken time to reflect on and study the outcomes of austerity policies, as well as some of the main economic ‘fundamentals’ that have been implemented around the world … and have seen how they have failed. We have seen how they have created greater inequality and social instability.
We recognise that our struggles are not unique, and that we are part of a global community struggling for equality and dignity in terms of sharing global resources.
We have seen people’s everyday struggle for dignity, equality, and opportunity – and the ways in which they expressed their concerns from the Arab Spring that swept from Tunisia to Egypt, the Occupy Movement in the United States, United Kingdom and France, and recently also the mass marches and student protests in Brazil and Chile over social spending.
South Africa is not immune to these uprisings. In this context we admit the mistakes we have made – mistakes that have led to communities having to take to the streets to be heard.
In our approach to this year’s Budget we stress that we are not unreasonable. We accept that we cannot live indefinitely beyond our means or beyond what is safe or sustainable for the environment.
But what we also have to accept, is that we have a duty to meet people’s needs. In fact, in South Africa this duty is impressed upon all of us by our supreme law – our Constitution.
The Constitutional duty to meet people’s needs
We have a duty to allocate budget and human resources fairly; to provide quality education in the shortest time possible; to ensure safe and
honourInG our DuTIES To rEAlISE huMAn rIGhTS AnD SoCIAl JuSTICE – ThE pEoplE’S AlTErnATIvE BuDGET SpEECh
25th February 2014
honourable people of South Africa,
Good morning to you all, sanibonani nonke, molweni, dumelang, goeie more.
93BUDGET JUSTICE / CHAPTER 6
clean neighbourhoods; to create employment and to ‘progressively realise’ (that means steadily improve) certain constitutionally enshrined rights that are key to people’s ability to live.
In short, we have to deliver a cheque that can be cashed in order to narrow inequality.
We call on the international community and the business community in South Africa and abroad to support the measures we outline in this Budget. We ask them to accept that the only course to growing our economy is one where government must play an active role as guided by the Constitution, and according to which we will utilise our resources to make South Africa better for all.
We also recognise that there is no single blueprint or right way for effective fiscal and monetary policy and economic growth in the world.
What we call for today is a transformation of the Budget.
We acknowledge that what we call for is no easy task, but nevertheless it is one of the most important tasks ahead of us.
To that aim, we call on all South Africans to seize the opportunity to engage with this Budget. You must hold us accountable:
y when a child in grade R drowns in a poorly-maintained toilet;
y when children from poor backgrounds are educated without text books, desks, safe places for learning - and then expected to compete for jobs on equal terms with those who go to excellent, functioning schools;
y when caring rural doctors cannot provide life-saving oxygen and medical care due to lack of equipment and essential medicine;
y when mine workers or farm workers die while exercising their right to demand a living wage;
y when mothers cannot afford to feed their children;
y when women cannot feel safe in their neighbourhoods;
y when unscrupulous businesses extend reckless credit and enrich themselves from debit deductions off the bank accounts of social grant beneficiaries;
y or when a municipality shuts off water supply.
Communities across South Africa are well within their rights to take to the streets peacefully to demand better services and have their voices heard.
We also admit to our mistakes in letting these demands go unheard and services still not delivered. We stand here before you to acknowledge the rights of those living in Sebokeng, Uitenhage, Bronkhorstpruit, Hebron, Marikana, De Doorns and across the whole of South Africa.
We acknowledge that something is fundamentally wrong. It should happen no more! We will no longer be blind to your needs. That is why I am here to present you with an alternative to restore your faith in Government.
How will we do it?
Before I answer this question, I wish to say a few words to the privileged in South Africa. According to the current economic policy, the status quo is that you stay very rich and the majority of South Africa stays poor. We believe that there is an alternative, but that it requires a change of approach.
Staying on the current course will undoubtedly bring greater social, economic and political instability. Adhering to market fundamentalism to support economic privilege only for some has, and will continue to have, multiple costs: unemployment, crime and instability, as well as environmental degradation.
If we seize the moment and change our approach, we can create an economic approach that takes us to a more stable, equal society: one that will reduce costs, immediately create quality jobs for both young and old, boost the economy, protect the environment and put us on a path to equality, social justice and the transformation provided for in our Constitution.
94 BUDGET JUSTICE / CHAPTER 6
I ask the wealthy to accept the necessity of following this new path, and to work with us to achieve it, for the sake of their own futures as well as everyone else’s.
To this end I announce the following measures to bring more resources into the public purse:
A Focus on Corruption And Financial Mismanagement
Firstly, as was outlined last year in the Medium Term Policy Budget speech, it is incumbent on the public sector to reduce our own wasteful and avoidable costs with restrictions on air travel, car hire, accommodation, catering and conference budgets.
The measures implemented to curb extravagant expenditure are likely to save the people millions of rands. But more importantly, cutting such wasteful expenditure sends out an important signal: that those of us in the public sector, whether we are political representatives or civil servants, will act responsibly to ensure that the people’s money is not plundered.
But since this moral appeal will not be enough, public officials will not be allowed to be engaged in business with the State and derive from it a side income. To prevent the use of insider information, the existing assets of someone elected or appointed into office will be protected but may not be touched during his or her term of office. This will apply MPs, MECs, mayors, directors-general and all others in public service.
Secondly, we acknowledge and will act upon the Auditor-General’s call for government to stop the bleed of public funds due to corruption and financial mismanagement. In 2013 alone we lost R26.4 billion due to irregular expenditure.
We further note the Auditor-General’s finding that only 5% of local governments have been able to account, at standards we expect, for how they have spent the public’s money. It is no wonder that we see failures in terms of safe and reliable water supply and sanitation, erratic refuse management, badly maintained public buildings
and roads, and poor safety and security in our neighbourhoods.
We should hold local government politicians accountable for this, especially when we approach the 2016 local government elections.
We recognise that the fight against corruption and financial mismanagement must be addressed by both the public and private sectors. Corruption in the public sector comes at a cost for both the private and public sector.
Indeed, corruption and waste are to a large extent the result of a public-private partnership: corruption thrives where the public sector is underfunded, understaffed and withdraws from its service delivery responsibility. It also thrives when the public sector increasingly relies on private companies to deliver the services it should be delivering itself, and in the absence of strong government regulation.
Since we have started to address the cost of consultants used by government, we will now turn our attention to our bloated tender system as well.
This brings me to my next point, namely taxation.
Tax Justice For All
We are reviewing the way in which we raise money through our tax system to provide for public services.
After 20 years of democracy, there is growing recognition within South Africa and around the world that raising enough revenue through a good tax policy is better for economic growth and for stimulating job creation than the obsession with tax cuts.
We all pay tax. When you purchase groceries, you pay value-added tax (VAT), and if you earn more than about R6 000 per month, you pay income tax.
But some of us can afford to pay more tax - and will still be left with enough money to maintain
95BUDGET JUSTICE / CHAPTER 6
comfortable lifestyles, even when paying more towards the public purse. All of us - rich or poor - benefit from public services, and we should all contribute, according to our ability to pay, to the delivery of services needed by all South Africans.
So we need to tax the rich so that the poor can live better lives. We have to admit that since 1997 we have been implementing a tax regime that was inappropriate, inequitable, and regressive. For instance, some taxes are disproportionately borne by poor communities. Take the case of VAT: where it applies to the purchasing of basic, healthy foods such as vegetables and fruit, the taxation makes it very expensive for poorer households relative to wealthier ones.
Without raising sufficient funds, government cannot pay for the goals it sets itself and the promises it makes to you, the people. It is time to end the fantasy that we must do more with less.
We will create a more equitable tax regime and create a macro-economic policy that is fair and just.
A starting point would be to scrap the 25% national tax rule mentioned in the Budget speech two years ago, and which is a ‘rule’ adopted voluntarily in the past by this government. We believe we need a tax to Gross Domestic Product (GDP) ratio of at least 30%.
Increased taxation of this country’s wealthy to ensure the provision of services will not make us exceptional: any country collecting less than 35% of its GDP in taxation is a low-tax economy. The European Union average is 35.6% of GDP. Please note that I use this example to provide an indication of what is possible, not to suggest that we have a specific goal in this regard.
We will also review personal income tax policy for 2014/15. If we hadn’t cut taxes every year for the past 14 years, the personal income tax alone would have raised additional taxes totalling more than R125 billion last year. This is more than the total public health budget in 2012/13!
Last year, a person who earned R800 000 per year would have paid about R70 000 more in tax if we had kept the personal income tax on
individuals earning at such an income level to the same rates as 14 years ago.
Why do I call for a review of personal tax policy? We believe that if the wealthiest people in the country, namely those earning more than R5 million a year, were taxed according to their ability to pay, government could raise an extra R100 billion per year. Only 2 200 people with an income of over R5 million appear in the tax registers of South African Revenue Service (SARS). But annual studies tell us that 50 000 people or more with such an income live in South Africa.
Two years ago, SARS found 20 000 of such high-income individuals registered at one single financial institution and another 10 000 in other institutions: people who could afford to save R1 million every year. We now say to those people that it is time to start paying their fair share of taxes and help South Africa to become a great country for all who live in it.
In addition, we will implement initiatives to curb individual and corporate tax evasion to ensure a broader tax base and that the different sectors pay their fair share. Companies and individuals who are not up to date with their taxes should be held accountable, and if necessary face the full force of the law, because essentially they are stealing from the people of South Africa. That is unacceptable!
And of course, this also holds for members of government. We are certainly not biased against the private sector and expect that those in the public sector pay their taxes like any other citizen. We know that many of them earn in excess of R2 million a year.
South Africans deserve a fair and progressive tax regime where those businesses and households with the highest profits and incomes contribute their fair share.
We will support SARS in their efforts to ensure that international companies doing business in South Africa also pay their fair share for their use of our minerals, water and other natural resources, roads, schools, and human capital. We also ask for your support towards implementing
96 BUDGET JUSTICE / CHAPTER 6
regulations that block the use of tax havens like Barbados and British Virgin Islands.
The Tax Review Committee established in 2013 has our full support.
Tax reform will enable government to broaden the revenue side of the Budget and make available the necessary resources for key policy areas such as health, basic education, housing and rural development. Important programmes needing additional funds include national health insurance, school and hospital infrastructure, developing a more inclusive rural economy, and improved public transport systems in our cities and towns.
In short, tax reform will contribute towards effective public service delivery benefiting both rich and poor South Africans.
The Budget Deficit
South Africa cannot live beyond its means. We are part of a global community and global economy and we must carefully consider and manage our budget deficit.
When I speak of the budget deficit, I speak of how much the South African Government is increasing what it owes - its debt - to local and international lenders during one budget year. Where we experience a shortfall between the money we raise through tax and our other small incomes and the money we have to spend to meet our constitutional obligations, we have to borrow money to ensure that government spending is adequate.
However, South Africa faces plenty of deficits and not just a budget deficit. We should also consider deficits relating to unemployment and infrastructure, particularly social infrastructure such as schools, libraries, community play grounds, clinics, and access to electricity, affordable clean water, and sanitation. In addition there are deficits relating to our investment in future generations with respect to nutrition, quality of education, employment opportunities and the preservation and protection of the environment.
While waiting for our efforts to increase the tax revenue to bear fruit, South Africa also needs a much more expansionary fiscal policy. By this I mean we need to build government’s capacity to deliver its service delivery goals. We, the South African Government, need to do more.
Therefore after hearing the recommendations of the People’s Budget Campaign in 2012/13, we will have to allow for higher deficits over the next three years. This calls for a revision of last year’s deficit of 6% of GDP. Doing so would not make South Africa exceptional: recently the United States, the United Kingdom, France and India have all had budget shortfalls in excess of 8% of GDP. However, if we were to raise our deficit by a mere 2 percentage points, the people would have an extra R67 billion per year to fund long-term social projects.
We believe that by ensuring that state spending is productive and efficient, combined with tackling corruption and financial mismanagement, deficit spending will help us build up the economy and establish the human capacity needed for a productive South Africa.
An option available to us is also to turn to the available domestic funds from which we could borrow. The Unemployment Insurance Fund (UIF) has been underspending its contributions for many years and is currently at about R11 billion per year, so that the Fund is sitting on over R50 billion lying idle and waiting to be harnessed to build up the economy. The Public Investment Corporation (PIC) for pensioners currently manages funds exceeding R1.5 trillion, and sometimes does so by taking great risks: close to the entire government budget for 2014/15.
Finance from these sources could be used to offset borrowings from abroad and on the market at high interest rates that change with the whims of the international financial market and the demand of distant speculators. We will borrow what we need from these funds at an interest rate positioned somewhere in between the inflation rate and the real growth of our economy. This means that the loans we take from PIC for example will be taken at about 7% bearing in mind that the interest rate will be regulated.
97BUDGET JUSTICE / CHAPTER 6
What I call for should not be misconstrued as living beyond our means. We have to manage the public purse carefully in our quest to promote human dignity achieve equality, and protecting human rights and freedoms. But again, we will need global solidarity. I call on our regional partners, our BRICS partners, international and local investors and big business to support South Africa in its quest to put its people first.
Just a quick scan of the figures I have so far mentioned means we should expect to raise an additional R300 billion in real terms, assuming that we have modest growth in our economy compared to the Budget we have tabled for the past years. This amount is more than the consolidated health and social spending allocated last year, and would go a substantial way to allowing us to implement some of the vital programmes I will describe in more detail later.
A people’s Budget
The changes we envisage to the public purse however also imply that we review how we develop our national, provincial and local budgets. In line with international best practice, it is time that Treasury takes a leading role in supporting departments to move away from historical or incremental budgeting favouring wealthier provinces, and wealthier neighbourhoods in urban centres rather than rural centres.
We will assist departments and programmes to plan for and develop needs-based budgets that deal progressively with service delivery backlogs in under-served urban and rural areas. We can no longer expect to spend the same amount of rands in Gauteng as we do in Mpumalanga, or in the same in Camps Bay as we spend in Langa. We must account for real costs of delivery in a remote rural setting versus the costs in wealthier-resourced province. We must factor into account the costs of service delivery in our townships versus that in our suburbs.
In order to ensure that we are planning and budgeting in ways that will reduce poverty, promote gender equality, continue to reverse the spread of HIV and AIDS, and lower the mother
and child mortality rates, we must implement gender-responsive planning and budgeting.
We also recognise that the way we budget can narrow or widen the gender gap in areas such as salaries, health, education, and nutrition. We must ensure that we collect the necessary disaggregated data to understand the impact of our budgets on women and men. Given South Africa’s history, we can ill afford to budget as we have in the past. By factoring in accurate data relating to gender, we will be better able to develop our budgets according to real needs, rather than according to how we have budgeted in the past.
While South Africa ranks in the top three globally for budget transparency at the national level, this has not translated into budget transparency at provincial and local levels, or greater public participation in the budget process. Decisions around the raising and allocating of resources cannot and should not take place in a vacuum. In order for this Government’s policies to be successful, it is critical that civil society and communities are involved in allocation decisions and operational matters.
I commit to the principles of open government and will ensure that people have access to more detailed and timely budget and service delivery information about matters that affect them directly.
We need meaningful community budget awareness and participation. We need democratic structures that take part in allocation of resources, and that step in to reform the workings of a failing state when needed.
I therefore call on civil society, social movements, organised labour, and members of the public to engage on these issues on an ongoing basis and not only when the national Budget is presented.
This is an important way to cut the dramatic levels of unauthorised, fruitless and wasteful expenditure reported by the Auditor-General (AG) every year.
Honourable Members of the Public, I will now turn to some specifics.

98 BUDGET JUSTICE / CHAPTER 6
Take South Africa off Austerity Autopilot
Last year I ensured that the public sector was on austerity autopilot. In October, I described a public sector that demanded a smaller share of gross domestic product or GDP until 2016/17. When I say gross domestic product, I mean ‘Imveliso Isizwe Iyonke’, or the total produce of goods and services in South Africa in rand value.
What I presented to the public was a plan where government plays a smaller role in the production of goods and services in South Africa.
This was a mistake.
South Africa’s Gini coefficient, which is an internationally-accepted indicator for inequality, is one of the highest in the world, and has increased since 1994. This calls for our Government to intervene.
The Budget of R1.2 trillion which we tabled in 2013 to be spent by national, provincial and local government, and which would have grown to R1.3 trillion in 2015/16, is unlikely to deliver the services we need. Given the need for services in health, education, social development and safe and clean places to live, I will now be outlining a spending plan that provides for a public sector capable of playing a bigger role in the economy and reducing inequality.
As I have already explained, there are various ways in which we can raise extra resources to ensure we have a capable state.
One option is to increase the budget deficit, not decrease it from 4.8% to 3% of GDP as outlined in the Medium Term Budget policy statement of 2013. The 3% goal was something we adopted from the European Union, and which to date has no deeper scientific study underpinning it. It was a political slogan we adopted without reflecting on the true needs in South African.
We will maintain responsible public sector borrowing, and not cut it from 7.1% to 5% of GDP over the next three years. We cannot do so by turning to the stormy financial markets where South Africa loses out to the demands of
profit-greedy finance. We will turn to funds under government control, and temper the present quest for a short-term increasing of financial returns of these funds.
Our mistake in the Medium Term Budget Policy statement was to believe that we are currently in a position to cut public spending and ensure that we live within our means.
A government budget is not like a household budget. We have more options available to us. We believe that given our Constitutional responsibility, we cannot, and should not, limit real growth in non-interest public spending to 2.6%. We can no longer limit the amount of money we allocate to delivering key social services in order to allay foreign investors and credit rating agencies.
In the name of Nelson Mandela’s vision, I call on foreign investors and credit rating agencies to support South Africa in her pursuit for greater social equality and social justice.
Growth is a problem in South Africa, not deficits. Austerity and budget cuts are not the answer. I do not dispute that we as Government need to focus on better use of existing resources, but this does not justify failing to raise overall government spending beyond 2.6% per year. In fact, we now recognise that austerity, or asking government to do more with less, provides just the opposite of growth and pulls much-needed spending out of the economy just when it is needed most.
Currently, the South African economy and society are structured in such a way that global and domestic elites are doing good business and living well, while the rest of the population struggles to find employment, safe drinking water, good education and health care, safe public transport and food security.
The global elites and tourists and their local South African allies are using South African resources to boost their profits and move their wealth outside of the country. As Economist Ben Fine argues, South African post-apartheid economy has been dominated by a range of identifiable features these include:

99BUDGET JUSTICE / CHAPTER 6
y Firstly, large global companies such as Walmart or Mittal are benefiting disproportionally from South African resources, while keeping the profits outside of South Africa. There was also the recent PharmaGate scandal involving big pharmaceutical companies.
y Secondly, international and domestic financialisation is another issue of concern. It involves the increasing role of banks, stock exchanges, financial elites and institutions in illegal capital flight, where companies and individuals working in South Africa take their money outside of the country – sometimes to a value exceeding 20% of South Africa’s GDP. In a recent study by Wits academics, mining was found to be the main culprit, with outflows of an estimated $31.68 million or R346 million at the time of writing the speech. This amount could have contributed significantly to the economy and public purse.
y And thirdly, let us not forget the BEE creation of a parasitic elite through incorporation into the private sector, through mineral rights and tenderpreneurship coupled with weak public monitoring and oversight because lack of funding. Indeed, a strategy that emphasises junior partnership with old-wealth apartheid money cannot bring the broad transformation we need to see in South Africa.
Today, I commit to taking off the autopilot and place South Africa on a different macroeconomic trajectory. I envision a macro economy where public investment is high, and where private investment is high, in particular local investment - where we hope that both public and private sectors ensure decent jobs with decent wages, where employment is fostered by investing in local industry, and where South Africa’s involvement in the global economy leads to real investment and productivity.
Keeping our eye on the Constitution – Budgeting for Social Infrastructure
As I have already pointed out, scaremongering by ratings agencies, media pundits and big business does not take into account that South Africa faces plenty of deficits, not just a budget deficit.
Fixing these deficits demands a national, provincial and local budgets to pay for the world we want, and not a plan that expects South Africans to do more with less. This means increasing, in real terms, the baseline allocations towards health, basic education and social development.
South Africans have for too long experienced long queues at clinics, regular medicine shortages, poor upkeep and maintenance of school buildings, and poorly functioning to non-existent emergency medical services in Gauteng, Limpopo and the Eastern Cape, to name but a few examples.
In the past, we have failed to outline spending priorities that are truly geared towards addressing the ongoing downward slide in the quality of key social services such as health, basic education, and access to basic services such as electricity, drinking water, and sanitation.
We do recognise the need for increased spending on major infrastructure projects, but we must ensure that spending on such projects does not take place at the expense of day-to-day goods and services and the filling of essential mid to low-level posts in the public service. In fact, failing to budget adequately for goods and services and the recruitment and retention of essential public servants could undermine the goal of creating a capable state.
I now turn to the following specific Budget allocations for 2014/15:
health
We admit that we have not yet provided a clear financial commitment towards the resources needed to expand and improve health services. Even if there still isn’t a published White paper on the National Health Insurance (NHI), or the often-discussed Treasury paper on financing a National Health Insurance Fund, we cannot deliver a 2014 Budget that does not allocate the resources needed to reform the South African health system.

100 BUDGET JUSTICE / CHAPTER 6
Over the medium term, the consolidated health budget allocation will increase on average, in real terms, by approximately 1% in 2016/17 with an estimated budget of R164 billion by 2016/17. It is time that we review this allocation to ensure that we are investing in reforming our health system. In other words, this means that we have expected our health workers to do more with less – resulting in absenteeism, burnout, and loss of skills among health workers in the public sector, particularly in our rural areas.
Fix the provincial health Budgets
Without a doubt the current crisis in health services in the Eastern Cape, which has been highlighted by the Eastern Cape Health Crisis Action Coalition (ECHCAC) is linked to the year-on-year slowing of expenditure towards health services in that Province as well as other provinces. We will, as a matter of urgency, ensure that any measures to cut costs will not be at the expense of social services and I now recommend an above-inflation budget increase of more than 2.4% for Health on top of baseline allocations for the 2014/15 financial year.
Resolving the ongoing crisis in the Eastern Cape is not only the responsibility of the Provincial Department of Health, but our responsibility too. For far too long have our budgetary decisions been based on crude measures of efficiency and performance based on how well a department balances its books. While efficiency and good financial management processes are certainly fundamental principles of accountable governance, we realise that historical and incremental budgeting continues to act against achieving the Constitutional imperatives of equity and access for all. The sad truth is that most provincial health departments, which are the primary providers of services in the public sector, continue to fail to deliver on their core constitutional obligations. This is particularly acute in the Eastern Cape and Gauteng, closely followed by the Free State, Mpumalanga and Limpopo.
Mismanagement of the health system and rampant corruption has meant that budgets
are no longer sufficient to support the full range of health care services that provinces should provide. A good start would be to start taking swift and decisive action against those officials who continue to loot the public health purse for their own gain. Dealing with corruption would rescue billions of rand and go a long way in improving access to health through better management of resources.
We can no longer tolerate a budgetary system where provinces and districts that are the most rural, most deprived, and in greatest need, continue to receive the smallest share of public funds relative to historically better- resourced areas. It is untenable that 20 years into democracy, provinces such as Gauteng and the Western Cape continue to benefit from allocations that are based on apartheid era health budgets. In contrast, provinces like Mpumalanga and Limpopo, where there was little health infrastructure to speak of in 1994, have to make do with per capita primary health care allocations that are more than R200 less than the national average.
These structural inequities exist within provinces too. In the Eastern Cape, the Nelson Mandela Bay and Buffalo City metropols continue to receive as much as R500 more per capita for primary health care than deep-rural districts like Alfred Nzo, Cacadu and OR Tambo, while having far greater access to basic infrastructure and personnel.
It is for these reasons that, as a matter of urgency, we must reform our budgetary system in ways that use need as the basis for the allocation of public funds. But this cannot simply result in shrinking the budgets in one area to expand allocations in another; we need to look at the bigger picture. It is therefore imperative that in the development of NHI financing mechanisms we are cognisant of the need to increase financial resources in all areas of the public system. This will necessitate drawing greater resources from the private sector in ways that promote equity between the public and private sectors, as well as within the public sector itself. Already, we have seen gains with reducing the cost to provide ARV from R313.99 in 2009 to only R89.37 per month in 2012.
In 2013 more than 2.4 million people living in South Africa were receiving anti retroviral
101BUDGET JUSTICE / CHAPTER 6
treatment. As a result, we have been providing increases in HIV and AIDS spending as a share of the total health budget to where it would grow to approximately 10% of the total health budget in 2015/16. We now believe that, in order to ensure that spending on HIV and AIDS does not crowd out other spending priorities in the health sector such as employing community health care workers and providing rural health, emergency medical services, reproductive, maternal and child health, addressing non-communicable diseases and preventive and rehabilitative services, we must ensure the health vote receives its fair share.
In addition, to ensure the success of our primary health care system, we commit to allocate adequate resources to support the oversight and community accountability function of clinic committees. I also call on provincial leadership to ensure that they give their provincial health votes a fair share.
Basic Education
Recently a grade R learner died tragically as a result of a fall into a pit latrine toilet at school. This has put the spotlight back on the state of our schools.
Between August and September 2013 research by Equal Education found that in Tembisa, Gauteng 90% of high schools surveyed had insufficient infrastructure or a dysfunctional sanitation system. Furthermore, it was found that, in over half of the schools surveyed, it was common for more than 100 boys or 100 girls to share a single working toilet. The World Health Organisation recommended ratio of school toilets per child is 1 toilet to 30 learners. Clearly we are failing our children.
We are pleased to report that real spending on the average public ordinary school learner was 30% higher in 2007 than in 1994, and that this trend has continued over the past four years with real spending per student increasing. However, these increases are largely due to increases in conditional grants - the majority of which are for school infrastructure at 54% and the school
nutrition scheme at 42%. Consequently, the general perception that South Africa’s spending on public education is high, is wrong. Indeed according to economist Sean Muller at UCT:
y South Africa ranks 85th of 152 countries in the amount spent per pupil in basic education relative to GDP per capita.
y Compared to the Organisation for Economic Co-operation and Development (OECD) average, South Africa spends a full 12 percentage points less, as measured by GDP per capita per pupil.
I take this opportunity to thank education activists, in particular Equal Education and SECTION27, for ensuring that minimum norms and standards for school infrastructure were finalised with regulations published in 2013 by the Department of Basic Education (DBE). The Treasury is currently costing these norms and standards, which will be published before the budget vote of the Minister of Basic Education.
However, the enormity of the infrastructure backlog is abundantly clear. We have too many schools that continue go without electricity, water supply, safe classrooms, toilets, and playing grounds. It is clear that there is an urgent need for this Government to review the time frames to meet minimum infrastructure standards for all schools.
The 2013 Budget Review highlighted that the medium-term allocation of R8 billion will be used to provide water to 1 257 schools, sanitation to 868 schools and electricity to 878 schools with 496 inappropriate structures replaced, of which 395 are mud schools. The education infrastructure grant to provinces has allocated R23.9 billion over the 2013 Medium-Term Expenditure Framework (MTEF) to build, upgrade and maintain existing structures. This requires a firm commitment to eradicate the infrastructure backlog.
Thus we now regard it as a mistake on our part to have approved budget reductions and reprioritisations that saw spending reduced by R1.6billion (R650 million from the school infrastructure backlogs grant and R1 billion from the education infrastructure grant) towards the
102 BUDGET JUSTICE / CHAPTER 6
financial and physical planning sub-programme in the DBE as stated in Budget 2013.
This mistake led to a decision that all planned projects in the school infrastructure backlogs grant be completed over a five-year period instead of three years. It is clear that South Africa’s children cannot be asked to wait any longer, and it is time for us to put our money where it matters most – to secure the future of our children.
As a result, I will urge Cabinet to task the DBE to outline clearly how they propose to overcome the challenges they reported to Parliament in the provision of infrastructure relating to capacity of contractors, and the challenges of delivery in rural areas.
I also call upon provincial administrations to demonstrate the political will, and much greater accountability, to ensure project monitoring takes place and guarantees a return on our investment with clean, safe schools where learners are able to reach their full potential.
I also welcome the call by SECTION27 upon private sector construction companies to assist government in addressing the school infrastructure backlog. Twelve big construction companies have admitted to bid rigging between 2006 and 2010 and benefitting enormously from state construction tenders. It is time that these companies demonstrate their patriotism by assisting in fixing our schools.
Over the medium term, the consolidated education budget allocation will increase in real terms by approximately 2% in 2015/16. It is time that we review this allocation to ensure that we are investing in the right things. We must also ensure that school governing bodies are appropriately resourced to oversee the quality of education taking place in their schools.
In particular, we must increase funds directed towards special needs schools and integrated schools that accommodate disabled and learning-challenged learners. We are failing too many children with disabilities and robbing them of the right to equality and the basic education entrenched in the Constitution.
We regret that the current budget structures have only made provision for special needs schools, and did not allow for funding for inclusive education incorporating special needs. The DBE estimates that to address inclusive education and special needs, a budget estimated at R5.5 billion would be required in 2013/14 alone. However, only the Free State, KwaZulu-Natal, North West and Western Cape provinces used included budgeting for inclusive education and special needs at a total of R463 million.
These mistakes of the past should not be repeated. We will call on the provinces to ensure that they are budgeting appropriately for inclusive education beyond just special needs.
Social protection and Child-Focused Budget Monitoring
It is critical that we ensure the distribution of adequate income to poor households.
Last year I announced that spending on social grants will increase over the medium term to accommodate an increase in those requiring grants and inflation adjustments to the value of the grants. Consolidated government expenditure towards social protection is set to increase from 145 billion in 2014/15 to 163.2 billion by 2016/17 – a 7.4% nominal increase. However, when inflation is taken into account, this is an increase in real terms of only 1.8%.
Clearly this was a mistake.
I acknowledge the sustained work of civil society organisations over many years who argued for the extension of social grants to children up to the age of 18. I have also heard the people’s concerns about the lack of real increases in the Child Support Grant. Research presented to me shows that the provision of child support grants has had a positive effect on the lives of many millions of people, in particular vulnerable children and their caregivers, and the broader economy.
However, we accept that it is imperative that we analyse social security beyond the numbers of beneficiaries and consider what we mean by the concept of ‘adequacy’. For example, does R300
103BUDGET JUSTICE / CHAPTER 6
per month actually provide adequately for the basic needs of a child, or R1 270 for those of a pensioner? The answer is no, given the recent hikes in the petrol price and the rise in basic food prices.
The increase in the cost of basic foods hits the poor the hardest. For example, the Food Price Monitor reported in November last year that the cost of a selected food basket as a portion of the monthly income of the poorest households increased to 42.6% from last year October, while for wealthy households it remained at around 1.7%. A pensioner is expected to spend almost half of their grant on basic food requirements. A poor family of four receiving two child support grants would just be able to afford the basic food basket of R456, leaving very little for anything else.
In line with the recommendations by the Finance and Fiscal Commission (FFC), I have made more resources available to create a child support system that relaxes the existing means tests and moves towards faster universalisation of the child support grant and to ensure those that need the grant receive it in 2014/15. We welcome the FFC recommendation that government expands coverage and strengthen integrated social protection systems to respond appropriately to the levels of child poverty experienced in South Africa.
We also welcome the information brought to us by Black Sash regarding Cash Paymaster Services (CPS), and the Stop SASSA-CPS Debits campaign. CPS meant that millions of social grant beneficiaries experiencing unauthorised, undocumented, and unlawful debit deductions from their bank accounts.
Furthermore, we acknowledge the social grant payment tender irregularities as determined by the Constitutional Court in November last year. Clearly it is mistake to engage private business in the distribution of social grants, and this will be corrected. We increasingly believe that social grant payments need to be managed by a government department or agency to ensure the integrity of this vital service.
We will also support initiatives to amend the National Credit Act and related legislation so that social assistance grants are not considered income. Furthermore, we will ensure amendments
to the Social Assistance Act will make it illegal for debit deductions from the bank accounts of social assistance grant beneficiaries and to criminalise the use of social grants as collateral by lenders or mashonisas.
Fix the Social Security System
It is time we relook our social protection system. Poverty and unemployment have deepened in our country – so how do the poor survive? In her book Eating From One Pot, Sarah Mosetsa provides ample evidence for why, as part of a comprehensive social security system, we need to provide universal monthly grants: a grant that would reduce the need for means testing, minimise opportunities for corruption and reduce the poverty gap by close to 74%.
As Mosetsa argues, we have made strides by extending the child support grant to children up to the age of 18. However, while our social security system takes care of children, the elderly and the disabled, there is no social security system that caters neither for the many working-age people who are unemployed nor for those who are HIV positive or those suffering from other chronic illnesses of poverty. With full implementation of such a grant, the number of poor South African men and women will be reduced to zero.
Indeed, we recognise that by failing to implement such a system, we are in violation of the Constitution which guarantees to all a right to social security, and social assistance to those who cannot provide for themselves. We recognise that we have failed to address poverty in a comprehensive manner by limiting our social security system and choosing to prioritise fiscal restraint over redistribution.
We will return to the recommendations of the 2002 Taylor Committee, and we commit to a progressive introduce of a universal Basic Income Grant, which the wealthier will pay back through their taxes. There is ample evidence that a basic income grant has the potential to contribute to economic activity and job creation. This will enable people to live with a greater degree of dignity, and also bolster economic development from the bottom up.
104 BUDGET JUSTICE / CHAPTER 6
Budget for the delivery of equitable and sustainable access to, and use of, safe water and basic sanitation services.
We can no longer ignore the role that access to safe water, basic sanitation play in improving health, hygiene and education outcomes, while also contributing to sustainable development. The cost of inadequate and unsafe water supply, poor sanitation, and unsafe hygiene practices affects all in South Africa - especially the poor. It is also a human rights issue.
The South African Human Rights Commission has conducted investigations into the water and sanitation situation in various municipalities across South Africa. The Commission’s preliminary findings have revealed that while access to safe water and basic sanitation has increased since 1994 and 95% of households having access to water, we still have not achieved universal access. More importantly, many households are experiencing service failure and/or service delivery breakdowns. The recent violent water protests in North West province have shown that having access to a tap in your yard, home or street, doesn’t mean you actually have access to water or that the water is ‘clean and safe’.
To address this, there needs to be an intergovernmental response from national to provincial and down to local government. Expanding access to safe water and basic sanitation requires investment all along the supply chain. It starts with investing in sustainable water sources, and continues along bulk water supply schemes to wastewater infrastructure and recycling.
While some improvements have been made in municipal spending to develop sanitation and sewerage services since 2009, capital expenditure still remains low, and many municipalities are struggling to operate and maintain their water infrastructure at an adequate level. By the end of December 2013, municipalities had only spent R53 million or 9% of their R603 million allocation under the dedicated grant for water infrastructure.
This is unacceptable.
Fix the Municipalities
While municipalities form the last link in the water and basic sanitation distribution chain, they represent the face of service delivery. In order to address the current crisis in the quality of service delivery, we have made revisions to the local government equitable share formula to ensure that allocations no longer mirror apartheid spatial infrastructure patterns.
For municipalities to supply quality water and sanitation services based on communities’ needs and to eradicate the offensive bucket system, they need skilled staff and equipment, and a corresponding budget. We believe that with these better budgets, eradication of the bucket system is achievable by the end of 2014.
We note that allocations towards repairs and maintenance are often the first to be cut when there are budgetary constraints. This is because there is often a difference between those who make decisions about new services and equipment, and those who are responsible for the recurring expenditure on repairs and maintenance. We have directed municipalities to ensure that they make adequate provision for repairs and maintenance. My mother always said ‘A stitch in time saves nine!’ and I agree: let’s fix the small problems before they become larger, harder to solve, and more expensive to fix.
With the assistance of the Municipal Infrastructure Support Agency, we will support municipalities with technical assistance, as well as public communication and access to information about budgets for water and sanitation services. This will enable communities and households to participate better in local government planning and budgeting processes, empower them to monitor the resources allocated to water and sanitation services, tackle corruption and maladministration, and ensure that funds are used only for the purposes they were intended.
105BUDGET JUSTICE / CHAPTER 6
Forming a Capable South African public Service
By investing in a strong public service delivery sector, South Africa can provide the public jobs needed to tackle the problems of poverty, inequality, and unemployment.
Again, we admit our past mistakes.
The fiscal policy framework set out in the Medium Term Budget Policy statement last year, described a relatively smaller public sector with a smaller share of GDP over time. We now see that this is incompatible with policies that need huge public sector involvement, such as the introduction of National Health Insurance, the provision of free basic education, enhancing social protection or broadening rural development and expanding agricultural opportunities.
We will establish at national, provincial and local level what staffing for a capable state entails. This would determine how many public jobs are needed, and at what cost - from ensuring that there are school caretakers, to the provision of the correct number of directors generals in national departments required to direct policy, monitoring and evaluation.
In conjunction with the Independent Commission for the Remuneration of Public Office Bearers, we will also revise the recent salary hikes for the country’s national and provincial elected officials.
We believe there is something wrong with the way South Africa treats its workers, in both the private and the public sectors.
It is unacceptable for a hard-working and committed community health worker to earn less than R1500 per month. We will change that. Yet, on the other end of the scale, some metro mayors receive up to R 3 300 in cell phone allowances alone, on top of their R458 000 a year salaries and other allowances. It is equally unacceptable that a mineworker earns on average R 70 000 per year, but a mining CEO earns R20.2 million per year or R55 000 a day.
protect Workers rather than Squeezing Workers.
A successful economic strategy for South Africa should ensure that the contributions to the economy from business and growth are more evenly shared between wage earners and big business. Currently local businesses are sitting on more than R1.2 trillion in idle cash reserves. The corporate non-financial sector has available to it R550 billion, insurers and pension funds have R152 billion, and private household deposits are estimated at R568 billion. Currently this money is sitting idle and not being invested into the economy, and the private sector could join the state in investing locally.
We have heard your discontent about the Employment Tax Incentive Act, commonly known as the youth wage subsidy, being stretched to all ages in the special economic zones, even if you are 90 years and older.
Yes, it is yet another tax cut to big business. It follows logically from the old trajectory we have been pursuing.
We now acknowledge that this subsidy to business will contribute to the general downward pressure on wage levels. It makes young workers even cheaper to employers. I am aware that the typical youth wage is already 25% lower than the typical adult median wage of about R3200 per month. The downward pressure on wage levels resulting from this subsidy will further lower the total demand for goods and services in the South African economy. This will in turn be to the detriment of small and medium-sized firms that do not produce goods for export.
Our decision to review this policy will reverse the R5 billion that the youth wage subsidy would have removed from the public purse. Rather than subsidising big business, this money can finance a real public works programme, or a larger number of community health workers, social workers and auxiliary staff.
I have talked about education, but we must also attack mass unemployment head-on right now. We believe we must employ people as they are! Let young people and people who have been
106 BUDGET JUSTICE / CHAPTER 6
unemployed develop new skills and abilities through in-job training while building houses, repairing roads, and creating the social infrastructure urgently needed in working-class areas.
Indeed, the desire for ‘labour flexibility’, together with cuts in labour costs to boost profits, forms part of an irresponsible income policy. It conserves inequality and fuels social instability and chaos on the labour market, where the rule of labour law is already severely undermined by labour broking.
I say it is enough. Kwanele, kwanele. Genoeg is genoeg.
I hear the voices of the many South Africans who have said it before me.
Green Economy – A million climate jobs
Honourable people of South Africa,
We can no longer continue on the path of allocating more money for more polluting coal-fired electricity plants and undertake infrastructure projects that lead to the destruction of our environment. That kind of energy policy is in contempt of our children and grandchildren, and it must stop.
We must indeed ‘follow a different trajectory’. We were about to enter ‘Coal 3’ where we now will be investing in more coal-fired stations and nuclear energy. But we have decided to turn away from this. The Mineral Energy Complex – an economy of extraction that uses land, electricity and water for mining, and coal mining to produce electricity, undermines the diversification of the economy, especially towards manufacturing.
While mining might bring in R20 billion in revenue annually, we cannot overlook the fact that the current bill for government to clean up abandoned mines and acid mine drainage is estimated at R30 billion. We still do not know what effects fracking to extract shale gas are likely to have on our water sources. We realise that the wins of new infrastructure will be of short term duration
if we don’t take some brave steps to protect our water sources and our fertile agricultural land.
We can no longer afford to have mining at the centre of our economic policy. We are making a very costly mistake, a mistake of inflicting increasing social and environmental costs that will overwhelm us in the end. We need to create a low carbon economy. If we continue to pollute the air with greenhouse gas like we do now by burning coal, or compromise our water and agricultural sources like we do now with acid mine drainage, it will only increase the country’s emission profile and accelerate the destruction of our environment and our communities.
This year, we will not send out the same signals to the Chamber of Mines, credit ratings institutes and high finance.
Over a number of years we could create a million climate jobs:
y By transitioning to ever greater production of electricity from wind and solar power;
y By investing in employment opportunities that are directed towards ensuring our industries are more energy efficient;
y By investing in employment opportunities that are directed towards adapting homes and buildings to reduce their energy consumption and by constructing new buildings to be energy efficient;
y By investing in our public transport systems, and by employing people to manage, run and expand the public transport system while also reducing our dependence on oil for transport.
y By investing in rural and urban land spaces and employing people to produce our food locally through small-scale organic agriculture.
y By investing in our water, soil and biodiversity resources and employing people to protect and maintain those resources.
In terms of transport alone, we welcome the research provided by the One Million Climate Jobs campaign which has shown that small but significant shifts in how we transport ourselves
107BUDGET JUSTICE / CHAPTER 6
and our goods could create at least 460 000 jobs. For example, if 500 000 more people rode buses to work and school, there would be an additional 3 500 buses and 42 000 more jobs in bus operations, vehicle maintenance and part supply as well as bus building, provided the buses are assembled in South Africa. If 800 000 more people used Metrorail trains, we would need an additional 113 passenger trains and about 10 000 jobs. We should also develop our roads to be bicycle friendly, with bicycles being both a rich person’s and a poor person’s mode of transport.
The growing evidence of climate change call for us to work together to change how we live, how we produce and consume and how we relate to nature and each other.
With imagination and commitment South Africa has an opportunity to become a world leader in sustainability.
Conclusion
Honourable People of South Africa,
In concluding my speech, may I remind you us of what I said at the beginning when quoting Dr Martin Luther King: we came to Parliament to critique the cheque that the architects of the Budget have presented to the South African people - a cheque which has come back marked ‘insufficient funds’.
How often do we not hear our politicians, public servants explaining that lack of service delivery is due to insufficient funds?
We refuse to believe that there are insufficient funds and resources in the great vault of opportunity that is South Africa.
And so we call on all who live in South African to ask for a cheque that can be cashed, that will give poor and marginalised people in South African their fair share in the riches built by the workers of this country and thereby bring stability and safety to all.
We will no longer tell South Africans to do more with less, to tighten their belts indefinitely or to ask them to wait another 20 years while an elected democratic government, tasked with making good the Constitutional injunction, makes good on its promises. Now is the time to make real the promises that fuelled the fight for democracy in South Africa.
I knew in advance that this speech might cause some upset in global financial markets. The changes I have sketched today, do not sit well with those who are currently benefiting both in South Africa and abroad from the status quo.
Inspired by recent measures in Ghana we have established a set of regulatory measures that will come into effect from 10am today to protect the rand and our reserves of foreign currency. I undertake that this is not an irresponsible move on our part, but one that is focused squarely on the Constitution and social justice. The Johannesburg Securities Exchange closed when I started to speak and will reopen tomorrow. We thought the so-called market needed a day to contemplate the meaning of our new trajectory.
More information on the details of foreign exchange controls that came into effect from 10am are available on the Treasury’s website. Be assured that we will weather any storm that seeks to take South Africa off its course.
It would be fatal for this Government to overlook the urgency of the moment for fear of upsetting the market. It is clear that the events at Marikana and De Doorns, and the many service delivery protests are not an end, but a beginning.
I stand before you to tell you that we will now rewrite this beginning, because if we do not, the whirlwinds of revolt will continue to shake the fragile foundations of our hard-won democracy. They will do so until we have a fiscal policy reflected in a Budget that truly raises, allocates, and spends rands and cents towards building a more just society.
Thank you.

108 BUDGET JUSTICE / CHAPTER
noTES:

109BUDGET JUSTICE / CHAPTER
noTES:
110 BUDGET JUSTICE / CHAPTER
noTES:

111BUDGET JUSTICE / CHAPTER
w w w . a i d c . o r g . z aw w w . a i d c . o r g . z a