Embed Size (px)
Citation preview
Agricultural production -crops Statistics Explained
Source : Statistics Explained (https://ec.europa.eu/eurostat/statisticsexplained/) - 13/02/2020 1
Data extracted in November 2019.Planned article update: January 2021.
This article is part of a set that is taken from Eurostat’s publication Agriculture, forestry and fishery statistics- 2019 edition .
Crops can be broadly categorised into two groups, those that are non-perennial and those that are peren-nial. Non-perennial crops are those that do not last more than two growing seasons and typically only one.Perennial crops last for more than two growing seasons, either dying back after each season or growing contin-uously; these are also termed permanent crops.
Crop production is particularly sensitive to prevailing weather conditions at key times of the year. For ex-ample, depending on a plant’s stage of development, heavy spring frosts can damage the growth of cereals anddestroy fruit blossoms. Likewise, spring-to-summer droughts and heat waves can cause significant yield losses,while strong winds and heavy rainfall can make harvesting difficult and compromise quality.
Meteorological and hydrological conditions therefore play an important role in levels of crop production but theyalso have a knock-on effect on prices through the causal effect of supply and demand. This is true for the EU,as it is across the globe. It is for this reason that production levels and prices are brought together in this chapter.
Meteorological and hydrological conditions therefore play an important role in levels of crop production butthey also have a knock-on effect on prices through the causal effect of supply and demand. It is for this reasonthat production levels and prices are brought together in this chapter. Of course, with the European Unioncovering such a large area and including such diverse climates, adverse weather conditions and extremes in oneregion are often offset by optimum conditions in another. However, where the production of certain crops isconcentrated in a few regions, EU production levels will be particularly susceptible to weather conditions aswell as to pest attacks.
The statistics on crop production in this article are shown at an aggregated level and have been selectedfrom over 100 different crop products for which official statistics are collected.
Weather reviewDrought conditions in central and northern Europe: wet conditions in southern Europe
Plants need sunlight, water, healthy soils, air and heat to grow. Among the meteorological factors, tem-perature and precipitation are of particular significance for yields and production levels. The 2018 crop year inthe EU experienced extreme weather events in terms of both temperatures and rainfall1
1The Joint Research Centre (JRC) produces a series of monthly bulletins on weather events for crop monitoring in Europe,from which much of this analysis is drawn. The analysis is conducted at the EU and Member State levels. Concerning the 2018drought, the JRC also produced a research article published in Earth’s Future.
Winter 2017-2018: the hardening of winter-sown cereals, which puts them into dormancy to withstand freezingconditions, was delayed due to widespread above-seasonal temperatures. As a result, frost-kill damage was lim-ited. Large parts of the EU experienced a severe cold spell at the end of February to mid-March, which delayedspring sowing and hampered the growth and development of winter crops. High precipitation in the centralbelt running from France in the West through to Bulgaria in the East, further delayed spring and summer cropsowing.
Spring-Summer 2018: there was a clear distinction between the prevailing conditions in central and northern Eu-rope and southern Europe. Central and northern Europe experienced severe drought conditions, a combinationof exceptionally warm temperatures and low precipitation. Indeed, many Member States in these areas recordedone of their three hottest summers and driest summers. The Standardised Precipitation-Evapotranspiration In-dex (SPEI) rated the drought in central and northern Europe as ’severe to extreme’ both for the 3-month(June-August) and 6-month (March to August) periods (see Map 1). In contrast, southern Europe and particu-larly the Iberian Peninsula recorded a wetter than usual spring and summer, marking the end of the 2016-2017drought in the area.
Agricultural production - crops 2
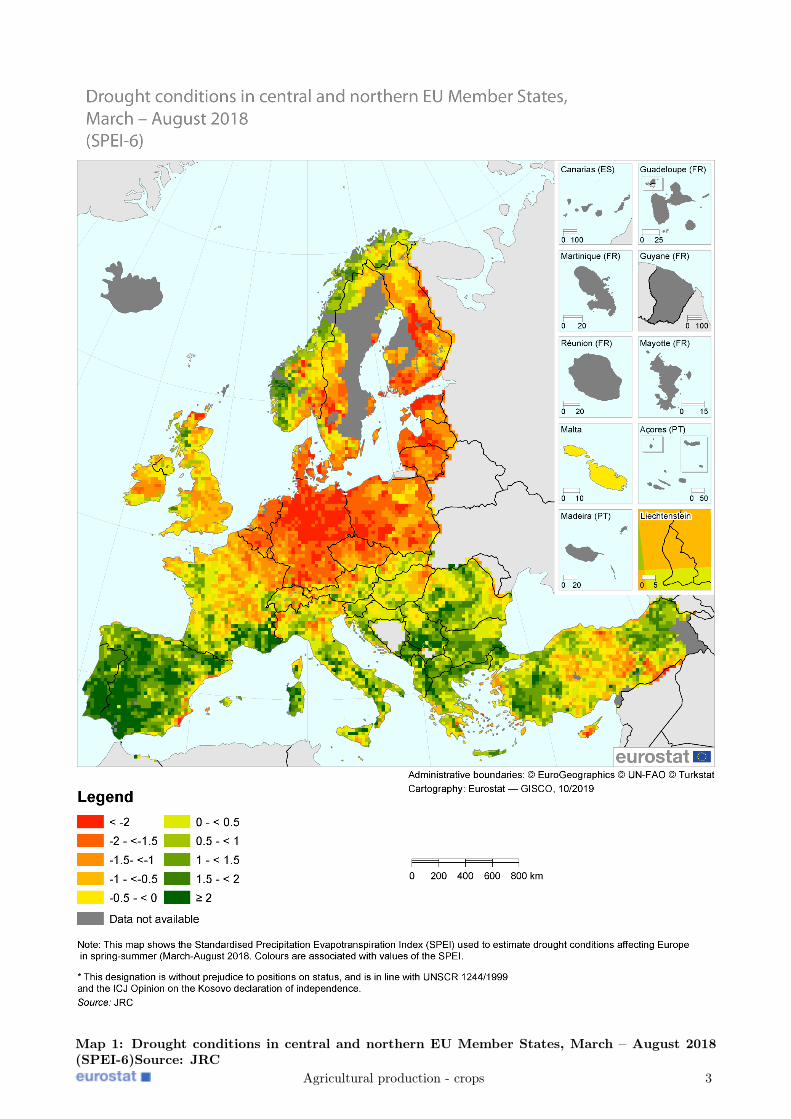
Map 1: Drought conditions in central and northern EU Member States, March – August 2018(SPEI-6)Source: JRC
Agricultural production - crops 3
CerealsCereal harvest in the EU sharply lower due to widespread drought conditions in central andnorthern Member States
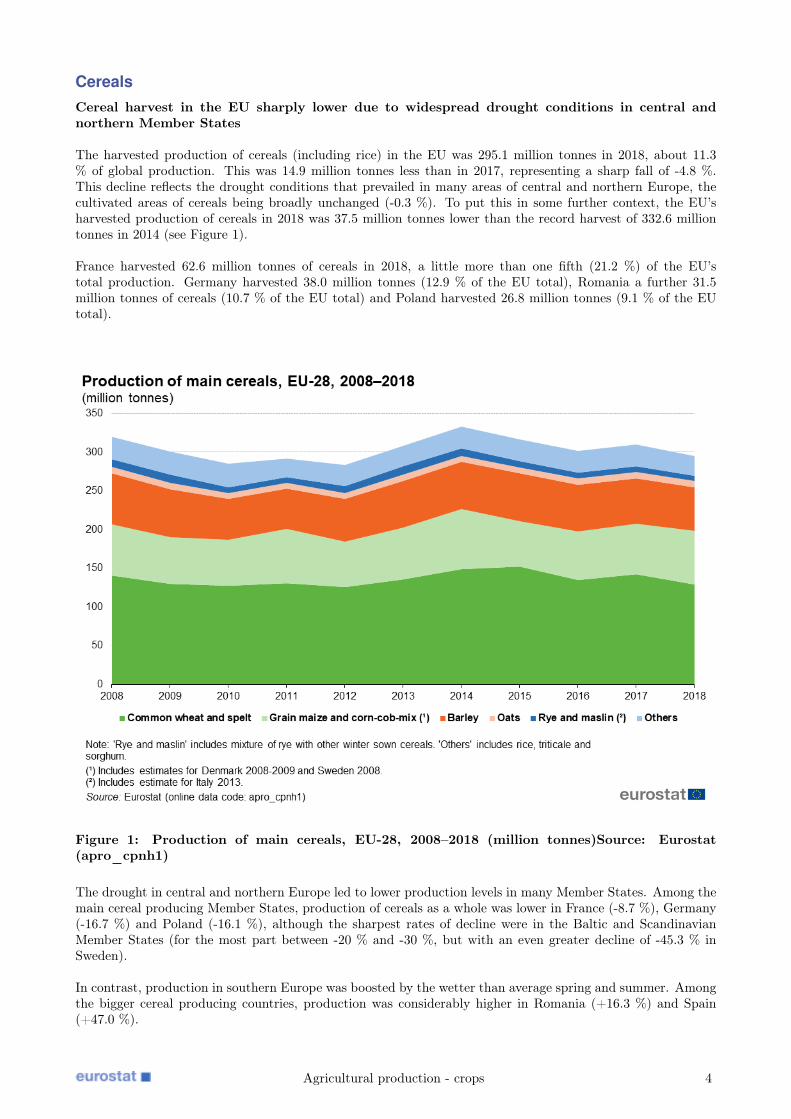
The harvested production of cereals (including rice) in the EU was 295.1 million tonnes in 2018, about 11.3% of global production. This was 14.9 million tonnes less than in 2017, representing a sharp fall of -4.8 %.This decline reflects the drought conditions that prevailed in many areas of central and northern Europe, thecultivated areas of cereals being broadly unchanged (-0.3 %). To put this in some further context, the EU’sharvested production of cereals in 2018 was 37.5 million tonnes lower than the record harvest of 332.6 milliontonnes in 2014 (see Figure 1).
France harvested 62.6 million tonnes of cereals in 2018, a little more than one fifth (21.2 %) of the EU’stotal production. Germany harvested 38.0 million tonnes (12.9 % of the EU total), Romania a further 31.5million tonnes of cereals (10.7 % of the EU total) and Poland harvested 26.8 million tonnes (9.1 % of the EUtotal).
Figure 1: Production of main cereals, EU-28, 2008–2018 (million tonnes)Source: Eurostat(apro_cpnh1)
The drought in central and northern Europe led to lower production levels in many Member States. Among themain cereal producing Member States, production of cereals as a whole was lower in France (-8.7 %), Germany(-16.7 %) and Poland (-16.1 %), although the sharpest rates of decline were in the Baltic and ScandinavianMember States (for the most part between -20 % and -30 %, but with an even greater decline of -45.3 % inSweden).
In contrast, production in southern Europe was boosted by the wetter than average spring and summer. Amongthe bigger cereal producing countries, production was considerably higher in Romania (+16.3 %) and Spain(+47.0 %).
Agricultural production - crops 4
Lower harvests for most cereals, with the exception of grain maize
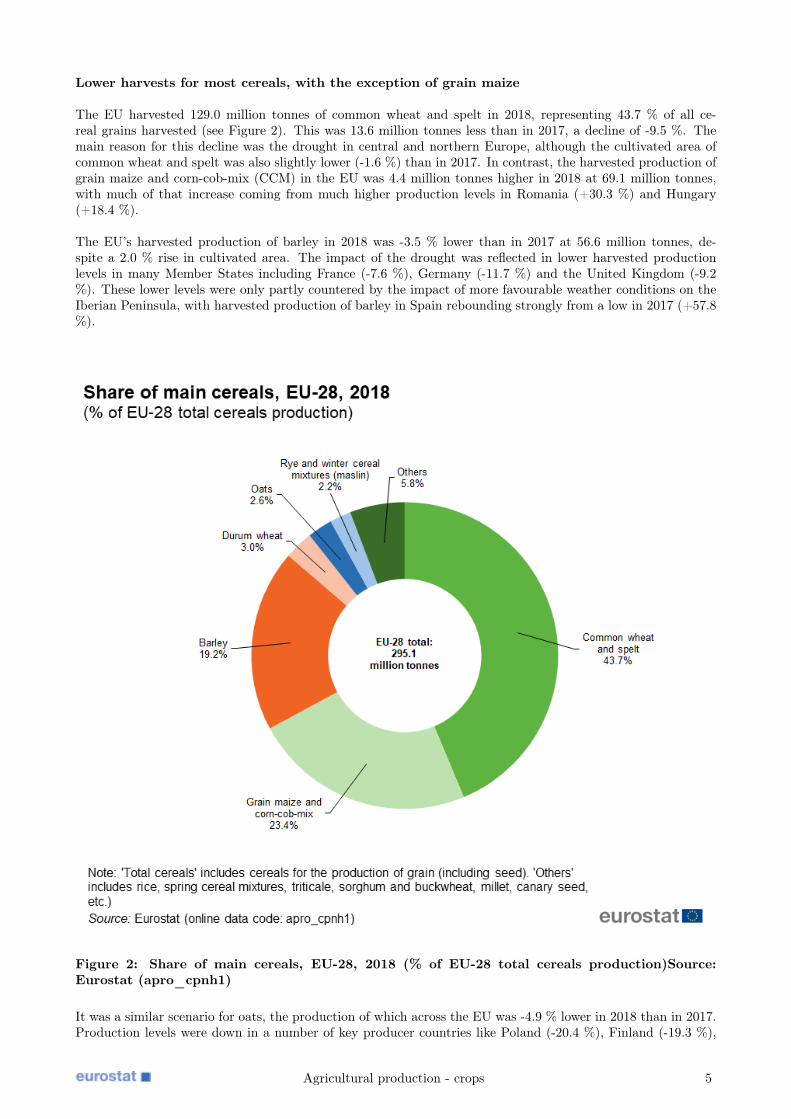
The EU harvested 129.0 million tonnes of common wheat and spelt in 2018, representing 43.7 % of all ce-real grains harvested (see Figure 2). This was 13.6 million tonnes less than in 2017, a decline of -9.5 %. Themain reason for this decline was the drought in central and northern Europe, although the cultivated area ofcommon wheat and spelt was also slightly lower (-1.6 %) than in 2017. In contrast, the harvested production ofgrain maize and corn-cob-mix (CCM) in the EU was 4.4 million tonnes higher in 2018 at 69.1 million tonnes,with much of that increase coming from much higher production levels in Romania (+30.3 %) and Hungary(+18.4 %).
The EU’s harvested production of barley in 2018 was -3.5 % lower than in 2017 at 56.6 million tonnes, de-spite a 2.0 % rise in cultivated area. The impact of the drought was reflected in lower harvested productionlevels in many Member States including France (-7.6 %), Germany (-11.7 %) and the United Kingdom (-9.2%). These lower levels were only partly countered by the impact of more favourable weather conditions on theIberian Peninsula, with harvested production of barley in Spain rebounding strongly from a low in 2017 (+57.8%).
Figure 2: Share of main cereals, EU-28, 2018 (% of EU-28 total cereals production)Source:Eurostat (apro_cpnh1)
It was a similar scenario for oats, the production of which across the EU was -4.9 % lower in 2018 than in 2017.Production levels were down in a number of key producer countries like Poland (-20.4 %), Finland (-19.3 %),
Agricultural production - crops 5
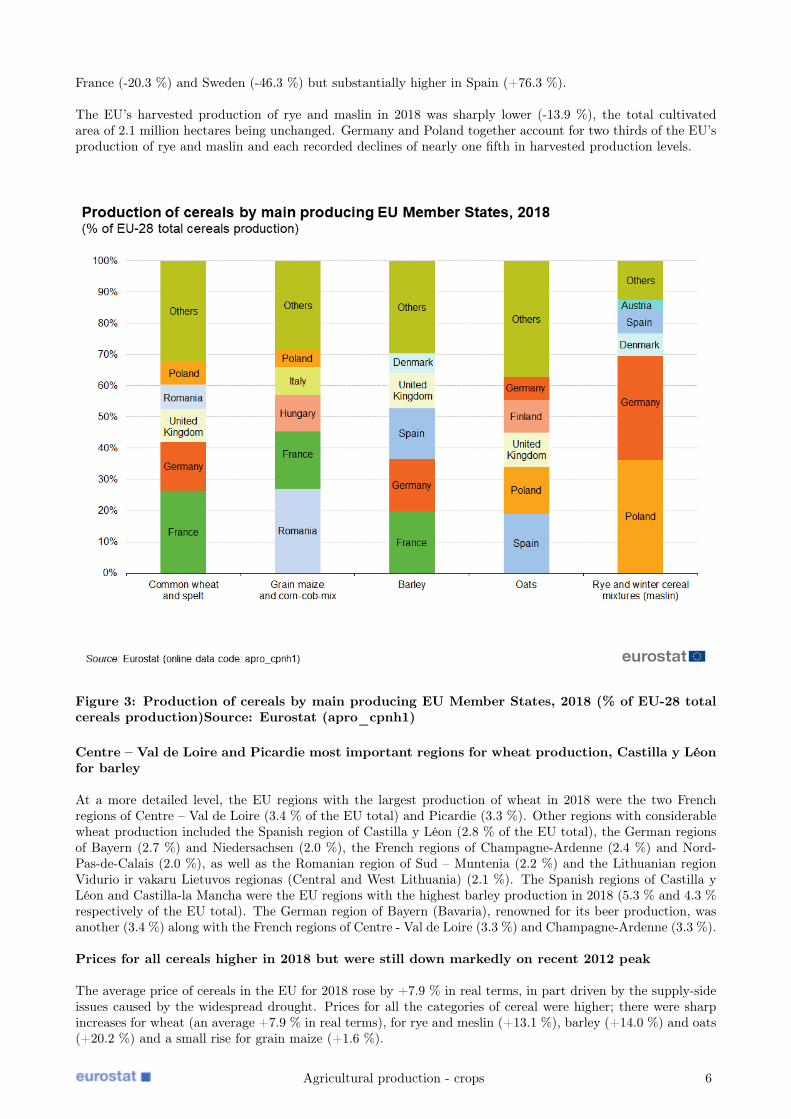
France (-20.3 %) and Sweden (-46.3 %) but substantially higher in Spain (+76.3 %).
The EU’s harvested production of rye and maslin in 2018 was sharply lower (-13.9 %), the total cultivatedarea of 2.1 million hectares being unchanged. Germany and Poland together account for two thirds of the EU’sproduction of rye and maslin and each recorded declines of nearly one fifth in harvested production levels.
Figure 3: Production of cereals by main producing EU Member States, 2018 (% of EU-28 totalcereals production)Source: Eurostat (apro_cpnh1)
Centre – Val de Loire and Picardie most important regions for wheat production, Castilla y Léonfor barley
At a more detailed level, the EU regions with the largest production of wheat in 2018 were the two Frenchregions of Centre – Val de Loire (3.4 % of the EU total) and Picardie (3.3 %). Other regions with considerablewheat production included the Spanish region of Castilla y Léon (2.8 % of the EU total), the German regionsof Bayern (2.7 %) and Niedersachsen (2.0 %), the French regions of Champagne-Ardenne (2.4 %) and Nord-Pas-de-Calais (2.0 %), as well as the Romanian region of Sud – Muntenia (2.2 %) and the Lithuanian regionVidurio ir vakaru Lietuvos regionas (Central and West Lithuania) (2.1 %). The Spanish regions of Castilla yLéon and Castilla-la Mancha were the EU regions with the highest barley production in 2018 (5.3 % and 4.3 %respectively of the EU total). The German region of Bayern (Bavaria), renowned for its beer production, wasanother (3.4 %) along with the French regions of Centre - Val de Loire (3.3 %) and Champagne-Ardenne (3.3 %).
Prices for all cereals higher in 2018 but were still down markedly on recent 2012 peak
The average price of cereals in the EU for 2018 rose by +7.9 % in real terms, in part driven by the supply-sideissues caused by the widespread drought. Prices for all the categories of cereal were higher; there were sharpincreases for wheat (an average +7.9 % in real terms), for rye and meslin (+13.1 %), barley (+14.0 %) and oats(+20.2 %) and a small rise for grain maize (+1.6 %).
Agricultural production - crops 6
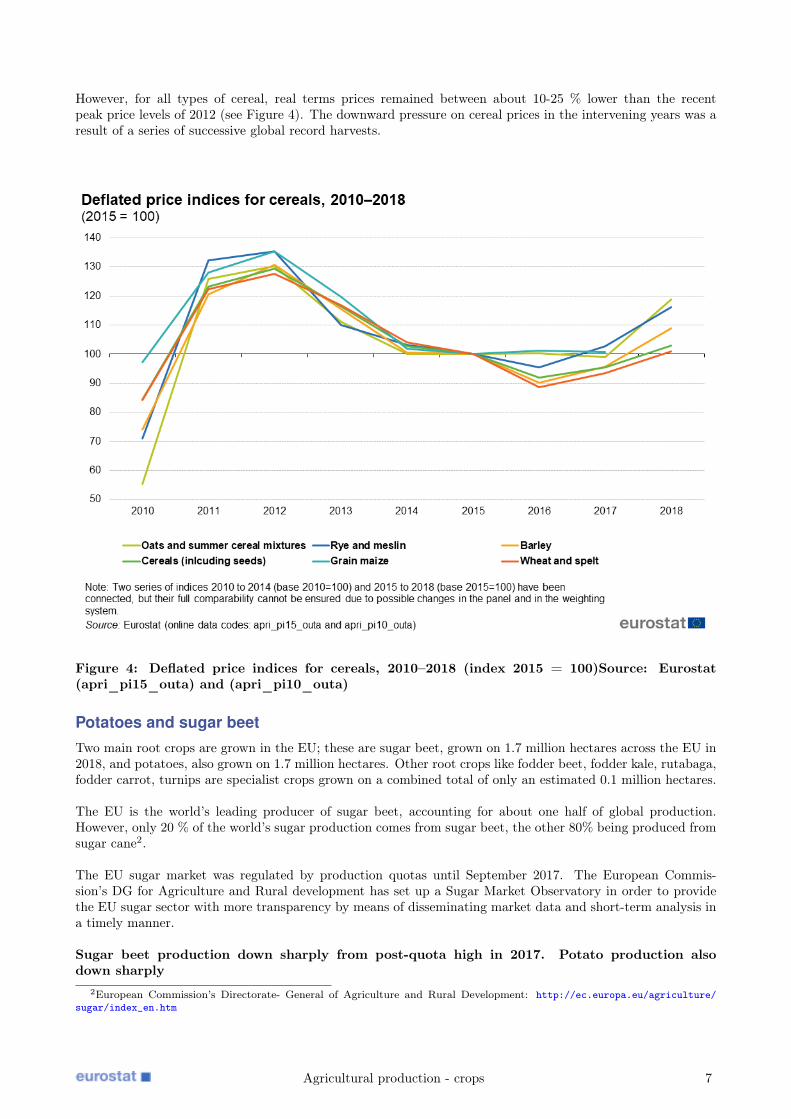
However, for all types of cereal, real terms prices remained between about 10-25 % lower than the recentpeak price levels of 2012 (see Figure 4). The downward pressure on cereal prices in the intervening years was aresult of a series of successive global record harvests.
Figure 4: Deflated price indices for cereals, 2010–2018 (index 2015 = 100)Source: Eurostat(apri_pi15_outa) and (apri_pi10_outa)
Potatoes and sugar beetTwo main root crops are grown in the EU; these are sugar beet, grown on 1.7 million hectares across the EU in2018, and potatoes, also grown on 1.7 million hectares. Other root crops like fodder beet, fodder kale, rutabaga,fodder carrot, turnips are specialist crops grown on a combined total of only an estimated 0.1 million hectares.
The EU is the world’s leading producer of sugar beet, accounting for about one half of global production.However, only 20 % of the world’s sugar production comes from sugar beet, the other 80% being produced fromsugar cane2.
The EU sugar market was regulated by production quotas until September 2017. The European Commis-sion’s DG for Agriculture and Rural development has set up a Sugar Market Observatory in order to providethe EU sugar sector with more transparency by means of disseminating market data and short-term analysis ina timely manner.
Sugar beet production down sharply from post-quota high in 2017. Potato production alsodown sharply
2European Commission’s Directorate- General of Agriculture and Rural Development: http://ec.europa.eu/agriculture/sugar/index_en.htm
Agricultural production - crops 7
Following the decision to end production quotas, the EU sugar sector - supported by the CAP - underwenta series of deep reforms to prepare it more effectively for the new challenges and opportunities this would bring.In 2017, EU farmers responded by sowing more sugar beet (the cultivated area being 17.2 % higher than in2016). One year on, the area sown was slightly lower (-1.2 %). Droughts conditions in 2018, however, reducedyields considerably and the harvested production of sugar beet for the EU-28 fell sharply (-16.5 %).
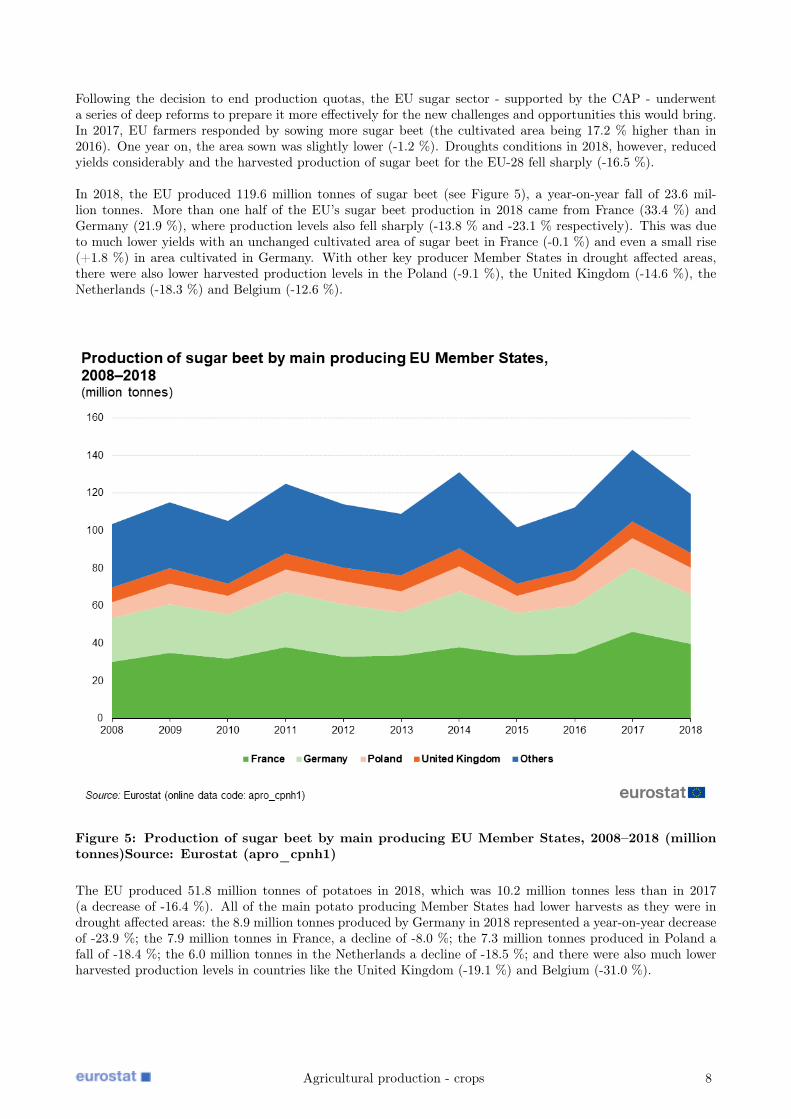
In 2018, the EU produced 119.6 million tonnes of sugar beet (see Figure 5), a year-on-year fall of 23.6 mil-lion tonnes. More than one half of the EU’s sugar beet production in 2018 came from France (33.4 %) andGermany (21.9 %), where production levels also fell sharply (-13.8 % and -23.1 % respectively). This was dueto much lower yields with an unchanged cultivated area of sugar beet in France (-0.1 %) and even a small rise(+1.8 %) in area cultivated in Germany. With other key producer Member States in drought affected areas,there were also lower harvested production levels in the Poland (-9.1 %), the United Kingdom (-14.6 %), theNetherlands (-18.3 %) and Belgium (-12.6 %).
Figure 5: Production of sugar beet by main producing EU Member States, 2008–2018 (milliontonnes)Source: Eurostat (apro_cpnh1)
The EU produced 51.8 million tonnes of potatoes in 2018, which was 10.2 million tonnes less than in 2017(a decrease of -16.4 %). All of the main potato producing Member States had lower harvests as they were indrought affected areas: the 8.9 million tonnes produced by Germany in 2018 represented a year-on-year decreaseof -23.9 %; the 7.9 million tonnes in France, a decline of -8.0 %; the 7.3 million tonnes produced in Poland afall of -18.4 %; the 6.0 million tonnes in the Netherlands a decline of -18.5 %; and there were also much lowerharvested production levels in countries like the United Kingdom (-19.1 %) and Belgium (-31.0 %).
Agricultural production - crops 8
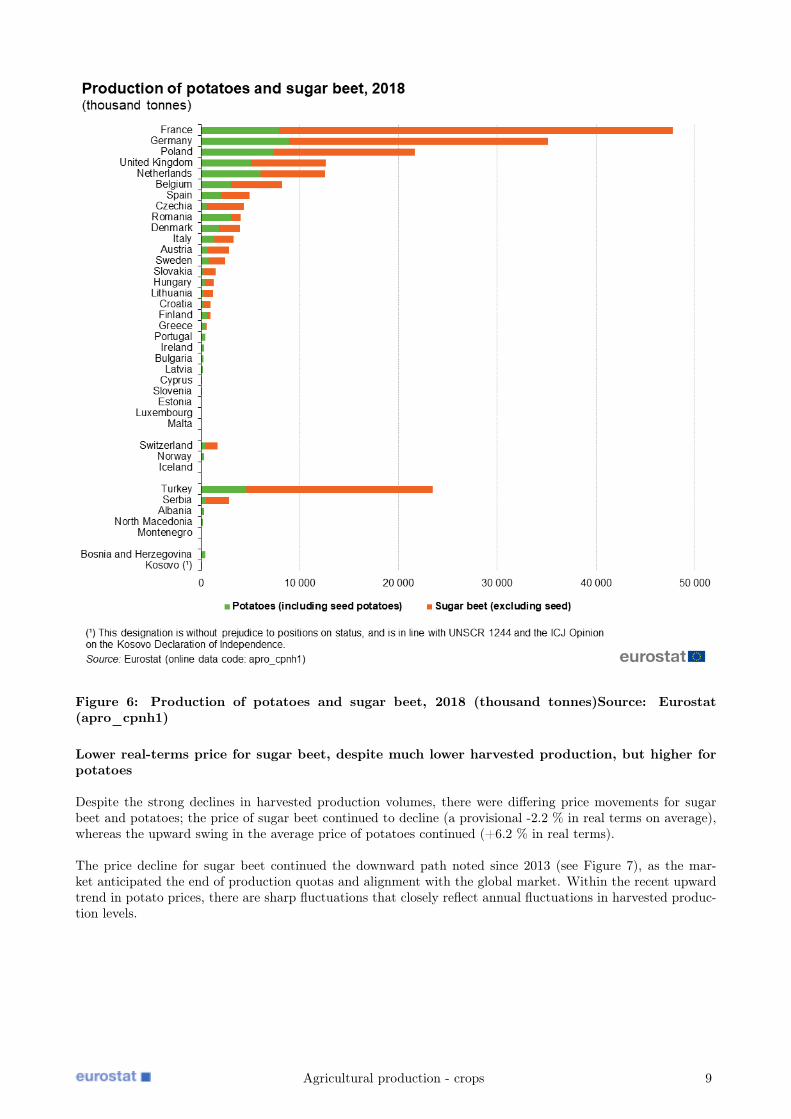
Figure 6: Production of potatoes and sugar beet, 2018 (thousand tonnes)Source: Eurostat(apro_cpnh1)
Lower real-terms price for sugar beet, despite much lower harvested production, but higher forpotatoes
Despite the strong declines in harvested production volumes, there were differing price movements for sugarbeet and potatoes; the price of sugar beet continued to decline (a provisional -2.2 % in real terms on average),whereas the upward swing in the average price of potatoes continued (+6.2 % in real terms).
The price decline for sugar beet continued the downward path noted since 2013 (see Figure 7), as the mar-ket anticipated the end of production quotas and alignment with the global market. Within the recent upwardtrend in potato prices, there are sharp fluctuations that closely reflect annual fluctuations in harvested produc-tion levels.
Agricultural production - crops 9
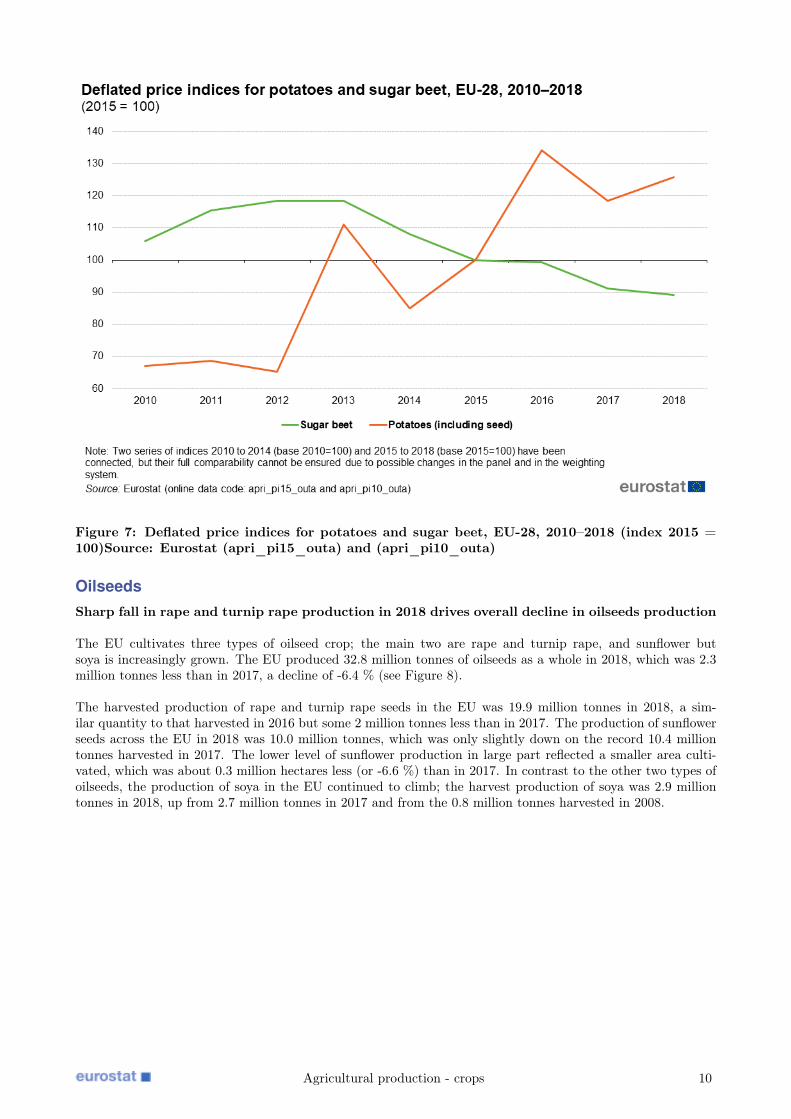
Figure 7: Deflated price indices for potatoes and sugar beet, EU-28, 2010–2018 (index 2015 =100)Source: Eurostat (apri_pi15_outa) and (apri_pi10_outa)
OilseedsSharp fall in rape and turnip rape production in 2018 drives overall decline in oilseeds production
The EU cultivates three types of oilseed crop; the main two are rape and turnip rape, and sunflower butsoya is increasingly grown. The EU produced 32.8 million tonnes of oilseeds as a whole in 2018, which was 2.3million tonnes less than in 2017, a decline of -6.4 % (see Figure 8).
The harvested production of rape and turnip rape seeds in the EU was 19.9 million tonnes in 2018, a sim-ilar quantity to that harvested in 2016 but some 2 million tonnes less than in 2017. The production of sunflowerseeds across the EU in 2018 was 10.0 million tonnes, which was only slightly down on the record 10.4 milliontonnes harvested in 2017. The lower level of sunflower production in large part reflected a smaller area culti-vated, which was about 0.3 million hectares less (or -6.6 %) than in 2017. In contrast to the other two types ofoilseeds, the production of soya in the EU continued to climb; the harvest production of soya was 2.9 milliontonnes in 2018, up from 2.7 million tonnes in 2017 and from the 0.8 million tonnes harvested in 2008.
Agricultural production - crops 10
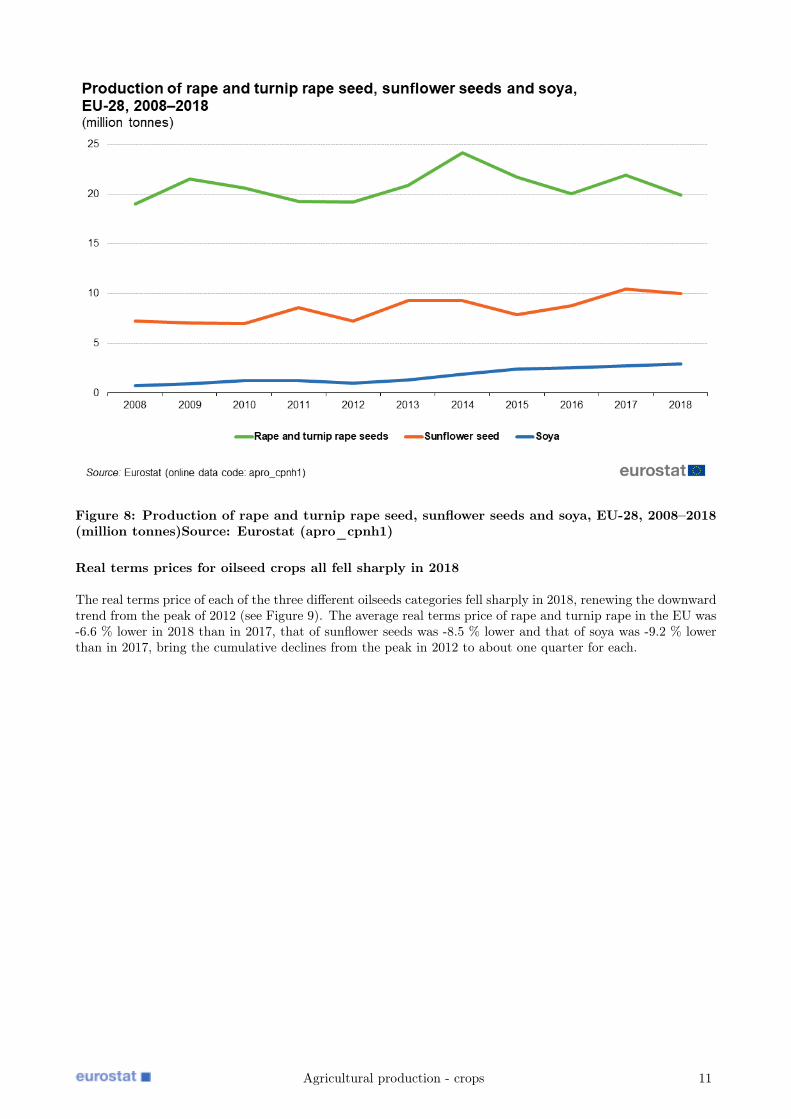
Figure 8: Production of rape and turnip rape seed, sunflower seeds and soya, EU-28, 2008–2018(million tonnes)Source: Eurostat (apro_cpnh1)
Real terms prices for oilseed crops all fell sharply in 2018
The real terms price of each of the three different oilseeds categories fell sharply in 2018, renewing the downwardtrend from the peak of 2012 (see Figure 9). The average real terms price of rape and turnip rape in the EU was-6.6 % lower in 2018 than in 2017, that of sunflower seeds was -8.5 % lower and that of soya was -9.2 % lowerthan in 2017, bring the cumulative declines from the peak in 2012 to about one quarter for each.
Agricultural production - crops 11
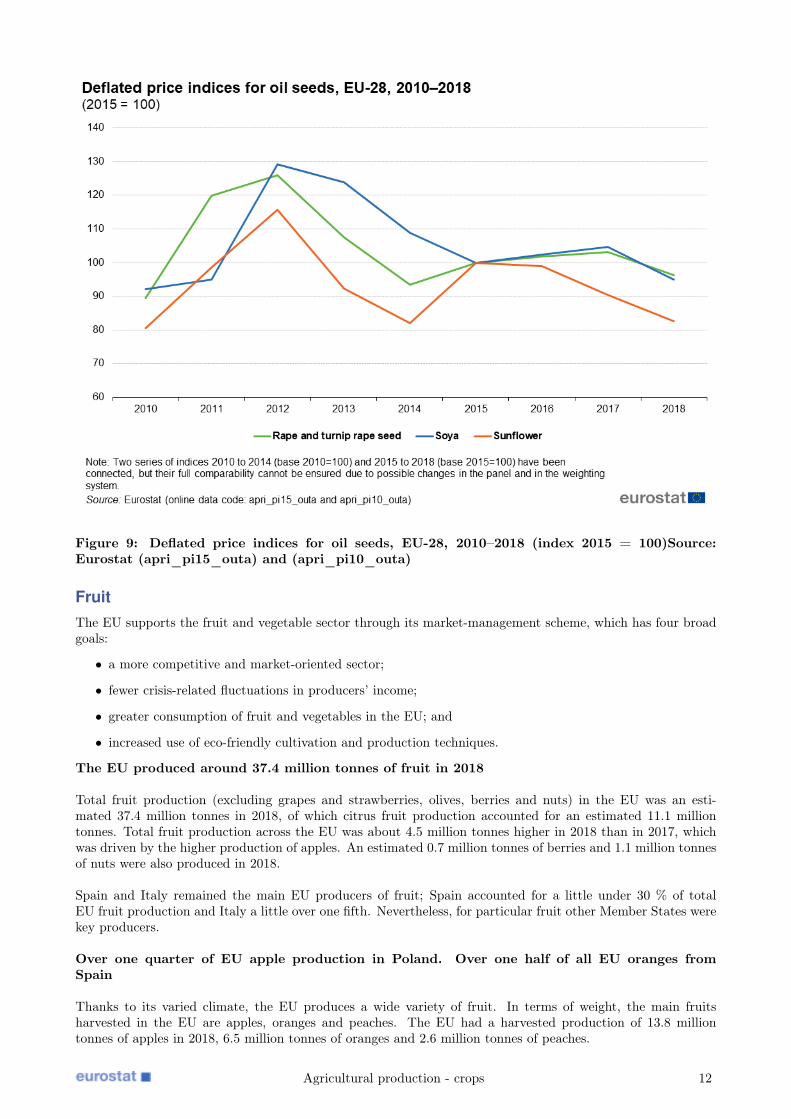
Figure 9: Deflated price indices for oil seeds, EU-28, 2010–2018 (index 2015 = 100)Source:Eurostat (apri_pi15_outa) and (apri_pi10_outa)
FruitThe EU supports the fruit and vegetable sector through its market-management scheme, which has four broadgoals:
• a more competitive and market-oriented sector;
• fewer crisis-related fluctuations in producers’ income;
• greater consumption of fruit and vegetables in the EU; and
• increased use of eco-friendly cultivation and production techniques.
The EU produced around 37.4 million tonnes of fruit in 2018
Total fruit production (excluding grapes and strawberries, olives, berries and nuts) in the EU was an esti-mated 37.4 million tonnes in 2018, of which citrus fruit production accounted for an estimated 11.1 milliontonnes. Total fruit production across the EU was about 4.5 million tonnes higher in 2018 than in 2017, whichwas driven by the higher production of apples. An estimated 0.7 million tonnes of berries and 1.1 million tonnesof nuts were also produced in 2018.
Spain and Italy remained the main EU producers of fruit; Spain accounted for a little under 30 % of totalEU fruit production and Italy a little over one fifth. Nevertheless, for particular fruit other Member States werekey producers.
Over one quarter of EU apple production in Poland. Over one half of all EU oranges fromSpain
Thanks to its varied climate, the EU produces a wide variety of fruit. In terms of weight, the main fruitsharvested in the EU are apples, oranges and peaches. The EU had a harvested production of 13.8 milliontonnes of apples in 2018, 6.5 million tonnes of oranges and 2.6 million tonnes of peaches.
Agricultural production - crops 12
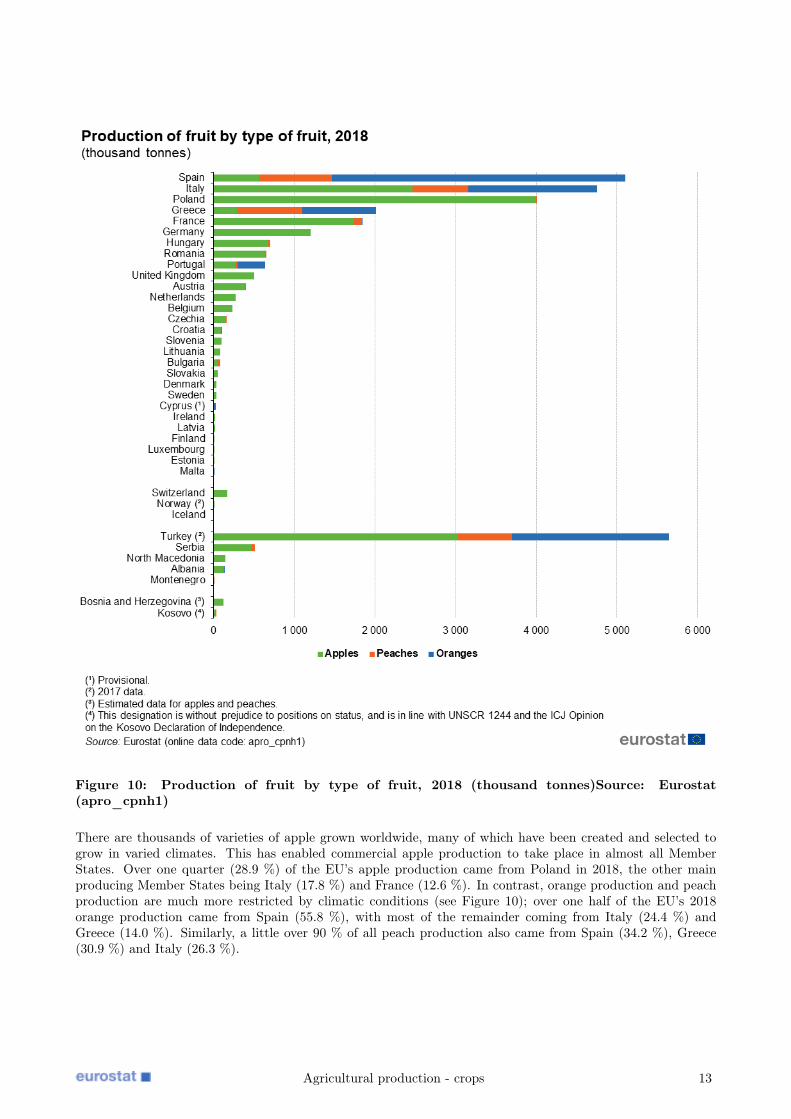
Figure 10: Production of fruit by type of fruit, 2018 (thousand tonnes)Source: Eurostat(apro_cpnh1)
There are thousands of varieties of apple grown worldwide, many of which have been created and selected togrow in varied climates. This has enabled commercial apple production to take place in almost all MemberStates. Over one quarter (28.9 %) of the EU’s apple production came from Poland in 2018, the other mainproducing Member States being Italy (17.8 %) and France (12.6 %). In contrast, orange production and peachproduction are much more restricted by climatic conditions (see Figure 10); over one half of the EU’s 2018orange production came from Spain (55.8 %), with most of the remainder coming from Italy (24.4 %) andGreece (14.0 %). Similarly, a little over 90 % of all peach production also came from Spain (34.2 %), Greece(30.9 %) and Italy (26.3 %).
Agricultural production - crops 13
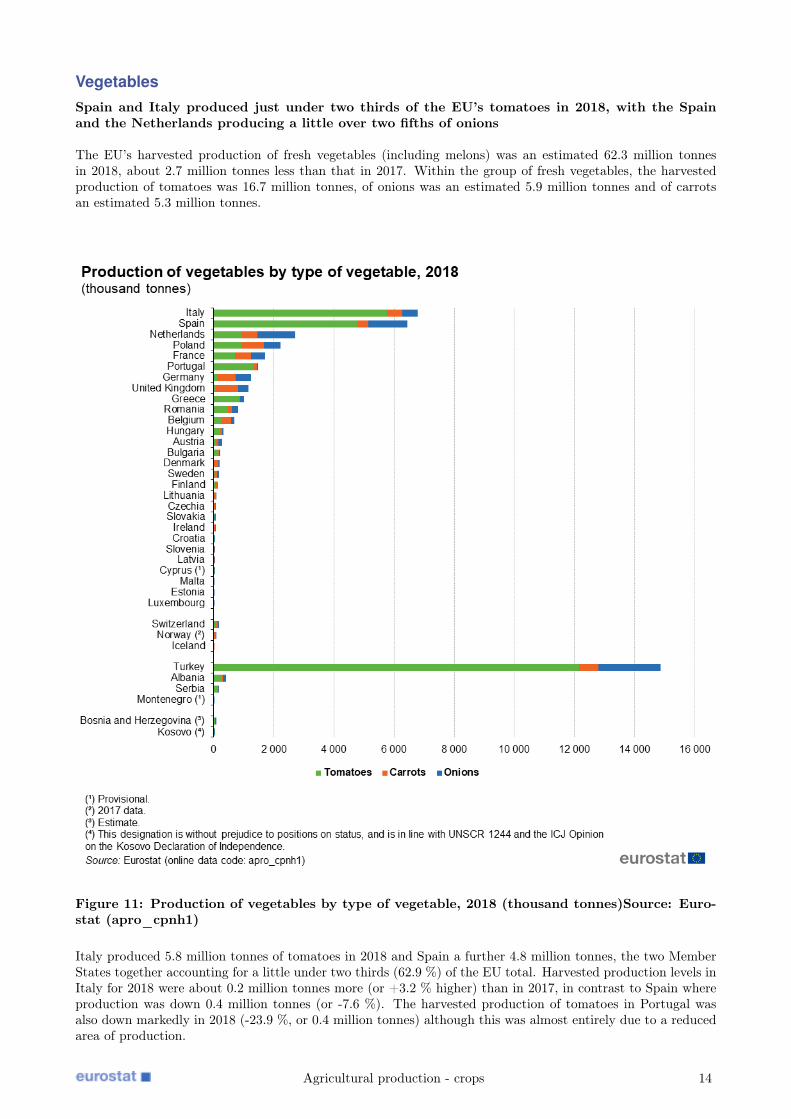
VegetablesSpain and Italy produced just under two thirds of the EU’s tomatoes in 2018, with the Spainand the Netherlands producing a little over two fifths of onions
The EU’s harvested production of fresh vegetables (including melons) was an estimated 62.3 million tonnesin 2018, about 2.7 million tonnes less than that in 2017. Within the group of fresh vegetables, the harvestedproduction of tomatoes was 16.7 million tonnes, of onions was an estimated 5.9 million tonnes and of carrotsan estimated 5.3 million tonnes.
Figure 11: Production of vegetables by type of vegetable, 2018 (thousand tonnes)Source: Euro-stat (apro_cpnh1)
Italy produced 5.8 million tonnes of tomatoes in 2018 and Spain a further 4.8 million tonnes, the two MemberStates together accounting for a little under two thirds (62.9 %) of the EU total. Harvested production levels inItaly for 2018 were about 0.2 million tonnes more (or +3.2 % higher) than in 2017, in contrast to Spain whereproduction was down 0.4 million tonnes (or -7.6 %). The harvested production of tomatoes in Portugal wasalso down markedly in 2018 (-23.9 %, or 0.4 million tonnes) although this was almost entirely due to a reducedarea of production.
Agricultural production - crops 14
The main carrot producing Member States include the United Kingdom and Poland, both with a harvestedproduction of 0.7 million tonnes in 2018 (a combined 27.8 % of the EU total), Germany (11.8 %) the Netherlands(10.1 %) and France (10.1 %). Spain and the Netherlands are the EU’s main onion producing Member States,together accounting for 43.2 % of EU-28 output in 2018.
GrapesThe EU is big player on the world’s wine market; between 2014 and 2018 it accounted for 65 % of globalproduction, 60 % of consumption and 70 % of exports, with 45 % of the wine-growing areas in the world3
Harvested production in the main grape-producing countries was up sharply in 2018
The total production of grapes in the EU was an estimated 25.7 million tonnes in 2018, one fifth higher(20.3 %) than the harvested production of 21.3 million tonnes recorded in 2017. There were markedly higher2018 grape harvests in Italy (+16.2 %), Spain (+30.4 %), France (+25.3 %), Germany (+38.4 %) and Romania(+5.3 %) as well as a number of smaller grape-producing Member States.
3For further information, see the overview of the wine market from the European Commission’s Directorate- General ofAgriculture and Rural Development.
Agricultural production - crops 15
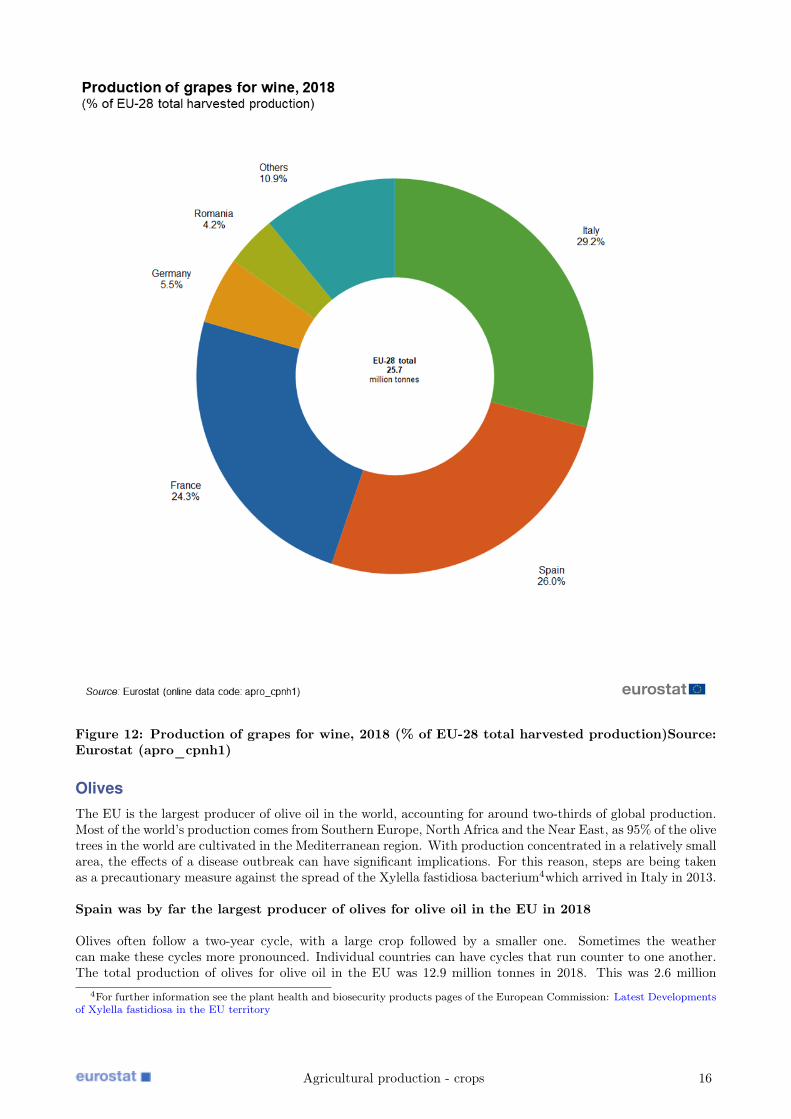
Figure 12: Production of grapes for wine, 2018 (% of EU-28 total harvested production)Source:Eurostat (apro_cpnh1)
OlivesThe EU is the largest producer of olive oil in the world, accounting for around two-thirds of global production.Most of the world’s production comes from Southern Europe, North Africa and the Near East, as 95% of the olivetrees in the world are cultivated in the Mediterranean region. With production concentrated in a relatively smallarea, the effects of a disease outbreak can have significant implications. For this reason, steps are being takenas a precautionary measure against the spread of the Xylella fastidiosa bacterium4which arrived in Italy in 2013.
Spain was by far the largest producer of olives for olive oil in the EU in 2018
Olives often follow a two-year cycle, with a large crop followed by a smaller one. Sometimes the weathercan make these cycles more pronounced. Individual countries can have cycles that run counter to one another.The total production of olives for olive oil in the EU was 12.9 million tonnes in 2018. This was 2.6 million
4For further information see the plant health and biosecurity products pages of the European Commission: Latest Developmentsof Xylella fastidiosa in the EU territory
Agricultural production - crops 16
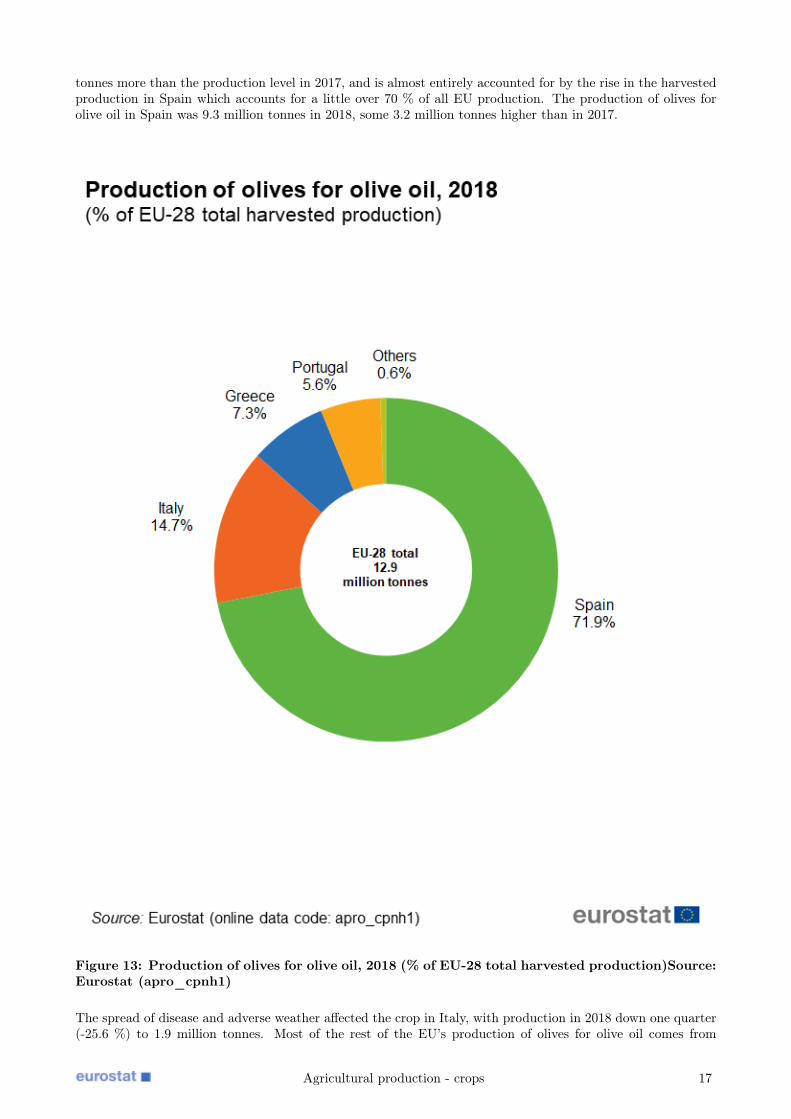
tonnes more than the production level in 2017, and is almost entirely accounted for by the rise in the harvestedproduction in Spain which accounts for a little over 70 % of all EU production. The production of olives forolive oil in Spain was 9.3 million tonnes in 2018, some 3.2 million tonnes higher than in 2017.
Figure 13: Production of olives for olive oil, 2018 (% of EU-28 total harvested production)Source:Eurostat (apro_cpnh1)
The spread of disease and adverse weather affected the crop in Italy, with production in 2018 down one quarter(-25.6 %) to 1.9 million tonnes. Most of the rest of the EU’s production of olives for olive oil comes from
Agricultural production - crops 17

Portugal and Greece (see Figure 13). The biennial production cycle in Portugal is particularly pronounced;there was a notable fall (-15.5 %) in production to 0.7 million tonnes in 2018 from the relative high in 2017. Incontrast, there was a rebound (+26.2%) in the harvested production in Greece to 0.9 million tonnes, buckingthe pronounced downward trend noted since a harvest of 1.8 million tonnes was produced in 2012.
Source data for tables and graphs• crops: tables and figures
Data sourcesCrops statistics Statistics on crop products are collected under Regulation (EC) No 543/2009 and obtainedby sample surveys, supplemented by administrative data and estimates based on expert observations. Thesources vary from one EU Member State to another because of national conditions and statistical practices.National Statistical Institutes or Ministries of Agriculture are responsible for data collection in accordance withEU Regulations. The finalised data sent to Eurostat are as harmonised as possible. Eurostat is responsible forestablishing EU aggregates.
The statistics that are collected on agricultural products relate to more than 100 individual crop products.Information is collected for the area under cultivation (expressed in 1 000 hectares), the quantity harvested(expressed in 1 000 tonnes) and the yield (expressed in tonnes per hectare). For some products, data at anational level may be supplemented by regional statistics at NUTS 1 or 2 level.
Agricultural price statistics EU agricultural price statistics (APS) are based on voluntary agreements be-tween Eurostat and the Member States.
The National Statistical Institutes or Ministries of Agriculture are responsible for collecting absolute pricesand calculating corresponding average prices for their country, as well as for calculating price indices and peri-odically updating the weights.
Price indices are reported quarterly and annually. Absolute prices are reported annually. The agriculturalprices expressed in national currency are converted into EURO by Eurostat using the fixed exchange rates orfinancial market exchange rates, in order to allow comparisons between the Member States. Eurostat is respon-sible for calculating indices for the EU.
ContextThere is a diverse range of natural environments, climates and farming practices across the European Union(EU), reflected in the broad array of food and drink products that are made available for human consumptionand animal feed, as well as a range of inputs for non-food processes. Indeed, agricultural products form a majorpart of the cultural identity of the EU’s people and its regions.
Statistics on agricultural products may be used to analyse developments within agricultural markets in or-der to help distinguish between cycles and changing production patterns; they can also be used to study howmarkets respond to policy actions. Agricultural product data also provide supply-side information, furtheringunderstanding as regards price developments which are of particular interest to agricultural commodity tradersand policy analysts.
Other articles• Agri-environmental indicator - cropping patterns
Agricultural production - crops 18
• Agricultural production - livestock and meat
• Agricultural production - orchards
• The fruit and vegetable sector in the EU - a statistical overview
Tables• Agriculture (t_agri) , see:
Agricultural production (t_apro)
Crops products (t_apro_cp)
Database• Agriculture (agri) , see:
Agricultural production (apro)
Crops products (apro_cp)
Crop statistics (area, production and yield) (apro_acs)Crop statistics (from 2000 onwards) (apro_acs_a)
Dedicated section• Agriculture
Publications• Agriculture, forestry and fishery statistics — 2019 edition (Statistical book)
• Food: from farm to fork statistics — 2011 edition (Pocketbook)
Methodology• Agricultural production data: methodological notes
• Crop production (ESMS metadata file — apro_cp_esms)
• Crops products: supply balance sheets (ESMS metadata file — apro_cpb_esms)
Legislation• Regulation (EC) No 543/2009 of 18 June 2009 concerning crop statistics
• Summaries of EU Legislation: Agricultural production — crop statistics
Visualisations• Eurostat Statistical Atlas (Chapter 11: Agriculture)
• Regional Statistics Illustrated - Agriculture
• Statistics Illustrated - Agriculture
External links• DG Agriculture and rural development
Agricultural production - crops 19