Embed Size (px)
Citation preview

4Agricultural policies in developing countriesExchange rates, prices, and taxation
Increased production of food and cash crops andhigher rural incomes have been important objec-tives for governments of developing countries. Inpursuing these objectives, governments, with thesupport of foreign assistance, have made substan-tial public investments to improve the physical in-frastructure in rural areas, expand irrigation andflood control, and organize research and extensionin agriculture. Resources have also been directedto programs which aim to raise productivitythrough better farm management and improvedrural health and education services. In many cases,these efforts have succeeded in raising food pro-duction, as shown in Chapter 1. The spread of theGreen Revolution in rice and wheat is testimony tothe effectiveness of public expenditures in researchand irrigation.
The general economic policies that developingcountries have pursued have, however, limited thegrowth of agricultural production and hamperedefforts to reduce rural poverty. In many cases,sector-specific pricing and tax policies have alsoresulted in substantial discrimination against agri-culture. In addition, government interventions atall stages of production, consumption, and mar-keting of agricultural products and inputs, thoughundertaken to improve the efficiency of markets,have frequently resulted in greater inefficienciesand lower output and incomes. As a consequence,farm incomes in many developing countries arestagnating, and little progress is being made inovercoming the problems of poverty.
Paradoxically, many countries which have beenstressing the importance of agricultural develop-ment have established a complex set of policiesthat is strongly biased against agriculture. Thus,some developing countries impose taxes on agri-cultural exports while lamenting the adverse im-
Part II Trade and Pricing Policiesin World Agriculture
pact of declining commodity prices on the farmsector. Some pay their producers half the worldprice for grains (or even less), and then spendscarce foreign exchange to import food. Manyhave raised producer prices at various stages, buthave followed macroeconomic and exchange ratepolicies that have left real producer prices un-changed or lower than before. Many have set upcomplex systems of producer taxation, and thenhave set up equally complex and frequently inef-fective systems of subsidies for inputs to offset thattaxation. Many subsidize consumers to help thepoor, but end up reducing the incomes of farmerswho are much poorer than many of the urban con-sumers who actually benefit from the subsidies.Most developing countries pronounce self-sufficiency as an important objective, but followpolicies that tax farmers, subsidize consumers, andincrease dependence upon imported food.
The discrimination against agriculture derivesfrom several factors. First of all, it is very much anintegral part of development strategies that pro-mote domestic industries behind high trade barri-ers. Such strategies are intended to accelerate theshift of resources out of agriculture by lowering itsprofitability compared with that of industry: inother words, by turning the internal terms of tradebetween agriculture and industry so that agricul-ture is worse off than it would be if domestic priceswere aligned with relative world prices. Agricul-tural exports suffer as a result; so do agriculturalproducts that compete with imports. This is notjust because their domestic prices become lowerrelative to the prices of protected industrial prod-ucts, but also because the costs of the industrialinputs the farmers use increase. Moreover, theprotectionist policies result in an appreciation ofthe real exchange rate. This means that traded ag-
61

ricultural goods become less profitable than non-traded goods, with further adverse consequenceson developing countries' agricultural exports.
During the past fifteen years, this traditional biasagainst agriculture has often been exacerbated bythe way countries have responded to changingeconomic circumstances. Some countries havefailed to adjust exchange rates sufficiently in pe-riods of rapid inflation, thus allowing their ex-change rates to become overvalued, and have re-lied instead on excessive foreign borrowing and onad hoc exchange and trade controls. Such ad hocmeasures usually come on top of more permanenttrade restrictions and make the discriminationagainst agriculture worse.
Sectoral policies that keep the domestic farmprices of agricultural products below their worldprices at country borders (adjusted for internaltransport and distribution margins) have also con-tributed significantly to the bias against agricul-ture. It makes little difference from this point ofview whether farmers receive low prices becauseof taxes on their outputs or because of excessivemargins charged by parastatal marketing agencies.The effects of low prices for farm output are notgenerally offset by the subsidies that many govern-ments provide on credit and modern farm inputs.Typically, these subsidies lead to rationing andshortages and benefit larger and better-off farmersmore than smaller and poorer farmers.
This chapter discusses the extent to whicheconomy-wide trade and exchange rate policies, aswell as sectoral tax and price policies, discriminateagainst agriculture in developing countries and ex-amines the effects of this discrimination on agricul-tural output and incomes, It also discusses howcostly agricultural taxation can be in practice andpoints to several alternative ways of moderatingthe costs.
The next chapter reviews the rationale for gov-ernment programs for price stabilization, con-sumer subsidies, and producer input subsidiesall three of which are used to promote a variety ofdistributional and income objectives, It is shownthat these programs are far less effective than theyare thought to be in promoting either a more effi-cient allocation of resources or a more even distri-bution of income.
Economy-wide policies and agriculture
Trade, exchange rate, fiscal, and monetary policieshave a significant impact on agriculture in develop-ing countries, and their effects often overshadow
62
those of sector-specific policies. These policies areleading determinants of the movement of capitaland labor between agriculture and the rest of theeconomy, the growth and composition of agricul-tural output, and the volume and composition oftrade in agricultural products. They are often theprincipal sources of bias against agriculture, and assuch they inhibit the growth of real incomes inrural areas, where the concentration of poverty isgreatest.
Sources of bias
Many developing countries have continued to pro-mote industrialization through generous protec-tion to industry. This strategy increases the pricesof industrial import substitutes relative to theprices of agricultural import substitutes and ex-ports. It also raises the prices of protected farminputs. By lowering output prices relative to indus-try and by increasing the cost of modern inputs,inward-looking strategies implicitly tax agricul-ture. Table 4.1 gives some indication of how thedifferential protection given to industry has low-ered the relative profitability of agriculture in many
Table 4.1 Protection of agriculture compared withmanufacturing in selected developing countries
Calculated as (1+EPR,)/(l+EPR,j, where EPR, and EPR,, are theeffective rates of protection for agriculture and the manufacturingsector, respectively. A ratio of 1.00 indicates that effective protectionis equal in both sectors; a ratio greater than 1.00 means that protec-tion is in favor of agriculture.
Refers to primary sector.
Countnj and period YearRelative
protection ratio'
In the 1960sMexico 1960 0.79Chile 1961 0.40Malaysia 1965 0.98Philippines 1%5 0.66Brazil 1966 0.46Korea 1968 1.18Argentina 1969 0.46Colombia 1969 0.40
In the 1970s and 1980sPhilippines 1974 0.76Colombia 1978 0.49BrazilE 1980 0.65Mexico 1980 0.88Nigeria 1980 0.35Egypt 1981 0.57Peru' 1981 0.68Turkey 1981 0.77Koreab 1982 1.36Ecuador 1983 0.65

countries. The ratios in the table show the extent towhich value added in agriculture has been pro-tected relative to value added in industry. With thesole exception of Korea, all countries in the samplediscriminated against agriculture, especially Nige-ria, Colombia, and Egypt.
But this is not the only way inward-looking strat-egies affect agriculture. There is another effect thatworks through the real exchange rate (the ratio ofthe prices of traded goods to the prices of non-traded goods). Industrial protection makes the realexchange rate lower than it would be otherwise.Thus, the production of import substitutes and ex-ports in agriculture suffers for two reasons: in-creased profitability of protected industrial outputsand increased profitability of nontraded goods. Re-sources move from the traded agriculture sector tothese other sectors, and as they do, rural realwages may rise; this increases the cost of farming,which is typically very labor-intensive in develop-ing countries.
Several studies have shown how policies thatprotect industry affect the prices of agriculturalproducts compared with the prices of protectedindustrial products and of nontraded goods. In thePhilippines, from 1950 to 1980, heavy protectionfor industrial consumer goods meant that prices ofagricultural exports were between 44 and 71 per-cent lower (depending on the category of imports)relative to the prices of protected traded goods andwere 33 to 35 percent lower relative to the prices ofnontradable goods. In Peru, a 10 percent increasein tariffs on nonagricultural importables was foundto decrease the prices of traded agricultural goodsby 10 percent relative to the prices of those import-ables and by 5.6 to 6.6 percent relative to the pricesof nontradables. Similar results have been ob-tained in countries as varied as Argentina, Chile,Colombia, Nigeria, and Zaire.
Policies on money supply and credit, public rev-enues and expenditures, foreign borrowing andinvestment, and exchange rate regimes have allbeen of critical importance during the 1970s and1980s. When expansionary monetary and fiscalpolicies have led to higher inflation at home thanabroad, governments have often failed to adjustexchange rates and have relied instead on increas-ing import protection by employing such devicesas quotas, exchange controls, and licensing. Insuch circumstances, the currency becomes over-valued and the bias against agriculture becomesstronger because the increased protection usuallyaccrues to industry. Typically, food imports are ex-cluded from restrictive measures in order to keep
urban food prices low: consequently, food importsare implicitly subsidized. Furthermore, in trying toreduce fiscal deficits, countries usually increasesectoral taxes on agricultural exports and curtailsubsidy programs for agricultural inputs. As aresult of both implicit and explicit taxation,agricultureand the low-income groups that de-pend on ittends to bear the brunt of the adjust-ment programs that ensue from destabilizing mac-roeconomic policies.
The impact on agriculture can be especially pro-nounced when import quotas are used, sincechanges in the domestic price of an imported com-modity are then determined not by supply, whichis fixed, but by the level of demand alone. Thus, byincreasing overall demand, an expansionary fiscalpolicy would raise the domestic prices of goodswhose imports are restricted. The net effect wouldbe to reduce relative prices for agriculture and in-crease discrimination against it.
Capital inflows from abroad and sharp increasesin the world prices of key exports also cause thereal exchange rate to appreciate. But this by itself isnot distortionary, although special sectoral mea-sures may be needed to offset the effects on agri-culture if the commodity boom is temporary and iffactor movements out of agriculture are difficult toreverse. Typically, however, countries react tocommodity booms by initiating expansionarymonetary and fiscal policies, which leads to infla-tion and a greater appreciation of the real exchangerate than would occur simply because of the favor-able change in the external terms of trade. The ef-fects of this reaction continue even after the boomends, because by then commitments to large in-vestment programs or to large recurrent costs havealready been made. This is what happened in Co-lombia (see Box 4.1).
SECTORAL POLICIES. Policies within the agricul-tural sectorsuch as trade duties, subsidies, andparastatal marginscan, of course, mitigate or ex-acerbate the implicit taxation caused by generaleconomic policies. What are the levels of trade du-ties and subsidies in agriculture? Is agriculture ac-tually taxed by sectoral policies, or is it subsidized?Figure 4.1 provides an overview of sectoral tradetaxes and subsidies in various developing coun-tries. These are measured as the difference be-tween farmgate prices and border prices at officialexchange rates, after adjustments for internaltransport and marketing margins. This procedureis employed because, apart from conventionaltrade duties and subsidies, the use of quotas and
63

64
Figure 4.1 Ratio of farmgate prices to border prices for selected commodities of developing countriesin the late 1970s and early 1980s
Ratio
gExports Import substitutes 0 Low-income economy 0 Middle-income economy
Note: Border prices are converted to domestic currency at official exchange rates.Source: Binswanger and Scandizzo 1983; FAO data.
large parastatal marketing margins can contributeto the sectoral taxes and subsidies that farmers ineffect face.
Export crops. Figure 4.1 indicates that manycountries tax export crops, sometimes at very highrates. In Togo, the farm price for coffee was a thirdof the border price. In Mali, cotton and groundnutfarmers received half the border prices, and inCameroon and Ghana cocoa producers receivedless than half.
The costs of high agricultural taxation are dis-cussed later in this chapter. The first questions to
ask are: How do governments tax agricultural out-put and exports, and why do they do it? Sometaxation of export crops involves conventional bor-der taxes or quotas, but frequently taxation is aresult of the pricing policies pursued by marketingagencies in the public sector. This is especially so inAfrica, where statutory monopolies, or marketingboards, have traditionally controlled export crops.Created in colonial times, marketing boards werealmost always required to use the bulk of theirfunds for the benefit of the farming community.But most of them became de facto taxation
2.5 Wheat Rice Groundnuts Maize Sugar Beef
2.0
El Korea
El Korea
1.5 Colombia
J Thailand
El Portugal
1 0
Sudan
Turkey ,O Yemen0 Tunisia
Côte d'Ivoire
ElArgentina
Colombia
Turkey Malawi
portugaiElEl Mexico
B 1Thailand
Sudan ElYugoslavia
Elo
0.5
EgyplEl
J Pakistan
BangladeshEl
ri I dia
ArgentinaEl Yugoslavia
U Brazil
Senegal.'hilippiner
Thailan] PakistanPortugal El Cameroor
Ghana
Côte dIvoireEl
ZambiaSudan
El MalawiSenegal0
Côte divoire Pakistan
PhilippineEgypt
YugoslaviaZambia
El Argentina
El Pakistan
India
Colombia
,4rgentinaBrazilj
0
TanzaniaJ Egypt
M I
Tanzania

Ratio
agenciesimportant public instruments for ex-tracting resources from export agriculture in sup-port of the postindependence drive to industrial-ize. High rates of export taxation, of the order of50-75 percent, have not been unusual.
Marketing boards are also common in other re-gions. For example, commodity boards exist bystatute for virtually all the major agricultural ex-port crops in Jamaica, including sugar, bananas,citrus, coconuts, coffee, cocoa, and spices. Whilethe boards were initially required only to assem-ble, package, and export these products, over the
years their activities have expanded to cover manyother functions, including price stabilization and,in some cases, processing. One study indicatedthat during the 1970s they in effect taxed producersat rates varying between 17 and 42 percent, de-pending on the commodity: the highest rates wereon bananas and coffee. Moreover, domestic priceswere usually at least as variable as export prices,and in some cases more so.
The primary reason for export taxes is, of course,to raise revenue for the use of either the marketingboards or the central government. But other rea-
65
2.5 Tea Cocoa Coffee Tobacco Rubber Cotton
2.0
1.5
1.0
Bangladesh
Malawi Malaysia
El Argentina
Thailand
Côte Turkey
0.5
0
jJ Sri Lanka Côte d'lvoire
J Tanzania
Côte d'Ivoire
Zambia
El Turkey
ThailandIndonesia
I. Sri Lanka
dixoire ElMexico
Cameroon BurkinaFaso
Yemen logo
o Sudan
El Egypt
0
India Ghana
Cameroon t2. Togo
CameroEl BrazilColombia
Togo Malawi lanzania
Mali

66
Box 4.1 Coffee prices and macroeconomic policies in Colombia
Colombian agriculture has a strong trade orientation,based in large measure on the role of coffee. Agricul-tural exports account for about two-thirds of total ex-ports, and the agricultural sector has generally been anet earner of foreign exchange. Fluctuations in coffeeprices pose special problems for macroeconomic man-agement because it is difficult to assess the duration ofprice increases and the degree of adjustment needed todeal with temporary changes in external factors.
Coffee prices rose sharply in the second half of the1970s, and this contributed to an appreciation of thereal exchange rate, which reduced the profitability ofnoncoffee exports compared with the profitability ofnontraded goods and services. A number of interre-lated factors supported this phenomenon:
The increased supply of foreign exchange gener-ated by the coffee boom, other things being equal, low-ered the equilibrium real exchange rate during theboom.
There was a spending effect. The coffee boom ledto higher disposable real incomes, which were spentpartly on noncoffee traded goods and partly on non-traded goods. Since the prices of noncoffee tradedgoods are determined mostly by their world prices andthe official exchange rate, they fell relative to the pricesof nontraded goods.
The policy reaction aggravated the problem. Do-mestic credit and inflation increased significantly. The
higher earnings from coffee increased foreign currencyreserves, which were allowed to increase domesticmoney supply and credit, and trade barriers restrictingimports were only partially relaxed. Thus, the real ex-change rate appreciated further.
After coffee prices fell in the early 1980s, the growthin aggregate demand was maintained through higherpublic expenditures and foreign borrowing, thus sus-taining the appreciation of the real exchange rate.From 1975 to 1984, domestic prices, measured in U.S.dollars at official exchange rates, rose by 100 percentabout twice the rate of external inflation. Growth innoncoffee exports and in noncoffee agricultural pro-duction fell in real terms in the first half of the 1980s.
As the balance of payments deteriorated in the early1980s, and as it became more difficult to borrowabroad, the role of timely macroeconomic adjustmentsbegan to receive attention. A comprehensive macroec-onomic policy package that addresses the issues of ex-change rate appreciations and fiscal and monetary ex-pansion was recently introduced to provide a sounderbasis for the development of the external sector.
Since the introduction of these policy improvements,another surge in coffee prices has emerged, strength-ening the country's balance of payments significantly.The challenge of sustaining monetary and price stabil-ity in the face of sharply changing coffee prices re-mains.
Sons have also been important in practice. Devel-oping countries have tended to impose exporttaxes to take advantage of the monopoly powerthey believe they have in world markets. Manydeveloping countries have also sought to encour-age agro-industries by taxing, or restricting byquota, the exports of the agricultural raw materialsthey use. Export taxes on cash crops have alsobeen used to encourage the production of domes-tic food crops in order to attain self-sufficiency. Aswill be discussed later, export taxation for thesepurposes has been very costly in terms of nationalincomes and agricultural performance.
Agricultural import substitutes. A few develop-ing countries have protected agricultural importsubstitutes to promote self-sufficiencyespeciallyin wheat and dairy and livestock products. In mostcases, however, domestic producers of import sub-stitutes are paid less than the import prices (ad-justed for internal marketing costs). In an attemptto keep urban food prices low, governments oftentry to procure food at prices that are lower than
those on world markets. Marketing agencies havebeen created for this purpose too, sometimes withstatutory monopoly powers to ensure that farmersdo not sell their products elsewhere. However, po-licing is difficult with food crops, and manyfarmers find more lucrative markets.
In Ethiopia, for example, a parastatal marketingagency controls about 30 percent of the total mar-ketable surplus and almost 100 percent of the inter-regional grain trade from two of the three maingrain-surplus areas. Its farmgate procurementprices have been far below the import parityprices; in 1985, for instance, the import parityprices (at the official exchange rate) for maize, sor-ghum, and wheat were respectively about 80 per-cent, 50 percent, and 45 percent above thefarmgate prices. And, as shown in Figure 4.1, themaize procurement price in Tanzania was only aquarter of the border price. In Cameroon, Ghana,and Tanzania, rice producers were paid only abouthalf the border price. This is by no means a phe-nomenon that occurs in sub-Saharan Africa alone.

The tendency to discriminate against domesticproduction relative to imports produced by foreignproducers has been observed in Egypt, Mexico,and other developing countries with large urbanfood subsidy programs, although the degree ofdiscrimination against domestic producers and themechanisms used have varied. The costs of thisdiscrimination are discussed later in this chapter.
It is often thought that if the border prices rele-vant to a country are depressed by policiesabroadfor example, due to export subsidiesthecountry concerned should take countervailingmeasures to keep its domestic prices higher. Theissue, however, is not how border prices areformed but what they are likely to be in the future.When countries can indefinitely obtain goodsmore cheaply from abroad than they can producethem, the usual arguments for open trade apply.Thus, if prevailing prices are expected to continue,countervailing actions will hurt rather than help acountry. However, countervailing measures maybe warranted if the average level of a border priceis likely to increase sharply in the short run be-cause of policy changes abroad. The practice ofpaying domestic producers of import substitutesand exportables less than border prices is, ofcourse, precisely the opposite of countervailingmeasures.
SECTORAL POLICIES AND REAL EXCHANGE
RATES. While sectoral pricing and trade policiesfrequently exacerbate the general economic biasagainst agriculture, their effects cannot be assessedin isolation from real exchange rate movements.Efforts to improve sectoral policies can easily beoutweighed by appreciations in real exchangerates resulting from inappropriate macroeconomicpolicies. This is most easily seen in sub-SaharanAfrica, where, for a variety of reasons, real ex-change rates appreciated most sharply during the1970s and early 1980s. For the sub-Saharan Africancountries as a group, real exchange rates appreci-ated by 31 percent between 1969-71 and 1981-83,as shown in Table 4.2. Exchange rate overvalua-tions were particularly large in Ghana, Nigeria,and Tanzania.
Since in sub-Saharan Africaas in many otherareas of the developing worldthe cost of modernfarm inputs imported or produced at home is onlya small fraction of total farm costs, the importanceof real exchange rate appreciations with regard tosectoral policies can be seen by looking at trends infarm output prices. Insofar as real labor costs in-creased as a result of the out-migration of labor
Table 4.2 Index of real exchange rates in selectedAfrican countries
Note: The real exchange rate is defined as the official exchange ratedeflated by the ratio of the domestic consumer price deflator to theU.S. consumption deflator. A fall in the index indicates exchangerate appreciation. Data are three-year averages.Source: Kerr (background paper).
from agriculture, the adverse effects of macroeco-nomic policies would have been greater than indi-cated by output price trends alone.
Suppose, for example, that in one year farmersreceived only half the border price at the officialexchange ratethat is, the nominal protection co-efficient was 0.5. Suppose also that the govern-ment eliminated this difference over a period oftime, during which the exchange rate becameovervalued by 50 percent because it was not ad-justed in line with the excess of domestic inflationover inflation abroad. Even though farmers wouldseem better off nominally, in real terms they wouldactually be as badly off as they were originally.
The trends shown in Table 4.3 show how realfarm incentives have been eroded over time de-spite apparent improvements in nominal terms.Using official exchange rates, one would infer thatincentives for cereal production in Africa increasedby 51 percent between 1969-71 and 1981-83, or, inother words, that domestic prices increased signifi-cantly more than border prices. But when borderprices are calculated taking the real appreciationsinto account, the actual increase in incentives wasonly 9 percent. For export crops, incentives nomi-nally increased by about 2 percent. However, theyactually declined sharplyby 27 percent. Com-pared with the situation in 1969-71, by 1981-83 realincentives to export crops declined in all the coun-tries shown in the table. This illustrates that agri-
67
(1969-71 = 100)
Country 1973 -75 1978 -80 1981-83
Cameroon 75 58 80Côte d'Ivoire 81 56 74Ethiopia 93 64 67Ghana 89 23 8Kenya 88 69 86Malawi 94 85 94Mali 68 50 66Niger 80 56 74Nigeria 76 43 41Senegal 71 60 85Sierra Leone 100 90 73Sudan 76 58 74Tanzania 85 69 51Zambia 90 79 86
All sub-SaharanAfrica 84 62 69

Table 4.3 Index of nominal and real protection coefficients for cereals and export crops in selectedAfrican countries, 1972-83
68
Note: The nominal index measures the change in the nominal protection coefficient with border prices converted into local currency at officialexchange rates. The real index measures the change in the nominal protection coefficient with border prices converted into local currency at realexchange rates. Data for Ghana are not available.Source: Kerr (background paper).
cultural reforms need to go hand in hand with gen-eral economic reforms.
Counting the costs
There are many indications that the costs of dis-criminating against agricultureeither implicitlythrough macroeconomic policies or explicitlythrough sectoral policieshave been large. An im-portant reason why this is so is that, contrary to along-held belief, farmers in developing countriesas in industrial countriesrespond strongly toprices. The crops they grow, the amounts theyproduce, and the technologies they adopt dependgreatly on the policy environment.
There is a large body of evidence that indicatesthat the supply response in developing countries isnot low. A sample of the numerous estimates madeby researchers of supply responses for individualcrops is shown in Table 4.4. The lower end of therange shows short-term supply responses, the up-per end long-term responses. Even in the shortterm, the supply responses are significant, consid-ering the high level of taxation to which farmershave often been subjected. Supply responses arewidely believed to be especially low in Africa. Infact, however, many studies suggest that they canbe as high as they are elsewhere. The high supply
response of African farmers, who have to make dowith a poor infrastructure and imperfect markets, isevident in Niger (see Box 4.2).
Empirical work has indicated that the supply re-sponse for all crops taken together is lower thanthe responses for individual crops. This is partly tobe expected: If a government taxes only one crop,resources need not be withdrawn from farming al-together. They can be shifted to other crops so thattotal farm output does not fall by as much as the
Table 4.4 Summary of output responsesto price changes
Source: Askari and Cummings 1976; Scandizzo and Bruce 1980.
(1969-71 = 100)
Count rq
Cereals Export crops
1972 -83 198 1-83 1972 -83 1981-83
Nominalindex
Realindex
Nominalindex
Realindex
Nominalindex
Realindex
Nominalindex
Realindex
Cameroon 129 90 140 108 83 61 95 75Côte d'Ivoire 140 98 119 87 92 66 99 71Ethiopia 73 55 73 49 88 71 101 66Kenya 115 94 115 98 101 83 98 84Malawi 85 79 106 100 102 94 106 97Mali 128 79 177 122 101 83 98 70Niger 170 119 225 166 82 59 113 84Nigeria 126 66 160 66 108 60 149 63Senegal 109 79 104 89 83 60 75 64Sierra Leone 104 95 184 143 101 93 92 68Sudan 174 119 229 164 90 63 105 75Tanzania 127 88 188 95 86 62 103 52Zambia 107 93 146 125 97 84 93 80
All sub-SaharanAfrica 122 89 151 109 93 71 102 73
Crop
Percentage change in outputwith a 10 percent increase in price
Africa
Otherdevelopingcountries
Wheat 3.1-6.5 1.0-10.0Maize 2.3-24.3 1.0-3.0Sorghum 1.0-7.0 1.0-3.6Groundnuts 2.4-16.2 1.0-40.5Cotton 2.3-6.7 1.0-16.2Tobacco 4.8-8.2 0.5-10.0Cocoa 1.5-18.0 1.2-9.5Coffee 1.4-15.5 0.8-10.0Rubber 1.4-9.4 0.4-4.0Palm oil 2.0-8.1

Box 4.2 Flexible markets in Niger
Farmers in low-income economies are commonly as-sumed to be inflexible, slow to respond to prices, andsluggish in adapting to changing circumstances. Thisassumption is wrong or greatly exaggerated. Recentdevelopments in the agricultural sector in Niger tell astory, not of passivity and slow response to change,but, rather, of quick adaptation and adjustment to neweconomic realities.
Niger is one of the poorest countries in the world. Inthe 1970s, farmers relied primarily on groundnuts forcash income; cotton and livestock were secondarysources of income. In recent years, farm householdshave begun to diversify their sources of income. Stud-ies indicate that nonfarm earnings now account formore than 20 percent of total household income. Salesof animals, traditionally the most important source ofnoncrop income, account for an additional 30 percent.So, half of all agricultural income now comes fromsources other than crop production. A census in 1980revealed that approximately 6 percent of rural Nigerienmen are wage earners. An additional 12 percent havesome occupation outside agriculture; for men betweenthe ages of thirty-five and forty-five, the figure is 20percent. Ninety percent of villages send migrants towork in Nigeria or other countries farther south duringthe dry season.
In addition to diversifying out of crop agriculture,Niger's farmers have changed their farming patterns.In the 1970s, prices of millet, sorghum, and cowpeasrose faster than those of groundnuts. At the sametime, groundnut yields were declining, and, after the1973 drought, farmers wanted to rebuild their foodstocks. All this encouraged farmers to sow more landto food crops, especially sorghum and cowpeas. Themost dramatic result was that cowpeas overtook
groundnuts as the country's main agricultural export.Production of cowpeas grew by more than 250 percentduring the 1970s, while the area planted expanded byalmost 70 percent. Earnings from cowpeas have begunto account for a measurable part of farm revenues-4percent in all, but, according to some surveys, as muchas 12 percent for smaller farmers in main producingareas. Meanwhile, groundnut sales have shrunk to al-most nothing.
Cowpeas have a number of advantages over ground-nuts. They can be grown in a variety of soils and allowfarmers to adopt flexible cropping patterns. They aremore resistant to drought. A large and accessible mar-ket exists in Nigeria, whereas groundnut's export mar-kets are mainly in Europe. Cowpeas are traded almostexclusively on parallel markets, where prices have fre-quently been twice as high as the official prices paid bySONARA, the state marketing agency. It is hard toknow the volume of "unofficial" cowpea exports toNigeria, but annual production is believed to be250,000-300,000 tons, while legal exports have neveramounted to more than 30,000-40,000 tons.
Important points are illustrated by the example ofNiger. It shows how buoyant open markets can be,even in unlikely places. The growth of cowpeas tookplace almost entirely through parallel markets and inthe face of public policies that were not encouraging.The official price and marketing structure was by-passed. And it shows that change can be extraordi-narily rapid. In a decade or less, one main cash cropdisappeared and was replaced by another. All of thishappened primarily in response to market signals, de-spite poor infrastructure, embryonic market informa-tion, and generally imperfect market conditions.
output of the crop taxed. But estimates of aggre-gate farm output responses have typically been ofa short-term nature and have failed to reflect thefact that changes in prices have a long-term effecton the intersectoral flow of resources. When sucheffects are taken into account, the aggregate sup-ply becomes price responsive as well.
Discrimination against agriculture on a sustainedbasis not only reallocates resources within agricul-ture but also draws them out of it. As labor andcapital move out and technical progress slows, thelong-term losses can be large:
The International Food Policy Research Insti-tute (IFPRI) studied the evolution of the Argentineand Chilean economies and the effects of pricingand exchange rate policies on agriculture. The
study showed that, if agricultural prices in Argen-tina between 1950 and 1972 had been 10 percenthigher than they in fact were (when the govern-ment was taxing farmers heavily), total agriculturaloutput would have gradually increased to a levelapproximately 9 percent higher, on an annual ba-sis, than it actually was over the period. The in-crease in production would have been achievedlargely because more capital would have been at-tracted into agriculture and technical improve-ments would have been made. Box 4.3 on Argen-tina discusses how inappropriate macroeconomicand sectoral policies led to a large reduction in ag-ricultural output. A similar simulation for the Chil-ean economy during the period 1960-82 indicatedan even greater supply response: the level of out-
69

put would have eventually become 20 percenthigher each year than otherwise in response to a 10percent sustained increase in agricultural prices.Sustained taxation of farming can thus lower the
returns to investment, discourage technicalprogress, and encourage farmers to leave the land.
Evidence about the long-term effects of pricechanges on farming can also be obtained by exam-
Box 4.3 Trade policies and agricultural performance: the case of Argentina
Argentina has ideal farming conditions and is one ofthe largest grain exporters in the world. It has had along history of agricultural growth. Between 1965 and1983, however, agricultural growth averaged only 0.8percent a year, compared with 1.9 percent a year dur-ing 1950-64 and about 2.6 percent before World War II.Agriculture's recent poor performance reflected poorincentives. The internal terms of trade were deliber-ately turned against the agricultural sector through acombination of export taxes, tariffs, restrictions on im-ports of industrial goods, and exchange controls whichled to an overvalued currency. Argentina's policiesgrew out of a perception that its exports, which wereprimarily agricultural, were facing declining real priceson world markets and therefore Argentina needed todiversify its economy by encouraging industry.
Moreover, in the 1950s and 1960s, the notion thatagricultural output did not respond significantly toprice changes was an essential part of the debate ongrowth, inflation, and distribution in the Argentineeconomy. Policymakers argued that taxing agricultureto support industries that made import substituteswould not result in big losses in farm output; similarly,they thought that increasing agricultural prices by re-ducing export taxes or by devaluing the currencywould increase the budget deficit, accelerate inflation,and penalize poor consumers without significantly af-fecting agricultural supply. Indeed, inflation itself wasconsidered to be structural, that is, a reflection of thefood or foreign exchange shortages that resulted whenindustrialization pushed up income and increased do-mestic demand for food. These views have beenchanging since the 1960s, and, by now, agriculturalsupply responses have been shown to be strong inArgentina.
A recent study of the Argentine economy examinedthe combined impact of exchange rate, fiscal, and com-mercial policies on the agricultural sector. Besides esti-mating the level of taxation on agriculture created bythe above policies, it also provided insights into theinterrelationships among various macroeconomic poli-cies. For example, it showed that, since physical con-trols on imports were the primary instruments used toprotect industry, fiscal policy strongly influenced thedegree to which Argentina's trade policy adversely af-fected agriculture. While the restrictions remained forthe most part constant between 1960 and 1983, domes-tic prices for protected imports deviated widely fromworld prices when macroeconomic policies changed.
During periods of high government spending, de-mand for imports rose and domestic prices for pro-tected imports jumped sharply, turning the internalterms of trade against agriculture (see Box figure 4.3).
By simulating what would have happened in the ab-sence of these policies, the study indicated that:
Real prices of all agricultural products would havebeen higher by about 38 percent a year on averageduring 1960-83. These prices were depressed not onlybecause of import control and public spending poli-cies, as described above, but also because of heavytaxation of agricultural exports. These exports, whichare an important component of the sector, were taxedat an average annual rate of about 44 percent duringthe period.
The annual value of agricultural output wouldhave become 33 percent higher by 1983 had the agricul-tural prices not been depressed by 38 percent as aresult of the sectoral and macroeconomic policies.
Box figure 4.3 Implicit and collected tariff rates andbudget deficits in Argentina, 1960-82
Percent240
180
120
60
0
70
1960 1965 1970 [975 1980
Implicit tariff
Collected tariffBudget deficit as a percentage of GDP
Note: An implicit tariff of 100 percent indicates that the domestic priceis double the corresponding international price.Source: Cavallo (background paper).
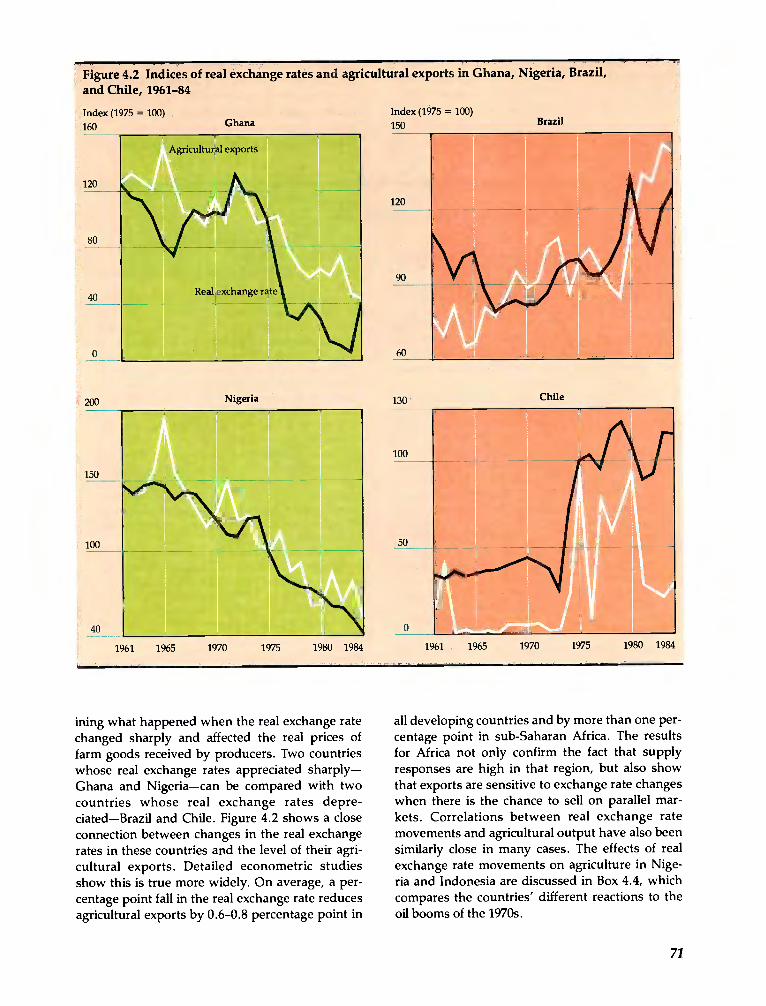
Figure 4.2 Indices of real exchange rates and agricultural exports in Ghana, Nigeria, Brazil,and Chile, 1961-84
120
80
150
100
40
120
90
60
100
50
Chile
ining what happened when the real exchange ratechanged sharply and affected the real prices offarm goods received by producers. Two countrieswhose real exchange rates appreciated sharplyGhana and Nigeriacan be compared with twocountries whose real exchange rates depre-ciatedBrazil and Chile. Figure 4.2 shows a closeconnection between changes in the real exchangerates in these countries and the level of their agri-cultural exports. Detailed econometric studiesshow this is true more widely. On average, a per-centage point fall in the real exchange rate reducesagricultural exports by 0.6-0.8 percentage point in
all developing countries and by more than one per-centage point in sub-Saharan Africa. The resultsfor Africa not only confirm the fact that supplyresponses are high in that region, but also showthat exports are sensitive to exchange rate changeswhen there is the chance to sell on parallel mar-kets. Correlations between real exchange ratemovements and agricultural output have also beensimilarly close in many cases. The effects of realexchange rate movements on agriculture in Nige-ria and Indonesia are discussed in Box 4.4, whichcompares the countries' different reactions to theoil booms of the 1970s.
71
GhanaIndex (1975 = 100)160
BrazilIndex (1975 = 100)150
Nigeria 130200
1961 1965 1970 1975 1980 1984 1961 1965 1970 1975 1980 1984

The emergence of parallel markets, most sig-nificaritly in Africa, indicates that the taxes whichmarketing agencies have tried to impose and thelarge exchange rate overvaluations have gone wellbeyond what is enforceable. The main loser is thegovernment itself. It loses tax revenues when
farmers sell export crops unofficially, and it mayend up worse off than it would have been hadtaxes been lower and the real exchange rate appro-priate. Sierra Leone suffered large foreign ex-change losses because exports of coffee, cocoa,palm kernels, and rice were smuggled out through
Box 4.4 Oil and agriculture: Nigeria and Indonesia
The oil boom of the 1970s and early 1980s proved ablessing and a curse for many oil-exporting countries.Oil revenues raised the standard of living, widened jobopportunities, and increased the policy options avail-able to governments. But they also altered the struc-ture of incentives in the economy, raised expectations,and produced rapid and often destabilizing changes.Agriculture, especially, was affected by these changes.
Oil-exporting countries commonly experienced de-clines in the rate of growth of their agricultural sectors.Higher incomes led to an increase in the price of non-tradable goods at the expense of tradable goods suchas crops. Farmers abandoned the land for more lucra-tive employment in the booming construction indus-try. The ability to pay for larger imports of food andother agricultural products, which were then sold atsubsidized prices, lowered the relative profitability ofagriculture. The force of these changing incentives hasbeen strongly influenced by government policies andthe structure of the economy. Indonesia and Nigeria,two middle-income economies that had more than 40percent of GDP originating in agriculture before the oilprice increase of 1973, provide a revealing contrast.
In Nigeria, the oil boom led to a severe disruption ofthe agricultural economy and a large exodus to thecities. Between 1970 and 1982, annual production ofNigeria's principal cash crops fell sharply: cocoa by 43percent, rubber by 29 percent, cotton by 65 percent,and groundnuts by 64 percent. The share of agricul-tural imports in total imports increased from about 3percent in the late 1960s to about 7 percent in the early1980s. Indonesia, all but unique among the oil-exporting developing countries with large popula-tions, succeeded in avoiding serious disruption to itsagriculture. Though agricultural growth slowed in themid-1970s, by the late 1970s it had recovered to pre-vious levels (see Box table 4.4). Rice production grewby 4.2 percent a year from 1968 to 1978 and by 6.7percent from 1978 to 1984, largely because of rapidincreases in rice yields. The share of agricultural im-ports in total imports remained unchanged at about 1.0percent. Indonesia increased its agricultural exportsboth as a proportion of developing countries' agricul-tural exports and as a proportion of world agriculturalexports. The rates of increase were 2.0 percent a yearand 0.5 percent a year, respectively, between 1965 and1983. Nigeria's corresponding export market shares
declined at the rate of 5.7 percent a year and 7.1 per-cent a year, respectively.
Several policy differences between Nigeria and Indo-nesia explain these divergent results. The real ex-change rate appreciated in both Nigeria and Indonesiaby about 30 percent between 1970-72 and 1974-78.Thereafter, Indonesia kept its real exchange ratesteady. It tightened its monetary and fiscal policies andbetween November 1978 and March 1983 devalued therupiah by more than 50 percent against the dollar. Incontrast, Nigeria resisted any devaluation of the naira,despite rapid appreciation of the real exchange rate.Nigeria also borrowed heavily on the basis of future oilearnings. By 1982 the real exchange rate was more thandouble its value in 1970-72.
The two countries also differed in their public spend-ing on agriculture. The bulk of Nigeria's increasedpublic expenditure was allocated to primary education,transport, and construction. Indonesia distributedspending more equally among physical infrastructure,education, capital-intensive industry, and agriculturaldevelopment, especially in rice.
In recent years, Nigeria has made efforts to increaseincentives and boost investment in agricultural infra-structure and extension services. Yet output has con-tinued to stagnate. Reversing agriculture's long de-cline will require a sustained improvement in real farmprices and better exchange rates as well as continuedand improved agricultural support programs.
Box table 4.4 Real exchange rate and agriculturalperformance in Nigeria and Indonesia, selected years,1965-83
Index of real exchange rate
Growth of agriculture(average annual percentage change)
Agricultural out put Agricultural exports
Source: Pinto (background paper).
72
Year Nigeria Indonesia Nigeria Indonesia
1965-73 2.8 4.8 -4.0 1.91974-78 -2.5 2.8 -4.2 5.31973-83 -1.9 3.7 -7.9 3.1
Year Nigeria Indonesia
1970-72 100.0 100.01974-78 76.3 74.71982-83 47.8 71.3

neighboring Liberia. The experience with parallelmarkets also reflects the changes that farmersmake to their pattern of production when crops arediscriminated against on official markets. In Tanza-nia, higher food prices on the parallel market re-sulted in a decline in the production of exportcrops (such as cotton, tobacco, and pyrethrum)when farmers switched to growing maize instead.The losses in foreign exchange contributed to fur-ther overvaluation of the currency, which de-pressed export production still more (see Box 4.5).
THE COSTS OF MISJUDGING MONOPOLY POWER AND
COMPARATIVE ADVANTAGE. Perhaps the most strik-ing evidence of the cost of export taxation can befound in the reduced shares of many developingcountries in international trade. Many developingcountries tax exports of raw materials and bever-ages in the hope of benefiting from their perceivedmonopoly power in trade. The less responsive theworld demand is to prices and the higher a coun-try's share in world markets, the greater the coun-try's monopoly power. Quite a few developingcountries have had large enough market shares toexercise some monopoly power. In the early 1960s,Burma and Thailand each accounted for about one-fifth of world exports in rice; India and Sri Lankaeach accounted for about one-third of world teaexports; Nigeria and Zaire each accounted forabout one-quarter of world exports of palm oil;Ghana accounted for two-fifths of world cocoa ex-ports; Bangladesh had about four-fifths of world
exports of jute; and Indonesia and Malaysia ac-counted for 30 and 40 percent of world exports ofrubber, respectively. All these countries, as well asBrazil (coffee) and Egypt (long-staple cotton), havetried to keep world prices high by restricting sup-ply.
But the gains from exploiting monopoly powerhave usually been limited because foreign con-sumers have found alternative supplies or substi-tutes and because domestic producers have hadlower incentives to invest in new technologies.Countries that instituted heavy export taxes haveseen their market shares usurped by others withmore favorable policies toward producers. Ghanaand Nigeria have lost world market shares in cocoa(see Table 4.5). In the early 1960s, Nigeria andZaire exported more palm oil than the main Asianproducers; by the early 1980s the Asian exportershad captured more than 90 percent of the worldmarket. Egypt's share of the world cotton marketin the early 1960s had been cut in half by the early1980s. Sri Lanka has seen its share of the world teamarket fall from one-third in the early 1960s toone-fifth in the early 1980s. In contrast, Kenya,which encouraged tea producers, has seen itsshare increase from less than 3 percent to morethan 9 percent during the same period. Box 4.6discusses these trends.
Because prices of food and raw materials tend todecline in real terms over the very long term, manybelieve that investment in agriculture-especiallyin primary products-is a losing proposition and
Table 4.5 Growth in output and exports, and the export market shares of cocoa and palm oilin selected developing countries, 1961-84
73
Commodityand country
Average annual,percentage changemoutput, 1961-84
Average annualpercentage changein exports, 1961-84
Export market shares
1961-63 1982-84
CocoaAfrica 0.1 -0.6 80.0 64.1
Cameroon 1.5 0.5 6.8 6.9Côte d'Ivoire 7.3 6.0 9.3 26.3Ghana -3.7 -4.2 40.1 14.4Nigeria -2.0 -1.9 18.0 11.2
Latin America 3.2 0.9 16.7 18.5Brazil 4.5 2.7 7.3 10.9Ecuador 2.5 2.2 3.2 2.6
Palm oilAfrica 1.8 -6.4 55.8 1.9
Nigeria 1.4 -23.6 23.3 0.2Zaire -1.8 -15.5 25.1 0.1
Asia 15.0 14.8 41.8 95.0Indonesia 9.7 6.2 18.4 8.2Malaysia 19.0 18.0 17.9 70.6

Box 4.5 Agricultural prices and marketing in Tanzania
In Tanzania, the government controls most aspects ofagricultural marketing. Marketing cooperatives re-sponsible to national crop marketing boards began totake over from private traders during the 1960s. Be-tween 1973 and 1976, ten state agencies were put incharge of buying, processing, and marketing twenty-seven widely grown crops and fifteen minor ones. Themarketed surplus of most of these crops could be soldthrough state channels only. The government fixed theproducer prices before the start of each season. Pricesdid not take into account differences in transport andwere often the same throughout the country.
Some of the effects can be seen in Box figure 4.5A.Real prices for farmers fluctuated as fixed nominalprices were adjusted in unpredictable jumps every fewyears; thus, not even the aim of stabilizing prices wasachieved. But, worse for farmers, average real pro-ducer prices declined steeply between 1970 and 1975,recovered somewhat in 1975-78, and have continuedto fall ever since. By 1984 the weighted average of offi-cial producer prices was 46 percent below its 1970 level
Box figure 4.SA Agricultural prices in Tanzania,1970-84
Index (1970 = 100)
200
160 A
120 A
40
Real producer price for domestic crops
- Real producer price for export cropsReal border price for exports
Source: Ellis (background paper).
74
Box figure 4.5B Ratios of producer prices to borderprices in Tanzania, 1970-84
Percent100
1970 1972 1974 1976 1978 1980 1982 1984
o Ratio calculated using official exchange ratesO The same ratio adjusted for overvaluation of the currency
relative to the official exchange rate in 1970
Note: Prices are a weighted average of ten export crops.Source: Ellis (background paper).
in real terms; prices for export crops were almost halftheir 1970 levels, even though the weighted average ofworld prices for Tanzania's crops at official exchangerates was 17 percent higher in real terms in 1980 than ithad been in 1970.
Rising export taxes and increased marketing costsreduced the farmers' share of the final sales value ofexport crops from 70 percent to 41 percent in 1980,although it has since recovered (see Box figure 4.5B).But the bias against export crops has been much moresevere than is indicated when measured at official ex-change rates. Correcting for the overvaluation of thecurrency during this period, the bias was muchstronger, as is also shown in Box figure 4.5B. In reality,the bias against exports was even greater, because pro-ducers of food crops could sell their output on parallelmarkets, where prices were higher than official levels,but producers of export crops could sell only to thegovernment.
The output of some export crops, notably cashews,cotton, and pyrethrum, fell drastically in the 1970s.Ambitious development programs for tea and tobacco
80
60
40
20
0
1970 1975 1980 1984

failed to reach their targets. Coffee production alsostagnated, because farmers had little incentive to re-place old trees. By 1984 the tonnage of export cropsmarketed by the marketing boards was 30 percent lessthan it had been in 1970.
At first sight, it seems the boards had more successwith domestic staples. In 1978-79, the marketing chan-nels sold more than twice as much staple grains (par-ticularly maize) as they had in 1970 (see Box figure4.5C). This reflected the good harvests that followeddroughts in 1974-75 and an increase in real producerprices as world market prices rose (though the absolutelevel of the producer price for maize was still less thanone-third of the import price). Official marketing ofdrought-resistant crops (cassava, sorghum, and millet)in 1979 was more than eight times the 1970 level, andfor oilseeds (groundnuts, sesame, sunflower, and cas-tor) the level in 1980 was some 30 percent greater thanin 1970. But problems emerged. As real producerprices for domestic crops declined sharply, the officialmarketing boards became increasingly dependent onimports; farmers shifted to parallel markets, whereprices, though unstable, were many times higher than
Box figure 4.5C Marketed output of commodity groupsin Tanzania, 1970-84
Thousands of tons450
400
300
200
100
0
1970 1975
Export commodities
Staple commodities
Drought-resistant commodities
- OilseedsSource: Ellis (background paper).
1980 1984
Box table 4.5 Official and unofficial prices forselected crops in thirteen villages in Tanzania,1979-81(Tanzanian shillings per kilogram)
Source: Raswant (background paper).
official prices (see Box table 4.5). By 1984 the amount ofmaize marketed through official channels was lessthan one-third of its 1979 peak; official channels in 1984handled less than one-third of the average annualamount of rice they had sold in the 1970s. Consider-able diversion to parallel markets has also occurredwith the drought-resistant and oilseed crops. Only inthe one major crop in Tanzania where the producerprice has generally been maintained above the importpricewheathas state marketing been more stable.
In recent years Tanzania has tried to reform its sys-tem by relying more on village cooperatives. Peoplemay now transport up to 500 kilograms (rather than 30kilograms) of grain without a permit; anyone with for-eign exchange can use it to import goods; above all, thestate marketing boards will control the prices of onlyeighteen main crops, not the forty or more regulated afew years ago. Controls on the retail price of maizeflour, the main food staple, were lifted in 1984.
Relaxing controls on grain marketing may have beenthe single most important factor contributing to therecent increases in grain supplies and to the 50 percentreal fall in food prices in 1985, but the success of Tanza-nia's reforms is far from ensured. Much will dependon whether the cooperatives can be set up quickly andwhether they will be allowed to respond to farmers'demands. Few improvements in agricultural produc-tion are likely if the cooperatives turn out to be merelyanother form of monopoly. Much depends, too, on theflexibility of marketing arrangements for major exportcrops; on whether the official prices are recognized forwhat they tend to be in practiceminimum floor pricesrather than fixed procurement prices; on whether thehigh costs of public sector marketing can be reduced;and, finally, on whether the government can reversethe substantial appreciation of the currency that oc-curred between 1979 and 1984.
75
Official price Parallel price
Crop 1979-80 1980-81 1979-80 1980-81
Maize 1.00 1.00 3.08 4.98Paddy rice 1.50 1.75 2.31 4.23Cassava 0.65 0.65 1.99 2.90Sorghum 1.00 1.00 2.96 4.68Millet 2.00 1.50 4.73 6.95

Box 4.6 Export taxation and monopoly power
Countries with a significant share of an export marketcan affect world prices, at least for a short period oftime. But attempts to tax foreigners may easily turninto excessive taxation of domestic farmers. The resultis often stagnation or decline in export crops.
Cocoa in Ghana
Cocoa pricing policies in Ghana provide one example.Since 1950, the Cocoa Marketing Board has had a mo-nopoly on buying, transporting, and exporting cocoa.The board used its monopoly power to raise significanttax revenue from export sales. At the same time, thegovernment kept the value of the currency high: in1979 the real exchange rate was estimated to have been347 percent higher than it had been in 1972. The com-bined effect was to raise the effective export duty from
Box table 4.6A Relative price incentives for cocoafarmers in Ghana, Togo, and Côte d'Ivoire, 1965-82
a high 54.3 percent in the last half of the 1960s to 88.9percent in the last half of the 1970s. Producer prices inGhana were far below levels in competing West Afri-can countries (see Box table 4.6A). Ghana's share ofexport markets slumped from 40 percent in 1961-63 to18 percent in 1980-82; Togo's market share grewslightly; that of Côte d'Ivoire rose from 9 percent in1961-63 to 29 percent in 1980-82. This was greater thanthe increase in its exportable surplus: the higher prices
in Côte d'Ivoire led to extensive smuggling of Ghana-ian cocoa.
Tea in Sri Lanka
Sri Lanka had considerable scope for influencing worldprices for tea in the early 1960s. In 1961-63 it accountedfor 33 percent of world tea exports, and Sri Lankan teahad a long-established niche in the market. Kenya thenaccounted for only 2.6 percent of world exports. Whileother factors have also been important, the two coun-tries followed very divergent pricing policies. In SriLanka, average tax rates exceeded 50 percent in the late1970s; they have averaged 35 percent over the pastdecade. In Kenya, taxation was much more moderate.Box table 4.6B compares tax rates in 1985 at a range ofworld prices. Sri Lanka's tax captures most of the sur-plus above an estimated cost of production. In con-trast, most of the returns remain with the producer inKenya. When tea costs $2.40 a kilogram, tax rates in SriLanka are ten times higher than in Kenya. At $3.60 akilogram, they are still more than three times as high.By 1980-82, Sri Lanka's share of world markets hadfallen to 19 percent while Kenya's share had more thantripled to 9 percent.
Box table 4.6B Tax rates on tea in Kenya andSri Lanka, 1985(percent)
that planners should shift their attention else-where. This view is misleading for several reasons.First, long-term declines in real commodity priceshave coexisted with, indeed have been partiallycaused by, technical progress in developing coun-tries. Countries that have promoted technicalprogress-for example, Thailand in rubber andMalaysia in palm oil-continue to find specializa-tion in primary commodity exports profitable. Sec-ond, if despite technical progress, economic ratesof return to investments in agricultural commodi-ties gradually fall to unacceptable levels, the econ-omies concerned should at that time shift re-
76
sources elsewhere. Such a shift should occurnaturally, with market prices signaling the eco-nomic merits or demerits of further investments. Itis inappropriate and self-defeating for policymak-ers to force the process by imposing excessivetaxes on exports or by other means.
THE COSTS OF PROMOTING AGRO-INDUSTR!E5.Developing countries sometimes subsidize agro-industrial exports to offset escalating tariffs in in-dustrial countries (see Chapter 6). Such subsidiesmay be given directly, in the form of subsidizedcredit to processors, or indirectly, by restraining
Fob, price(dollars perkilogram)
Kenya Sri Lanka
Averagetax rate
Marginaltax rate
Average Marginaltax rate tax rate
1.20 0.00 0 22.4 0
1.80 2.83 10 14.9 0
2.40 2.59 15 27.7 503.00 8.17 20 32.2 503.60 10.66 25 35.2 504.20 13.10 30 37.3 504.80 14.92 25 38.9 50
Year
Ratio ofGhana price to
Togo price
Ratio ofGhana price to
Côte d Ivoire price
1965 0.97 0.971970 0.56 0.601975 0.74 0.481980 0.23 0.181981 0.36 0.261982 0.40 0.30

domestic raw material costs through export quotasor taxes. Systematic taxation of raw materials toensure the financial viability of processing indus-tries has been common in many countries, includ-ing Ghana and Tanzania. Although the taxation ofraw material exports may reduce the financial costsof processing, the true costs of subsidies are borneby the developing countries themselves.
The growth of the soybean processing industryin Brazil illustrates how subsidies for agro-industries can become counterproductive. The ex-pansion of soybean output in Brazil is a remarkablestory: starting from a very small base in the late1960s, soybean production expanded so rapidlythat by the early 1980s Brazil was producing nearly19 percent of world output. The expansion of soy-bean processing was even more rapid. Prior to the1970s, soybean processing was composed of manysmall and medium-size plants; the total processingcapacity was 800,000 tons. By 1980, processing ca-pacity had increased to 20 million tons, or about160 percent of domestic soybean production. Brazilbegan importing soybeans to process at home. In1984, more than 63 percent of soybean productionwas exported, of which only 6 percent was in rawform.
This growth in processing capacity was inducedby a policy, initiated in the early 1970s, of provid-ing large credit subsidies, imposing controls andtaxes on raw soybean exports, prohibiting importsof soybean oil and meal, and giving export subsi-dies to processors. During the period 1976 to 1984,the margins between the border prices of oil andmeal and raw soybeans were insufficient to coverprocessing costs. If raw soybean inputs are valuedat what they could have earned in the world mar-ket, processing actually resulted in foreign ex-change losses. As a result of the encouragementgiven by the government to the processing indus-try, the economy lost about $1.7 billion between1976 and 1984. Without the direct and indirect sub-sidies, the growth of processing capacity wouldhave been smaller, because the true costs of pro-cessing and the risks of adverse world price move-ments would have been perceived by the privatesector.
THE COSTS OF SELF-SUFFICIENCY. Developingcountries proclaim self-sufficiency in food as a cru-cial national objective. Various means can be usedto attain itfor example, import barriers, publicinvestments to support food production, and taxa-tion of crops that compete with food production.All of these means have been used, although, as
Figure 4.3 Production, consumption, andimports of cereals in sub-Saharan Africa,1965-84
130
110
90
26
20
12
0
41965
Consumption
YvProduction
A
Per capita net imports
Wheat and flour
Major coarse grains
Rice
Note: Consumption is calculated as production plus net imports.Source: FAO.
mentioned earlier, systematic protection of importsubstitutes has not been common. What has beenmuch more common is discrimination against do-mestic producers through low procurement pricesand through macroeconomic policies. The strongbias against agriculture has increased sub-SaharanAfrica's dependence on imports of food, particu-larly wheat and rice (Figure 4.3).
Paradoxically, Africa's food problems are oftenascribed to an overemphasis on nonfood crops.But data for the periods 1960-70 and 1970-82 paint
77
Kilograms
150 Per capita production and consumption
1975 1980 19841970

a different picture. Countries that experienced sat-isfactory growth of one type of crop also experi-enced satisfactory growth of the other. In twenty-five out of thirty-eight African countries, the rateof growth of both food and nonfood productionfell in 1970-82 compared with the 1960s. In sixcountries both growth rates increased; in only fivedid the rate of growth of food production increasewhile that of nonfood production fell. And in onlytwo other countriesKenya and Malawi, whichare self-sufficient in fooddid the growth of food
production slow down while the rate of growth ofnonfood production accelerated.
Export and food crops complement each othereven more as farmers shift from traditional to mod-ern practices. Modern agriculture requires moretradable inputs. In most of Africa, as well as inmany developing countries elsewhere, these in-puts must be imported. One obvious way of earn-ing the foreign exchange needed is to expand agri-cultural exports.
It is likely that, had they followed the right type
Box 4.7 Food self-sufficiency in Asia
Most Asian countries cite self-sufficiency in food as animportant policy aim, and many have achieved or areapproaching it. India had a large surplus of wheat in1985. Indonesia achieved self-sufficiency in rice in 1984and 1985. Bangladesh greatly reduced cereal imports inthe 1980s. China shifted from being a major importerof food grains in the 1970s to being a surplus producerin the 1980s. These achievements reflect the efficientadoption of new crop varieties and techniques byAsian farmers and improved policies for agriculture.
More than 22 million hectares were brought underirrigation in South and Southeast Asia between 1966and 1982, which raised the proportion of total irrigatedagricultural land from about 20 percent to more than 28percent. By the late 1970s, modern rice varieties cov-ered 80 percent of the cultivated area in China, morethan 70 percent of the cultivated land in the Philip-pines and Sri Lanka, and more than 50 percent of suchland in Indonesia and Pakistan. Modern varieties ofwheat expanded to cover two-thirds of the total wheatarea in India. Between 1966 and 1982, total fertilizerconsumption increased more than sixfold in SoutheastAsia and more than fourfold in South Asia.
But such successes do not necessarily mean that self-sufficiency is a desirable policy. Substantial gains fromtrade can be forgone in its pursuit. Such losses wereevident in China when each province aimed to becomeself-sufficient in food grains. The same losses can occurif a country restricts trade in world markets. Take thecase of Sri Lanka, where research spending, pricingpolicies, input subsidies, and investment in irrigationhave all been geared to achieving self-sufficiency inrice. Many components of the effort were appropriate,but, from an economic point of view, the policies mayhave been pushed too far. The government's supportprice for producers of paddy, which is set to providefarmers with a reasonable rate of return, was Rs65 abushel in 1983. This price is far below the economiccost of producing rice in some areas, because of inputsubsidies. Adjusting only for the subsidies provided
on fertilizers, the economic cost would be about Rs79 abushel. The largest subsidy, however, is on irrigationwater. In the areas of the Mahaweli irrigation systemwhere costs are highest, development costs are almostRs400,000 an acre (about $17,000). The Costs are abouthalf in the median-cost areas. Assuming yields of 160bushels per double-cropped acre and an opportunitycost of 10 percent, the economic cost of rice would beabout Rs250 a bushel in the high-cost areas and aboutRs165 a bushel in the median areas. In Burma, by com-parison, farmers supply a higher grade of paddy atRs25 a bushel. Even if the significant subsidies on fer-tilizers in Burma are taken into account and a part ofthe costs of the Mahaweli scheme is allocated to activi-ties other than rice growing, there remains a very largegap between marginal costs of production in Sri Lankaand those in Burma.
Countries often fail to capture the potential gainsfrom trade for a complex array of reasons. First, coun-tries may not be able to import at prices which reflectmarginal economic costs of production in low-cost ex-porting countries. Exports in Burma, for instance, are astate monopoly, and the export price is well above theeconomic costs of production, processing, and market-ing. Thailand has often raised its export tax on rice inperiods of high world prices, such as 1973-75. Suchpolicies have encouraged import substitution in coun-tries with trade deficits. Second, and conversely, im-port restrictions in importing countries discourage in-vestments in rice by exporters. Subsidies on riceexports by industrial countries also discourage higherproduction in low-cost countries. Third, the high costof self-sufficiency has often been underwritten bygrants or concessionary loans from donors. Taken inisolation, many components of each country's policiesmay have been logical. Taken together, however, theyadd up to a bias against a well-integrated world agri-culture capable of capturing the full benefits fromtrade.
78

Box 4.8 Agricultural pricing policies and the environment: the case of Haiti
With a per capita GNP of about $370 in 1985, Haiti isthe poorest country in the Western Hemisphere. It isalso one of the most densely populated, with 5.3 mil-lion people in a total area of 2,800 square kilometers.Much of the country is mountainous. Fifty percent ofthe land area has a slope greater than 40 degrees and isecologically suitable for forest cover only. The otherhalf is under cultivation and natural pasture. Farm sizeis becoming regressive; of the 600,000 farm holdings,more than 65 percent have less than one hectare. Satis-fying domestic food requirements is absorbing increas-ing areas of land, at the expense of cash crops, particu-larly coffee and cocoa. Intercropping by smallholdersusing traditional methods, which require few moderninputs, is widespread.
Mounting population pressures, felling of forests forfuel and construction, and increased planting of foodcrops in hilly areas have led to extensive soil erosion.Other consequences of these pressures are the decreas-ing viability of farms, declining per capita production,increasing rural poverty, malnutrition, and rural-urbanand international migration.
The causes of these developments are complex. Theyinvolve both traditional nonmarket phenomena andthe government's agricultural pricing and trade poli-cies. Peasant farmers' incentives to produce have beenseverely constrained by a pervasive structure of infor-mal, often feudalistic, authority and taxes, as well asby insecurity of tenure and the absence of effectivetechnical support from government. Larger holdingshave been characterized by absentee ownership.
Over the past fifteen years, the government's agri-cultural pricing and trade policies have become in-
creasingly divorced from the comparative advantagethe country has in the production of coffee and cocoarelative to maize, sorghum, and rice. Domestic pricesof these staples have been supported above parity byquantitative import restrictions. At the same time, thegovernment has continued its traditional policy of tax-ing coffee and cocoa exports. Over the past five years,the ratios of domestic farmgate prices to border pricesat official exchange rates have been of the order of 0.5for coffee and 1.3 for maize, sorghum, and rice. Thedeterioration in the real value of the Haitian gourderelative to the U.S. dollar means that the staples havebeen less protected, and coffee has been taxed moreheavily, than it appears.
The taxation of coffee and other cash crops has ad-versely affected income growth and its distribution,nutrition, and the preservation of nonrenewable re-sources. Soil erosion has reached calamitous propor-tions. Around 15,000 hectares of cultivated land is be-ing lost to erosion each year. Almost 1.1 millionhectares have been denuded of soil and have becomeessentially wilderness, with little or no vegetation.Coffee trees, which are ecologically suited to the previ-ously forested hillsides, are being replaced by maizeand sorghum, which do not bind the soil as well.
A broadly based package of social and economicmeasures will be necessary if investment, production,and resource conservation are to be stimulated in ruralHaiti. Reforms of agricultural pricing and trade policieswould have to be an integral component of any suchpackage if long-term growth in the sector is to be at-tained.
of pricing policies, many developing countrieswould have progressed further toward self-sufficiency than they in fact have. The key issue,however, is not self-sufficiency, but comparativeadvantage. If a country can use its resources betteron exportswhether agricultural or notthere islittle reason for wasting resources to pursue self-sufficiency in food. In Chile, for example, both ag-ricultural exports and imports increased dramati-cally following the realignment of prices in theearly 1970s (see Chapter 5). But, as discussed inBox 4.7, self-sufficiency remains a popular noneco-nomic objective, and some countries have beenwilling to incur large costs to attain it.
THE COSTS TO THE ENVIRONMENT. Protection ofthe environment is a task that has recently at-tracted much attention, especially because of the
erosion of arable land in sub-Saharan Africa. Al-though it is not often realized, the pricing policiesthat developing countries follow can be importantfrom this point of view also. When farming be-comes unprofitable, farmers lose the incentive tocare for their land. Equally important, differentcrops have different effects on soil conservation,and pricing policies may exacerbate soil erosion byinducing farmers to choose the wrong crops. InHaiti, for example, coffee and other tree crops bindthe soil on hillsides better than field crops do. Thetaxation of coffee relative to field crops has had theunfortunate side effect of increasing soil erosion.This is discussed in Box 4.8.
INTERSECTORAL LINKAGES. These illustrations ofthe bias against agriculture and its costs have fo-cused mainly on agriculture. But the question may
79

be raised as to whether the sacrifices in agriculturaloutput are offset by growth elsewhere. The effectsof wrong policies in one sector are never confinedto that sector alone. The experience of decadessuggests that a healthy agricultural sector is criticalto national growth. Taxing agriculture to force re-sources to industry will retard agricultural growth,lower domestic food and raw material supplies toindustry, and reduce demand for industrial prod-ucts. This will harm agricultural and industrialprospects in the long run. With some exceptions,such as the oil and mineral exporters, countrieswith low agricultural growth have low industrialgrowth and countries with high agriculturalgrowth have high industrial growth (see Figure4.4). Agriculture's intimate connections withgrowth and the wider economy mean that thecosts of discrimination against agriculture are notborne by farming alone.
The role of agricultural growth in industrializa-tion is well documented in England, where the In-dustrial Revolution began: the story was the samein Japan between the Meiji Restoration in 1868 and
Figure 4.4 Average annual growthin agriculture and industry in developingcountries, 1973-84
Industrial growth rate (percent)10
80
World War I. Substantial transfers of capital andlabor from agriculture to the rest of the economycontributed much to Japan's industrial develop-ment, but those transfers came about as agricul-tural productivity increased. The Japanese experi-ence has special relevance to the developingcountries because it was achieved by farmers withonly small plots of land and did not involve manip-ulation of the terms of trade against agriculture(see Box 4.9).
The industrialization of the fast-growing EastAsian economies follows to a large extent the Japa-nese pattern of rapid agricultural growth support-ing the drive toward industrial growth. The factthat agricultural and industrial growth comple-ment each other is also evident from recent studieson developing countries. In India, a 1.0 percentagepoint increase in the agricultural growth rate is cor-related with an increase in industrial growth of 0.5percentage point and in national income of around0.7 percentage point. Agriculture is linked to in-dustry through rural expenditure on manufac-tures. Increases in agricultural output raise house-hold and government incomes and the demand forconsumer goods. Although per capita incomes inIndia are higher in towns than in the countryside,the absolute size of the market for manufacturedgoods is larger in rural areas. Moreover, villagersspend so much of any extra income on manufac-tures that an increase in agricultural income gener-ates substantial demand for industrial goods.Studies in other countries confirm how importantthis connection is. In Nueva Ciga province in thePhilippines, a 1 percent increase in agricultural in-come generates a I to 2 percent increase in valueadded in most sectors of the local nonfarm econ-omy. In the Muda district of Malayasia, every $1.00increase in agricultural output indirectly adds$0.80 in value added to the rest of the village econ-omy.
The role of agriculture envisaged in the strategyof industrialization behind high protective barriersignores the lessons of history. While it is true thatthe share of agriculture in national income declinesin the long run, transfers of resources from agricul-ture should come about naturally through growthin its productivity rather than through highly dis-criminatory policies against agriculture.
Agriculture as a source of tax revenues
In many developing countries the agricultural sec-tor is the largest tax base, and some taxation isunavoidable for financing public expenditures in
1 1 3 5 7
Agricultural growth rate (percent)
Low-income economy
Middle-income economy
0 .
2

Box 4.9 Agricultural taxation in Japan
The contribution of agriculture to the Japanese eco-nomic miracle is a test case for the role of agriculture indevelopment. On the face of it, agriculture in Japandisplayed many of the characteristics shown in today'sdeveloping countries. For most of the past century, itsgrowth rate was less than 2 percent a year, except afterWorld War II, when it became heavily protected. Capi-tal outflows from agriculture were substantial, trans-ferring resources to other sectors of the economy. Theagricultural tax system is thought to have played animportant role, but, in fact, the lessons from Japan aremore complicated.
The net capital flows out of agriculture were espe-cially important in the first quarter century of Japan'sdevelopment (see Box table 4.9A). They accounted for27 percent of nonagricultural gross capital formationbetween 1888 and 1902 and 23 percent between 1903and 1922. The public sector accounted for about two-thirds of the transfer in the earlier period, but onlyone-quarter in the later period. Tax transfers, there-fore, do not seem to have been a dominant cause of thereallocation of capital for very long, but agriculturaltaxation was clearly important in the early years ofdevelopment.
These public sector transfers, however, are only partof the picture. The movement of labor out of agricul-ture needs to be taken into account. Between 1888 and1900 (see Box table 4.9B), two-thirds of the increase innonagricultural labor was due to the migration offarmers and their families; this contribution increasedto four-fifths in the next two decades. Econometricmodels that simulate what would have happenedwithout the transfers of either capital or labor indicatewhich of the two played the more important role in thedevelopment process. The studies concern the periods1907-37 and 1955-68. Their results suggest that labormigrationand not, as is commonly thought, the flowof savingshad the bigger impact. Given that privatecapital flows dominated public sector flows through-out both periods, it would appear that neither capitalflows nor the tax system has contributed greatly toJapan's success story. This, however, may not have
Source: Ueno (background paper).
Net public sector
been true during the first quarter century of Japanesedevelopment, when tax transfers were largest. Thepublic sector may have played an important role beforethe private sector was able to allocate private savingsamong different sectors of the economy.
The nature of the tax mechanism used in Japan wasalso of great importance. In sharp contrast to the casein many of today's developing countries, taxes werelevied by a direct land tax. This did not undermineagricultural incentives by lowering producer prices.On the contrary, agriculture's terms of trade generallyimproved from 1888 until the 1930s, when the terms oftrade turned moderately against it under the influenceof increased agricultural supplies from Japan's colo-nies. Furthermore, the level of agricultural taxationwas low in comparison with the tax burdens commonin developing countries today. As shown in Box table4.9C, the tax burden was less than 7 percent of grossoutput and less than 9 percent of value added; it wasfalling throughout the period.
Box table 4.9B Intersectoral movements of laborin the Japanese economy, 1888-1940
Source: Ueno (background paper).
Box table 4.9C Tax burden as a share of output andvalue added in agriculture in Japan, 1888-1937
Box table 4.9A Capital flows from agriculture to nonagriculture by source of flow, 1888-1937
Note: Value added is gross output minus current input.Source: Ueno (background paper).
Net private sector
81
1888-1902 36 18 19 9
1903-1922 65 6 198 171923-1937 -37 -2 -30 -1
1888-1900 1.5 2.3 67
1900-1920 3.7 4.7 79
1920-1940 3.7 7.3 51
1888-1902 6.8 8.61903-1922 5.8 7.21923-1937 5.1 6.4
Direct tax Direct taxas a percentage as a percentage
Period of gross output of value added
Outflow of Increase inagricultural nonagricultural Agriculturallabor force labor force contribution
Period (millions) (millions) (percent)
Percentage of Percentage ofFlows nonagricultural Flows nonagricultural
Period (millions of yen) investment (millions of yen) investment

agriculture and elsewhere. The key issue is notwhether agriculture should be taxed, but how de-veloping countries can avoid the excessive costs oftaxing agriculture.
Whether revenues accrue to the central govern-ment, to a state government, or to a parastatal, alltoo often revenue requirements are taken as fixedbefore taxation policies are designed. The mostcommon error is to assume that a certain amountof revenue has to be raised. Public expenditurepolicies and taxation policies need to be examinedtogether. There are often great wastes in publicexpendituresfor example, in the financing of in-efficient and highly capital-intensive industrialprojects that are entailed in forced industrializationstrategies. And, as the next chapter will show,there are reasons to doubt the efficacy of spendingon programs that bear more immediately on theagricultural sector. Apart from exploring the scopefor reducing the total revenue raised from agricul-ture, governments should also be concerned withthe form of taxation.
The previous sections have given some indica-tion of the high costs of agricultural taxation. Thereare two reasons they are so high. First, countrieshave relied heavily on export taxes or on the pric-ing policies of export marketing boards because ofthe perceived difficulties of administering directtaxes in rural areas. Second, the rates of taxationon specific exports have often been high. Asshown in Box 4.10, the losses in real national in-
come due to export taxes increase more than inproportion to increases in the tax rate. These lossesare referred to by economists as efficiency costs, orefficiency losses.
The remedies for the high cost of taxation lie inthe use of other tax instruments or, to the extentthat countries are obliged to use export taxes, inlower rates. Searching for efficient ways to tax agri-culture is clearly a matter of high priority in devel-oping countries, although taxation should not beso great as to produce the sort of discriminationagainst agriculture described earlier in this chapter.With commodity taxes, the preferred approach isto focus on consumption rather than production.Commodity-specific excise taxes and broadlybased value added taxes that bear on commoditiespurchased for consumption offer a convenientmeans of raising substantial amounts of revenuewithout impairing the efficiency of production. Al-though their imposition at the retail level may bebeyond the administrative capabilities of most de-veloping countries, taxes on consumer goods areregularly applied at the point of import or at thefactory gate. To the extent that more of these goodsare consumed by the relatively rich, this optionalso contributes to the overall progressivity of thetax system. As a source of revenue, greater use ofeconomy-wide taxes on consumption offers an im-portant alternative to the excessive taxation of agri-cultural production.
Direct taxes offer another alternative to export or
Box 4.10 The efficiency cost of export taxes
The loss in real national income caused by a tax isreferred to as its efficiency cost. The efficiency cost of atax is additional to the administrative and collectioncosts and summarizes the net impact of that tax onproducers, consumers, and the government's budget.
In the case of an export product, for example, the taxwill lower the price to producers and consumers andgenerate revenues for the government. The losses ofthe producers will have to be offset against the gains toconsumers and the government. The efficiency costper unit of revenue raised is a useful indicator in prac-tice. At the margin, the cost per unit of revenue in-creases more than proportionately to the tax rate.
To illustrate this, assume that the exports of a com-modity rise in proportion to its pricethat is, if theborder price increases by 10 percent, the export vol-ume also increases by 10 percent. On that assumption,
the efficiency loss for the last unit of revenue raisedfrom an export tax ( t) is t /(1-2 t).
Thus, if the export tax is 5 percent, getting the lastdollar of tax revenue will cost only 5.6C. If, however,the tax rate is 40 percent, the last dollar of revenue willcost two dollars. Indeed, beyond 50 percent, total reve-nues will decrease when the tax rate is increased, sothat it would be pointless to increase the tax further.This result is important for two reasons. First, the ex-port supply response assumed above may well be con-servative. This is quite likely because as the price in-creases, producers produce more and consumersconsume lessthe exportable surplus increases forboth reasons. Second, as noted in the text, export taxeshave often been very high, especially when excessiveparastatal margins are taken into account.
82

output taxes. The taxation of land is an approachthat has been used successfully in the past. Sinceland taxes are paid regardless of how the land isused, they discourage increases in productivityless than does taxation through depressed prices.The Japanese experience with an agricultural landtax is an object lesson in reducing the distortionscaused by taxation (see Box 4.9). In this case, therate of taxation was also moderateit captured lessthan 7 percent of agricultural value added in a sec-tor that was benefiting from rising relative prices.And Japan's land tax was not unique in the latenineteenth and early twentieth century. The agri-cultural tax system in Thailand, for instance, wasalso based on a land tax. Since there was an openland frontier in Thailand and since there was con-cern that a land tax would discourage settlement ofnew land, the tax was not applied to newly culti-vated land. Different tax rates were applied to dif-ferent kinds of land according to their fertility. Asin Japan, rates were kept low (between 5 and 10percent of agricultural output). Rights to land werelinked to a household's ability to settle, cultivate,and meet the tax obligations on the land. The taxsystem and land settlement policy established asystem of independent smaliholders that is still ev-ident in a low rate of landlessness and Thailand'sparticular tenancy arrangements.
Despite its attractions, land taxation, once a sig-nificant means of raising revenue, is now rarelyused. Its demise cannot be explained by high ad-ministrative and collection costs alone. A land taxregister can be much less detailed and accuratethan the registers needed to establish ownershiprights. Recent developments in satellite imageryand readily available information on access to wa-ter and proximity to markets can be used to set upa workable land classification. Given the attractive-ness of land taxation, expenditures involved ingenerating such information are likely to be worth-while. Market prices for land can also provide esti-mates of the quality of different types of land.
But broadly based land taxes are not the onlyalternative to commodity taxes. Other alternativesexist in most countries. For example, where thetaxpaying unit can be easily identified and the po-tential revenue per taxpayer is large, the applica-tion of standard income taxes is both equitable andcost-effective. This is an easy option in countrieswhere significant production takes place in privateor public estates. Tea and tobacco estates in Ma-lawi, for example, have long been subject to per-sonal income taxcollected on a pay-as-you-earnbasisand to company income tax. In contrast,
with one minor exception in fiscal 1985, estateshave not been subject to export taxes. In this way,substantial amounts of revenue have been gener-ated without depressing producer incentives. Thisapproach could be replicated in other countrieswhere land ownership is highly concentrated. InLatin America, for example, about 1 percent of thepopulation controls more than 50 percent of theland and accounts for almost one-third of agricul-tural output and more than one-sixth of total GNP.The application of an income tax in such circum-stances may be a more effective means of taxationthan efforts to introduce a more broadly based butimperfectly implemented land tax.
This approach parallels procedures in other sec-tors of the economy where income taxes are usu-ally confined to large-scale enterprises. Develop-ment of the tax system then involves expandingthe tax base by gradually incorporating smallerand smaller units. In agriculture, this process canbe accelerated by using export taxes as presump-tive income taxesthat is, export taxes or otheroutput taxes can be viewed as a prior collection ofincome tax. Large estates and other entities payingincome tax on a regular basis would credit pay-ments of export taxes against their income tax lia-bilities. Smaller concerns which may not have paidincome tax in the past would have the option ofsubmitting a return should their payment of exporttaxes seem excessive. Given that agricultural in-comes are usually much lower than those in urbanareas and may often be below the standard exemp-tion for income tax, this procedure implies rates ofeffective export tax that are substantially lowerthan those prevailing in many countries.
Yet another option is the use of multitiered pricesystems whereby the tax falls on the intramarginalquota rather than at the margin. The agriculturalpricing system prevailing in China before 1985 pro-vides an example. To maintain incentives for in-creased output at the margin, farmers were paid ahigher "above quota" price (or an even higher ne-gotiated price) on supplies in excess of their quotadeliveries. This approximated a land tax: thefarmers were obliged to pay a fixed tax (equivalentto the difference between the quota price and thehigher price on residual sales multiplied by thequota deliveries) and were free to sell all residualoutput at a free market price. However, the ap-proximation was not exact. Quota deliveries wererestricted to basic food grains and a few other com-modities that enter the subsidized food distribu-tion system. Thus, there was an incentive to evadethe burdens and a need to restrict the freedom of
83

choosing which crops to grow. Quotas were set atdifferent levels in different regions, depending onthe state's need for particular commodities, so thatthe farmer's ability to exceed 'quota" deliveries,and therefore to gain access to high marginalprices, varied a great deal. Despite the disadvan-tages of such a multitiered system, it should still bean improvement over the high marginal tax ratesimposed by marketing parastatals in many coun-tries.
It is also important to examine direct taxationoptions for cost recovery in various projects fi-nanced by the government. Public sector projectsin agriculture raise land values and thus create apotentially useful tax base. Even if land taxes are
84
not possible in all areas of the country, bettermentlevies in project areas generally are. This issue isexplored further in the next chapter in the contextof irrigation projects.
This review of agricultural policies in developingcountries has not focused on the assistance thatgovernments have sought to provide throughprice stabilization and farm input subsidy mea-sures, nor has it reviewed the efficacy of consumersubsidy programs in alleviating poverty and mal-nutrition. Do such programs reduce the biasagainst agriculture, or do they exacerbate it? Thatis the central question addressed in the nextchapter.