Embed Size (px)
Citation preview
Agricultural Economics December 4, 1990 Research Report No. 191
• HIGH VOLUME INSTRUMENT COTTON CLASSING: THE ECONOMIC IMPACTS ON MISSISSIPPI COTTON PRODUCERS
•
r
Mary Helen Forrester Graduate Research Assistant
Dr. David H. Laughlin • Associate Professor
Ll
• Agricultural Economics Department Mississippi State University
Division of Agriculture, Forestry, and Veterinary Medicine Agricultural and Forestry Experiment Station• College of Agriculture and Home Economics• Cooperative Extension Service
J
Agricultural Economics
December 4, 1990 Research Report No. 191
•
r HIGH VOLUME INSTRUMENT COTTON CLASSING: THE ECONOMIC IMPACTS ON MISSISSIPPI COTTON PRODUCERS
•
r
LM
Mary Helen Forrester Graduate Research Assistant
Dr. David H. Laughlin Associate Professor
•
rI
n LA
•
TABLE OF CONTENTS
Page
LIST OF TABLES .....................................iii
LIST OF HGTJPE .....................................iv
THE RESEARCH PROBLEM ..............................1
THE COMMODITY CREDIT CORPORATION ...................5
THE SCHLAFHORST STUDY ............................ 5
OBJECTIVES ........................................8
METHODS AND PROCEDURES ............................10
RESULTS AND DISCUSSION .............................13
Frequency Distributions ..............................13 Grade Distributions ...........................13 Staple Distributions ............................15 Micronaire Distributions .........................15
• Strength Distributions ...........................17 Color Distributions ...........................17 Trash Distributions ...........................21 Length Distributions ...........................21 Length Uniformity Distributions ...................21
• Economic Analysis ................................. 25 Current Schedule .............................28 Alternative Schedule ...........................28 Economic Impacts .............................29
• LIMITATIONS ......................................30
CONCLUSIONS .....................................31
BIBLIOGRAPHY ......................................33
[I
II
LIST OF TABLES
Table Page
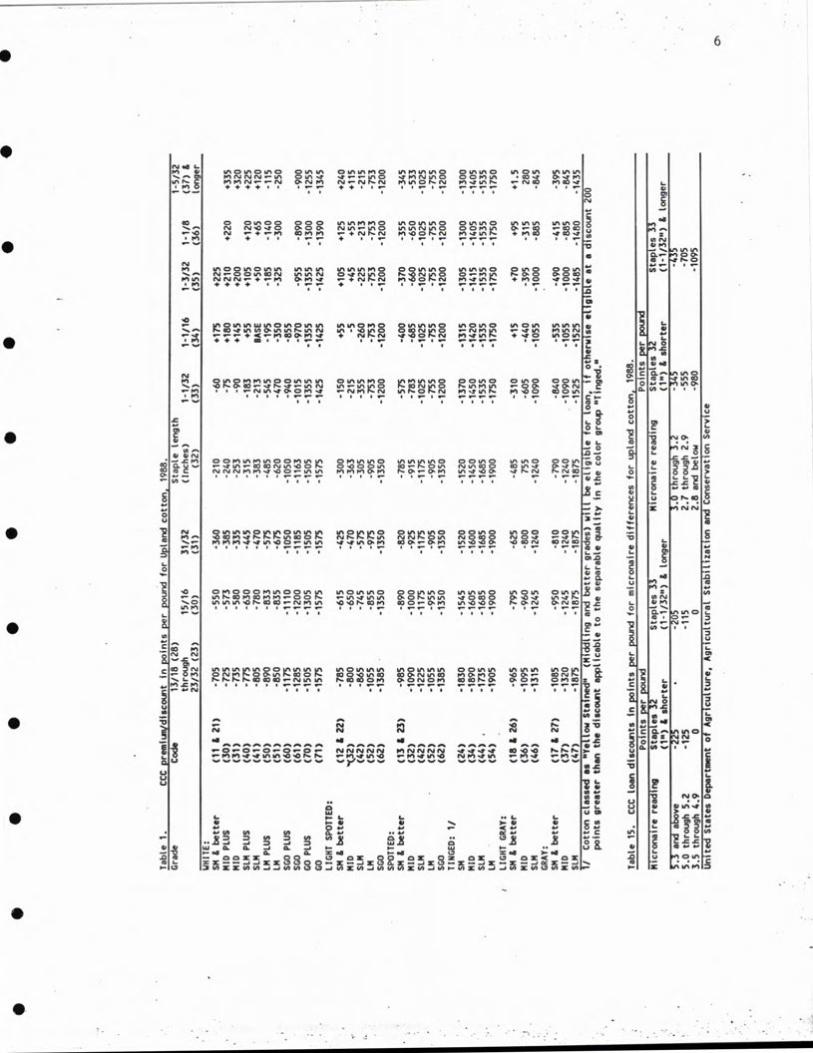
1. 1988 CCC premium/discount schedule for Upland cotton ................6
2. 1989 CCC premium/discount schedule for Upland cotton ...............7
3. Results of the 1988 analysis of current and alternative premium and discount schedules ..............................26
4. Results of the 1989 analysis of current and alternative premium and discount schedules ..............................27
r L
40
fl
n ifi
LIST OF FIGURES
Figure Page
1. Schlafhorst premium, base, and discount ranges for micronaire, strength, trash, and length ........................9
2. 1988 and 1989 frequency distribution for grade as related to CCC standards ................................14
3. 1988 and 1989 frequency distribution for staple as related to CCC standards ...............................16
4. 1988 and 1989 frequency distributions for micronaire as related to CCC, NACCM, and Schlafhorst standards ............. 18
• 5. 1988 and 1989 frequency distributions for strength as related to NACCM and Schlafhorst standards .............. . . . 19
6. 1988 and 1989 frequency distributions for color as related to grade 41 ...................................20
7. 1988 frequency distributions for trash as related to grade with "4" as the first digit and 1989 frequency distributions for trash as related to Schlafhorst standards .........................................22
• 8. 1988 and 1989 frequency distributions for length as related to Schlafhorst standards ............................23
9. 1988 and 1989 frequency distributions for length • uniformity as related to below 80, 80-82, and above
82 descriptive designations ..............................24
n
fl
Ll
Ll
iv
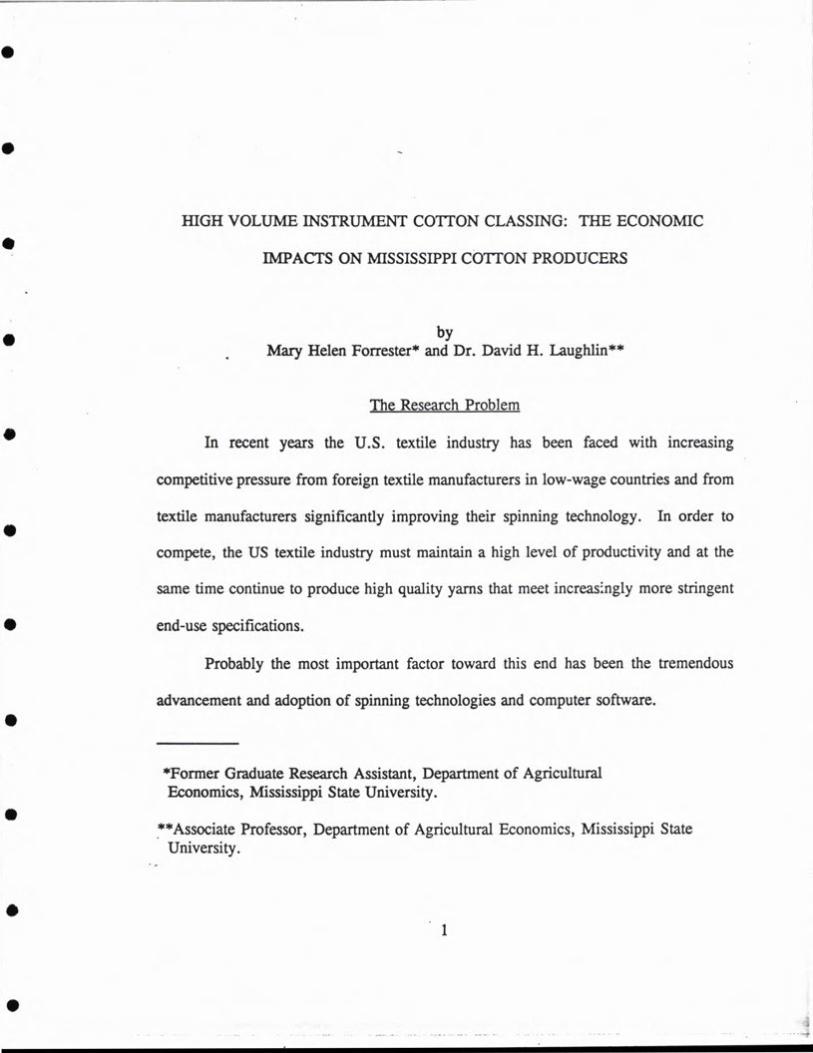
HIGH VOLUME INSTRUMENT COTTON CLASSING: THE ECONOMIC
IMPACTS ON MISSISSIPPI COTTON PRODUCERS
by Mary Helen Forrester* and Dr. David H. Laughlin**
The Research Problem
In recent years the U.S. textile industry has been faced with increasing
competitive pressure from foreign textile manufacturers in low-wage countries and from
textile manufacturers significantly improving their spinning technology. In order to
compete, the US textile industry must maintain a high level of productivity and at the
same time continue to produce high quality yarns that meet increasingly more stringent
• end-use specifications.
Probably the most important factor toward this end has been the tremendous
advancement and adoption of spinning technologies and computer software.
*Former Graduate Research Assistant, Department of Agricultural Economics, Mississippi State University. •
**Asseciate Professor, Department of Agricultural Economics, Mississippi State University.
.
fl 1
2
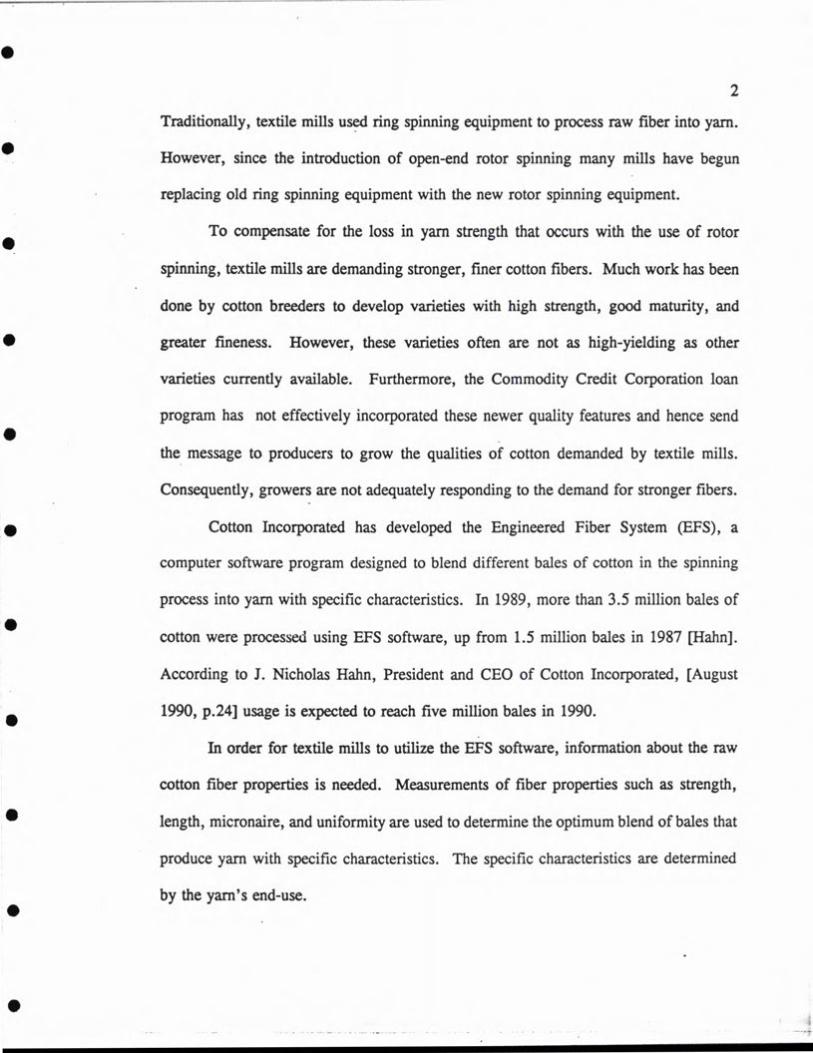
Traditionally, textile mills used ring spinning equipment to process raw fiber into yarn.
However, since the introduction of open-end rotor spinning many mills have begun
replacing old ring spinning equipment with the new rotor spinning equipment.
To compensate for the loss in yarn strength that occurs with the use of rotor
spinning, textile mills are demanding stronger, finer cotton fibers. Much work has been
done by cotton breeders to develop varieties with high strength, good maturity, and
• greater fineness. However, these varieties often are not as high-yielding as other
varieties currently available. Furthermore, the Commodity Credit Corporation loan
program has not effectively incorporated these newer quality features and hence send • the message to producers to grow the qualities of cotton demanded by textile mills.
Consequently, growers are not adequately responding to the demand for stronger fibers.
• Cotton Incorporated has developed the Engineered Fiber System (EFS), a
computer software program designed to blend different bales of cotton in the spinning
process into yarn with specific characteristics. In 1989, more than 3.5 million bales of
cotton were processed using EFS software, up from 1.5 million bales in 1987 [Hahn].
According to J. Nicholas Hahn, President and CEO of Cotton Incorporated, [August
1990, p.24] usage is expected to reach five million bales in 1990.
In order for textile mills to utilize the EFS software, information about the raw
cotton fiber properties is needed. Measurements of fiber properties such as strength,
• length, micronaire, and uniformity are used to determine the optimum blend of bales that
produce yarn with specific characteristics. The specific characteristics are determined
• by the yam's end-use.

3
The increased use of rotor spinning equipment combined with the development
and use of EFS software has created the need for stronger, finer cotton fibers. It has
also made expanded fiber property knowledge extremely important. Textile mills
contend that under the traditional cotton classing system, knowledge of the three fiber
properties measured (grade, staple, and micronaire), is not sufficient to determine the
spinnabiity of cotton fibers. Thus, the fiber property measurements must be expanded
to include measurements of the fiber properties about which mills want to know,
particularly strength and fineness. The use of High Volume Instrument (HVI) cotton
classing has somewhat remedied this problem.
Since 1980, the USDA Cotton Classing Division has been moving toward a more
sophisticated cotton classification system with the use of HVI classing machines. HVI
• machines measure strength, fiber length, length uniformity, micronaire, trash, and color.
HVI was first offered to cotton growers in the Lamesa, Texas area in 1980.
During the 1980 crop year, 305,000 bales, or three percent of the total US cotton crop,
were classed using HVI machines. In 1988, roughly one half of the US crop of 14.9
million bales was classed on HVI lines [USDA, 1980].
• In order to adequately address the problems of inadequate fiber property
assessment and the failure of the CCC loan program to reward quality cotton, the USDA
has established the National Advisory Committee on Cotton Marketing (NACCM). This
committee is composed of representatives of each of the cotton industry's seven
segments. The purpose of the NACCM is to review the cotton marketing system and
make recommendations as necessary. Particular emphasis is to be placed on areas
0

.
.
n
4
impacted by USDA programs such as cotton classing, cotton standards, and the CCC
price support loan structure. The following recommendations were made and accepted
[Moore]:
1) Federal laws will be modified by 1991 to allow quality factors other than grade, staple, and micronaire to be included in the price support structure.
2) HVI will become the official cotton classification system for price support loan purposes effective with the 1991 crop.
3) The loan structure will include a schedule of premiums and discounts for strength effective with the 1991 crop with a base strength of 24 to 25 grams per tex.
4) A premium range for micronaire of 3.7 to 4.2 will be added to the price support loan schedule. The micronaire base would be 3.5 to 3.6 and 4.3 to 4.9.
5) Cotton grades will be replaced with separate measurements of color and trash. Also, trash and color will be measured by instruments, rather than the classer, as soon as accurate technology is available.
6) USDA will study the potential for using length uniformity index in predicting the value of cotton fiber.
7) USDA will move forward rapidly to develop instruments for measuring maturity and fineness, which will be reflected with appropriate premiums and discounts in the price support loan schedule.
8) USDA will collect marketing data on HVI quality factors.
9) USDA will develop statistical models that will indicate premiums and discounts being paid for various fiber properties.
10) Transportation differentials will be studied to determine their equity and necessity.
The most important recommendations for the purposes of this paper are those that
deal with the inclusion of quality factors other than grade, staple, and micronaire in the
11
0

5
CCC price support structure. Also of importance are the discount, base, and premium
ranges established for strength and micronaire.
The Commodity Credit Corporation
The CCC publishes premium and discount schedules each year are used to
calculate the value of each unit of cotton commodity placed in the loan program.
40
Current premium and discount schedules use grade, staple, and micronaire as the basis-
for calculating cotton value. Tables 1 and 2 show the 1988 and 1989 premium/discount
schedules for Upland cotton. Included in the tables are the premium and discount ranges
• for grade, staple, and micronaire, and the actual premium and discount values associated
with each measurement.
It should be noted that there are no premiums for micronaire on the CCC loan
schedules. However, the NACCM has recommended that premiuums for micronaire and
premiums and discounts for strength be included in the CCC loan schedules. The
• micronaire range would be adjusted to include premiums for micronaire readings between
3.7 and 4.2. The base range for strength would be between twenty-four and twenty-five.
Premiums would be given for cotton with strengths higher than twenty-five. • The Schlafhorst Study
At the 1989 Beitwide Cotton Production Conference, Helmut Deussen of
• American Schlafhorst Company and Ludwig Neuhaus of W. Schlafhorst and Company
proposed a fiber property valuation system that more accurately reflects the relative
0
VS
.8 4) ItSOsJnOIrsO 0U',Ufl OStSIflP'S0 IflPtSLtsIflO O5JILf5O Iflein u'sIn.r
- - Os Ps'p rs. 2424.- 45 0 u's '.2 P'l 24 4') 0 00 PI) V's 0 '4 0'
N. C ss 5.0) 5-.-
C
0 0 05.0500 000 UW)P#IPPO CD CD CD CD If5Ltsu'S It5u'5O (4 (54.0-70 0' ol 0 l's us (54 V's Cu 00 pp u's 0' -0 .- 00 24 + +
5") + + .- 0 1") (''5 - +
5 •.. ••'•'' .. -D
4 ('4
P'S VS0m OV'SSfl s/5.rs4s V'su's.rsIu'5O 00.,5V,0 V'SV'sLI'sO 0)250 OQU's
'..-. 00u5.02s4 sfsu'sS'sJ O.7rsJu'sCu N.'OC'JV'0 0-' N.0'O 0.00 ('4 + .- p5') 0. P'S -.2 .- + Cs.) C-. C..) 55') .00 5'- 2.) 's .4 V's 2-. + 55') 0 .4 0 -
5555 ++++ 5s '. + '''-5'.-' ''-'
sO
515 11552505550 0 51505150 515011') usu')lrs w
-. N.0 -'7SISVS (sJ sf55 '05250 002'J)flO r'J55SIus '4'Sts ("512525.) + + 24 2'-. 0 115 0 515 -
5 5 5 5 .. S 7 •
7 5 5 3
4) -C 0
C'.) p"s ou u,oau,unu, ous.rswso )l'sW'5V'ssfSO 001250 01150 00V's..-OS
0 (5..) 525 0 N. V'S (1) V's .' 0 0' '7 0' ('.1 C 0' (P sO 0 0 0 11') • 5'5 s.-.-.- 5,55.-s.,,-. .-.-----. '- s.,,, 0:
O0P5'5&25ISIL150 CD, P'fl5J's%f, 0525.15)1.0 451/51251150 001150 .tsU'sO 0 a u .- .7 115 00 (5.) V5'O 0 N. 0 '00 0 u's 0 .- 2'- 0 11) 5'.) uS 00 0 /5.7 0'
SO C C'.) CS.) C',) (P 555 '7.00 .- 0' ("5 N.
'7 ''77 7777 5 7 75 c C 0
2
(S.) 0 u's s/S 515 0 515 51'S 0 Irs 45 V's u's 0 irs irs 0 0 5/5 5/5 Irs 0 0 0 515 0 V's 00 0 0 ('5-'. O0w's'7N. 1/SOON. 24N.N.N.u's r',lC,.)N.Ou'. 24000
-7.21150.555 00..-0.(P 515.0.00' .000'.) 0P)0'0 -' '7777 ''''7 '.7,.- 77.;-.;- • '7 0
Lu C
.2 u44)
so 05250 CDC) p5'511500,rsIr. lrsO,.rss.r,O 0O)fssI•)D /5515.1.0 1/50525 0u'5lJ's, 115
0 PP 0 515 55', ,-' 00 5". .- u's sf5 s/s 0.0 N. s/s u's '7000 0' u's'ON.00.-PJp"Ss/5 'O'05'-0pP 00,,-0'PP 1(5.0.00. 0.2510 ,
,, 5-.-.-- 5,5,.-'--' 5.--.
as C 4)
C0" VSu'sVSsrsu'sooI,s.rsu'svs u'sou'su'sus .rSOV'su'Su's 00115r 1)5515515 5(50 aPP 0(4t"SN.00su'sC.OQN. 00.01)50 00.rs.)u'sO p5'S0.p"S0 'OO'' Or'.)
".. 000.-r..)u-s s/s N.000,s-. O.Oruop.'s 002-0. 0-OP'S 05550: 4 555555. .- 5 ,. 5 ,
.455.) 5 5 5 5 5 5 55555555 5, 5,, u.s
o 4
50 (5.1 (5.4 (54 255 ('.1 0 4)
5%.) ('.4 ('4 Cs.) ('4 M"""" -7 -.2.7.7 0 'O'O
Cu U U 'A-'AC CO 0 1
LU
4) C55 0 - • ..s VS VS VS 0, .4 .. u.s .4 u.s C 420 0 VS 0 VS VS 42 0 41 Cu 42 42 - -. 0 .0 .0 0 4)4) LU 0. 0. U - LI -'0 0. 0. 5-.4 Cu .4 0-58
8. 3:3: 0 0 0 0 3: 0 0 0 3: 0 0 3: 0
- Cu VS 3:3: VS 5/544 VS VS Cu 0 _5 VS 3: 5153 VS I/S VS 3:1)5_) 5.01)53:115_I,,.) VS 3: VS L5 VS 3: VS
S

0 C C a-InOen - C: IDa.-
a. 0) 0 £ -
00 £ =
7
S
E
fl
I. en 41 0In.n000.n0000 Innno.n 0111000 01111110 01110 InIflIn .Q. W,r,I0Ina..n1n 0o,a.a.... encc- r.00 0I0p'. a.a,a.a.
7 T en 0, In 4 • + * I I
U
0 C o cc OeenOe.neo 11111,000 In000o 011)1110 0011) 11,11111,
* a. C a. In - on 1 en - In C + no en 0 111 C • 'rrr rrrr 'r
a DI
41 a.acInn.nInIn.nIn 0.11000 OIflOInIn AS-WE s,ee COInS
u... -r • r-rr rrr r-
o v 41
- 0 ID - oc In In .l 111 0000111 In 0 000 o In a In In C In In C 000 In e 11 -
0) In 0 ---------- ID en C c t - * a. C a. .. en It) en.
0 o a I10
en InOOInIrIIflOO.n.flln 00.1100 OIflOIflIn 1111111110 01110 0In0
en I,,,,, ......................---c
41-
.4.
- £ 0 In In In In 0 In 1110 0 0 0 In 0 In It) 00 In 00 0 0 0 In 0 0 In 20- - 111 0
I fl I
a. In0000000000 000InIn OIflInOO 000In oene 0)0In en- -InOmlnoa.a)ene oa.enaen O0a 111CC In enen InIna. '.... CInIn0a.a.a.0I- InOOIfl a,oa.InID IflIDa.OI IDO. CIflP...0 U -en I,.,,,, .................., ,_ 41 I I I
0 011
3 C 2 ID 1110 11100 fl eon no o Inc InO 00 In 00 In 00 In InC In 001) -- C--ID O,a.a.enene, 0 InC0a.
?COCO
2 a. IDIn 0
1'0)0 00,- -
2 - I I I S I 111) 1111 I I I - a -
C Ca. 000InInIn0InInOIn InInInOlt) InInOInO OIflInO 000 000U
92
22 5
•0 '. C
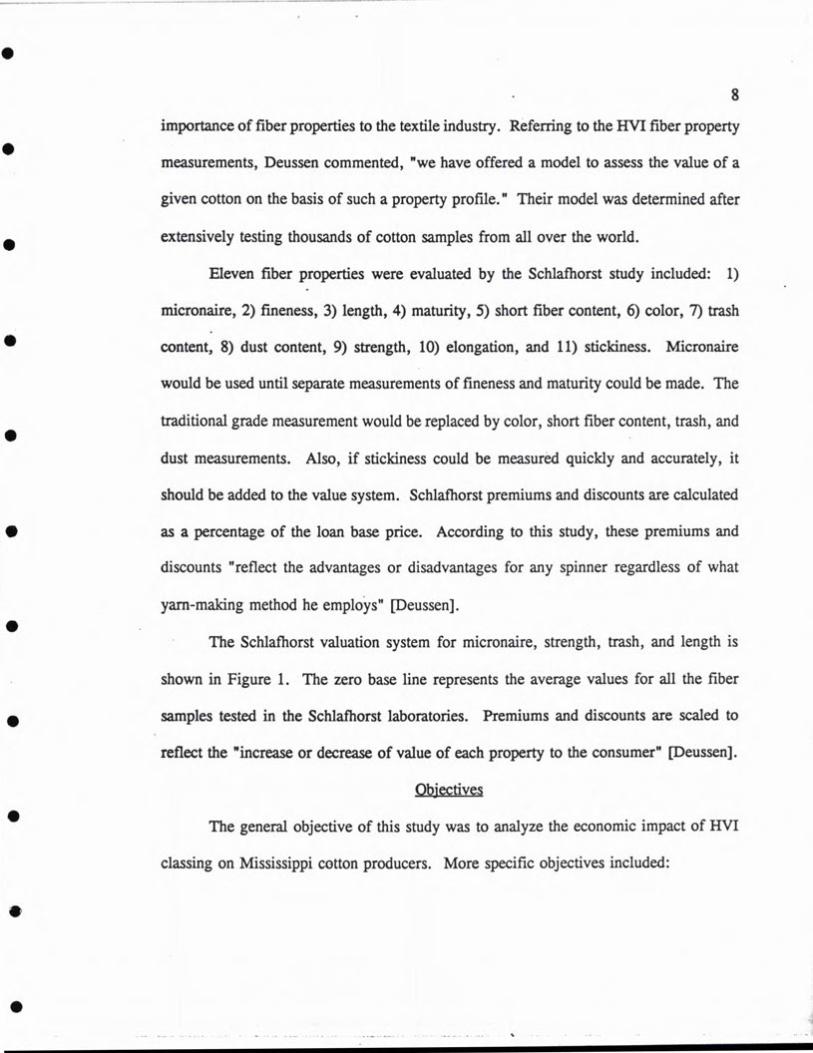
importance of fiber properties to the textile industry. Referring to the HVI fiber property
measurements, Deussen commented, "we have offered a model to assess the value of a
given cotton on the basis of such a property profile." Their model was determined after
• extensively testing thousands of cotton samples from all over the world.
Eleven fiber properties were evaluated by the Schlafhorst study included: 1)
micronaire, 2) fineness, 3) length, 4) maturity, 5) short fiber content, 6) color, 7) trash
content, 8) dust content, 9) strength, 10) elongation, and 11) stickiness. Micronaire
would be used until separate measurements of fineness and maturity could be made. The
traditional grade measurement would be replaced by color, short fiber content, trash, and 40
dust measurements. Also, if stickiness could be measured quickly and accurately, it
should be added to the value system. Schlafhorst premiums and discounts are calculated
• as a percentage of the loan base price. According to this study, these premiums and
discounts "reflect the advantages or disadvantages for any spinner regardless of what
yarn-making method he employs" [Deussen]. LI
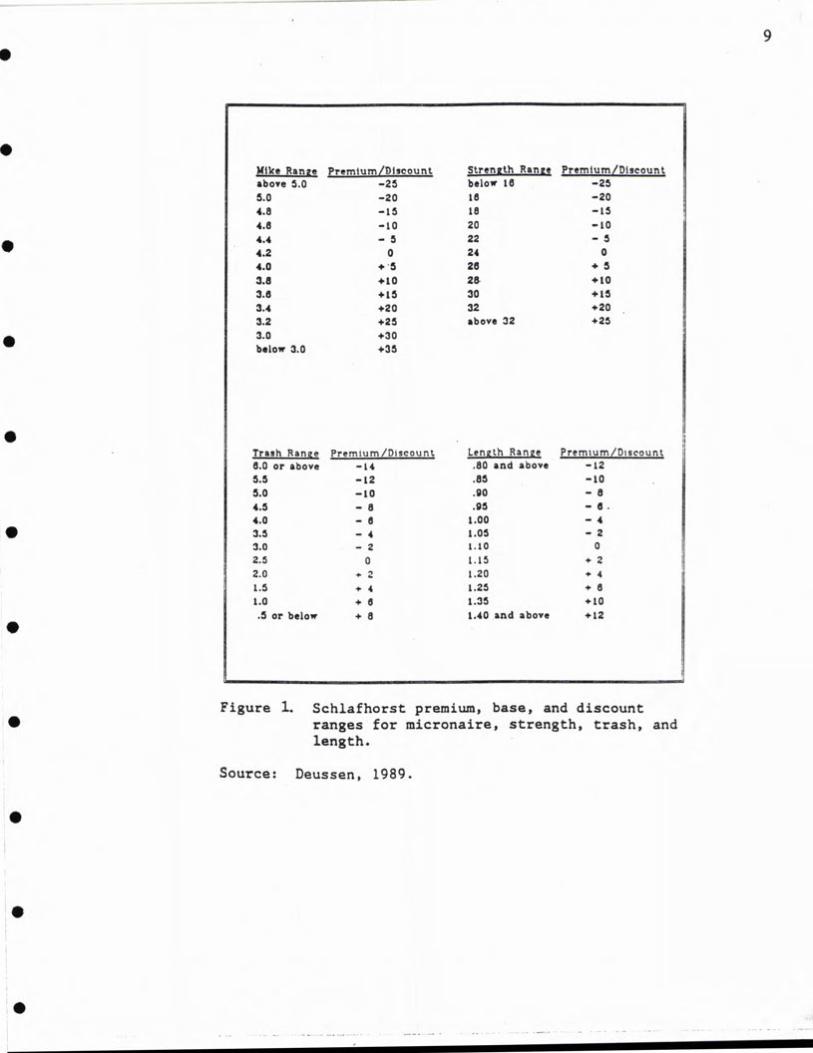
The Schlafhorst valuation system for micronaire, strength, trash, and length is
shown in Figure 1. The zero base line represents the average values for all the fiber
• samples tested in the Schlafhorst laboratories. Premiums and discounts are scaled to
reflect the "increase or decrease of value of each property to the consumer" [Deussen].
40 The general objective of this study was to analyze the economic impact of HVI
classing on Mississippi cotton producers. More specific objectives included:
.
LI
I
Mike Range Prernium/Dl900unt above 5.0 -25 5.0 -20 4.8 -15 4.8 -10 4.4 -5 4.2 0 4.0 +5 3.8 +10 3.6 +15 3.4 +20 3.2 +25 3.0 +30 below 3.0 +35
Strength Range Premlurn/Diseount below 18 -25 18 -20 18 -15 20 -10 22 -5 24 0 28 +5 2 +10 30 +15 32 +20 above 32 +25
S
Trash Range prerruum/Discour.t 8.0 or above -14 5.5 -12 5.0 -10 4.5 -8 4.0 -6 3.5 -4 3.0 -2 2.5 0 2.0 .2 1.5 + 4 1.0 + 6 .5 or below + 8
Length Range Prem1um/Dscount .80 and above -12 .85 -10 .90 -8 .95 -6.
1.00 -4 1.05 -2 1.10 0 1.15 +2 1.20 +4 1.25 +6 1.35 +10 1.40 and above +12
S
L
Figure 1. Schlafhorst premium, base, and discount S ranges for micronaire, strength, trash, and
length.
Source: Deussen, 1989.
S
r
10
1) Develop a database for cotton classed in Mississippi using the HVI
Ll classing system for 1988 and 1989.
2) Use descriptive statistical techniques to determine the fiber quality
40 characteristics of the 1988 and 1989 cotton crops in Mississippi.
3) Determine the economic impacts of current and alternative quality
premium/discount loan schedules on Mississippi cotton growers for 1988
and 1989.
Methods and Procedures
S
Objective one was to develop a data base for cotton classed using the HVI
classing system. The data base for this research consisted of USDA bale records that
were HVI classed in Mississippi for 1988 and 1989. In the spring of 1989 release of
information letters were sent to key personnel at each gin involved in the research. After
all the necessary releases were received, the data were received from the Greenwood
• classing office and were read into the MSU mainframe computer system.
The 1988 data set consisted of a total of 169,299 bales from fourteen gins across
the Mississippi Delta. The 1989 data set consisted of 203,357 bales from twenty gins
S across the Mississippi Delta.
Each bale record consisted of all the classing information for one bale. The data
consisted of gin code number, bale number, producer account number, grade, staple,
micronaire, strength, color code measurements; followed by reflectance (Rd), yellowness
(+b), trash, length, length uniformity, and date classed.
0
11
Objective two was to statistically describe the 1988 and 1989 data sets. The
Statistical Package for the Social Sciences (SPSS-X) was used to specify frequency
distributions for grade, staple, micronaire, strength, color, length, length uniformity,
and, for the 1989 data set, trash [SPSS-X User's Guide]. These distributions were used
to calculate what percentages of the 1988 and 1989 bales that fell into premium, base,
and discount ranges for each fiber property. The ranges used were those determined by
• the Commodity Credit Corporation, the National Advisory Committee on Cotton
Marketing, and Helmut Deussen of American Schlafhorst and Ludwig Neuhaus of W.
Schlafhorst and Company.
Objective three was accomplished through the use of a FORTRAN program that
was developed to calculate the value of a bale of cotton based on its property
• measurements. As a bale record is read into the FORTRAN program, its property
measurements are compared to established values within the program. Premiums and
discounts that have been specified within the program are applied to that bale based on
how its property measurements compare with the established values. The premiums and
discounts were then added to the base price and applied to an assumed five hundred
• pound bale to determine the value for each bale. The total value of the crop is
determined by adding the value per bale for all bales.
Analyses were made of current and alternative schedule valuations as calculated
40
by the FORTRAN program. Current loan schedules are those schedules which contain
CCC premiums and discounts for grade and staple, and discounts for micronaire.
Alternative loan schedules are schedules which contain all possible combinations of CCC
12
premiums and discounts for grade and staple,and Schlafhorst premiums and discounts for
micronaire, strength, length, and trash.
For both the 1988 and 1989 data sets, current and alternative loan schedule values
40
were calculated using the FORTRAN program. Comparisons of the value of the crop
under each schedule were made.
The economic impacts of the alternative schedules were estimated by using the
• 1988 and 1989 data sets. The 1988 data set represented roughly nine percent of the 1988
total Mississippi cotton crop and the 1989 data set represented roughly thirteen percent
of the 1989 crop. These estimations were made under the assumption that the remainder
of both crops would be similar to the data sets used in this study. Therefore, alternative
schedule values calculated for the 1988 and 1989 data sets were used to estimate the
• economic impacts of alternative schedules on the total cotton crops in Mississippi.
The 1988 CCC base price was 51.9 cents per pound, and the 1989 CCC base
price was 50.75 cents per pound. To calculate the value of a bale of cotton, the base
price per pound was multiplied by the appropriate percentages of premiums or discounts.
These percentages depended upon the fiber property measurements as shown in Figure
1. Assuming a five hundred pound bale, the adjusted base price was then multiplied by
five hundred to calculate the value per bale.
•
0
. 13
Results and Discussion
Frequency Distributions
Because the 1988 trash measurements were not made by a trashmeter, trash
ranges were not relevant to this data set. The trash distribution for 1988 was divided into
ranges corresponding to a grade with four as the first digit. However, the 1989 trash
• measurements were made by a trashmeter. Consequently, the distribution of 1989 trash
values was compared to the Schlalhorst discount, base, and premium ranges for trash.
Color and length uniformity were not compared to discount, base, and premium • ranges because these ranges are not currently used. However, the color distributions
were divided into ranges corresponding to a Strict Low Middling grade of forty-one.
• Length uniformity distributions were divided into ranges corresponding to descriptive
designations such as "Average - 80-82", "High - 83-85".
• Grade Distributions
The 1988 grade distribution was heavily concentrated within the CCC base range
of forty-one. A small percentage, 14.8, classed in the discount range of below forty-one. •
Slightly more than fifty-two percent of the 1989 grade values classed within the base
range while approximately thirty percent of the grade values classed within the discount
range. Figure 2 contains the 1988 and 1989 grade distributions as related to CCC
standards.
0
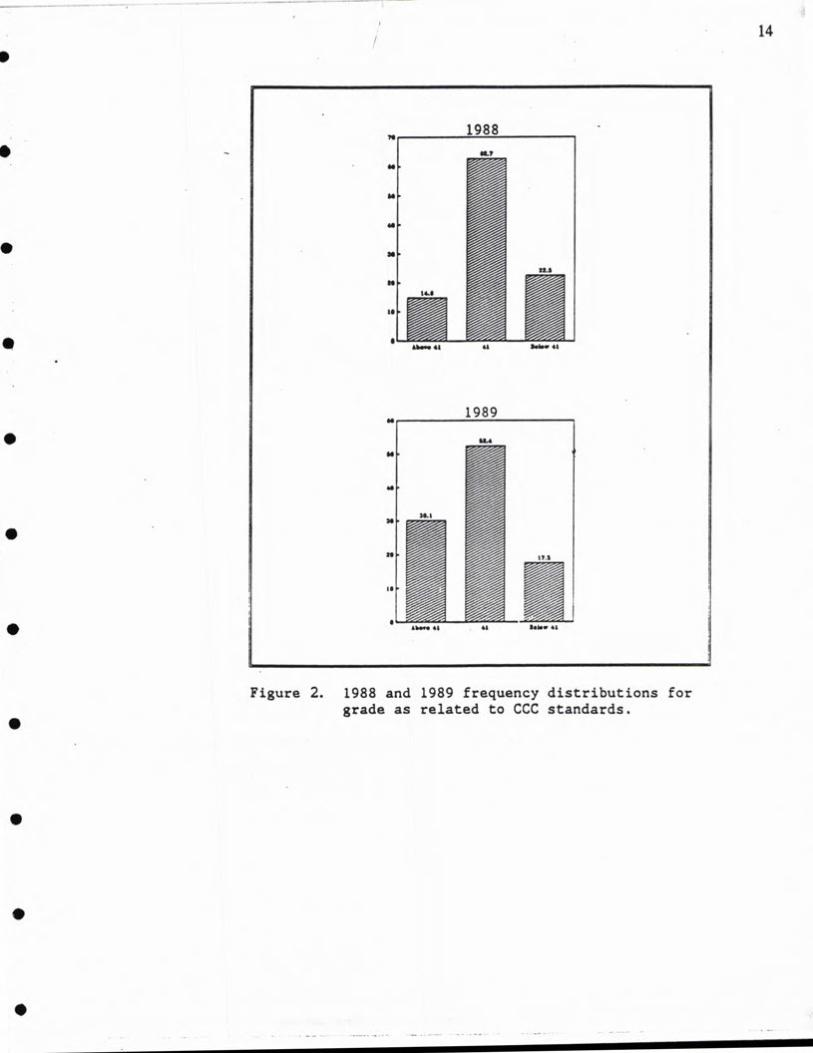
Figure 2. 1988 and 1989 frequency distributions for grade as related to CCC standards.
14
S
S
15
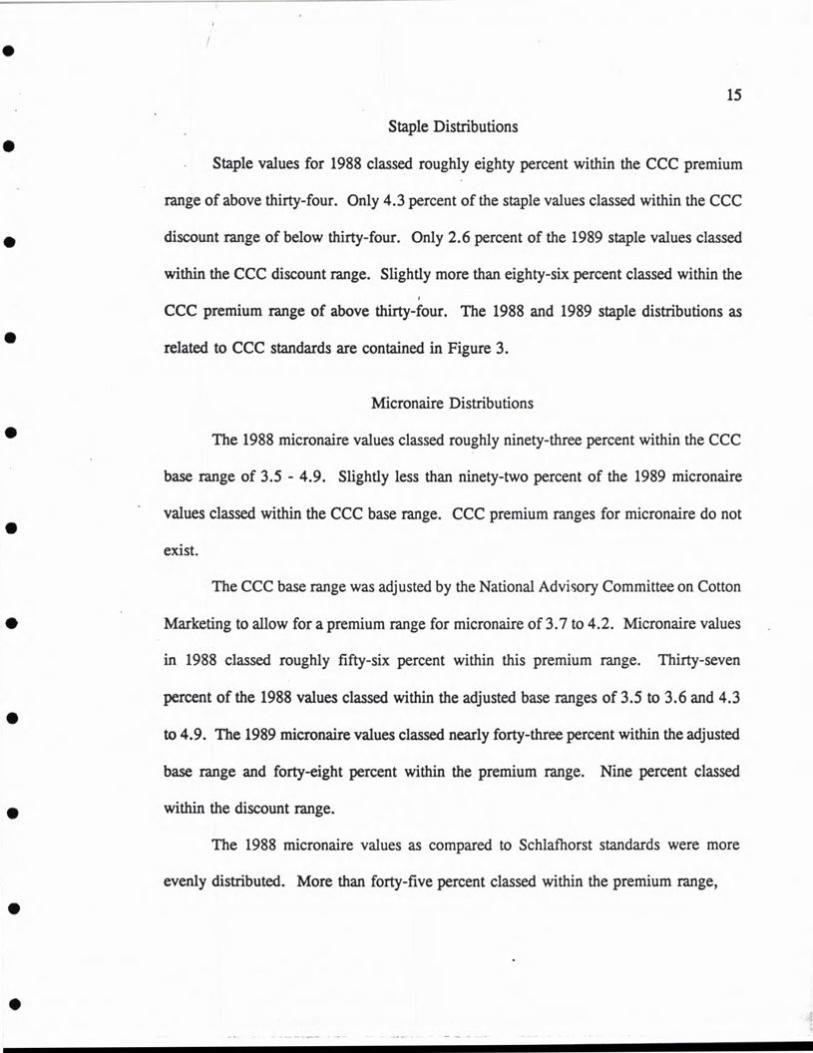
Staple Distributions LI
Staple values for 1988 classed roughly eighty percent within the CCC premium
range of above thirty-four. Only 4.3 percent of the staple values classed within the CCC
• discount range of below thirty-four. Only 2.6 percent of the 1989 staple values classed
within the CCC discount range. Slightly more than eighty-six percent classed within the
CCC premium range of above thirty-four. The 1988 and 1989 staple distributions as
related to CCC standards are contained in Figure 3.
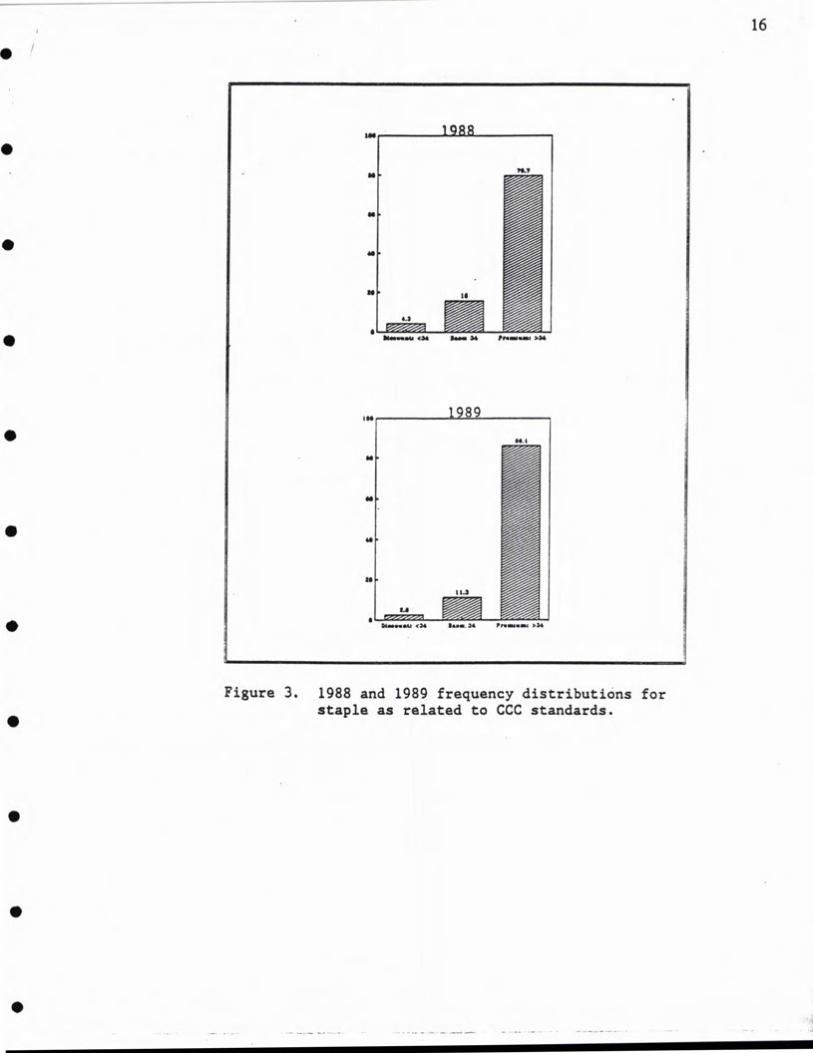
Micronaire Distributions
The 1988 micronaire values classed roughly ninety-three percent within the CCC
base range of 3.5 - 4.9. Slightly less than ninety-two percent of the 1989 micronaire
• values classed within the CCC base range. CCC premium ranges for micronaire do not
exist.
The CCC base range was adjusted by the National Advisory Committee on Cotton
• Marketing to allow for a premium range for micronaire of 3.7 to 4.2. Micronaire values
in 1988 classed roughly fifty-six percent within this premium range. Thirty-seven
percent of the 1988 values classed within the adjusted base ranges of 3.5 to 3.6 and 4.3
to 4.9. The 1989 micronaire values classed nearly forty-three percent within the adjusted
base range and forty-eight percent within the premium range. Nine percent classed
within the discount range.
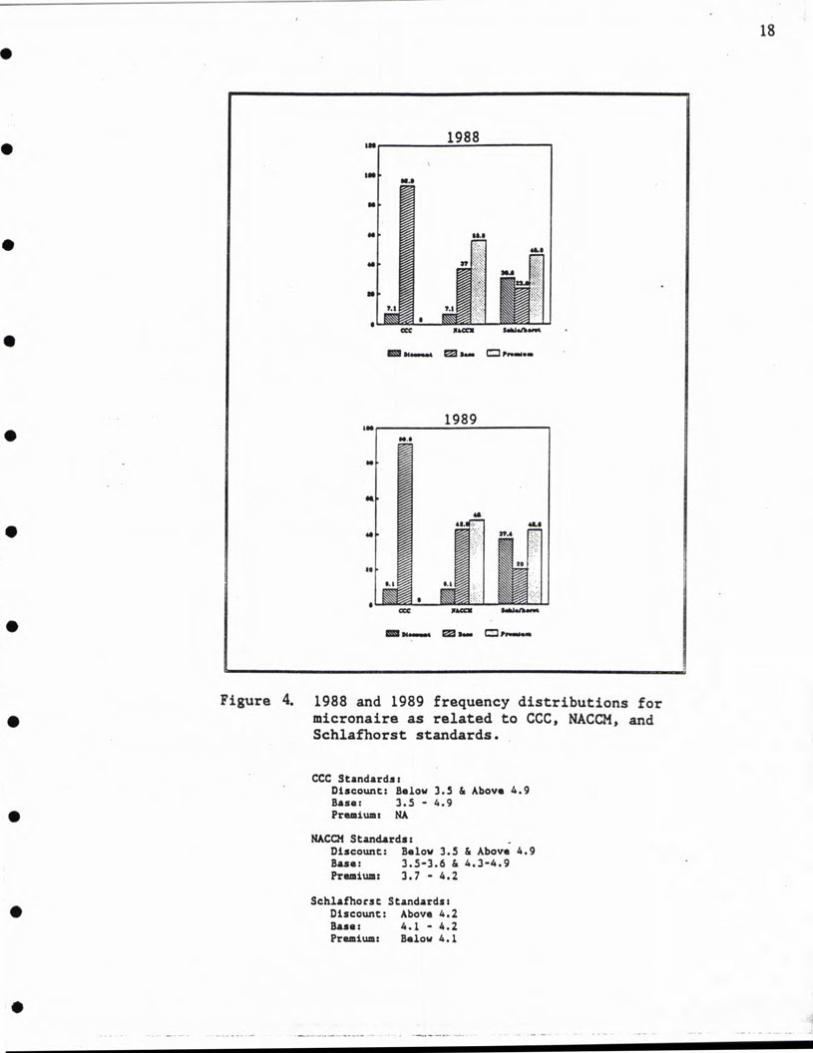
The 1988 micronaire values as compared to Schlafhorst standards were more
evenly distributed. More than forty-five percent classed within the premium range,
40
Lm
40
'.4 1988
I I 34
1989 '.4
.4
4.
4.
2I t I.S
4
Figure 3. 1988 and 1989 frequency distributions for staple as related to CCC standards.
16
[]

17
nearly thirty-one percent classed within the discount range, and close to twenty-four
percent classed within the base range. The 1989 micronaire values were similarly
distributed. Roughly forty-three percent classed within the premium range while slightly
• more than thirty-seven percent classed within the discount range. Only twenty percent
classed within the base range. Figure 4 contains the 1988 and 1989 distributions of
micronaire values as related to CCC, NACCM, and Schlafhorst standards.
Strength Distributions
Strength ranges as specified by the NACCM were identical to those specified by
• Deussen and Neuhaus of Schlafhorst. Results of the 1988 and 1989 strength distributions
are contained in Figure 5. 1988 strength values classed slightly more than forty-five
percent within the base ranges of twenty-four to twenty-five. Roughly twenty-three
percent classed within the discount range of below twenty-four. 1989 strength values
classed more than seventy percent within the premium range. Nearly twenty-six percent
• classed within the base range, and only 3.8 percent classed within the discount range.
Color Distributions
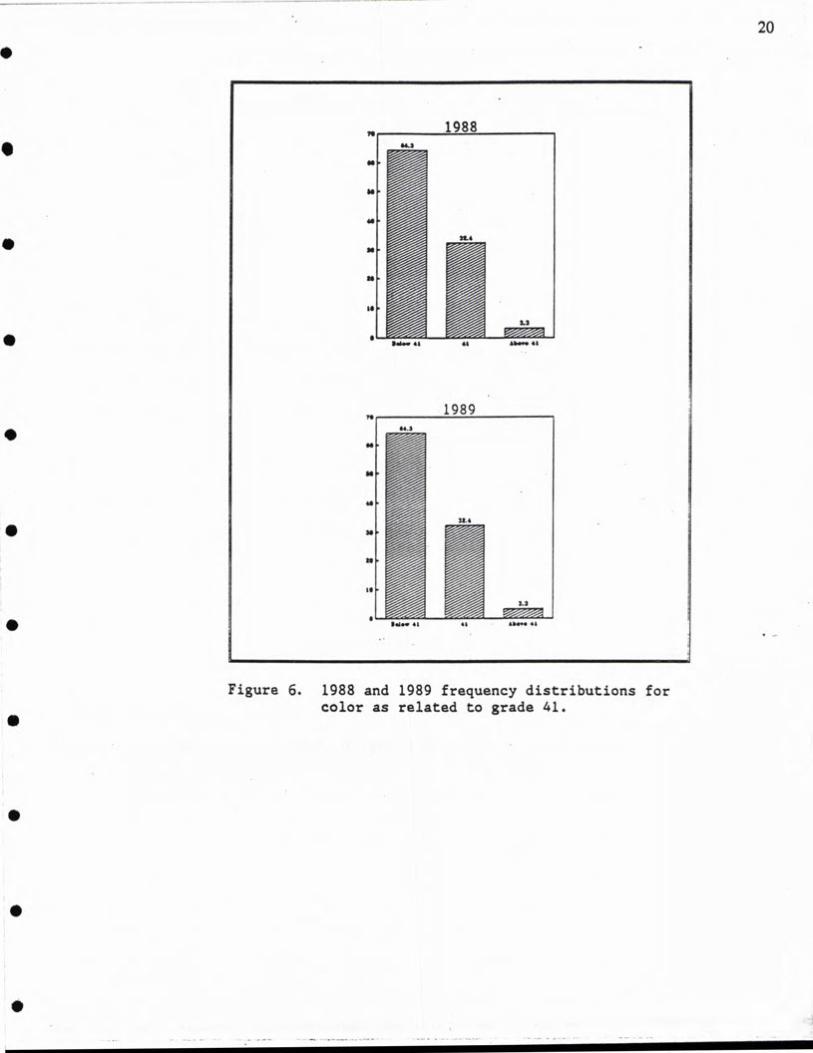
• The 1988 color measurements classed 62.6 percent around a value of forty-one.
This value corresponds to a Strict Low Middling White grade of forty-one. The 1989
color measurements classed 64.3 percent below a value of forty-one. Figure 6 contains
the 1988 and 1989 color distributions as related to a grade 41.
1988 In
MS
N
N as.. 'a..
s._ =
1989 'IS
Figure 4. 1988 and 1989 frequency distributions for micronaire as related to CCC, NACCM, and Schlafhorst standards.
CCC Standards: Discount: Below 3.5 & Above 4.9 Base: 3.5 - 4.9 Premiums NA
MACCM Standards: Discount: Below 3.5 & Above 4.9 Base: 3.5-3.6 & 4.3-4.9 Premium: 3.7 - 4.2
Schlafhorst Standards: Discount: Above 4.2 Base: 4.1 - 4.2 Premium: Below 4.1
09

1988 11
44,2
4'
31.1
30
13.2
to
414 ) 14 - *1 III
CM MACCM 4
4; 1989
.1
I.
41
II
•a
1I 1. 24
I
Figure 5. 1988 and 1989 frequency distributions for . strength as related to MACCM and Schlafhorst
standards.
19
S
LM
S
S
1988 'S '43
'S
I.
41
IL, Id 41 41 £'4.. 4*
1989 'I ".3
II
II
4. 32,4
34
as
is
I,.' 1.14. 41 41 £44 II
Figure 6. 1988 and 1989 frequency distributions for color as related to grade 41.
20
S
21
Trash Distributions
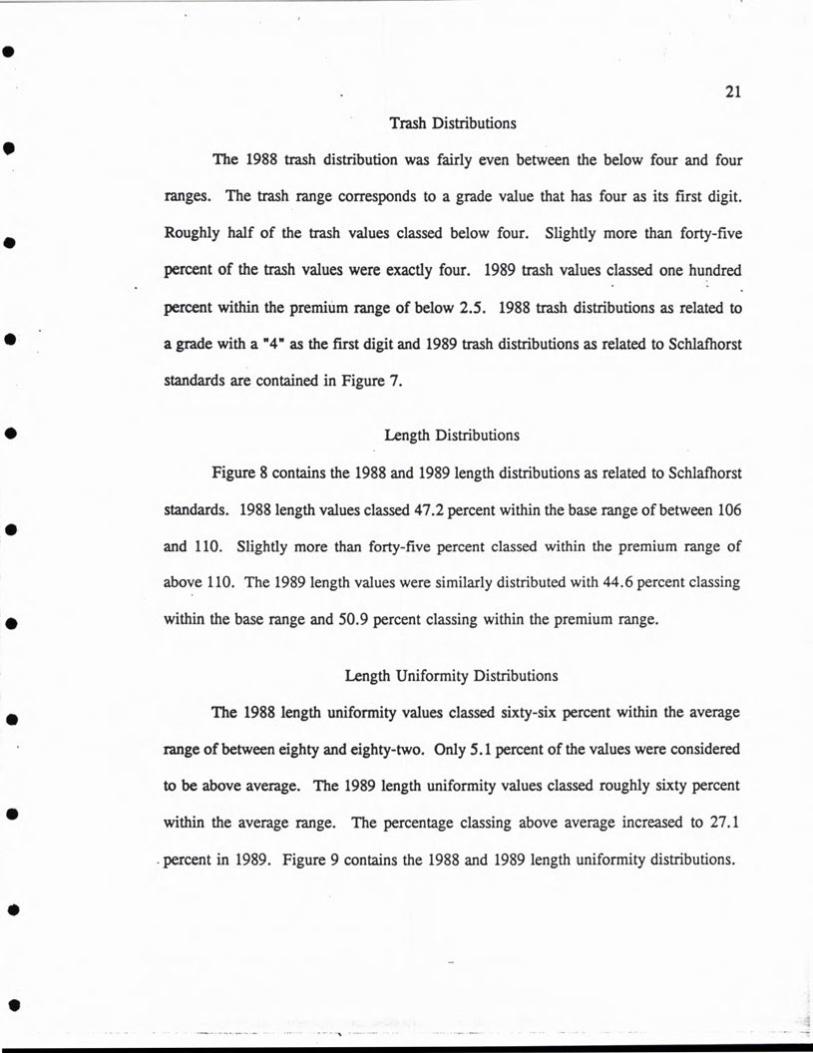
0 The 1988 trash distribution was fairly even between the below four and four
ranges. The trash range corresponds to a grade value that has four as its first digit.
Roughly half of the trash values classed below four. Slightly more than forty-five
percent of the trash values were exactly four. 1989 trash values classed one hundred
percent within the premium range of below 2.5. 1988 trash distributions as related to
• a grade with a "4" as the first digit and 1989 trash distributions as related to Schlafhorst
standards are contained in Figure 7.
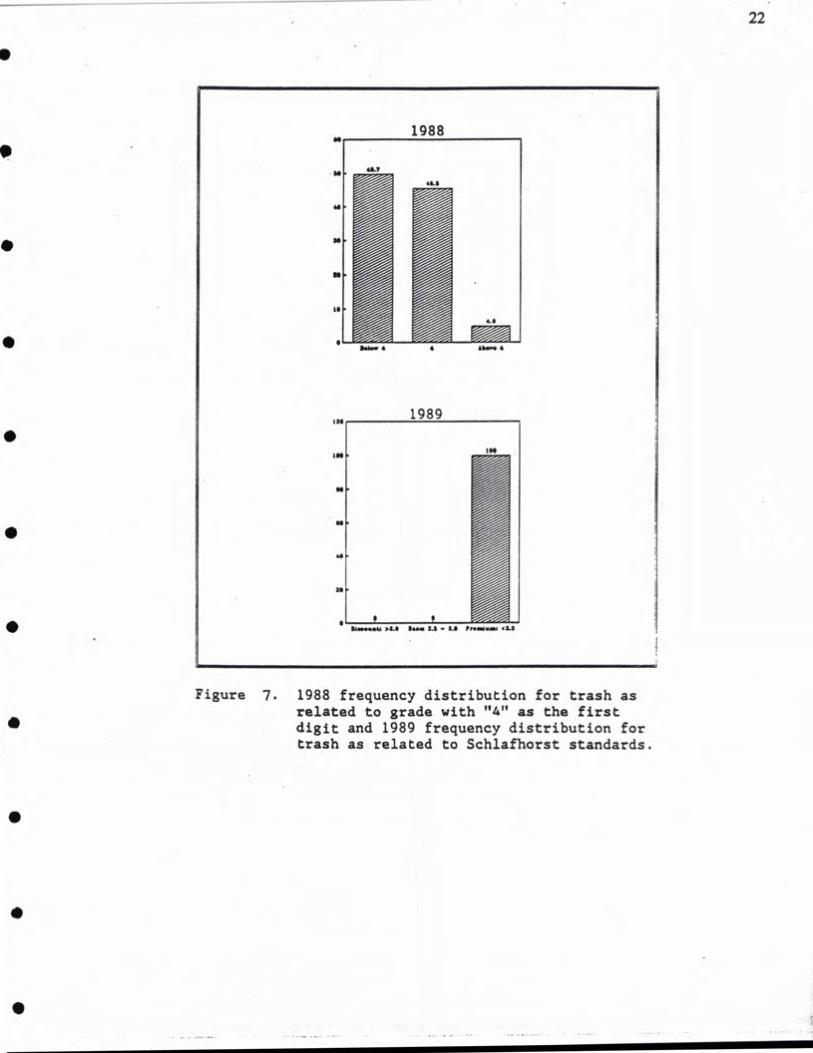
• Length Distributions
Figure 8 contains the 1988 and 1989 length distributions as related to Schlafhorst
standards. 1988 length values classed 47.2 percent within the base range of between 106
and 110. Slightly more than forty-five percent classed within the premium range of
above 110. The 1989 length values were similarly distributed with 44.6 percent classing
• within the base range and 50.9 percent classing within the premium range.
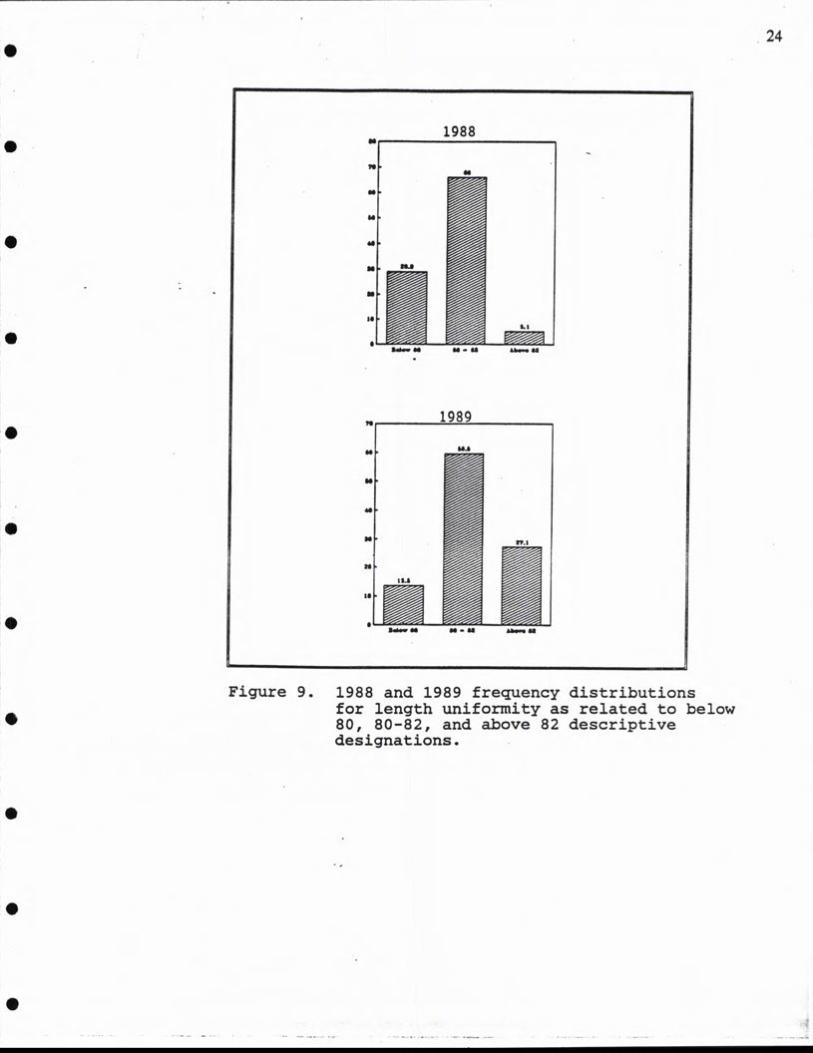
Length Uniformity Distributions
do The 1988 length uniformity values classed sixty-six percent within the average
range of between eighty and eighty-two. Only 5.1 percent of the values were considered
to be above average. The 1989 length uniformity values classed roughly sixty percent
within the average range. The percentage classing above average increased to 27.1
percent in 1989. Figure 9 contains the 1988 and 1989 length uniformity distributions.
El
0
0
S
1988 II
45.,
41.1
41
a.
a.
I.
5*1.. 4
III 1989
Figure 7. 1988 frequency distribution for trash as related to grade with "4" as the first digit and 1989 frequency distribution for trash as related to Schlafhorst standards.
22
S
S
S
23
Lm 1988
I.
4L2
S
I....0 4144 I 104-11$
Figure 8. 1988 and 1989 frequency distributions for length as related to Schlafhorst
• standards.
•
r
1988 SI
N U
N
N
4.
N Sal
I.'
1989
N
Sal
I is
*1
4.... U
ror iengtn unirormity as re.Latea to neiow 80, 80-82, and above 82 descriptive designations.
24
25
Economic Analysis
The 1988 and 1989 data sets were used to analyze the economic impacts of
various premium and discount scenarios. The 1988 analysis was conducted for current
and alternative schedules. Current schedule analysis was conducted using Commodity
Credit Corporation premiums and discounts for grade and staple and discounts for
micronaire. Alternative schedule analyses were conducted using all possible
combinations of Commodity Credit Corporation premiums and discounts for grade and
staple combined with Schlafhorst premiums and discounts for micronaire, strength, and
length. Again, as 1988 trash readings were not made by a trashmeter, the trash
premiums and discounts were not applied to this data set. There were sixteen possible
combinations of alternative schedules. Results of the 1988 analysis are presented in fl
Table 3.
The 1989 analysis was also conducted on current and alternative schedules. 1989
• current schedules are the same as those used in 1988.
Alternative schedules include the same premiums and discounts as the 1988 data
analysis plus Schlafhorst premiums and discounts for trash. There were thirty-two
possible combinations of alternative schedules. Results of the 1989 analysis are
presented in Table 4.
• Current schedule values are calculated by adding or subtracting the appropriate
CCC premiums or discounts for grade, staple, and micronaire to the CCC base price.
The adjusted base price is then multiplied by an assumed five hundred pound bale to
• calculate the value per bale.
26
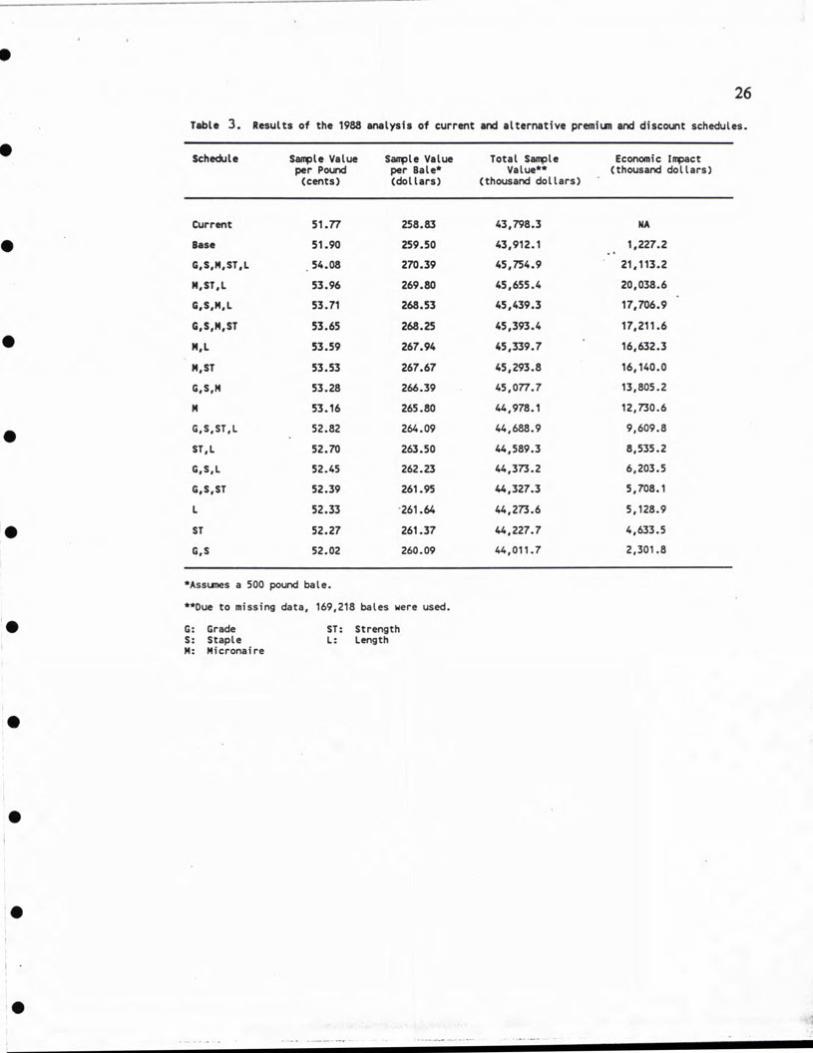
Table 3. Results of the 1988 analysis of current and alternative premium and discount schedules.
Schedule Sample Value Sample Value per Pound per Bale* (cents) (dollars)
Total Sample Value**
(thousand dollars)
Economic Impact (thousand dollars)
Current 51.77 258.83 43,798.3 NA
Base 51.90 259.50 43,912.1 1,227.2
G,S,M,ST,L 54.08 270.39 45,754.9 21,113.2
M,ST,L 53.96 269.80 45,655.4 20,038.6
G,S,M,L 53.71 268.53 45,439.3 17,706.9
G,S,M,ST 53.65 268.25 45,393.4 17,211.6
M,L 53.59 267.94 45,339.7 16,632.3
M,ST 53.53 267.67 45,293.8 16,140.0
G,S,M 53.28 266.39 45,077.7 13,805.2
M 53.16 265.80 44,978.1 12,730.6
G,S,ST,L 52.82 264.09 44,688.9 9,609.8
ST,L 52.70 263.50 44,589.3 8,535.2
G,S,L 52.45 262.23 44,373.2 6,203.5
G,S,ST 52.39 261.95 44,327.3 5,708.1
L 52.33 261.64 44,273.6 5,128.9
ST 52.27 261.37 44,227.7 4,633.5
G,S 52.02 260.09 44,011.7 2,301.8
a 500 pound baLe.
**Due to missing data, 169,218 bales were used.
G: Grade ST: Strength 5: Staple 1: Length 4: Micronaire
S
27
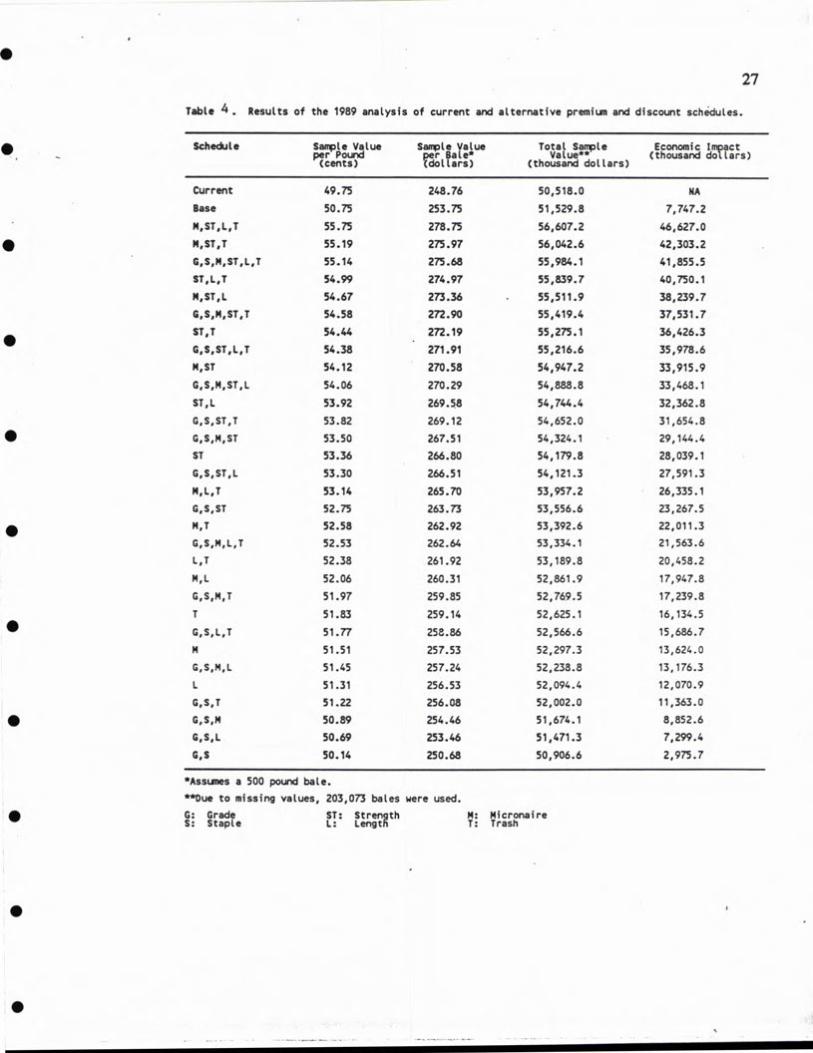
Table 4 . Results of the 1989 analysis of current and alternative premium and discount schedules.
Schedule Sample Value Sample Value TotaL SarrLe Economic Impact per Pound per Bale* VaLue** (thousand dollars) (cents) (dollars) (thousand dollars)
Current 49.75 248.76 50,518.0 NA
Base 50.75 253.75 51,529.8 7,747.2
M,ST,L,T 55.75 278.75 56,607.2 46,627.0
M, ST, T 55.19 275.97 56,042.6 42,303.2
G,S,P4,ST,L,T 55.14 275.68 55,984.1 41,855.5
ST,L,T 54.99 274.97 55,839.7 40,750.1
M,ST,L 54.67 273.36 55,511.9 38,239.7
G,S,M,ST,T 54.58 272.90 55,419.4 37,531.7
ST,T 54.44 272.19 55,275.1 36,426.3
G,S,ST,L,T 54.38 271.91 55,216.6 35,978.6
M,SI 54.12 270.58 54,947.2 33,915.9
G,S,M,ST,L 54.06 270.29 54,888.8 33,468.1
ST,I. 53.92 269.58 54,744.4 32,362.8
G,S,ST,T 53.82 269.12 54,652.0 31,654.8 • G,S,M,ST 53.50 267.51 54,324.1 29,144.4
ST 53.36 266.80 54,179.8 28,039.1
G,S,ST,L 53.30 266.51 54,121.3 27,591.3
P4,1,1 53.14 265.70 53,957.2 26,335.1
G,S,ST 52.75 263.73 53,556.6 23,267.5
• P4,1 52.58 262.92 53,392.6 22,011.3
G,S,M,L,T 52.53 262.64 53,334.1 21,563.6
L,1 52.38 261.92 53,189.8 20,458.2
P4,1 52.06 260.31 52,861.9 17,947.8
G,S,M,T 51.97 259.85 52,769.5 17,239.8
1 51.83 259.14 52,625.1 16,134.5
G,S,L,T 51.77 258.86 52,566.6 15,686.7
N 51.51 257.53 52,297.3 13,624.0
G,S,M,L 51.45 257.24 52,238.8 13,176.3
1 51.31 256.53 52,094.4 12,070.9
G,S,T 51.22 256.08 52,002.0 11,363.0 • G,S,M 50.89 254.46 51,674.1 8,852.6
G,S,L 50.69 253.46 51,471.3 7,299.4
G,S 50.14 250.68 50,906.6 2,975.7
*Assumes a 500 pound bate.
**Due to missing values, 203,073 bales were used. • G: Grade ST: Strength N: Nicronaire 5: Staple L: Length T: Trash
•
•
W.
Alternative schedule values are calculated by multiplying the CCC base price by [i
appropriate Schlafhorst premium or discount percentages for micronaire, strength, length,
and trash. The appropriate CCC premiums or discounts for grade and staple are then
• added to or subtracted from the adjusted base price to calculate a price per pound. This
price is multiplied by an assumed five hundred pound bale to calculate the value per bale.
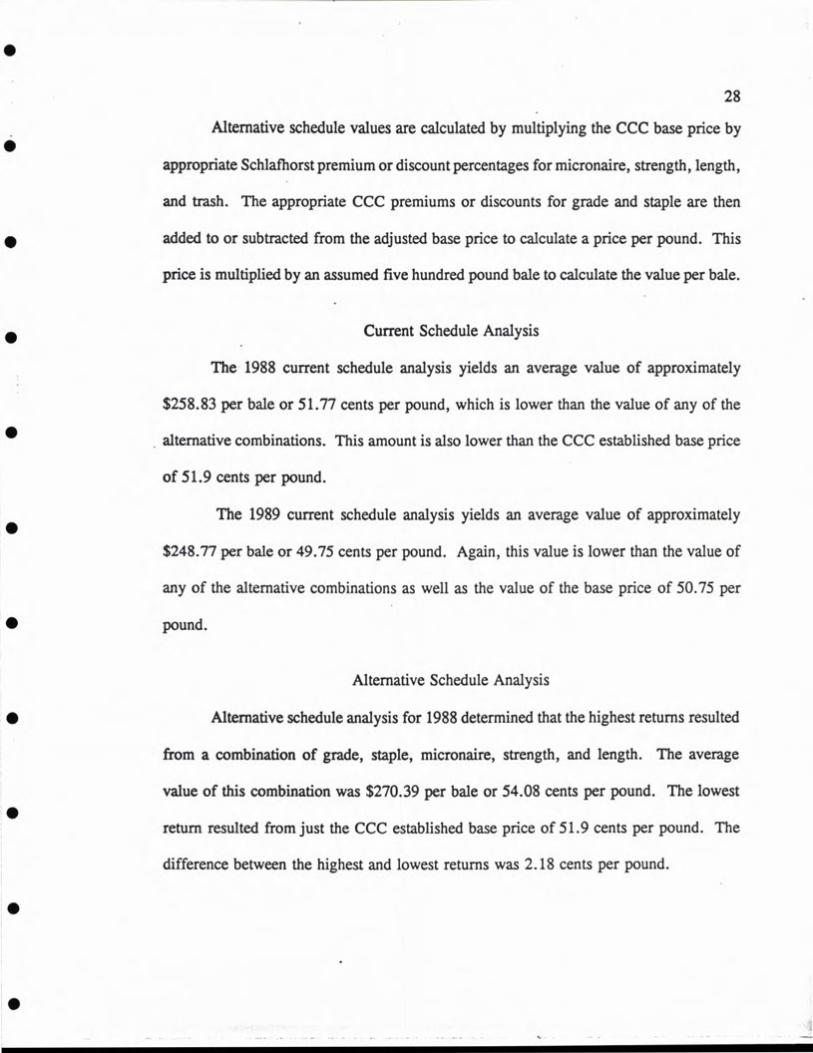
Current Schedule Analysis
The 1988 current schedule analysis yields an average value of approximately
$258.83 per bale or 51.77 cents per pound, which is lower than the value of any of the
alternative combinations. This amount is also lower than the CCC established base price
of 51.9 cents per pound.
The 1989 current schedule analysis yields an average value of approximately
$248.77 per bale or 49.75 cents per pound. Again, this value is lower than the value of
any of the alternative combinations as well as the value of the base price of 50.75 per
• pound.
Alternative Schedule Analysis
• Alternative schedule analysis for 1988 determined that the highest returns resulted
from a combination of grade, staple, micronaire, strength, and length. The average
value of this combination was $270.39 per bale or 54.08 cents per pound. The lowest
return resulted from just the CCC established base price of 51.9 cents per pound. The
difference between the highest and lowest returns was 2.18 cents per pound.
•
IU
0

29
The combination of micronaire, strength, length, and trash resulted in the highest
returns for 1989. The average value of this combination was $278.75 per bale or 55.75
cents per pound. The lowest returns resulted from a combination of grade and staple at
$250.68 per bale or 50.14 cents per pound. The difference between the highest and
lowest returns was 5.61 cents per pound.
Combinations that included strength tended to yield a higher return than
combinations that did not include strength. It is reasonable to assume that this is due to
the high strength values that occurred in 1989.
Economic Impacts
The economic impact on Mississippi cotton producers associated with each
alternative schedule combination was estimated by multiplying the total number of bales
harvested in Mississippi by the difference between the alternative value per bale and the
current value per bale. This, of course, assumes that the sample of HVI bales accurately
• represents the entire Mississippi cotton crop for these years. In addition to previously
described information, Tables 3 and 4 also contain the estimated economic impacts
associated with each alternative schedule combination.
To further illustrate how this impact is calculated, consider the following
examples:
Total bales harvested in Mississippi in 1988: 1,825,999 1988 current schedule value per bale: $258.83 1988 alternative (G,S,ST,L) schedule value/bale: $264.09
($264.09 - $258.83) x 1,825,999 = $9,609,797.28
fl
.
•
•
0
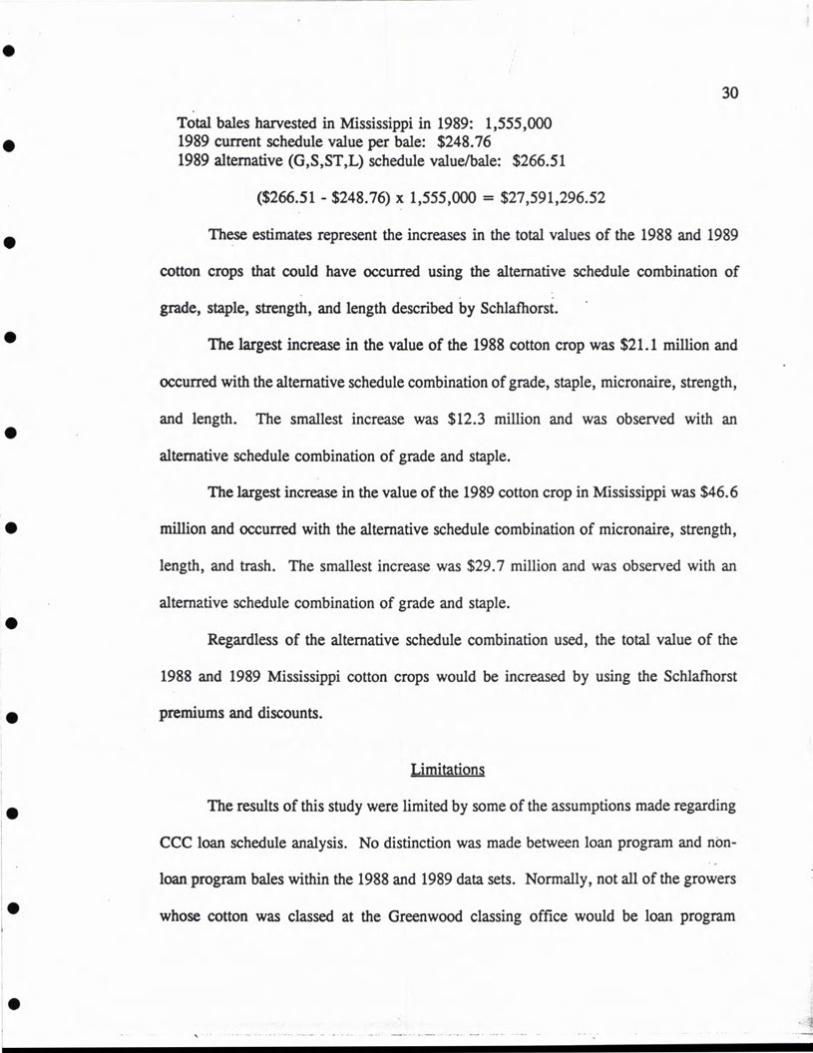
Total bales harvested in Mississippi in 1989: 1,555,000 1989 current schedule value per bale: $248.76 1989 alternative (G,S,ST,L) schedule value/bale: $266.51
($266.51 - $248.76) x 1,555,000 = $27,591,296.52
These estimates represent the increases in the total values of the 1988 and 1989
cotton crops that could have occurred using the alternative schedule combination of
grade, staple, strength, and length described by Schlafhorst.
The largest increase in the value of the 1988 cotton crop was $21.1 million and
occurred with the alternative schedule combination of grade, staple, micronaire, strength,
and length. The smallest increase was $12.3 million and was observed with an 40
alternative schedule combination of grade and staple.
The largest increase in the value of the 1989 cotton crop in Mississippi was $46.6
• million and occurred with the alternative schedule combination of micronaire, strength,
length, and trash. The smallest increase was $29.7 million and was observed with an
alternative schedule combination of grade and staple. fl
Regardless of the alternative schedule combination used, the total value of the
1988 and 1989 Mississippi cotton crops would be increased by using the Schlafhorst
premiums and discounts.
Limitations
The results of this study were limited by some of the assumptions made regarding
CCC loan schedule analysis. No distinction was made between loan program and non-
loan program bales within the 1988 and 1989 data sets. Normally, not all of the growers
whose cotton was classed at the Greenwood classing office would be loan program
Ll
31
participants. Thus, loan schedule analysis was conducted on bales whose loan program
status was not known.
The bale values calculated in this study do not necessarily reflect the value of the
cotton crop in Mississippi. If the market price were above the loan price then the bale
values would have been determined by the market price. Analysis was not conducted
using any prices other than base prices as established by the Commodity Credit
Corporation.
It was also assumed that premiums and discounts included in the CCC schedule
for quality factors other than grade, staple, and micronaire would be those developed by
Deussen and Neuhaus of Schlalhorst. The USDA would probably develop its own
premiums and discounts which may or may not be similar to those developed at
• Schlafhorst.
Conclusions
• Fiber property means were similar to the base ranges for each fiber property
indicating that appropriate range values are being used. However, a large percentage of
1989 strength and micronaire readings were in the premium ranges. This could be
• attributed to 1989 growing season conditions such as rainfall, temperature, production
practices, harvesting practices, etc.
Economic analysis of current and alternative loan program schedules revealed that
any combination of premiums and discounts for the given data sets resulted in higher
returns than would be received under the current schedule. The current schedule for
1 1988 returns totaled 51.77 cents per pound as compared to an alternative schedule
9
32
combination of grade, staple, micronaire, strength, and length worth 54.08 cents per
pound. When fiber properties were compared individually, a schedule of only micronaire
premiums and discounts resulted in the highest return of 53.16 cents per pound.
Current and alternative economic analysis for 1989 revealed that current schedule
returns totaled 49.75 cents per bale as compared to an alternative schedule of micronaire,
strength, length, and trash worth 55.75 cents per pound. The highest returns on a per
fiber property basis were realized with strength at 53.36 cents per pound. Regardless
of which combination of fiber properties was used, alternative schedules resulted in a
higher price per pound than would have been received under current CCC loan schedules C
given these data sets.
Economic impact analysis revealed that in 1988 the largest increase in the total
• value of the Mississippi cotton crop was $21.1 million and occurred with an alternative
schedule combination of grade, staple, micronaire, strength, and length. The largest
increase in total value in 1989 was $46.6 million and resulted from an alternative • combination of micronaire, strength, length, and trash.
•
F]
•
0
BIBLIOGRAPHY
• Deussen, Helmut. "Cotton Fiber Quality and Marketing - What are the Reasons for Change?" Paper Presented at the 1989 Beitwide Cotton Production Conference, Nashville, TN, 3-4 January 1989.
Deussen, Helmut, and Ludwig Neuhaus. "Why Does the Need for Finer, Stronger, and • Cleaner Cotton Fibers Require a Change in the Cotton Grading and Marketing
System?" January 1988.
Forrester, Mary Helen. "The Economic Impacts of High Volume Instrument Cotton Classing on Mississippi Cotton Producers." Mississippi State University,
• Agricultural Economics, Thesis, December 1990.
Hahn, Nicholas, J. "A Profitable Partnership." Cotton Grower, August 1990 p. 24.
_____ "Job 1." Cotton Grower, May 1990, p. 49.
Moore, Jesse F. "Update on USDA Advisory Committee on Cotton Marketing." Paper Presented at the 1989 Beitwide Cotton Production Conference, Nashville, TN, 3-4 January 1989.
SPSS-X User's Guide, 2nd edition. SPSS Inc., Chicago, Illinois, 1986.
U.S. Department of Agriculture. Agricultural Marketing Service. Cotton Division. The Classification of Cotton, handbook No. 566. Washington, D.C.: Government Printing Office, April 1980.
• •
33
.
0

Mississippi State University does not discriminate on the basis of race, color, religion, national origin, sex, age or handicap.
In conformity with Title IX of the Education Amendments of 1972 and Section 504 of the Rehabilitation Act of 1973, Joyce B. Giglioni, Assistant to the President, 610 Allen Hall, P.O. Drawer J, Mississippi State, Mississippi 39762, office telephone number 325-3221, has been designated as the responsible employee to coordinate efforts to carry out responsibilities and make investigatiol of complaints relating to discrimination.