Embed Size (px)
Citation preview
1
Agricultural and Applied Economics 637
General Introduction to MATLAB
I believe the best way to really learn econometrics is to go inside the black box. As such in our
next two sessions we will develop “native” computer code that is used to estimate the parameters
of the classical regression model (CRM) and calculate associated regression-based statistics. We
have found that the MATLAB software package is a very useful tool for obtaining an
understanding of applied econometrics as it allows you to directly translate what is presented in
class into an operational piece of software. MATLAB is used extensively by econometricians.
The best way to start learning MATLAB is to use it. This workshop will take you through a
basic introduction of the software and familiarize you with the programming language. You’ll
want to save your code when you are finished, as we’ll build on it over the next few days. Be
aware: the steps outlined here are just one way of doing things. There are many ways to edit,
run, code, etc., as coding is a very personal thing. In AAE637 you will be exposed to a variety
of methods to undertake estimation and you will invariably develop your own programming
style. Through the years, I have found a number of strategies that help with the development and
debugging of my own computer code. I will offer these insights to you over the course of your
taking AAE637. I hope you find them useful.
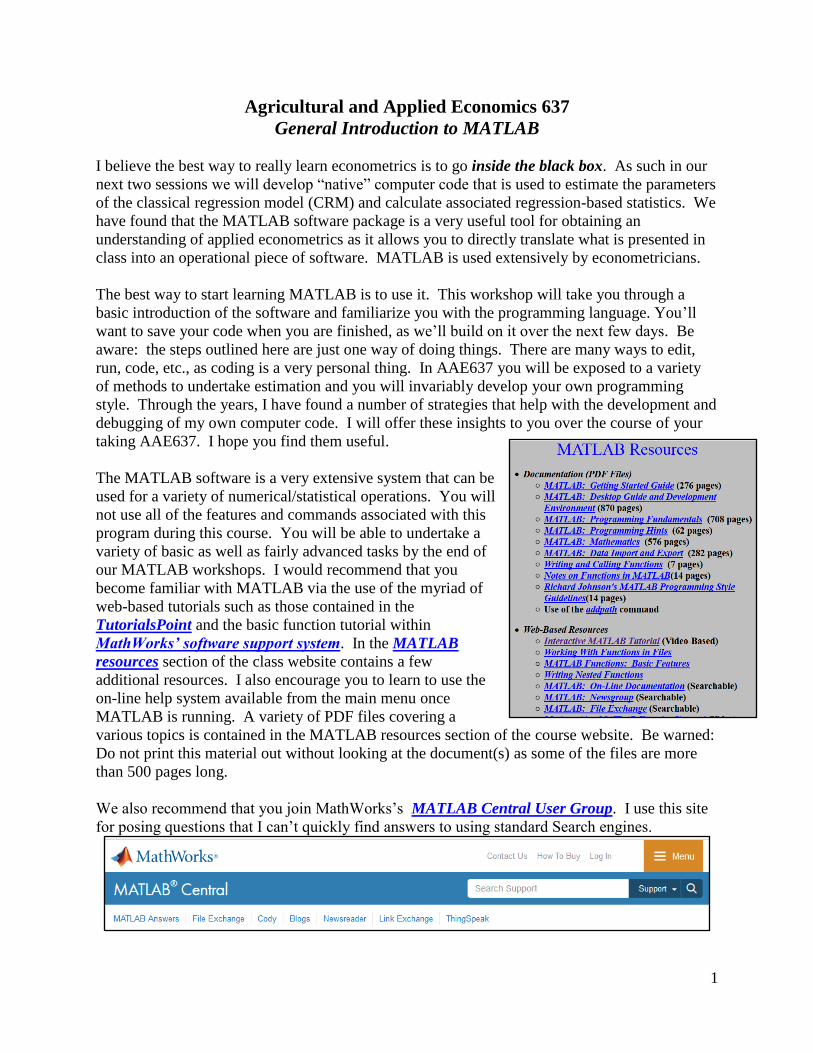
The MATLAB software is a very extensive system that can be
used for a variety of numerical/statistical operations. You will
not use all of the features and commands associated with this
program during this course. You will be able to undertake a
variety of basic as well as fairly advanced tasks by the end of
our MATLAB workshops. I would recommend that you
become familiar with MATLAB via the use of the myriad of
web-based tutorials such as those contained in the
TutorialsPoint and the basic function tutorial within
MathWorks’ software support system. In the MATLAB
resources section of the class website contains a few
additional resources. I also encourage you to learn to use the
on-line help system available from the main menu once
MATLAB is running. A variety of PDF files covering a
various topics is contained in the MATLAB resources section of the course website. Be warned:
Do not print this material out without looking at the document(s) as some of the files are more
than 500 pages long.
We also recommend that you join MathWorks’s MATLAB Central User Group. I use this site
for posing questions that I can’t quickly find answers to using standard Search engines.
2
As you can tell by the MATLAB code section of the class website, there are lots of sources of
information that be accessed to answer specific questions about coding using the MATLAB
language. When searching the net be specific in your search criteria. I am always amazed at
how quickly I can find an answer to a programming question via a specific question. My search
philosophy can be characterized as: If I am having this problem, someone else has tried to solve
the same problem by going to the net for help.
Note: Mathworks has set up a unique web addressing system for their native
commands/functions. Suppose you are trying to use some MATLAB code and it contains the
following command: bwg_proc. To find MATLAB’s reference entry for this command type
the following URL:
https://www.mathworks.com/help/matlab/ref/bwg_proc.html
Given that you are an enrolled graduate student @ the UW, you can access
almost all of the MATLAB software using the UW license at no cost. You can
obtain a copy form the UW’s Campus Software Library. Versions for
Window$ and Macs are available. This software is also available in various
computer labs across campus including the AAE lab and the Department’s
Remote server.
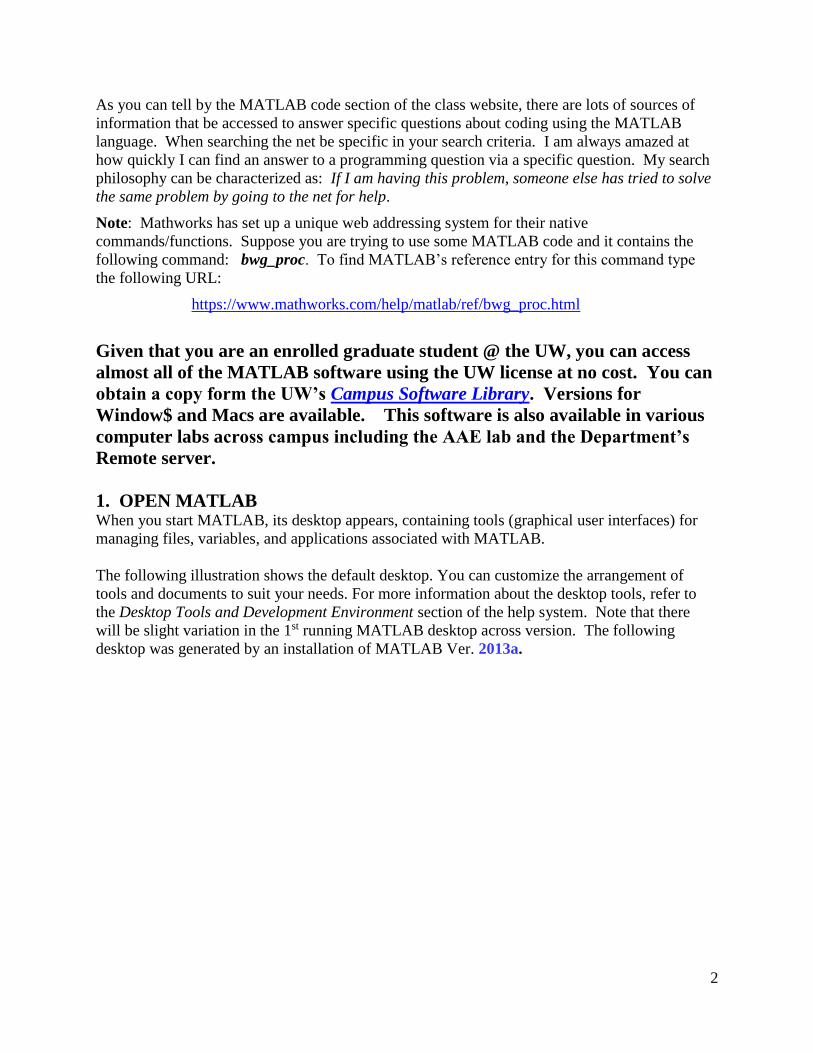
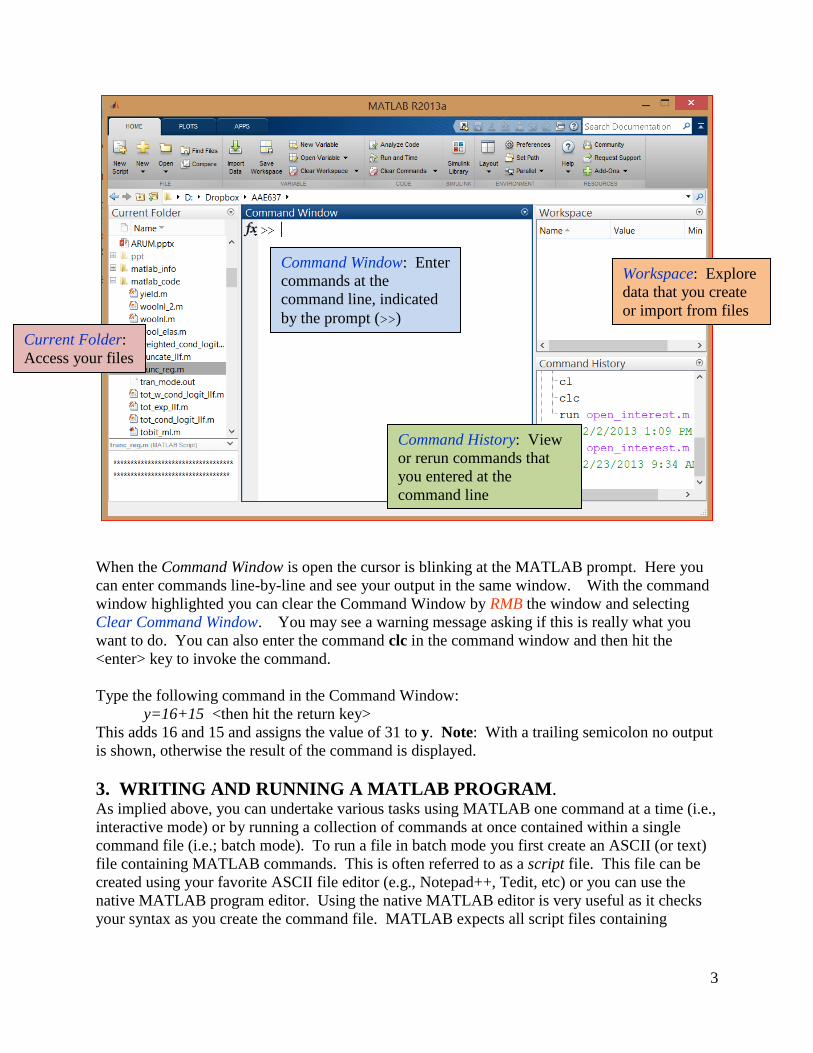
1. OPEN MATLAB When you start MATLAB, its desktop appears, containing tools (graphical user interfaces) for
managing files, variables, and applications associated with MATLAB.
The following illustration shows the default desktop. You can customize the arrangement of
tools and documents to suit your needs. For more information about the desktop tools, refer to
the Desktop Tools and Development Environment section of the help system. Note that there
will be slight variation in the 1st running MATLAB desktop across version. The following
desktop was generated by an installation of MATLAB Ver. 2013a.
3
When the Command Window is open the cursor is blinking at the MATLAB prompt. Here you
can enter commands line-by-line and see your output in the same window. With the command
window highlighted you can clear the Command Window by RMB the window and selecting
Clear Command Window. You may see a warning message asking if this is really what you
want to do. You can also enter the command clc in the command window and then hit the
<enter> key to invoke the command.
Type the following command in the Command Window:
y=16+15 <then hit the return key>
This adds 16 and 15 and assigns the value of 31 to y. Note: With a trailing semicolon no output
is shown, otherwise the result of the command is displayed.
3. WRITING AND RUNNING A MATLAB PROGRAM. As implied above, you can undertake various tasks using MATLAB one command at a time (i.e.,
interactive mode) or by running a collection of commands at once contained within a single
command file (i.e.; batch mode). To run a file in batch mode you first create an ASCII (or text)
file containing MATLAB commands. This is often referred to as a script file. This file can be
created using your favorite ASCII file editor (e.g., Notepad++, Tedit, etc) or you can use the
native MATLAB program editor. Using the native MATLAB editor is very useful as it checks
your syntax as you create the command file. MATLAB expects all script files containing
Current Folder:
Access your files
Command Window: Enter
commands at the
command line, indicated
by the prompt (>>)
Workspace: Explore
data that you create
or import from files
Command History: View
or rerun commands that
you entered at the
command line
4
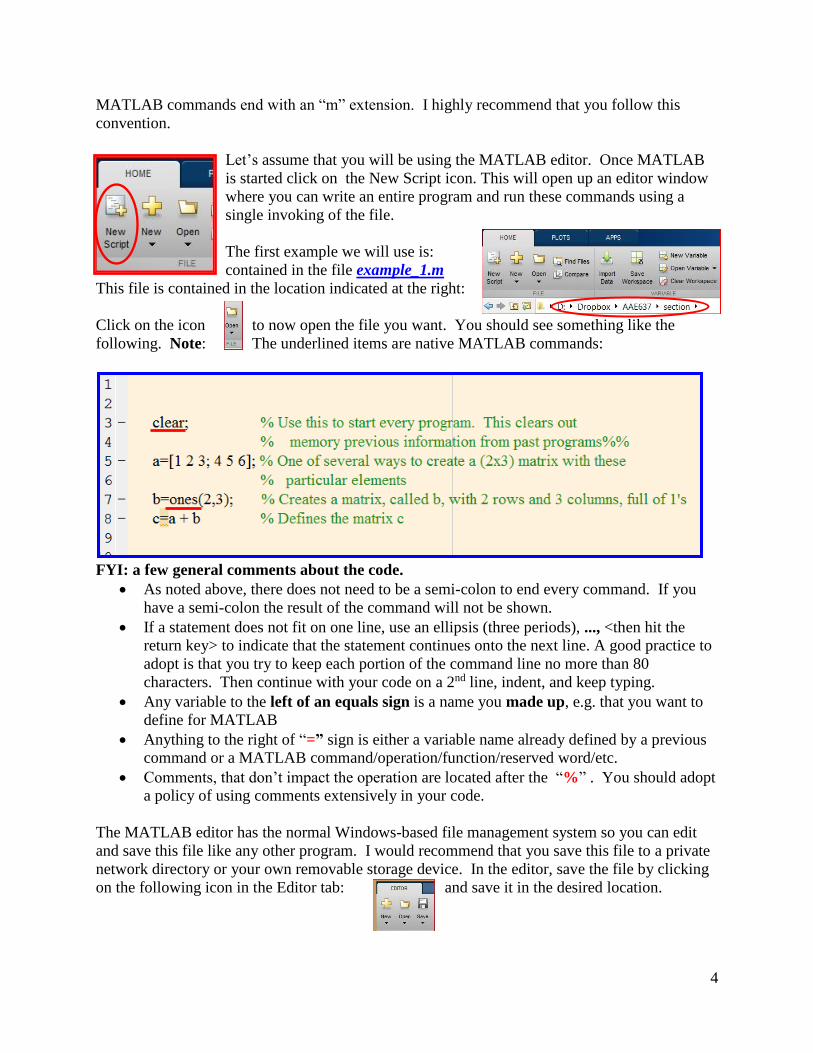
MATLAB commands end with an “m” extension. I highly recommend that you follow this
convention.
Let’s assume that you will be using the MATLAB editor. Once MATLAB
is started click on the New Script icon. This will open up an editor window
where you can write an entire program and run these commands using a
single invoking of the file.
The first example we will use is:
contained in the file example_1.m
This file is contained in the location indicated at the right:
Click on the icon to now open the file you want. You should see something like the
following. Note: The underlined items are native MATLAB commands:
FYI: a few general comments about the code.
As noted above, there does not need to be a semi-colon to end every command. If you
have a semi-colon the result of the command will not be shown.
If a statement does not fit on one line, use an ellipsis (three periods), ..., <then hit the
return key> to indicate that the statement continues onto the next line. A good practice to
adopt is that you try to keep each portion of the command line no more than 80
characters. Then continue with your code on a 2nd line, indent, and keep typing.
Any variable to the left of an equals sign is a name you made up, e.g. that you want to
define for MATLAB
Anything to the right of “=” sign is either a variable name already defined by a previous
command or a MATLAB command/operation/function/reserved word/etc.
Comments, that don’t impact the operation are located after the “%” . You should adopt
a policy of using comments extensively in your code.
The MATLAB editor has the normal Windows-based file management system so you can edit
and save this file like any other program. I would recommend that you save this file to a private
network directory or your own removable storage device. In the editor, save the file by clicking
on the following icon in the Editor tab: and save it in the desired location.
5
With your cursor located in the MATLAB editor window, run this file by clicking on the
following button located in the editor toolbar, or simply type the name of the file in the
Command Window and <then hit the return key>.
What happened? Is the matrix c what you expected it to be?
Now in your edit window, add the following to the end of your program. What do you expect it
to do?
d=a*b
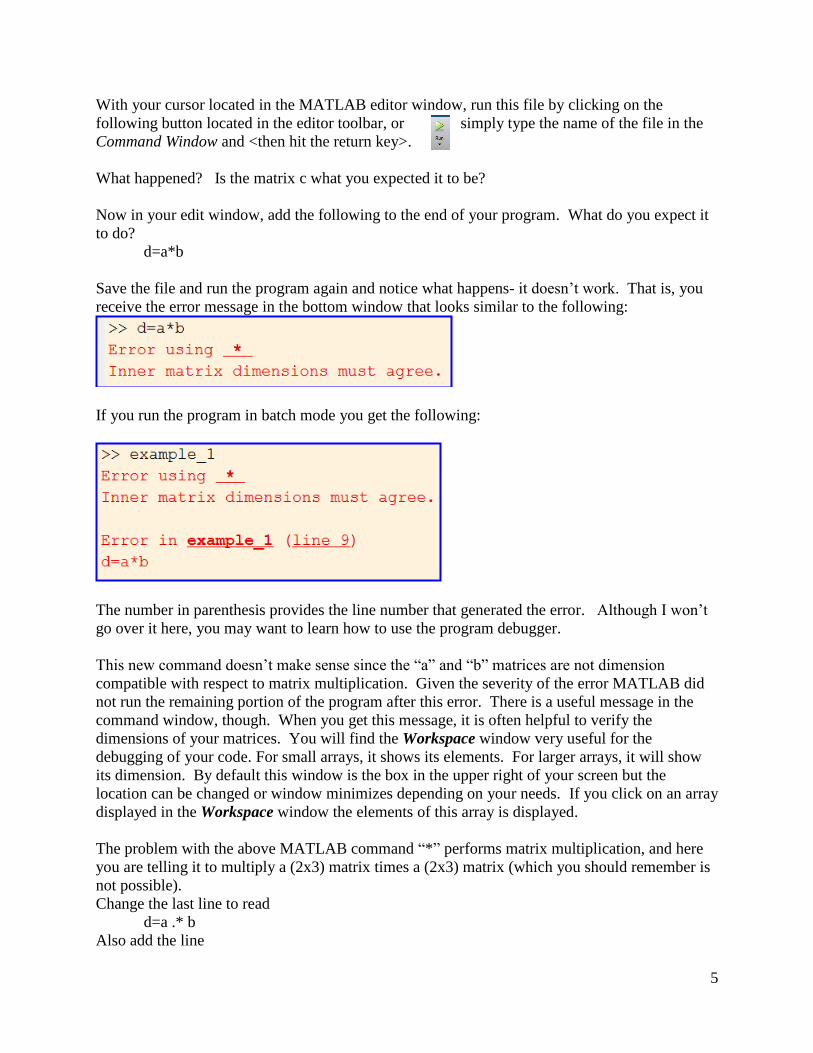
Save the file and run the program again and notice what happens- it doesn’t work. That is, you
receive the error message in the bottom window that looks similar to the following:
If you run the program in batch mode you get the following:
The number in parenthesis provides the line number that generated the error. Although I won’t
go over it here, you may want to learn how to use the program debugger.
This new command doesn’t make sense since the “a” and “b” matrices are not dimension
compatible with respect to matrix multiplication. Given the severity of the error MATLAB did
not run the remaining portion of the program after this error. There is a useful message in the
command window, though. When you get this message, it is often helpful to verify the
dimensions of your matrices. You will find the Workspace window very useful for the
debugging of your code. For small arrays, it shows its elements. For larger arrays, it will show
its dimension. By default this window is the box in the upper right of your screen but the
location can be changed or window minimizes depending on your needs. If you click on an array
displayed in the Workspace window the elements of this array is displayed.
The problem with the above MATLAB command “*” performs matrix multiplication, and here
you are telling it to multiply a (2x3) matrix times a (2x3) matrix (which you should remember is
not possible).
Change the last line to read
d=a .* b
Also add the line
6
e=a*bʹ % Note the transpose
Run the code again. Does it work? What is different about these? What do these commands do?
4. READING IN A DATA SET There are a number of methods for reading in datasets into your MATLAB software. For an
overview of how to open a variety of file types in MATLAB refer to the User’s Guide and the
Data Import and Export section. For these workshops (and for our assignments) we will load
Excel files containing the data. The first row of these files contains the variable names (One
Label per cell. (Note: Spaces in variable names are not allowed. The practice I follow is to put
a “_”in place of a space or to use continuous lettering but capital letters in place of spaces.)
Download the Excel file china_00.xls.
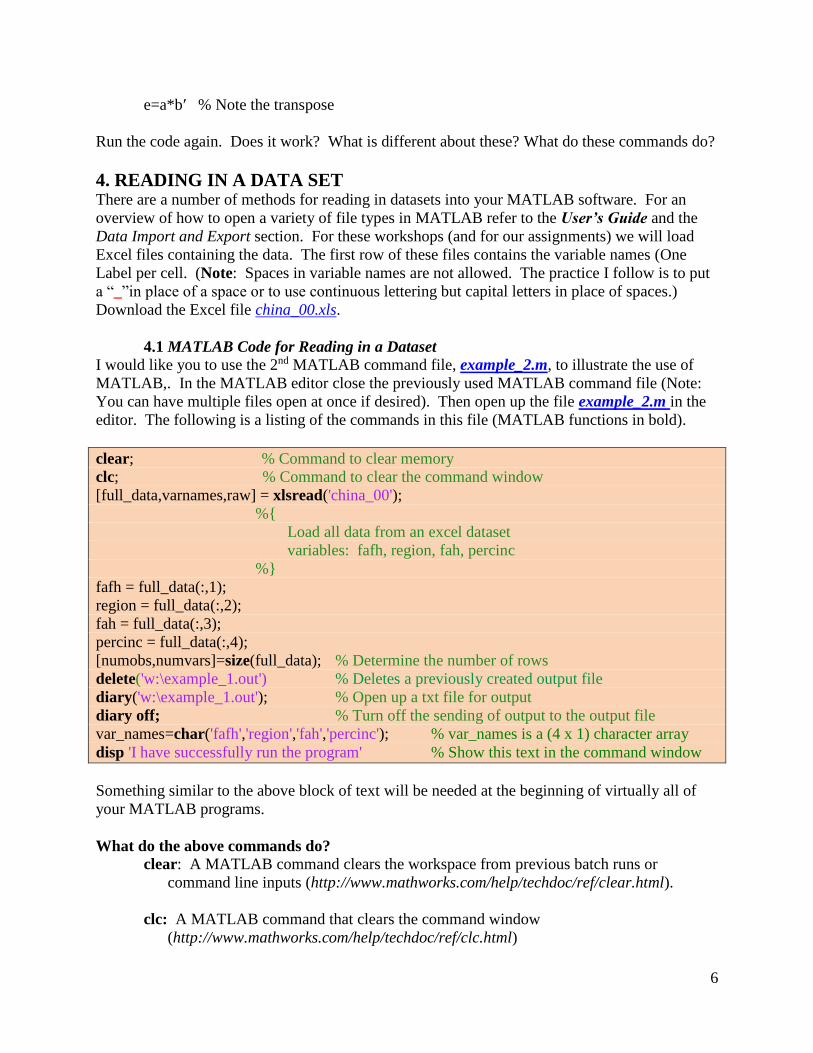
4.1 MATLAB Code for Reading in a Dataset
I would like you to use the 2nd MATLAB command file, example_2.m, to illustrate the use of
MATLAB,. In the MATLAB editor close the previously used MATLAB command file (Note:
You can have multiple files open at once if desired). Then open up the file example_2.m in the
editor. The following is a listing of the commands in this file (MATLAB functions in bold).
clear; % Command to clear memory
clc; % Command to clear the command window
[full_data,varnames,raw] = xlsread('china_00');
%{
Load all data from an excel dataset
variables: fafh, region, fah, percinc
%}
fafh = full_data(:,1);
region = full_data(:,2);
fah = full_data(:,3);
percinc = full_data(:,4);
[numobs,numvars]=size(full_data); % Determine the number of rows
delete('w:\example_1.out') % Deletes a previously created output file
diary('w:\example_1.out'); % Open up a txt file for output
diary off; % Turn off the sending of output to the output file
var_names=char('fafh','region','fah','percinc'); % var_names is a (4 x 1) character array
disp 'I have successfully run the program' % Show this text in the command window
Something similar to the above block of text will be needed at the beginning of virtually all of
your MATLAB programs.
What do the above commands do?
clear: A MATLAB command clears the workspace from previous batch runs or
command line inputs (http://www.mathworks.com/help/techdoc/ref/clear.html).
clc: A MATLAB command that clears the command window
(http://www.mathworks.com/help/techdoc/ref/clc.html)
7
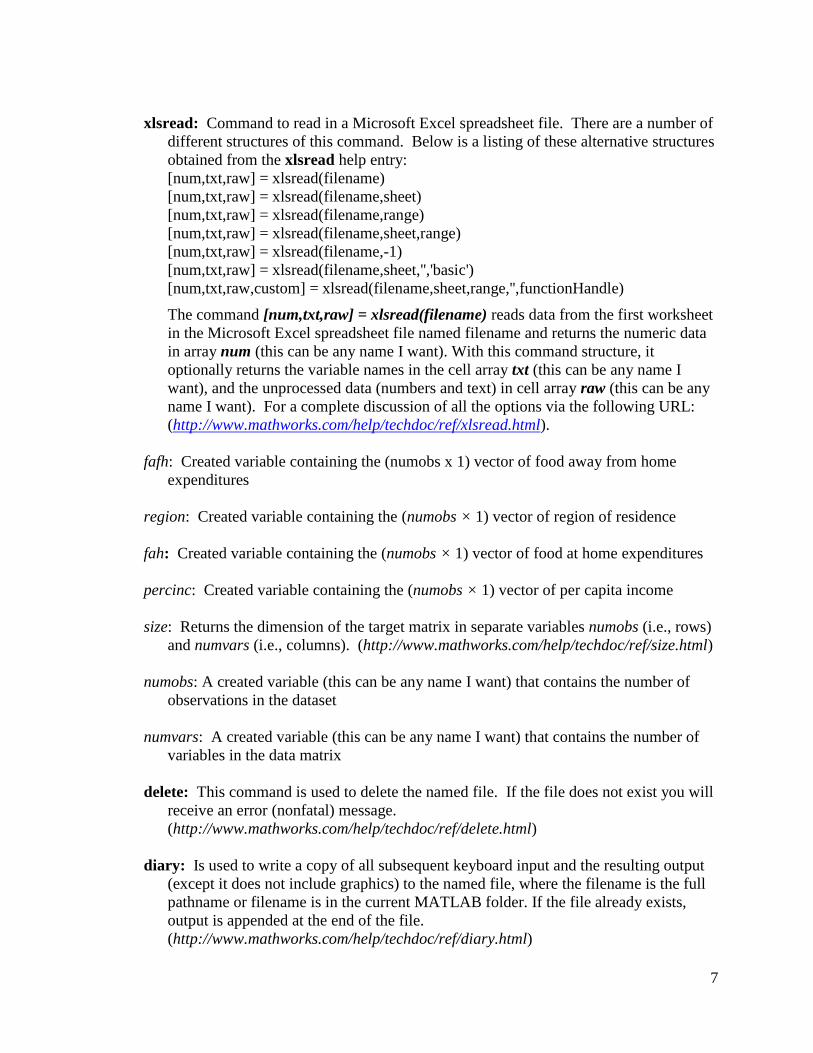
xlsread: Command to read in a Microsoft Excel spreadsheet file. There are a number of
different structures of this command. Below is a listing of these alternative structures
obtained from the xlsread help entry:
[num,txt,raw] = xlsread(filename)
[num,txt,raw] = xlsread(filename,sheet)
[num,txt,raw] = xlsread(filename,range)
[num,txt,raw] = xlsread(filename,sheet,range)
[num,txt,raw] = xlsread(filename,-1)
[num,txt,raw] = xlsread(filename,sheet,'','basic')
[num,txt,raw,custom] = xlsread(filename,sheet,range,'',functionHandle)
The command [num,txt,raw] = xlsread(filename) reads data from the first worksheet
in the Microsoft Excel spreadsheet file named filename and returns the numeric data
in array num (this can be any name I want). With this command structure, it
optionally returns the variable names in the cell array txt (this can be any name I
want), and the unprocessed data (numbers and text) in cell array raw (this can be any
name I want). For a complete discussion of all the options via the following URL:
(http://www.mathworks.com/help/techdoc/ref/xlsread.html).
fafh: Created variable containing the (numobs x 1) vector of food away from home
expenditures
region: Created variable containing the (numobs × 1) vector of region of residence
fah: Created variable containing the (numobs × 1) vector of food at home expenditures
percinc: Created variable containing the (numobs × 1) vector of per capita income
size: Returns the dimension of the target matrix in separate variables numobs (i.e., rows)
and numvars (i.e., columns). (http://www.mathworks.com/help/techdoc/ref/size.html)
numobs: A created variable (this can be any name I want) that contains the number of
observations in the dataset
numvars: A created variable (this can be any name I want) that contains the number of
variables in the data matrix
delete: This command is used to delete the named file. If the file does not exist you will
receive an error (nonfatal) message.
(http://www.mathworks.com/help/techdoc/ref/delete.html)
diary: Is used to write a copy of all subsequent keyboard input and the resulting output
(except it does not include graphics) to the named file, where the filename is the full
pathname or filename is in the current MATLAB folder. If the file already exists,
output is appended at the end of the file.
(http://www.mathworks.com/help/techdoc/ref/diary.html)
8
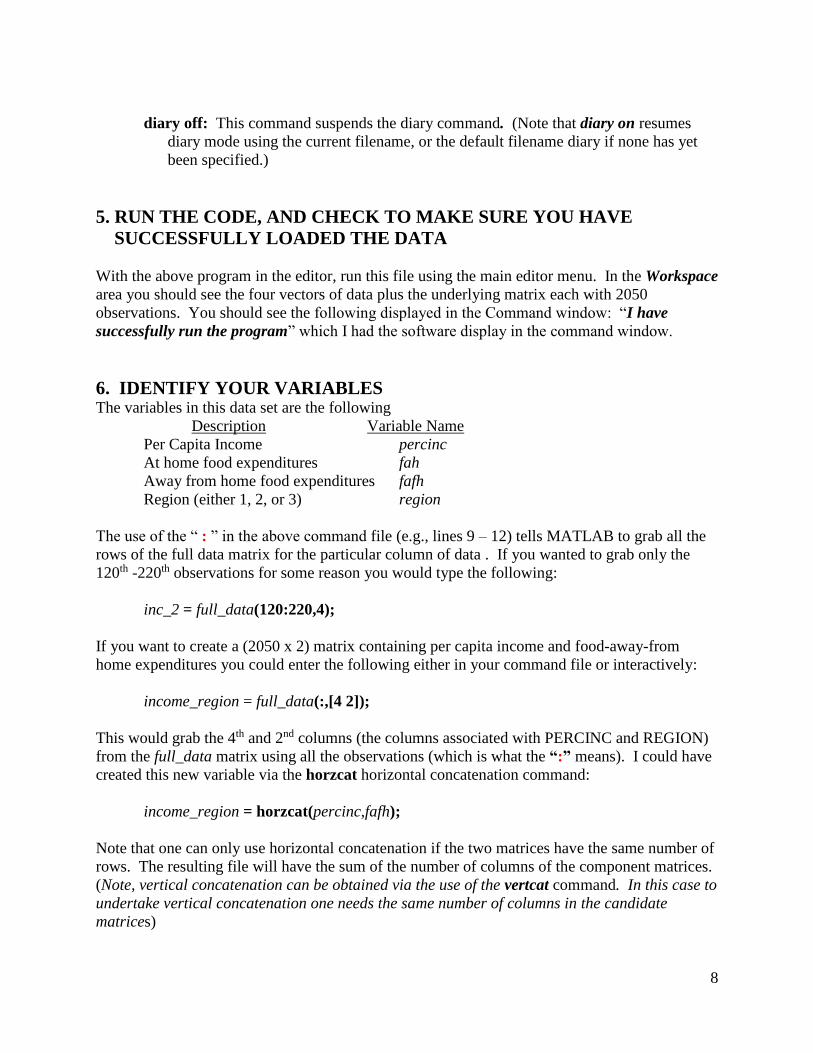
diary off: This command suspends the diary command. (Note that diary on resumes
diary mode using the current filename, or the default filename diary if none has yet
been specified.)
5. RUN THE CODE, AND CHECK TO MAKE SURE YOU HAVE
SUCCESSFULLY LOADED THE DATA
With the above program in the editor, run this file using the main editor menu. In the Workspace
area you should see the four vectors of data plus the underlying matrix each with 2050
observations. You should see the following displayed in the Command window: “I have
successfully run the program” which I had the software display in the command window.
6. IDENTIFY YOUR VARIABLES The variables in this data set are the following
Description Variable Name
Per Capita Income percinc
At home food expenditures fah
Away from home food expenditures fafh
Region (either 1, 2, or 3) region
The use of the “ : ” in the above command file (e.g., lines 9 – 12) tells MATLAB to grab all the
rows of the full data matrix for the particular column of data . If you wanted to grab only the
120th -220th observations for some reason you would type the following:
inc_2 = full_data(120:220,4);
If you want to create a (2050 x 2) matrix containing per capita income and food-away-from
home expenditures you could enter the following either in your command file or interactively:
income_region = full_data(:,[4 2]);
This would grab the 4th and 2nd columns (the columns associated with PERCINC and REGION)
from the full_data matrix using all the observations (which is what the “:” means). I could have
created this new variable via the horzcat horizontal concatenation command:
income_region = horzcat(percinc,fafh);
Note that one can only use horizontal concatenation if the two matrices have the same number of
rows. The resulting file will have the sum of the number of columns of the component matrices.
(Note, vertical concatenation can be obtained via the use of the vertcat command. In this case to
undertake vertical concatenation one needs the same number of columns in the candidate
matrices)
9
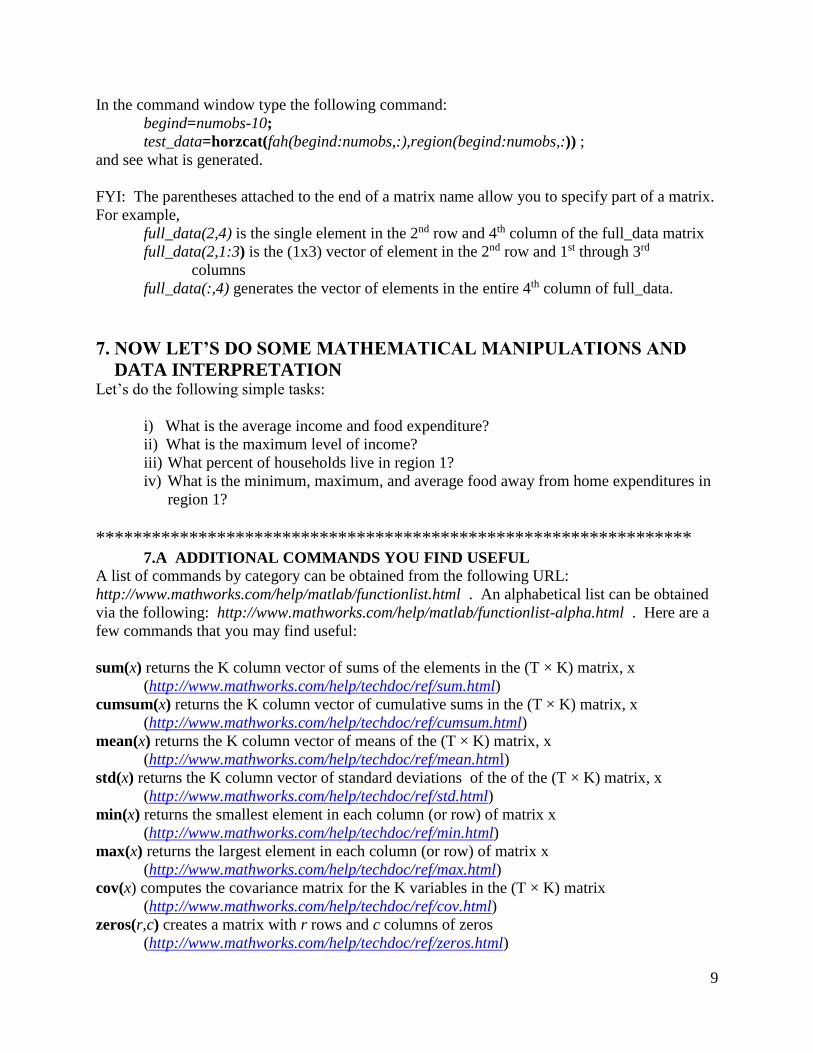
In the command window type the following command:
begind=numobs-10;
test_data=horzcat(fah(begind:numobs,:),region(begind:numobs,:)) ;
and see what is generated.
FYI: The parentheses attached to the end of a matrix name allow you to specify part of a matrix.
For example,
full_data(2,4) is the single element in the 2nd row and 4th column of the full_data matrix
full_data(2,1:3) is the (1x3) vector of element in the 2nd row and 1st through 3rd
columns
full_data(:,4) generates the vector of elements in the entire 4th column of full_data.
7. NOW LET’S DO SOME MATHEMATICAL MANIPULATIONS AND
DATA INTERPRETATION Let’s do the following simple tasks:
i) What is the average income and food expenditure?
ii) What is the maximum level of income?
iii) What percent of households live in region 1?
iv) What is the minimum, maximum, and average food away from home expenditures in
region 1?
**************************************************************** 7.A ADDITIONAL COMMANDS YOU FIND USEFUL
A list of commands by category can be obtained from the following URL:
http://www.mathworks.com/help/matlab/functionlist.html . An alphabetical list can be obtained
via the following: http://www.mathworks.com/help/matlab/functionlist-alpha.html . Here are a
few commands that you may find useful:
sum(x) returns the K column vector of sums of the elements in the (T × K) matrix, x
(http://www.mathworks.com/help/techdoc/ref/sum.html)
cumsum(x) returns the K column vector of cumulative sums in the (T × K) matrix, x
(http://www.mathworks.com/help/techdoc/ref/cumsum.html)
mean(x) returns the K column vector of means of the (T × K) matrix, x
(http://www.mathworks.com/help/techdoc/ref/mean.html)
std(x) returns the K column vector of standard deviations of the of the (T × K) matrix, x
(http://www.mathworks.com/help/techdoc/ref/std.html)
min(x) returns the smallest element in each column (or row) of matrix x
(http://www.mathworks.com/help/techdoc/ref/min.html)
max(x) returns the largest element in each column (or row) of matrix x
(http://www.mathworks.com/help/techdoc/ref/max.html)
cov(x) computes the covariance matrix for the K variables in the (T × K) matrix
(http://www.mathworks.com/help/techdoc/ref/cov.html)
zeros(r,c) creates a matrix with r rows and c columns of zeros
(http://www.mathworks.com/help/techdoc/ref/zeros.html)
10
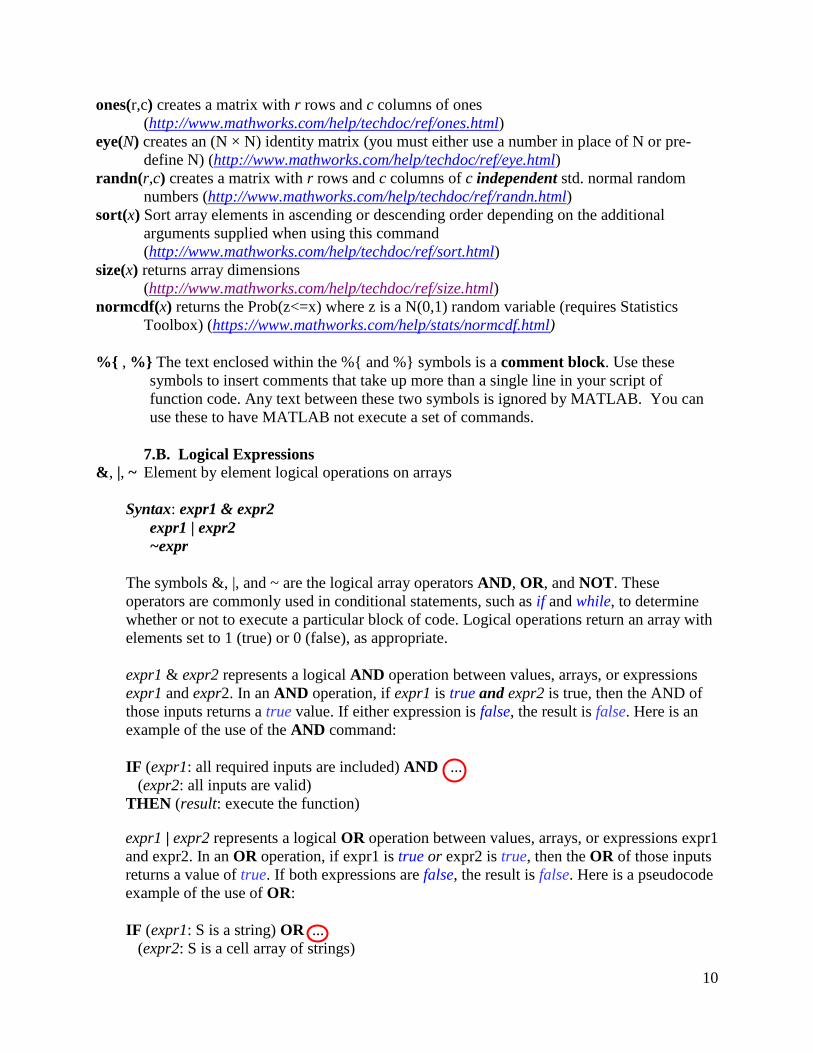
ones(r,c) creates a matrix with r rows and c columns of ones
(http://www.mathworks.com/help/techdoc/ref/ones.html)
eye(N) creates an (N × N) identity matrix (you must either use a number in place of N or pre-
define N) (http://www.mathworks.com/help/techdoc/ref/eye.html)
randn(r,c) creates a matrix with r rows and c columns of c independent std. normal random
numbers (http://www.mathworks.com/help/techdoc/ref/randn.html)
sort(x) Sort array elements in ascending or descending order depending on the additional
arguments supplied when using this command
(http://www.mathworks.com/help/techdoc/ref/sort.html)
size(x) returns array dimensions
(http://www.mathworks.com/help/techdoc/ref/size.html)
normcdf(x) returns the Prob(z<=x) where z is a N(0,1) random variable (requires Statistics
Toolbox) (https://www.mathworks.com/help/stats/normcdf.html)
%{ , %} The text enclosed within the %{ and %} symbols is a comment block. Use these
symbols to insert comments that take up more than a single line in your script of
function code. Any text between these two symbols is ignored by MATLAB. You can
use these to have MATLAB not execute a set of commands.
7.B. Logical Expressions
&, |, ~ Element by element logical operations on arrays
Syntax: expr1 & expr2
expr1 | expr2
~expr
The symbols &, |, and ~ are the logical array operators AND, OR, and NOT. These
operators are commonly used in conditional statements, such as if and while, to determine
whether or not to execute a particular block of code. Logical operations return an array with
elements set to 1 (true) or 0 (false), as appropriate.
expr1 & expr2 represents a logical AND operation between values, arrays, or expressions
expr1 and expr2. In an AND operation, if expr1 is true and expr2 is true, then the AND of
those inputs returns a true value. If either expression is false, the result is false. Here is an
example of the use of the AND command:
IF (expr1: all required inputs are included) AND ...
(expr2: all inputs are valid)
THEN (result: execute the function)
expr1 | expr2 represents a logical OR operation between values, arrays, or expressions expr1
and expr2. In an OR operation, if expr1 is true or expr2 is true, then the OR of those inputs
returns a value of true. If both expressions are false, the result is false. Here is a pseudocode
example of the use of OR:
IF (expr1: S is a string) OR ...
(expr2: S is a cell array of strings)
11
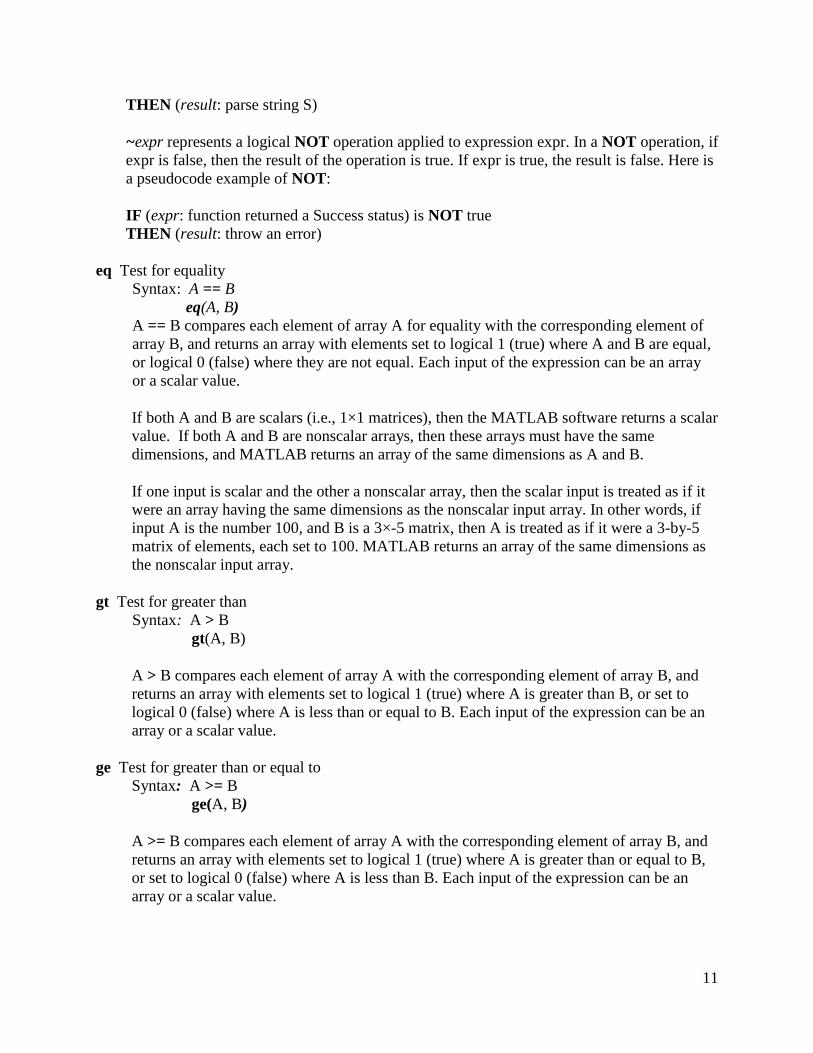
THEN (result: parse string S)
~expr represents a logical NOT operation applied to expression expr. In a NOT operation, if
expr is false, then the result of the operation is true. If expr is true, the result is false. Here is
a pseudocode example of NOT:
IF (expr: function returned a Success status) is NOT true
THEN (result: throw an error)
eq Test for equality
Syntax: A == B
eq(A, B)
A == B compares each element of array A for equality with the corresponding element of
array B, and returns an array with elements set to logical 1 (true) where A and B are equal,
or logical 0 (false) where they are not equal. Each input of the expression can be an array
or a scalar value.
If both A and B are scalars (i.e., 1×1 matrices), then the MATLAB software returns a scalar
value. If both A and B are nonscalar arrays, then these arrays must have the same
dimensions, and MATLAB returns an array of the same dimensions as A and B.
If one input is scalar and the other a nonscalar array, then the scalar input is treated as if it
were an array having the same dimensions as the nonscalar input array. In other words, if
input A is the number 100, and B is a 3×-5 matrix, then A is treated as if it were a 3-by-5
matrix of elements, each set to 100. MATLAB returns an array of the same dimensions as
the nonscalar input array.
gt Test for greater than
Syntax: A > B
gt(A, B)
A > B compares each element of array A with the corresponding element of array B, and
returns an array with elements set to logical 1 (true) where A is greater than B, or set to
logical 0 (false) where A is less than or equal to B. Each input of the expression can be an
array or a scalar value.
ge Test for greater than or equal to
Syntax: A >= B
ge(A, B)
A >= B compares each element of array A with the corresponding element of array B, and
returns an array with elements set to logical 1 (true) where A is greater than or equal to B,
or set to logical 0 (false) where A is less than B. Each input of the expression can be an
array or a scalar value.
12
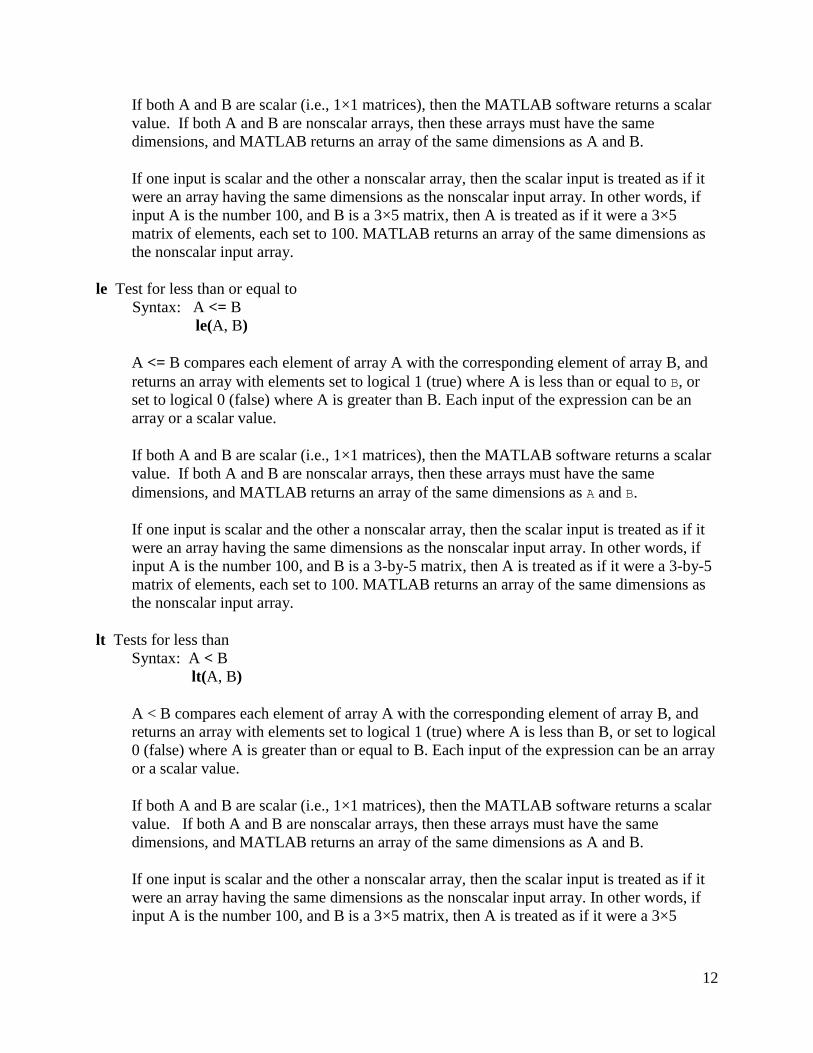
If both A and B are scalar (i.e., 1×1 matrices), then the MATLAB software returns a scalar
value. If both A and B are nonscalar arrays, then these arrays must have the same
dimensions, and MATLAB returns an array of the same dimensions as A and B.
If one input is scalar and the other a nonscalar array, then the scalar input is treated as if it
were an array having the same dimensions as the nonscalar input array. In other words, if
input A is the number 100, and B is a 3×5 matrix, then A is treated as if it were a 3×5
matrix of elements, each set to 100. MATLAB returns an array of the same dimensions as
the nonscalar input array.
le Test for less than or equal to
Syntax: A <= B
le(A, B)
A <= B compares each element of array A with the corresponding element of array B, and
returns an array with elements set to logical 1 (true) where A is less than or equal to B, or
set to logical 0 (false) where A is greater than B. Each input of the expression can be an
array or a scalar value.
If both A and B are scalar (i.e., 1×1 matrices), then the MATLAB software returns a scalar
value. If both A and B are nonscalar arrays, then these arrays must have the same
dimensions, and MATLAB returns an array of the same dimensions as A and B.
If one input is scalar and the other a nonscalar array, then the scalar input is treated as if it
were an array having the same dimensions as the nonscalar input array. In other words, if
input A is the number 100, and B is a 3-by-5 matrix, then A is treated as if it were a 3-by-5
matrix of elements, each set to 100. MATLAB returns an array of the same dimensions as
the nonscalar input array.
lt Tests for less than
Syntax: A < B lt(A, B)
A < B compares each element of array A with the corresponding element of array B, and
returns an array with elements set to logical 1 (true) where A is less than B, or set to logical
0 (false) where A is greater than or equal to B. Each input of the expression can be an array
or a scalar value.
If both A and B are scalar (i.e., 1×1 matrices), then the MATLAB software returns a scalar
value. If both A and B are nonscalar arrays, then these arrays must have the same
dimensions, and MATLAB returns an array of the same dimensions as A and B.
If one input is scalar and the other a nonscalar array, then the scalar input is treated as if it
were an array having the same dimensions as the nonscalar input array. In other words, if
input A is the number 100, and B is a 3×5 matrix, then A is treated as if it were a 3×5
13
matrix of elements, each set to 100. MATLAB returns an array of the same dimensions as
the nonscalar input array.
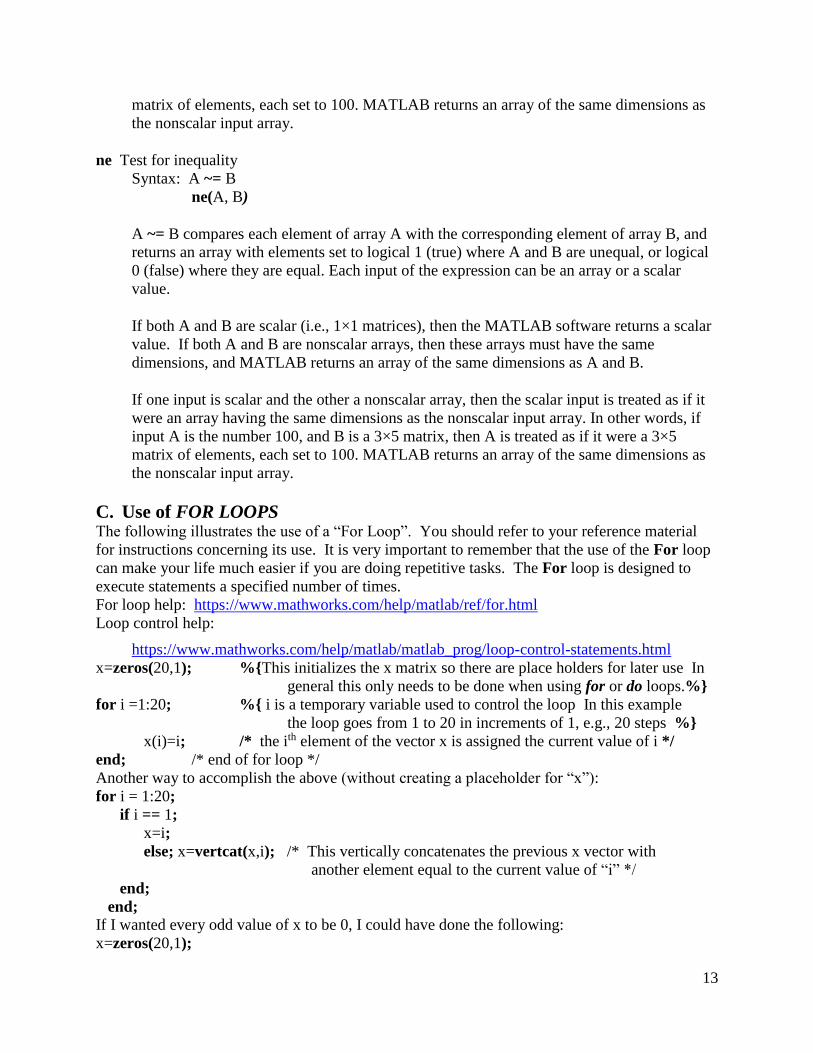
ne Test for inequality
Syntax: A ~= B ne(A, B)
A ~= B compares each element of array A with the corresponding element of array B, and
returns an array with elements set to logical 1 (true) where A and B are unequal, or logical
0 (false) where they are equal. Each input of the expression can be an array or a scalar
value.
If both A and B are scalar (i.e., 1×1 matrices), then the MATLAB software returns a scalar
value. If both A and B are nonscalar arrays, then these arrays must have the same
dimensions, and MATLAB returns an array of the same dimensions as A and B.
If one input is scalar and the other a nonscalar array, then the scalar input is treated as if it
were an array having the same dimensions as the nonscalar input array. In other words, if
input A is the number 100, and B is a 3×5 matrix, then A is treated as if it were a 3×5
matrix of elements, each set to 100. MATLAB returns an array of the same dimensions as
the nonscalar input array.
C. Use of FOR LOOPS
The following illustrates the use of a “For Loop”. You should refer to your reference material
for instructions concerning its use. It is very important to remember that the use of the For loop
can make your life much easier if you are doing repetitive tasks. The For loop is designed to
execute statements a specified number of times.
For loop help: https://www.mathworks.com/help/matlab/ref/for.html
Loop control help:
https://www.mathworks.com/help/matlab/matlab_prog/loop-control-statements.html
x=zeros(20,1); %{This initializes the x matrix so there are place holders for later use In
general this only needs to be done when using for or do loops.%}
for i =1:20; %{ i is a temporary variable used to control the loop In this example
the loop goes from 1 to 20 in increments of 1, e.g., 20 steps %}
x(i)=i; /* the ith element of the vector x is assigned the current value of i */
end; /* end of for loop */
Another way to accomplish the above (without creating a placeholder for “x”):
for i = 1:20;
if i == 1;
x=i;
else; x=vertcat(x,i); /* This vertically concatenates the previous x vector with
another element equal to the current value of “i” */
end;
end;
If I wanted every odd value of x to be 0, I could have done the following:
x=zeros(20,1);
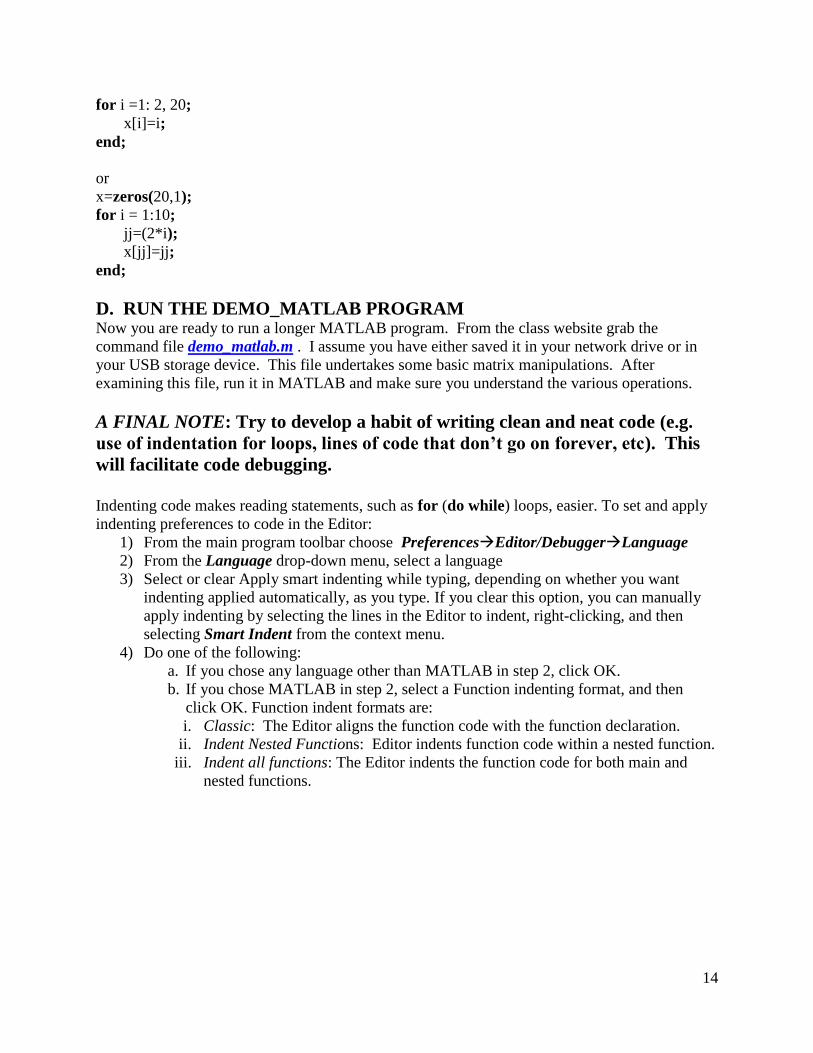
14
for i =1: 2, 20;
x[i]=i;
end;
or
x=zeros(20,1);
for i = 1:10;
jj=(2*i);
x[jj]=jj;
end;
D. RUN THE DEMO_MATLAB PROGRAM Now you are ready to run a longer MATLAB program. From the class website grab the
command file demo_matlab.m . I assume you have either saved it in your network drive or in
your USB storage device. This file undertakes some basic matrix manipulations. After
examining this file, run it in MATLAB and make sure you understand the various operations.
A FINAL NOTE: Try to develop a habit of writing clean and neat code (e.g.
use of indentation for loops, lines of code that don’t go on forever, etc). This
will facilitate code debugging.
Indenting code makes reading statements, such as for (do while) loops, easier. To set and apply
indenting preferences to code in the Editor:
1) From the main program toolbar choose PreferencesEditor/DebuggerLanguage
2) From the Language drop-down menu, select a language
3) Select or clear Apply smart indenting while typing, depending on whether you want
indenting applied automatically, as you type. If you clear this option, you can manually
apply indenting by selecting the lines in the Editor to indent, right-clicking, and then
selecting Smart Indent from the context menu.
4) Do one of the following:
a. If you chose any language other than MATLAB in step 2, click OK.
b. If you chose MATLAB in step 2, select a Function indenting format, and then
click OK. Function indent formats are:
i. Classic: The Editor aligns the function code with the function declaration.
ii. Indent Nested Functions: Editor indents function code within a nested function.
iii. Indent all functions: The Editor indents the function code for both main and
nested functions.