Embed Size (px)
Citation preview

Agilent PSA Series Spectrum AnalyzersSelf-Guided Demonstration for Phase Noise Measurements
Product Note
This demonstration guide is a tool to help you gain familiarity with the basic functions and importantfeatures of the Agilent PSA seriesspectrum analyzers. Because the PSAseries offers expansive functionality,the demonstration guide is available in several pieces. This portion introduces the advanced, one-buttonphase noise measurements provided
by the PSA’s optional Phase Noise Measurement Personality (Option 226). Other portions of the self-guided demonstration are listedin the product literature section at the end of this guide and can be found at
http://www.agilent.com/find/psa
All exercises in this demonstrationutilize the ESG vector signal generator and PSA with the PhaseNoise Measurement Personality.Keystrokes surrounded by [ ] indicate hard keys located on thefront panel, while key names surrounded by indicate soft keyslocated on the right edge of the display.
2
Part 1 – Demonstration preparation 3
Part 2 – Phase noise log plot 3
Part 3 – Spot frequency phase noise 6
Part 4 – Displayed average noise level (DANL) measurements 8
Part 5 – Integrated noise 10
Product literature 12
Table of contents About the PSA series
The Agilent PSA series is a family of modern, high-performance spectrum analyzers with digitaldemodulation and one-button measurement personalities for 2G/3Gapplications. It offers an exceptionalcombination of dynamic range, accuracy, and measurement speed.The PSA delivers the highest level ofmeasurement performance availablein Agilent spectrum analyzers. Anall-digital IF section includes fastFourier transform (FFT) analysis anda digital implementation of a sweptIF. The digital IF and innovative analog design provide much highermeasurement accuracy and improveddynamic range compared to traditional spectrum analyzers. This performance is combined withmeasurement speed typically 2 to 50times faster than spectrum analyzersusing analog IF filters.
The PSA series complementsAgilent’s other spectrum analyzerssuch as the ESA series, a family of mid-performance analyzers thatcover a variety of RF and microwavefrequency ranges while offering a great combination of features, performance, and value.
3
Part 1Demonstration preparation
Begin by connecting the 50 Ω RF output of the ESG vector signal generator to the 50 Ω RF input of the PSA series spectrum analyzerwith a 50 Ω RF cable. Turn on thepower in both instruments.
This exercise demonstrates how toset up the ESG to provide a RF testsignal.
If you do not have an ESG available,you can turn on the PSA’s internalRF reference signal (50 MHz) to runthe following demonstration. Sincethe PSA’s center frequency defaultsto 50 MHz, you do not need to change the center frequency of the PSA as shown in Part 2.
Figure 1.Phase noiselog plot
Instructions Keystrokes
On the ESG:
Set carrier frequency to 1 GHz. [Preset] [Frequency] [1] GHz
Set amplitude to 0 dBm. [Amplitude] [0] dBm
Turn on RF output. [RF On/Off]
Product type Model number Required options
ESG vector signal generator E4438C
PSA series spectrum analyzer E4440A/E4443A/E4445A/ 226 – phase noise E4446A/E4448A measurement personality
Part 2Phase noise log plot
Log plot measures single-sidebandphase noise (in dBc/Hz) versus offsetfrequencies expressed in logarithmicscale. This allows you to view thephase noise behavior of the signalunder test across decades of offsetfrequencies. The PSA with the phasenoise personality can display up tosix decades of offset frequenciessimultaneously.
This exercise demonstrates the one-button phase noise log plotmeasurement.
Instructions Keystrokes
Turn on the PSA’s internal 50 MHz RF [Preset] [Mode] Phase Noise [Input/Output]reference signal. Input/Output Input Port Amptd Ref
Instructions Keystrokes
Enter phase noise measurement mode in the analyzer. [Preset] [Mode] Phase Noise
Set center frequency to 1 GHz. [FREQUENCY] [1] GHz
Activate log plot measurement. [MEASURE] Log PlotObserve the phase noise curve in a default setting.
Examine settings (figure 1). Meas SetupUse this step to make setup changes in anymeasurement.

4
The following exercises demonstratethe PSA’s flexibility that enables you to optimize your phase noisemeasurements.
Note:Averaging and video filtering are part of the measurement. Therefore,every time you change the number of averages and/or level of video filtering, you need restart the measurement to obtain the results.Smoothing, on the other hand, is apost-processing operation on thestored data. You can observe thesmoothed results while you arechanging the length of smoothingsegment. Implementations of videofiltering and smoothing are fast,whereas averaging takes longer.
Figure 2.Phase noise plot with averaging
Span and amplitude
Instructions Keystrokes
Specify the span of offset frequencies:
Set start offset frequency to 100 Hz. [SPAN] Start Offset [100] Hz
Set stop offset frequency to 100 MHz. Stop Offset [100] MHz
Specify amplitude scale:
Set reference value to -85 dBc/Hz. [AMPLITUDE] Ref Value [-85] dBc/Hz
Set scale per division to 7 dB. Scale/Div [7] dB
Restart the measurement. [Restart]
Averaging, video filtering and smoothing
Instructions Keystrokes
Activate averaging and set average number to 5. [Meas Setup] Avg Number until “On” isunderlined, then [5] [Enter]
Restart the measurement (figure 2). [Restart]Observe convergence of the raw data trace.
Disable averaging. Press Avg Number until “Off” is underlined
Activate video filtering and set filtering level to Filtering Maximum“Maximum”.
Restart the measurement. [Restart]Observe the filtering result (figure 3).
View smoothed data trace with raw or averaged [Trace/View], press Trace until “1” is trace turned off. underlined, Blank
Adjust length of smoothing segment. [Meas Setup] Smoothing, then press [⇓] or [⇑],Observe the displayed traces with different or rotate the knobsmoothing segments (figure 4).

5
Figure 4.Smoothed phase noise plot
Figure 3.Phase noise plot with video filtering
6
If you are interested in phase noise versus time at a single offsetfrequency, use the spot frequencyphase noise measurement. Thismeasurement lets you monitor phasenoise behavior at the user-specifiedsingle offset frequency in real time.Meanwhile, you can also check carrier frequency drifting to evaluatethe stability of a carrier signal.
In this exercise, you will measure the spot frequency at 20 kHz andexplore the signal tracking and thecarrier frequency drifting features.
Part 3Spot frequency phase noise
Instructions Keystrokes
Activate the spot frequency measurement. [MEASURE] Spot Frequency
Specify the spot frequency to 20 kHz. [Meas Setup] Spot Offset [20] kHz
Adjust amplitude scale to optimize the display. [Amplitude] Phase Noise Ref ValueObserve the real-time phase noise display [-110] dBc/Hz Scale/Div [0.5] dB, thenat 20 kHz offset frequency (figure 5). rotate the knob for fine adjustment with either
Ref Value or Scale/Div pressed
View spot frequency phase noise with a table of [Trace/View] Numerical numerical readouts.
Return to graphical view. Graphical
Turn on signal tracking to check carrier frequency [Frequency], toggle Signal Track to “On”Drift. Check the carrier frequency drifting at a Tracking Mode Interval Intervalfixed time interval, for example at each 10 percent [10] Enterof one sweeping cycle.
Adjust amplitude scale of frequency drifting [Amplitude] Delta Freq, Scale/Div, then(or Delta Frequency). rotate the knob to an optimized displayObserve the spot frequency phase noise withcarrier drifting plot (figure 6).
Check the frequency stability of the carrier signal [Frequency], toggle Signal Track to “On”,when the carrier drifting goes beyond the Tracking Mode Tolerance Tolerance +/-specified tolerance. This example uses a [1] dBc/Hz±1 dBc/Hz tolerance level.
Set amplitude scale of frequency drifting (or [Amplitude] Delta Freq Scale/Div [1] kHzdelta frequency) to 1 kHz/Div.
Check frequency drifting at the “Delta Freq” Set ESG: [Frequency], then rotate the knobpanel while manually adjusting the ESG RF clock- or counterclock-wise around the output frequency by ±2 kHz increments. previously specified center frequency

7
Figure 6.Phase noise withcarrier drifting
Figure 5.Spot frequencyphase noise
8
Part 4Displayed average noise level(DANL) measurements
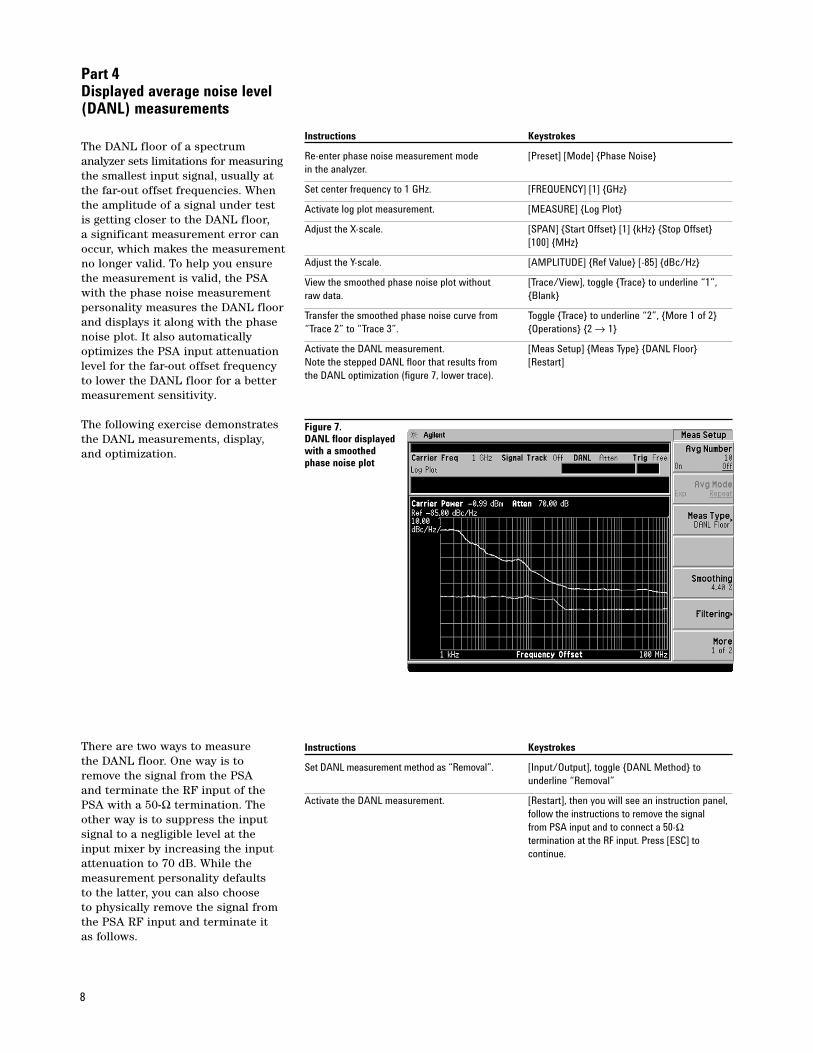
The DANL floor of a spectrum analyzer sets limitations for measuringthe smallest input signal, usually atthe far-out offset frequencies. Whenthe amplitude of a signal under testis getting closer to the DANL floor, a significant measurement error canoccur, which makes the measurementno longer valid. To help you ensurethe measurement is valid, the PSAwith the phase noise measurement personality measures the DANL floorand displays it along with the phasenoise plot. It also automatically optimizes the PSA input attenuationlevel for the far-out offset frequencyto lower the DANL floor for a bettermeasurement sensitivity.
The following exercise demonstratesthe DANL measurements, display,and optimization.
There are two ways to measurethe DANL floor. One way is toremove the signal from the PSA and terminate the RF input of thePSA with a 50-Ω termination. Theother way is to suppress the inputsignal to a negligible level at theinput mixer by increasing the inputattenuation to 70 dB. While themeasurement personality defaults to the latter, you can also choose to physically remove the signal fromthe PSA RF input and terminate it as follows.
Figure 7.DANL floor displayed with a smoothedphase noise plot
Instructions Keystrokes
Re-enter phase noise measurement mode [Preset] [Mode] Phase Noise in the analyzer.
Set center frequency to 1 GHz. [FREQUENCY] [1] GHz
Activate log plot measurement. [MEASURE] Log Plot
Adjust the X-scale. [SPAN] Start Offset [1] kHz Stop Offset[100] MHz
Adjust the Y-scale. [AMPLITUDE] Ref Value [-85] dBc/Hz
View the smoothed phase noise plot without [Trace/View], toggle Trace to underline “1”,raw data. Blank
Transfer the smoothed phase noise curve from Toggle Trace to underline “2”, More 1 of 2“Trace 2” to “Trace 3”. Operations 2 → 1
Activate the DANL measurement. [Meas Setup] Meas Type DANL FloorNote the stepped DANL floor that results from [Restart]the DANL optimization (figure 7, lower trace).
Instructions Keystrokes
Set DANL measurement method as “Removal”. [Input/Output], toggle DANL Method tounderline “Removal”
Activate the DANL measurement. [Restart], then you will see an instruction panel,follow the instructions to remove the signalfrom PSA input and to connect a 50-Ωtermination at the RF input. Press [ESC] tocontinue.
9
Part 5Integrated noise
Different applications require different measures for evaluatingphase noise behaviors. In the digitalworld, root-mean-square (rms) phase deviation/jitter (in degrees or radians) and rms phase jitter (inseconds) are used more frequently to evaluate the stability of a high-frequency clock. On the other hand,the residual FM is more important toamplifier designers and manufacturers.With the phase noise plot obtainedfrom Part 4, these measures can be calculated by positioning a pair of markers to specify the interval of integration.
Instructions Keystrokes
Clear the DANL floor from the results obtained [Trace/View], toggle Trace to underline “2”, in Part 4. Blank
Set the starting point of the integration interval [Marker] More, toggle Marker Trace until to 10 kHz. “1” is underlined, More Normal [10] kHzNotice a marker labeled “1” shows up on thephase noise plot at 10 kHz offset frequency.
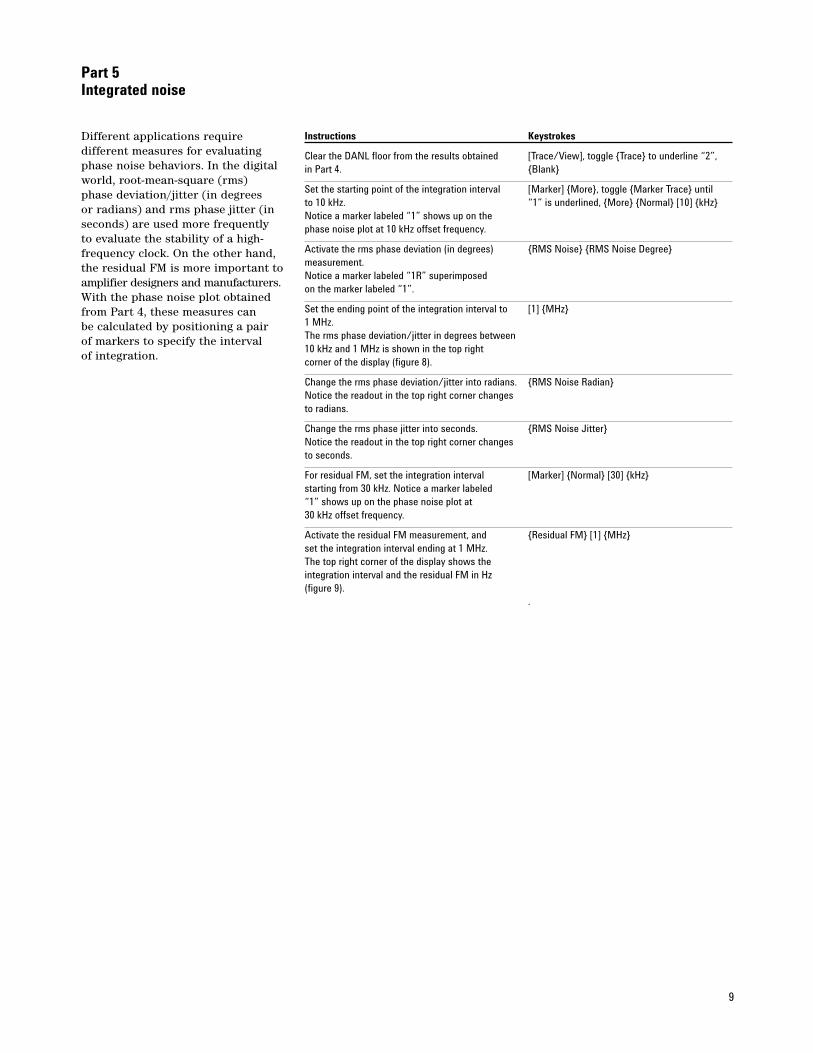
Activate the rms phase deviation (in degrees) RMS Noise RMS Noise Degree measurement.Notice a marker labeled “1R” superimposedon the marker labeled “1”.
Set the ending point of the integration interval to [1] MHz1 MHz. The rms phase deviation/jitter in degrees between10 kHz and 1 MHz is shown in the top rightcorner of the display (figure 8).
Change the rms phase deviation/jitter into radians. RMS Noise Radian Notice the readout in the top right corner changes to radians.
Change the rms phase jitter into seconds. RMS Noise Jitter Notice the readout in the top right corner changes to seconds.
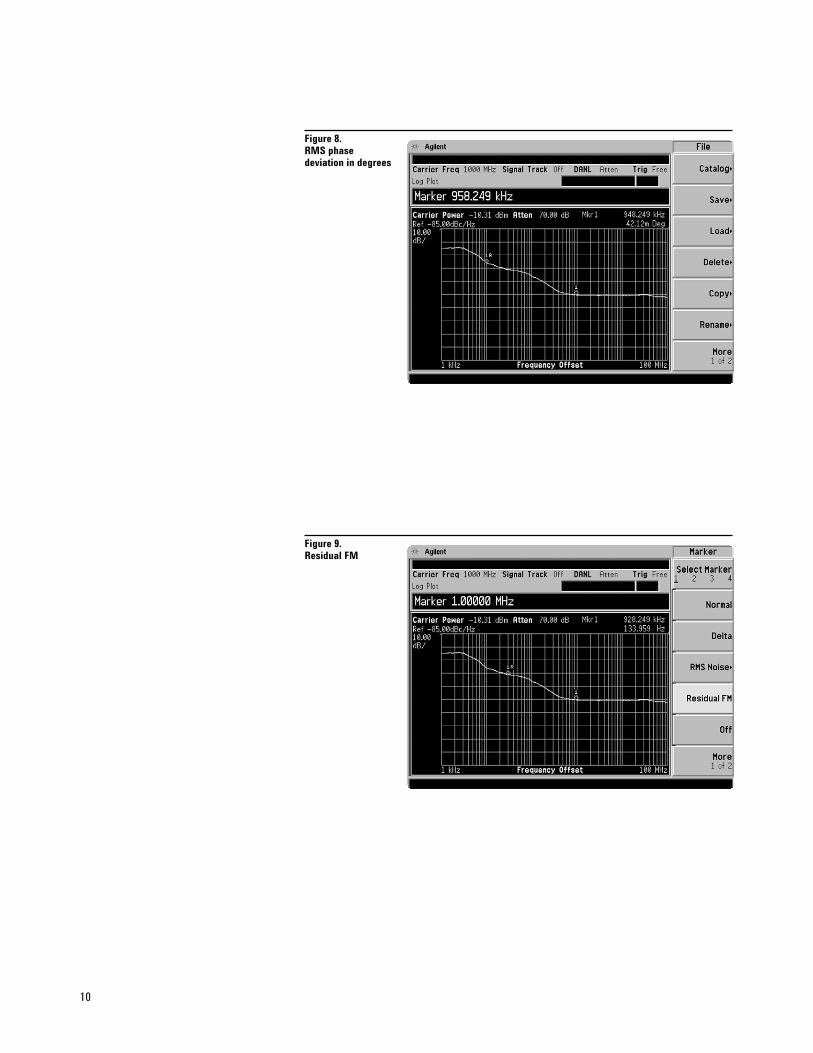
For residual FM, set the integration interval [Marker] Normal [30] kHz starting from 30 kHz. Notice a marker labeled “1” shows up on the phase noise plot at 30 kHz offset frequency.
Activate the residual FM measurement, and Residual FM [1] MHzset the integration interval ending at 1 MHz.The top right corner of the display shows theintegration interval and the residual FM in Hz (figure 9).
.
10
Figure 8.RMS phase deviation in degrees
Figure 9.Residual FM

11
Agilent Technologies’ Test and MeasurementSupport, Services, and AssistanceAgilent Technologies aims to maximize the valueyou receive, while minimizing your risk and problems. We strive to ensure that you get the test and measurement capabilities you paid for andobtain the support you need. Our extensive supportresources and services can help you choose theright Agilent products for your applications andapply them successfully. Every instrument and system we sell has a global warranty. Support is available for at least five years beyond the production life of the product. Two concepts underlie Agilent’s overall support policy: “Our Promise” and “Your Advantage.”
Our PromiseOur Promise means your Agilent test and measurement equipment will meet its advertisedperformance and functionality. When you arechoosing new equipment, we will help you withproduct information, including realistic performancespecifications and practical recommendations fromexperienced test engineers. When you use Agilentequipment, we can verify that it works properly,help with product operation, and provide basicmeasurement assistance for the use of specifiedcapabilities, at no extra cost upon request. Manyself-help tools are available.
Your AdvantageYour Advantage means that Agilent offers a widerange of additional expert test and measurementservices, which you can purchase according toyour unique technical and business needs. Solveproblems efficiently and gain a competitive edge by contracting with us for calibration, extra-costupgrades, out-of-warranty repairs, and on-site education and training, as well as design, systemintegration, project management, and other professional engineering services. ExperiencedAgilent engineers and technicians worldwide can help you maximize your productivity, optimize thereturn on investment of your Agilent instrumentsand systems, and obtain dependable measurementaccuracy for the life of those products.
By internet, phone, or fax, get assistance with all your test and measurement needs.
Online assistance:
www.agilent.com/find/assist
Phone or Fax:
Product specifications and descriptions in this document subject to change without notice.
© Agilent Technologies, Inc. 2002 Printed in U.S.A., May 20, 20025988-3704EN
United States:(tel) 1 800 452 4844
Canada:(tel) 1 877 894 4414(fax) (905) 282-6495
China:(tel) 800 810 0189(fax) 1 0800 650 0121
Europe:(tel) (31 20) 547 2323(fax) (31 20) 547 2390
Japan:(tel) (81) 426 56 7832(fax) (81) 426 56 7840
Korea:(tel) (82 2) 2004 5004 (fax) (82 2) 2004 5115
Latin America:(tel) (305) 269 7500(fax) (305) 269 7599
Taiwan:(tel) 080 004 7866 (fax) (886 2) 2545 6723
Other Asia PacificCountries:(tel) (65) 375 8100 (fax) (65) 836 0252Email: [email protected]
www.agilent.com/find/emailupdatesGet the latest information on the products and applications you select.
Agilent Email Updates
Product literaturePSA Series - The Next Generation, brochure, literature number 5980-1283EPSA Series, data sheet, literature number 5980-1284E Phase Noise Measurement Personality, product overview, literature number 5988-3698ENW-CDMA Measurement Personality, product overview, literature number 5988-2388ENGSM with EDGE Measurement Personality, product overview, literature number 5988-2389ENcdma2000 Measurement Personality, product overview, literature number 5988-3694EN1xEV-DO Measurement Personality, product overview, literature number 5988-4828ENcdmaOne Measurement Personality, product overview, literature number 5988-3695ENNADC/PDC Measurement Personality, product overview, literature number 5988-3697ENPSA Series Spectrum Analyzers, Option H70, 70 MHz IF Output, product overview, literature number 5988-5261ENSelf-Guided Demonstration for Spectrum Analysis, product note, literature number 5988-0735ENSelf-Guided Demonstration for Phase Noise Measurements, product note, literature number 5988-3704ENSelf-Guided Demonstration for W-CDMA Measurements, product note, literature number 5988-3699ENSelf-Guided Demonstration for GSM and EDGE Measurements, product note, literature number 5988-3700ENSelf-Guided Demonstration for cdma2000 Measurements, product note, literature number 5988-3701ENSelf-Guided Demonstration for 1xEV-DO Measurements, product note, literature number 5988–6208ENSelf-Guided Demonstration for cdmaOne Measurements, product note, literature number 5988-3702ENSelf-Guided Demonstration for NADC and PDC Measurements, product note, literaturenumber 5988-3703ENPSA Series Demonstration CD, literature number 5988-2390ENOptimizing Dynamic Range for Distortion Measurements, product note, literature number 5980-3079ENPSA Series Amplitude Accuracy, product note, literature number 5980-3080ENPSA Series Swept and FFT Analysis, product note, literature number 5980-3081ENPSA Series Measurement Innovations and Benefits, product note, literature number 5980-3082ENPSA Series Spectrum Analyzer Performance Guide Using 89601A Vector Signal AnalysisSoftware, product note, literature number 5988-5015ENSelecting the Right Signal Analyzer for Your Needs, selection guide, literature number 5968-3413E8 Hints for Millimeter Wave Spectrum Measurements, application note, literature number 5988–5680ENPSA Series Spectrum Analyzer Performance Guide Using 89601A Vector Signal AnalysisSoftware, product note, literature number 5988-5015EN89600 series + PSA, 802.11A and HiperLAN2 ODFM Measurements, product note, literature number 5988-4094ENN4256A Amplifier Distortion Test Set, product overview, 5988-2925ENBenchLink Web Remote Control Softeware, product overview, literature number 5988-2610ENHP 8566B/68B Programming Code Compatibility for PSA and ESA-E Series SpectrumAnalyzers, product overview, literature number 5988-5808ENIntuiLink Software, Data Sheet, Literature Number 5980-3115EN
For more information on the PSA series, please visit:
www.agilent.com/find/psa