Embed Size (px)
Citation preview
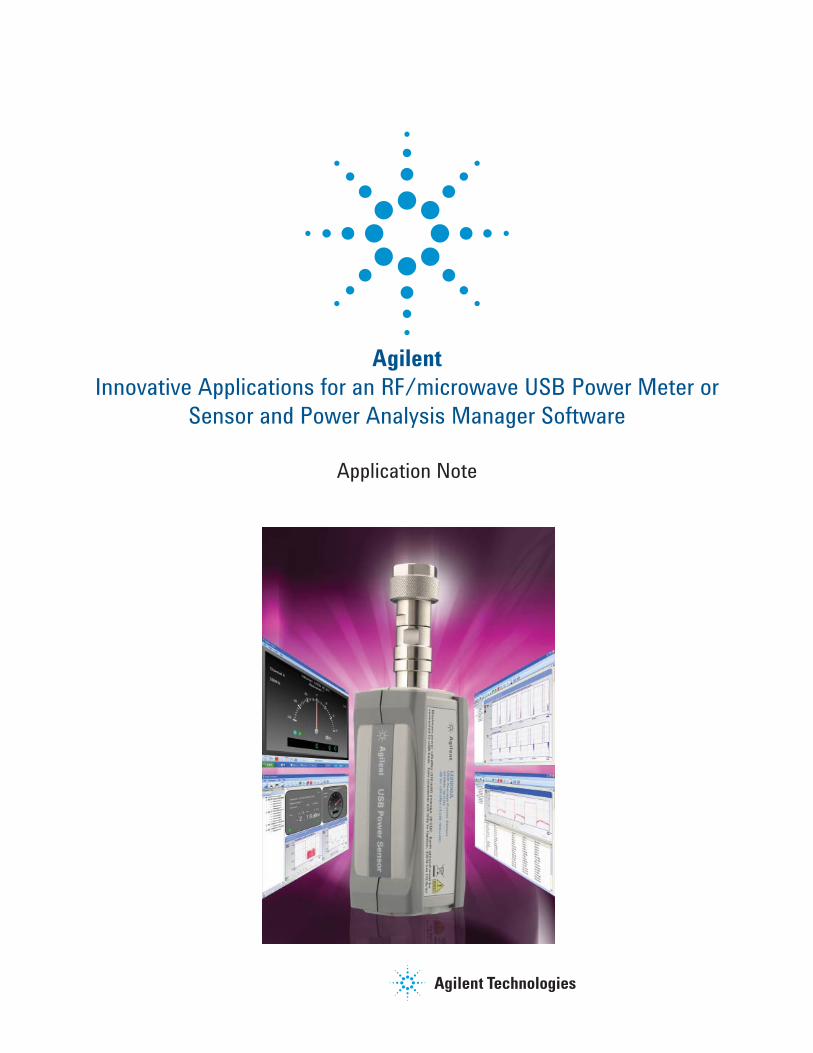
Agilent
Innovative Applications for an RF/microwave USB Power Meter or
Sensor and Power Analysis Manager Software
Application Note
2
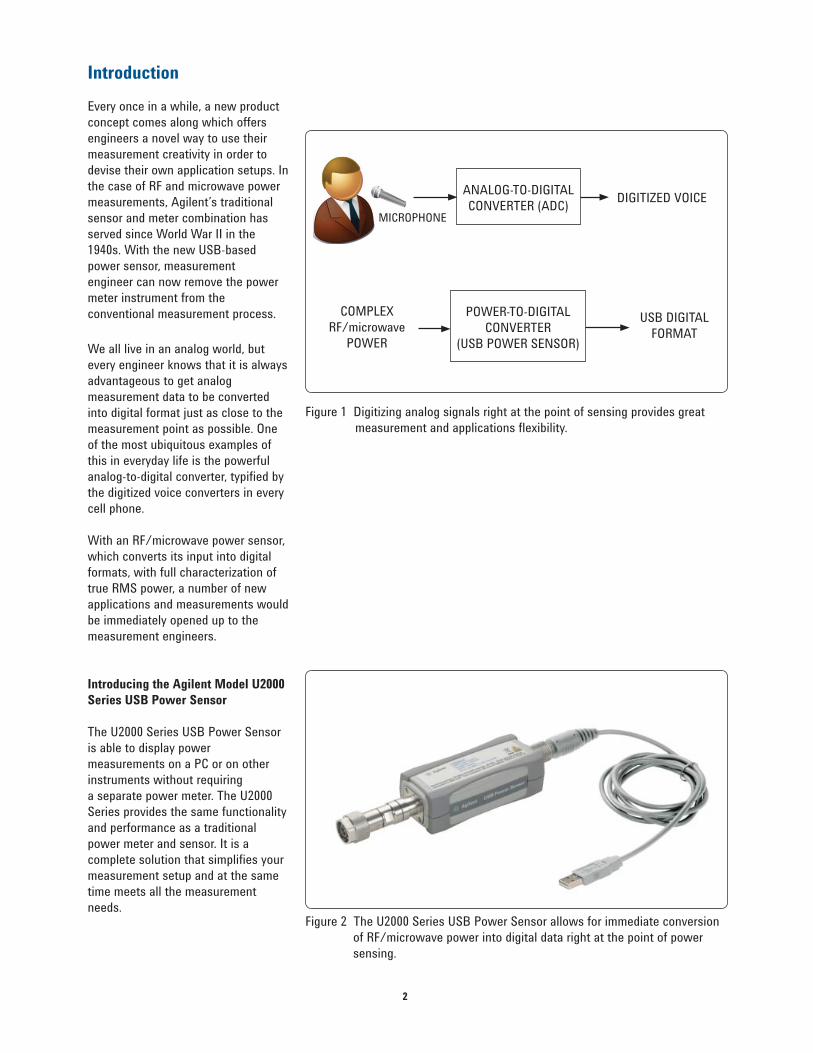
Figure 1 Digitizing analog signals right at the point of sensing provides great
measurement and applications fl exibility.
Introduction
Every once in a while, a new product
concept comes along which offers
engineers a novel way to use their
measurement creativity in order to
devise their own application setups. In
the case of RF and microwave power
measurements, Agilent’s traditional
sensor and meter combination has
served since World War II in the
1940s. With the new USB-based
power sensor, measurement
engineer can now remove the power
meter instrument from the
conventional measurement process.
We all live in an analog world, but
every engineer knows that it is always
advantageous to get analog
measurement data to be converted
into digital format just as close to the
measurement point as possible. One
of the most ubiquitous examples of
this in everyday life is the powerful
analog-to-digital converter, typifi ed by
the digitized voice converters in every
cell phone.
With an RF/microwave power sensor,
which converts its input into digital
formats, with full characterization of
true RMS power, a number of new
applications and measurements would
be immediately opened up to the
measurement engineers.
Introducing the Agilent Model U2000
Series USB Power Sensor
The U2000 Series USB Power Sensor
is able to display power
measurements on a PC or on other
instruments without requiring
a separate power meter. The U2000
Series provides the same functionality
and performance as a traditional
power meter and sensor. It is a
complete solution that simplifi es your
measurement setup and at the same
time meets all the measurement
needs.Figure 2 The U2000 Series USB Power Sensor allows for immediate conversion
of RF/microwave power into digital data right at the point of power
sensing.
ANALOG-TO-DIGITAL
CONVERTER (ADC)
POWER-TO-DIGITAL
CONVERTER
(USB POWER SENSOR)
DIGITIZED VOICE
COMPLEX
RF/microwave
POWER
USB DIGITAL
FORMAT
MICROPHONE
3
The Universal Serial Bus (USB) is no
longer a stranger to many and is
increasingly gaining favor as an
alternative interface in the world of
testing and measurements. USB
provides easy and wideband data
connections to peripheral devices.
The U2000 Series USB power sensor
is developed based on the technology
of our classic microwave diode power
sensors, which depended on the
stable detection properties of the Low
Barrier Schottky (LBS) microwave
diode technology. It is able to sense
CW and average power within the
frequency range of 9 kHz to 24 GHz,
and power levels from –60 dBm to
+20 dBm at a measurement speed
of up to 1000 readings per second
in buffered mode. Furthermore, each
sensor is able to operate on the DC
power supply of the USB data system
and each sensor draws approximately
170 mA from the USB port. Hence,
external power cables are not
required.
By liberating the power sensing
measurement from its traditional
electronic power meter instrument,
and providing the display and analysis
capability on a regular personal
computer (PC), a wide variety of
new applications can be envisioned.
Remote power sensing fi rst comes
to mind, measuring power up on
a transmitter tower, for example,
because sensor cabling is immediately
simplifi ed.
Production applications requiring
multiple power sensors are also easily
accomplished since multiple U2000
Series sensors’ data can be
multiplexed to the same computer
display. This data can be manipulated
for cross-sensor parameters, such as
refl ection coeffi cient, component gain
measurements, and so forth.
The U2000 Series comes with a
powerful companion data analysis and
control, the Agilent N1918A Power
Panel. It provides a front panel display,
a standard graphical user interface
(GUI) for the sensor. Thus, making the
PC act like a traditional power meter
display with both analog and digital
displays available simultaneously.
Figures 3 to 5 show some typical
display options providing powerful
applications measurements in various
data formats.
A New USB Power Sensor Series and Power Analysis Manager Software
The power and frequency coverage of the new family of U2000 Series are:
Agilent Model Frequency Range Power Range
U2000A 10 MHz to 18 GHz –60 dBm to +20 dBm
U2001A 10 MHz to 6 GHz –60 dBm to +20 dBm
U2002A 50 MHz to 24 GHz –60 dBm to +20 dBm
U2004A 9 kHz to 6 GHz –60 dBm to +20 dBm
Higher power level models with capabilities of up to +44 dBm (25 Watts) will be
offered soon.
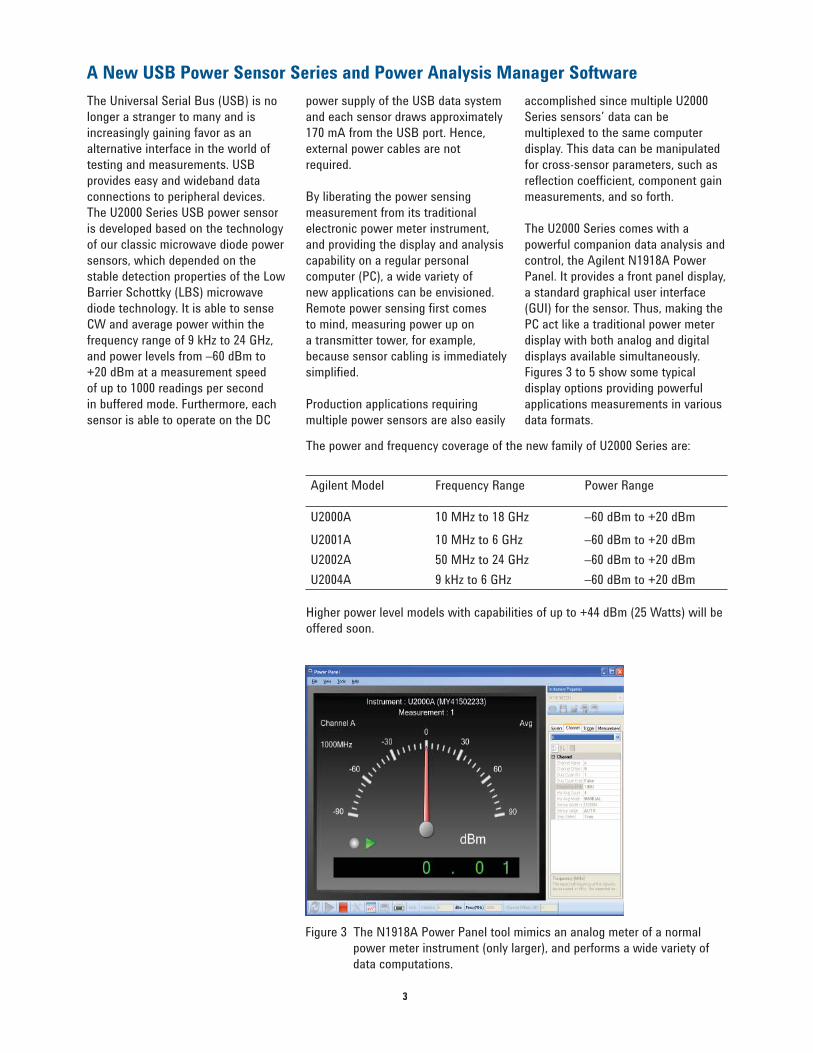
Figure 3 The N1918A Power Panel tool mimics an analog meter of a normal
power meter instrument (only larger), and performs a wide variety of
data computations.
4
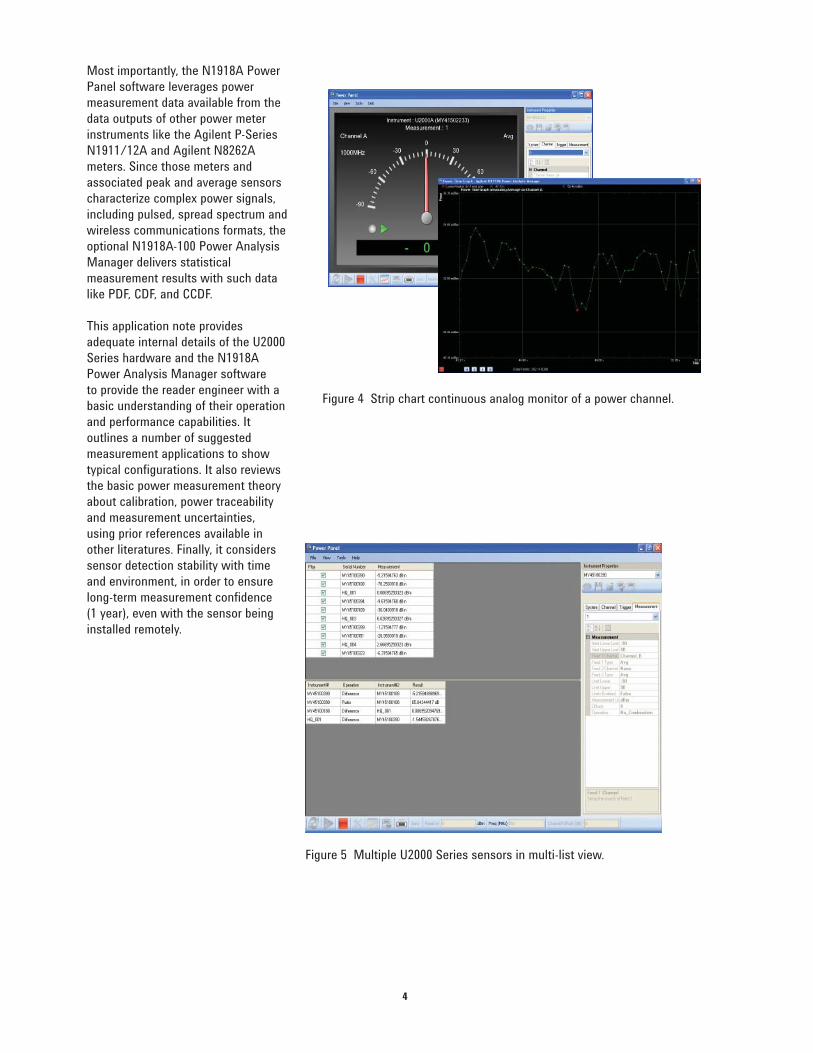
Figure 4 Strip chart continuous analog monitor of a power channel.
Figure 5 Multiple U2000 Series sensors in multi-list view.
Most importantly, the N1918A Power
Panel software leverages power
measurement data available from the
data outputs of other power meter
instruments like the Agilent P-Series
N1911/12A and Agilent N8262A
meters. Since those meters and
associated peak and average sensors
characterize complex power signals,
including pulsed, spread spectrum and
wireless communications formats, the
optional N1918A-100 Power Analysis
Manager delivers statistical
measurement results with such data
like PDF, CDF, and CCDF.
This application note provides
adequate internal details of the U2000
Series hardware and the N1918A
Power Analysis Manager software
to provide the reader engineer with a
basic understanding of their operation
and performance capabilities. It
outlines a number of suggested
measurement applications to show
typical confi gurations. It also reviews
the basic power measurement theory
about calibration, power traceability
and measurement uncertainties,
using prior references available in
other literatures. Finally, it considers
sensor detection stability with time
and environment, in order to ensure
long-term measurement confi dence
(1 year), even with the sensor being
installed remotely.
5
The U2000 Series is based on the
powerful RF/icrowave diode sensing
technologies which have been
exploited by Agilent for over 30 years.
Introduced as the HP 8484A sensor in
1975, it utilized the then-new LBS
diode technology, which featured
metal to semiconductor junctions.
Such diode junctions are rugged,
highly consistent and repeatable from
diode to diode, and reliable in long
term measurement. [Ref: 1.2, page 19]
Over the years, the diode power
sensors have been improved to include
balanced (back-to-back) diode
confi gurations and also the addition of
two channel adaptations that extended
the power dynamic (square-law) range
signifi cantly.
Balanced diodes reduce the effect of
signal harmonics on the measurement.
In addition, later improvements
included super-integration of diodes
onto a single micro-substrate. A
functional block which provides for
on-board zeroing is also included on
the same substrate, thus removing the
need for any operators to unscrew the
RF sensor connector from test power
signal or to turn off the the test power.
In the U2000 Series, 5-diode stacks are
used for the high power range which
extends the dynamic range square-law
detection, and 2-diode stacks for the
low power range.
These stack technologies have
already been used in previous sensor
product lines. By basing the U2000
Series diodes on the popular E9300
Series sensor technology and the
on-board zeroing of the P-series
(N1921/22A) sensor technology, the
new sensors include all the signal
conditioning and analog-to-digital
formatting functions that have been in
use for several years. Thus, users can
be assured that the new USB power
sensor will deliver highly predictable
results.
[Ref: 2, pages 24–30] [Ref: 5]
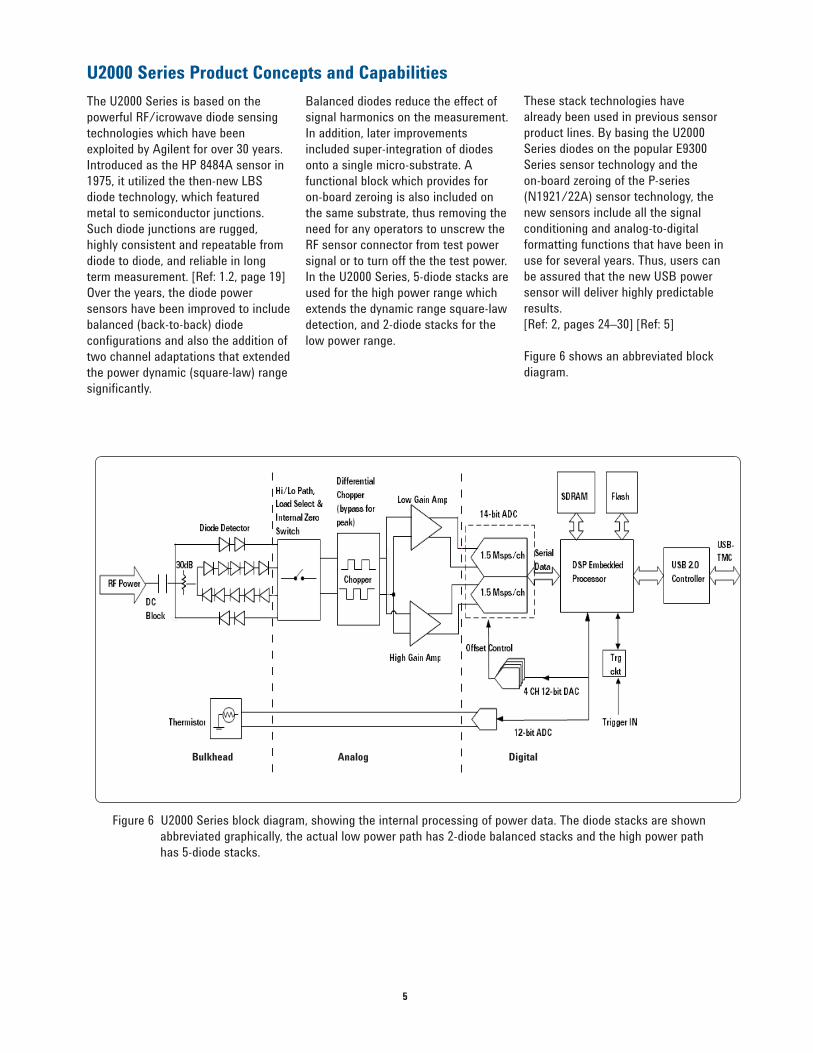
Figure 6 shows an abbreviated block
diagram.
Figure 6 U2000 Series block diagram, showing the internal processing of power data. The diode stacks are shown
abbreviated graphically, the actual low power path has 2-diode balanced stacks and the high power path
has 5-diode stacks.
U2000 Series Product Concepts and Capabilities
Bulkhead DigitalAnalog
6
In brief, the input RF/microwave
power drives two measurement
channels, one for the lower level
signals and the other through a
resistive 30 dB attenuator for the high
level channel. At the transition power
point, approximately –10 dBm, the
internal circuitry determines which
channel will provide the output data.
Amplifi cation and signal conditioning
assure that drift and gain stability are
not compromised before hitting the
high performance 14-bit
analog-to-digital converter modules.
From there, the digitized power data
enters the processor which operates
as an on-board computer for the
self-contained sensor.
The processor controls all the
housekeeping details, monitors its
sensor temperature, and provides data
corrections for the frequency
calibration factor. It also determines
which high-low channel to read,
prepares the raw digitized data for
the USB communications bus, and
recieves command information from
the PC or instrument controller. The
processor reacts to the external trigger
signal and maintains corrections for
the analog signal and analog-to-digital
converter offset signals.
The most obvious controller for the
“Smart Sensor” is the ever-present PC
or laptop. All modern computers have
provisions for USB data connections,
and setting them up is as simple as
hooking up any peripherals to the PC.
It is calibration factor versus
frequency, and also versus
temperature. Temperature within the
power sensing diode bulkhead is
monitored by the thermistor shown in
the block diagram in Figure 6 and this
temperature data is used in the
correction algorithm. The block
diagram in Figure 6 shows two
on-board memory modules that
supplement the basic microprocessor.
The 64 MB synchronous dynamic
random-access-memory (SDRAM) is a
general purpose RAM, used for most
of the variables data such as offset
tables, calibration tables and corrected
power readings. The 4 MB Flash
Memory contains the instrumentation
fi rmware and correction algorithm that
corrects for frequency response of the
sensor, using a 3-dimensional data
matrix.
One of the key features of the U2000
Series is that it does not require daily
calibration. The U2000 Series comes
with pre-written calibration data in the
memory of the sensor. The compact
design of the U2000 Series which
combines all the meter and sensor
electronics in a small casing
eliminates the need to use an
external reference source for sensor
calibration.
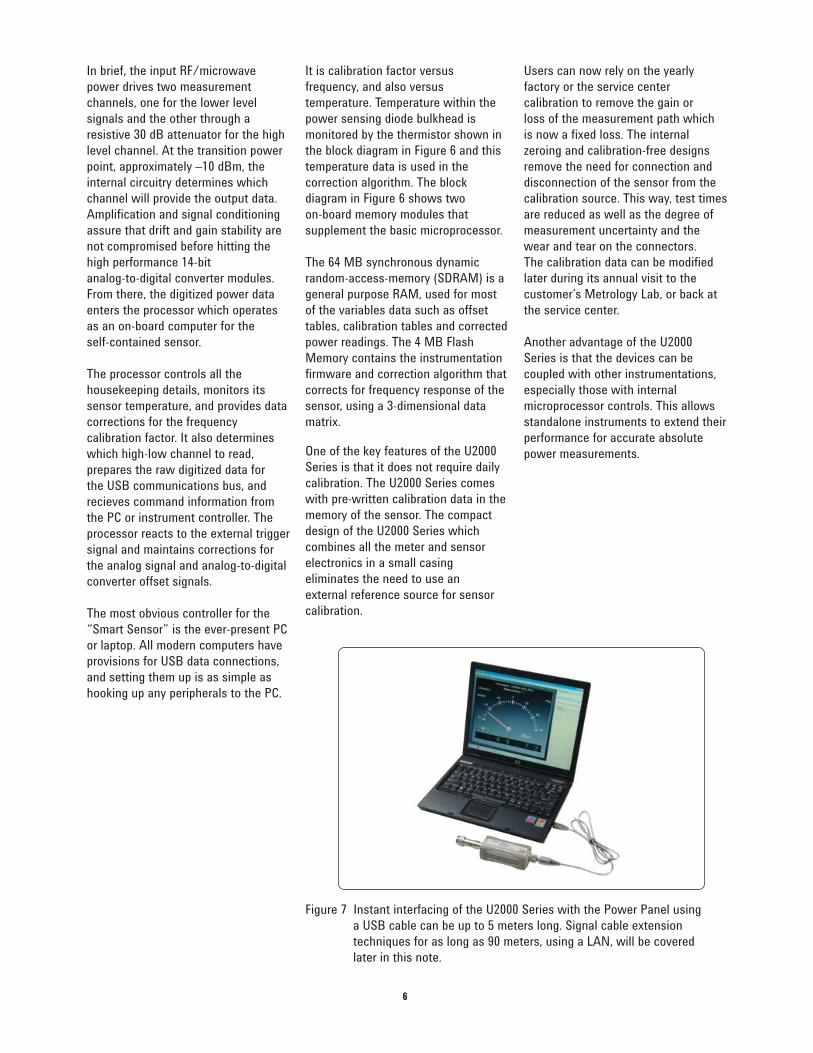
Figure 7 Instant interfacing of the U2000 Series with the Power Panel using
a USB cable can be up to 5 meters long. Signal cable extension
techniques for as long as 90 meters, using a LAN, will be covered
later in this note.
Users can now rely on the yearly
factory or the service center
calibration to remove the gain or
loss of the measurement path which
is now a fi xed loss. The internal
zeroing and calibration-free designs
remove the need for connection and
disconnection of the sensor from the
calibration source. This way, test times
are reduced as well as the degree of
measurement uncertainty and the
wear and tear on the connectors.
The calibration data can be modifi ed
later during its annual visit to the
customer’s Metrology Lab, or back at
the service center.
Another advantage of the U2000
Series is that the devices can be
coupled with other instrumentations,
especially those with internal
microprocessor controls. This allows
standalone instruments to extend their
performance for accurate absolute
power measurements.
7
Once the data is digitized, power
measurement data which is derived
from the U2000 Series power sensors
or P-Series power meter can be
processed in different ways. The
N1918A Power Analysis Manager
provides powerful analysis tools
for a variety of purposes, which are
summarized here.
The N1918A is available in two confi gurations:
Power Panel, Basic: Bundled with • the purchase of the U2000 Series USB Power Sensor.
Power Analyzer, Option 100, • Advanced: Licensed version, with extended performance capabilities, such as pulse
analysis and power statistics analysis.
The N1918A is compatible with a variety of sources:
U2000A/1A/2A/4A USB sensors• N1911/1912A P-Series power • metersN8262A P-Series modular power • meter LXI-C compliance
Option 100, Power Analyzer:
Enhanced visualization with • bigger and fl exible display formats
Provides complete pulse power • characterization (15 pulse
parameters)
• Supports overlay measurements
(limit, min, max, delta) and
channel math computations
Computes powerful • statistical power routines on
communications measurements,
such as PDF, CDF and CCDF
Stores up to seven days worth of • data from preprogrammed
measurement time schedules
Limit and alert function for remote • monitoring
Users should consult the N1918A
Data Sheet for further details on these
two software packages. The following
fi gures provide sample screenshots of
the application.
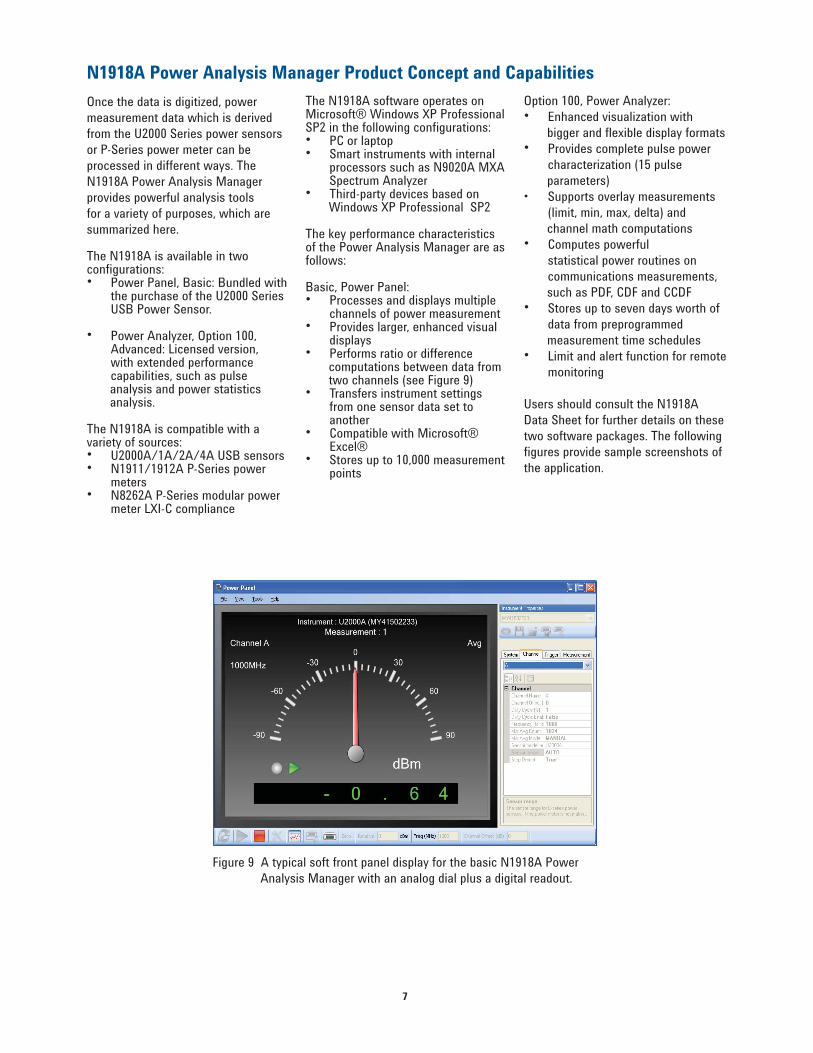
Figure 9 A typical soft front panel display for the basic N1918A Power
Analysis Manager with an analog dial plus a digital readout.
N1918A Power Analysis Manager Product Concept and Capabilities
The N1918A software operates on Microsoft® Windows XP Professional SP2 in the following confi gurations:
PC or laptop• Smart instruments with internal • processors such as N9020A MXA Spectrum AnalyzerThird-party devices based on•
Windows XP Professional SP2
The key performance characteristics of the Power Analysis Manager are as follows:
Basic, Power Panel:Processes and displays multiple • channels of power measurementProvides larger, enhanced visual • displaysPerforms ratio or difference •
computations between data from two channels (see Figure 9)
Transfers instrument settings • from one sensor data set to anotherCompatible with Microsoft® • Excel®Stores up to 10,000 measurement • points
8
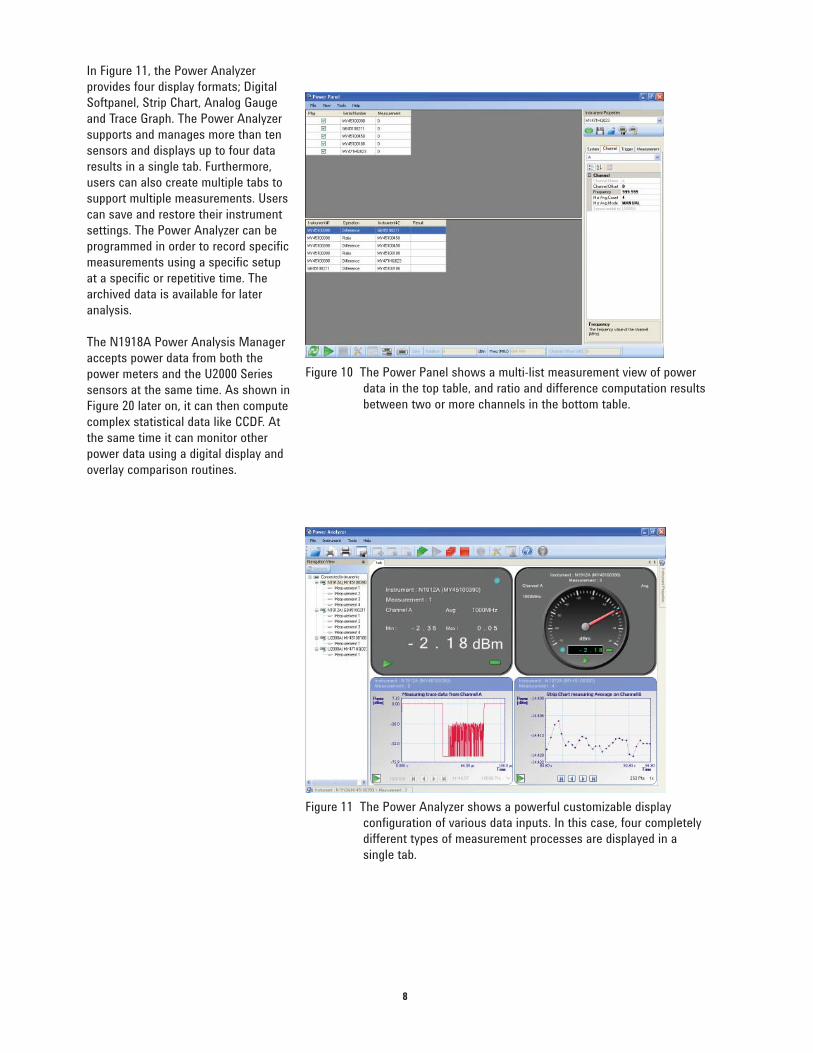
Figure 10 The Power Panel shows a multi-list measurement view of power
data in the top table, and ratio and difference computation results
between two or more channels in the bottom table.
Figure 11 The Power Analyzer shows a powerful customizable display
confi guration of various data inputs. In this case, four completely
different types of measurement processes are displayed in a
single tab.
In Figure 11, the Power Analyzer
provides four display formats; Digital
Softpanel, Strip Chart, Analog Gauge
and Trace Graph. The Power Analyzer
supports and manages more than ten
sensors and displays up to four data
results in a single tab. Furthermore,
users can also create multiple tabs to
support multiple measurements. Users
can save and restore their instrument
settings. The Power Analyzer can be
programmed in order to record specifi c
measurements using a specifi c setup
at a specifi c or repetitive time. The
archived data is available for later
analysis.
The N1918A Power Analysis Manager
accepts power data from both the
power meters and the U2000 Series
sensors at the same time. As shown in
Figure 20 later on, it can then compute
complex statistical data like CCDF. At
the same time it can monitor other
power data using a digital display and
overlay comparison routines.
9
Measurement Applications
of the U2000 Series USB
Power Sensor
With the performance capabilities and
data fl exibility of the new U2000 Series
and the Power Analysis Manager,
measurement engineers have the
ready-to-use solutions at hand for the
power measurement requirements
of their applications. The following
suggested applications will serve to
stimulate their creativeness.
Remote Power Measurements
One of the serious limiting factors of the traditional power meter and sensor
instrumentation is that the connection cable between them carried ultra-low-
level analog signals. Thus, the cable placed defi nite limits on the distance
between the sensor and the meter. The U2000 Series converts the power data to
digital format, hence power measurement can be made over very long distances.
Figure 12 shows a remote antenna which requires transmitter power monitoring
on a regular basis. By permanently installing the U2000 Series on a power tap-
off, and arranging the data connection through LAN formats, the actual power
monitor can be in the antenna system control room hundreds of feet away. The
USB data transfer capabilities limit the cable length to about 5 meters, so in this
case, an Agilent E5813A USB-to-LAN hub converter is used. The typical LAN
operating distance can be up to 90 meters or more, which is about the length of
a football fi eld, that should easily handle the remote antenna sites.
Figure 12 A far remote power sensor converts the monitored system power to digital data, which is transferred to the
control room computers through a commercial USB cable and LAN data extension.
Control Room
Long LAN Cable
USB-to-LAN hub
E5813A
Commercial
USB Cable
USB Sensor
Antenna Tower
10
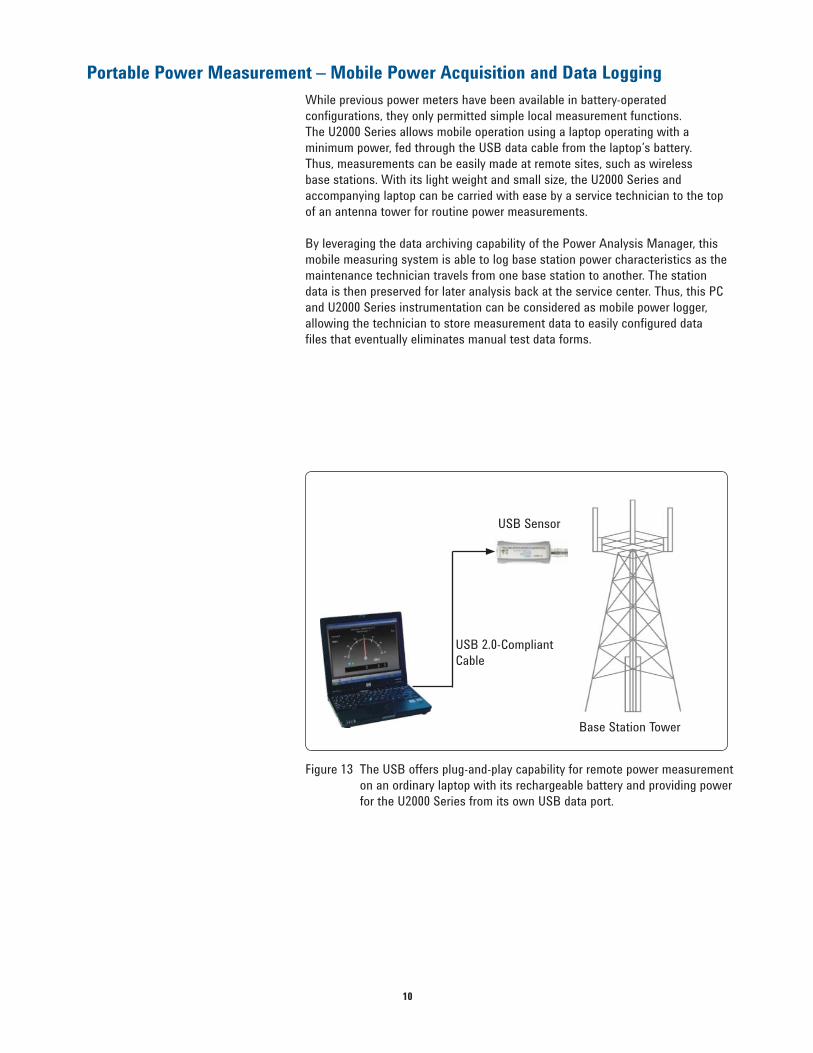
Portable Power Measurement – Mobile Power Acquisition and Data Logging
While previous power meters have been available in battery-operated
confi gurations, they only permitted simple local measurement functions.
The U2000 Series allows mobile operation using a laptop operating with a
minimum power, fed through the USB data cable from the laptop’s battery.
Thus, measurements can be easily made at remote sites, such as wireless
base stations. With its light weight and small size, the U2000 Series and
accompanying laptop can be carried with ease by a service technician to the top
of an antenna tower for routine power measurements.
By leveraging the data archiving capability of the Power Analysis Manager, this
mobile measuring system is able to log base station power characteristics as the
maintenance technician travels from one base station to another. The station
data is then preserved for later analysis back at the service center. Thus, this PC
and U2000 Series instrumentation can be considered as mobile power logger,
allowing the technician to store measurement data to easily confi gured data
fi les that eventually eliminates manual test data forms.
Figure 13 The USB offers plug-and-play capability for remote power measurement
on an ordinary laptop with its rechargeable battery and providing power
for the U2000 Series from its own USB data port.
USB 2.0-Compliant
Cable
USB Sensor
Base Station Tower
11
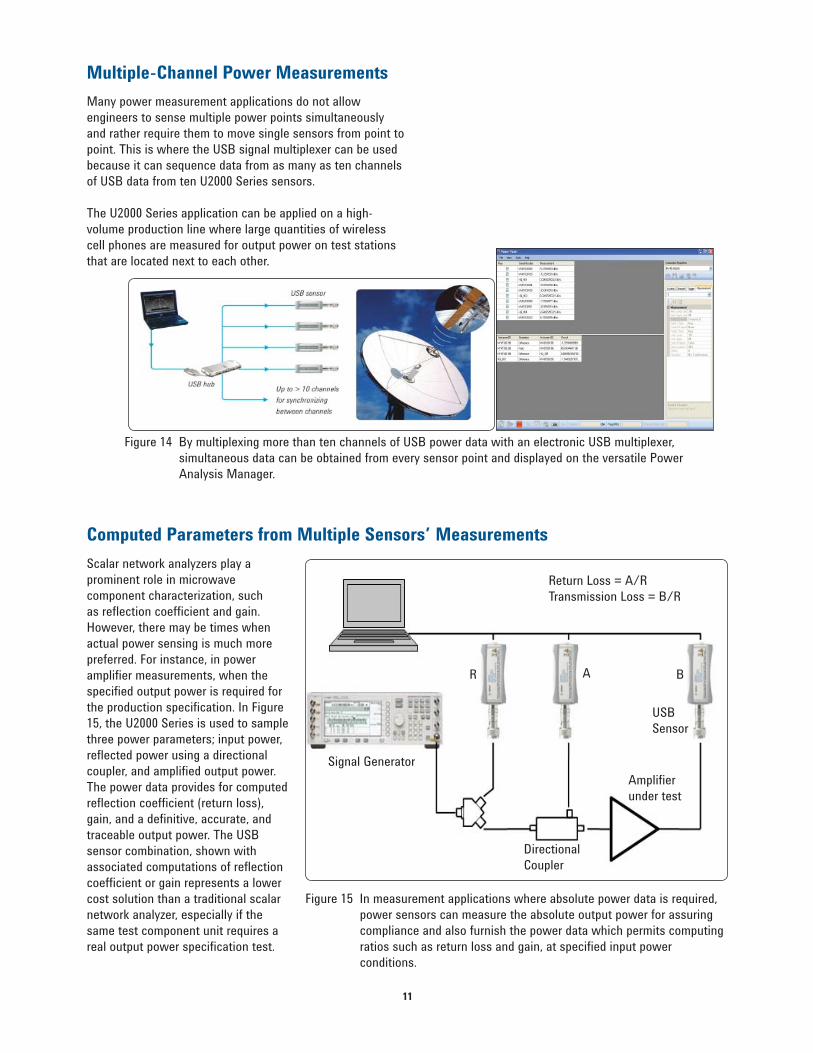
Many power measurement applications do not allow
engineers to sense multiple power points simultaneously
and rather require them to move single sensors from point to
point. This is where the USB signal multiplexer can be used
because it can sequence data from as many as ten channels
of USB data from ten U2000 Series sensors.
The U2000 Series application can be applied on a high-
volume production line where large quantities of wireless
cell phones are measured for output power on test stations
that are located next to each other.
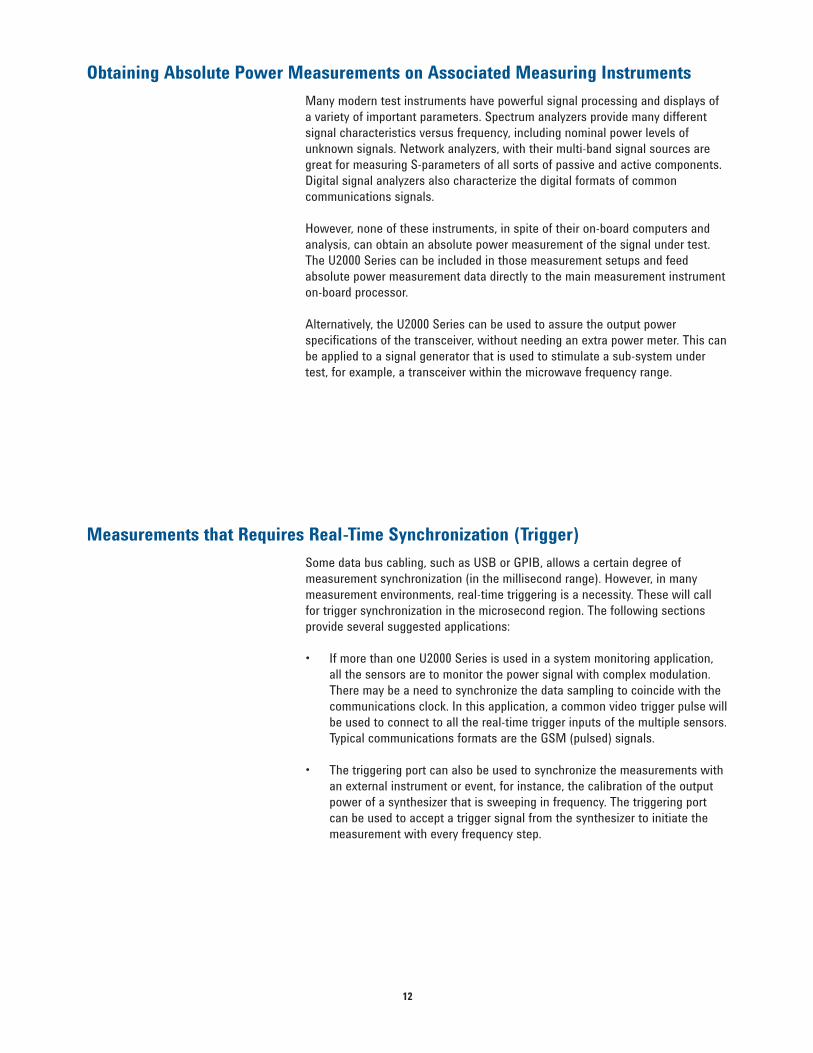
Scalar network analyzers play a
prominent role in microwave
component characterization, such
as refl ection coeffi cient and gain.
However, there may be times when
actual power sensing is much more
preferred. For instance, in power
amplifi er measurements, when the
specifi ed output power is required for
the production specifi cation. In Figure
15, the U2000 Series is used to sample
three power parameters; input power,
refl ected power using a directional
coupler, and amplifi ed output power.
The power data provides for computed
refl ection coeffi cient (return loss),
gain, and a defi nitive, accurate, and
traceable output power. The USB
sensor combination, shown with
associated computations of refl ection
coeffi cient or gain represents a lower
cost solution than a traditional scalar
network analyzer, especially if the
same test component unit requires a
real output power specifi cation test.
Figure 14 By multiplexing more than ten channels of USB power data with an electronic USB multiplexer,
simultaneous data can be obtained from every sensor point and displayed on the versatile Power
Analysis Manager.
Figure 15 In measurement applications where absolute power data is required,
power sensors can measure the absolute output power for assuring
compliance and also furnish the power data which permits computing
ratios such as return loss and gain, at specifi ed input power
conditions.
Signal Generator
Directional
Coupler
USB
Sensor
R A B
Return Loss = A/R
Transmission Loss = B/R
Amplifi er
under test
Multiple-Channel Power Measurements
Computed Parameters from Multiple Sensors’ Measurements
12
Obtaining Absolute Power Measurements on Associated Measuring Instruments
Measurements that Requires Real-Time Synchronization (Trigger)
Some data bus cabling, such as USB or GPIB, allows a certain degree of
measurement synchronization (in the millisecond range). However, in many
measurement environments, real-time triggering is a necessity. These will call
for trigger synchronization in the microsecond region. The following sections
provide several suggested applications:
• If more than one U2000 Series is used in a system monitoring application,
all the sensors are to monitor the power signal with complex modulation.
There may be a need to synchronize the data sampling to coincide with the
communications clock. In this application, a common video trigger pulse will
be used to connect to all the real-time trigger inputs of the multiple sensors.
Typical communications formats are the GSM (pulsed) signals.
• The triggering port can also be used to synchronize the measurements with
an external instrument or event, for instance, the calibration of the output
power of a synthesizer that is sweeping in frequency. The triggering port
can be used to accept a trigger signal from the synthesizer to initiate the
measurement with every frequency step.
Many modern test instruments have powerful signal processing and displays of
a variety of important parameters. Spectrum analyzers provide many different
signal characteristics versus frequency, including nominal power levels of
unknown signals. Network analyzers, with their multi-band signal sources are
great for measuring S-parameters of all sorts of passive and active components.
Digital signal analyzers also characterize the digital formats of common
communications signals.
However, none of these instruments, in spite of their on-board computers and
analysis, can obtain an absolute power measurement of the signal under test.
The U2000 Series can be included in those measurement setups and feed
absolute power measurement data directly to the main measurement instrument
on-board processor.
Alternatively, the U2000 Series can be used to assure the output power
specifi cations of the transceiver, without needing an extra power meter. This can
be applied to a signal generator that is used to stimulate a sub-system under
test, for example, a transceiver within the microwave frequency range.
13
Measurement
Applications of the N1918A
Power Analysis Manager
The N1918A Power Analysis Manager
is a suite of application toos that
comprises a basic version which
comes with the purchase of the U2000
Series, and an advanced version,
Option 100, which is an optional,
licensed software. The technical data
sheet for the N1918A describes the
differences in the performance and
capabilities for the two versions in
detail. The following applications are
intended to provide the measurement
engineer with power requirement
information in order to check if the
statistical routines, data archiving
provisions, and manipulation
information are suffi cient. Figure 17
provides an overview of the different
capabilities.
Data Gathering Function
The N1918A Power Analysis Manager is a multi-faceted software application,
running on Windows operating systems, which multiplies the measurement and
diagnostic power of a user’s power data collection. In its simplest confi guration,
it gathers power measurement data from three typical sources, as shown in
Figure 17: the N1911/12A P-Series Power Meter, the N8262A P-Series Modular
Power Meter and the U2000 Series USB Power Sensor.
All the data that is provided is formatted on the basis of the Standard Commands
for Programmable Instrumentation (SCPI). SCPI defi nes a uniform and consistent
language for the control of test and measurement equipment, and the transfer
of data. 1The transfer of data can be done through any of these three data and
control buses; USB, GPIB or LAN connectivity, which are generally available on
most modern power meters.
1 Refer to www.scpiconsortium.org/scpiinfo2.htm for SCPI standard.
Figure 17 The N1918A Power Analysis Manager interfaces with power
measurement data from various sources, two power meters as
shown, plus the U2000 Series.
N8262A N1918A U2000 Series
N1918A ADVANCED
— OPTION 100
N1918A BASIC
IVI-COM & VISA
14
Power Panel (basic) Power Analyzer (advanced)
Compatible Hardware
Instruments supportedU2000 Series USB Power Sensors, N1911A P-Series Single-Channel Power Meter, N1912A
P-Series Dual-Channel Power Meter, N8262A P-Series Modular Power Meter
Measurement Displays -- Easy to learn and fl exible display format
Digital Softpanel Display (Enhanced with MIN/MAX measurement,
limits and alerts notifi cation)
Gauge Display (Enhanced with MIN/MAX measurement,
limits and alerts notifi cation, gauge scale)
Strip Chart Display (Enhanced with display options)
Trace Graph Display *
Multiple Tabs
Multiple Channel List
Graph Functions -- Powerful features to meet your demanding needs
Single Marker (one marker only) (Up to 10 markers per graph)
Dual Marker (Up to fi ve sets per graph)
Graph Autoscaling
Graph Zooming
Measurement Math (Difference, Ratio)
Pulse Characterization -- Alternative to a peak power analyzer, comprehensive pulse parameters characterization
15-Point Pulse Characterization
Gate Measurement Analysis (One per Trace Graph)
Overlay Trace Graph
Waveform Math (Delta, Plus, Ratio)
Trigger Level Indicator (Only applicable in Trace Graph)
Statistical Analysis Function -- Measures and computes CCDF, CDF, PDF
CCDF/CDF/PDF
Save/Load File Functions -- Convenient data logging and storing
Save Measurement Data (Applicable in Power Time Graph) (Only applicable in Strip Chart, Trace Graph,
CCDF/CDF/PDF Graph)
Load Measurement Data (Applicable in Power Time Graph) (Only applicable in Strip Chart, Trace Graph,
CCDF/CDF/PDF Graph)
Data Recording (Only applicable in Trace Graph,
Digital Softpanel, Strip Chart, Gauge
with up to seven days of recording time)
Save Instrument Screen Image
Instrument Settings Options -- Loaded with time-saving feature
Save and Restore Instrument Settings
Measurement Limit and Alert Function -- Optimized for remote operation
Limit and Alert Notifi cation
Alert Summary
Printing Options -- Simple and easy-to-use print option
Print Application Screen
Table 1 Overview of the software capabilities for the two versions of the N1918A Power Analysis Manager.
15
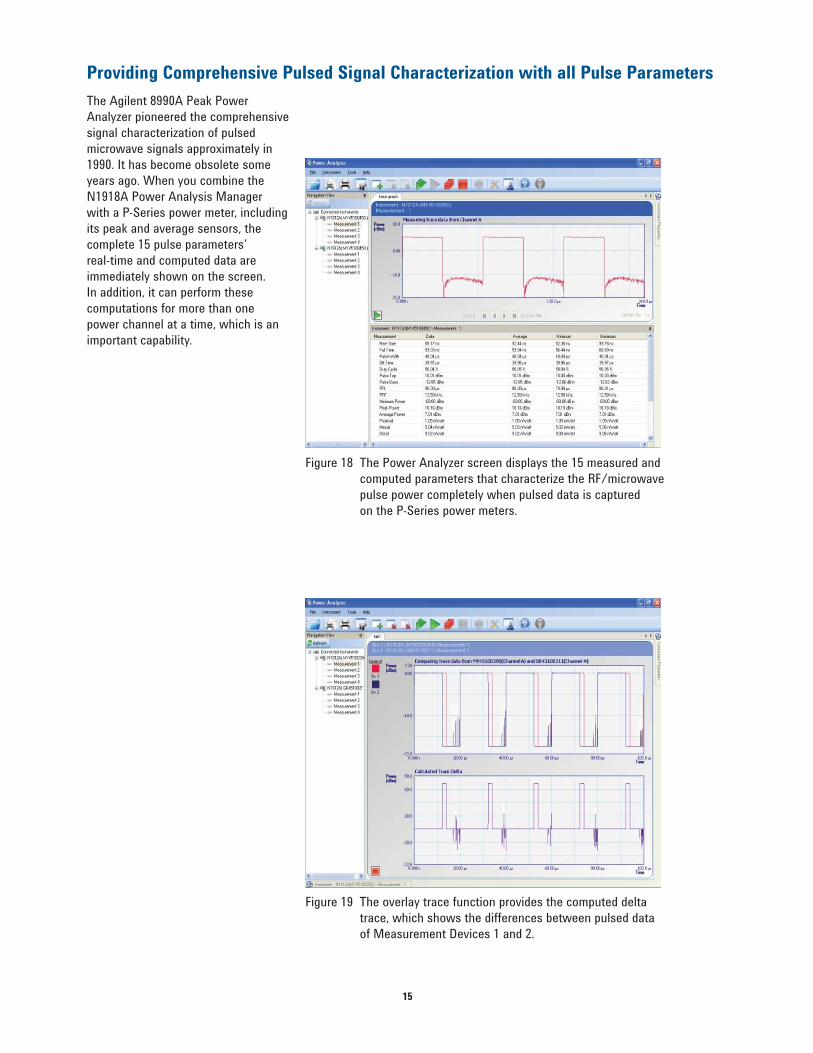
The Agilent 8990A Peak Power
Analyzer pioneered the comprehensive
signal characterization of pulsed
microwave signals approximately in
1990. It has become obsolete some
years ago. When you combine the
N1918A Power Analysis Manager
with a P-Series power meter, including
its peak and average sensors, the
complete 15 pulse parameters’
real-time and computed data are
immediately shown on the screen.
In addition, it can perform these
computations for more than one
power channel at a time, which is an
important capability.
Figure 18 The Power Analyzer screen displays the 15 measured and
computed parameters that characterize the RF/microwave
pulse power completely when pulsed data is captured
on the P-Series power meters.
Figure 19 The overlay trace function provides the computed delta
trace, which shows the differences between pulsed data
of Measurement Devices 1 and 2.
Providing Comprehensive Pulsed Signal Characterization with all Pulse Parameters
16
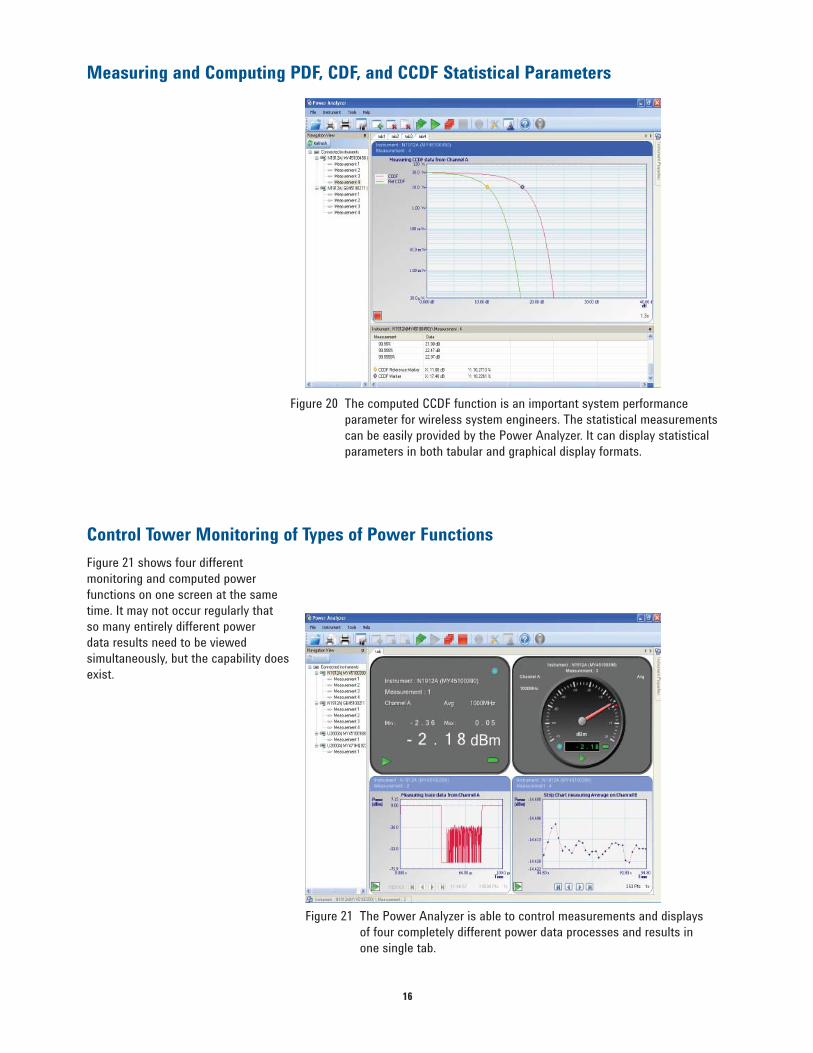
Figure 21 shows four different
monitoring and computed power
functions on one screen at the same
time. It may not occur regularly that
so many entirely different power
data results need to be viewed
simultaneously, but the capability does
exist.
Figure 20 The computed CCDF function is an important system performance
parameter for wireless system engineers. The statistical measurements
can be easily provided by the Power Analyzer. It can display statistical
parameters in both tabular and graphical display formats.
Figure 21 The Power Analyzer is able to control measurements and displays
of four completely different power data processes and results in
one single tab.
Measuring and Computing PDF, CDF, and CCDF Statistical Parameters
Control Tower Monitoring of Types of Power Functions
17
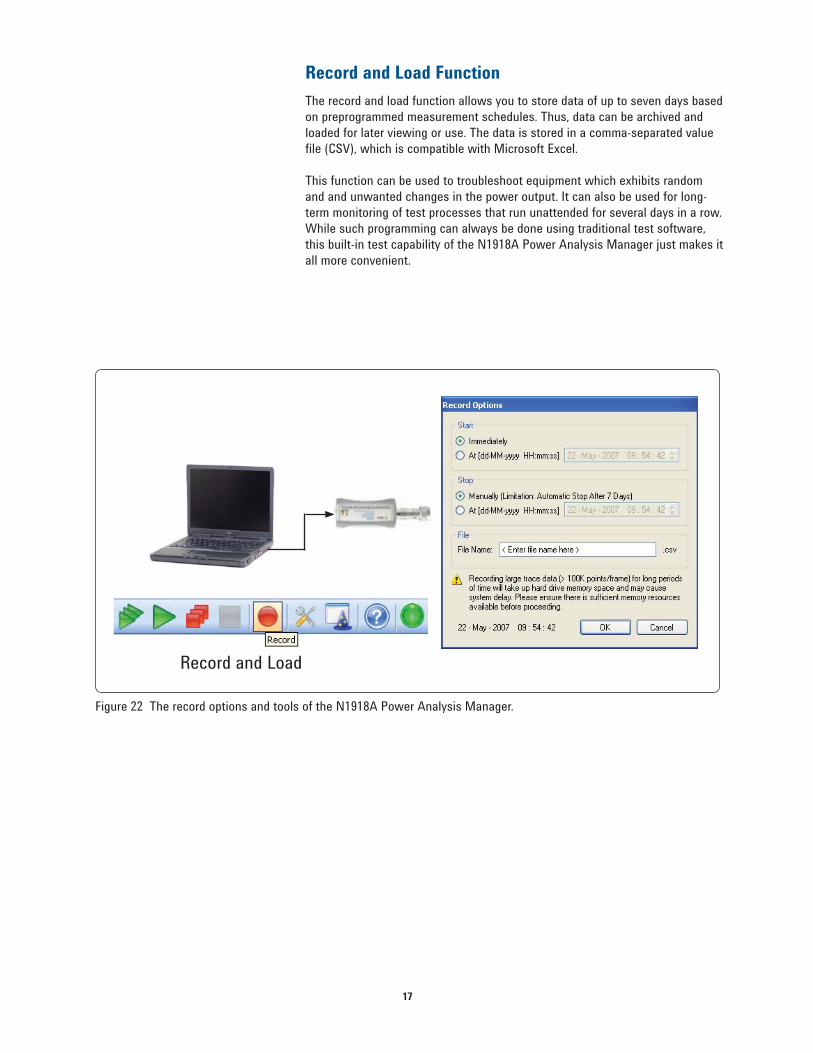
The record and load function allows you to store data of up to seven days based
on preprogrammed measurement schedules. Thus, data can be archived and
loaded for later viewing or use. The data is stored in a comma-separated value
fi le (CSV), which is compatible with Microsoft Excel.
This function can be used to troubleshoot equipment which exhibits random
and and unwanted changes in the power output. It can also be used for long-
term monitoring of test processes that run unattended for several days in a row.
While such programming can always be done using traditional test software,
this built-in test capability of the N1918A Power Analysis Manager just makes it
all more convenient.
Record and Load Function
Figure 22 The record options and tools of the N1918A Power Analysis Manager.
Record and Load
18
Measurement Tips, Calibration, Traceability, and Measurement Uncertainties
5.1 Measurement Tips
There are four important steps that
are necessary to achieve better power
measurement results:
• Understanding the modulation
formats of the signal under test,
• Understanding the power sensor
technology and operating
principles,
• Understanding the principles of
power measurement traceability,
and
• Selecting the right sensor and PC,
power meter or display for the
signals under test.
These principles are discussed in
detail in Application Note 64–4D,
“4 Steps for Making Better Power
Measurements.” 2 To achive optimum
results in measuring power with
the new USB power sensors, it is
recommended for users to read the
referenced note. Of course, since the
USB sensors feature CW and average
power measurements, we will briefl y
review the above four steps with
regards to the specifi c performance of
their diode-stack sensor confi guration.
Getting to know the performance
capabilities of the diode sensors is
important in order to understand how
they process test signal formats. For
example, do signal crest factors
or peak power spikes cause the
diode sensor to deviate from the
dynamic range square-law detection?
High crest factors can occur in
modern wireless signal formats.
Do the averaging processes inside
the digitizing sensor depend on a
synchronization between the digital-
sampling periods and the digital data
clocks of the wireless signal?
The U2000 Series sensors are based
on the LBS technology, pioneered by
Hewlett-Packard in 1975. Throughout
the last three decades, dramatically
improved products have been
introduced. For example, the U2000
Series is partially based on the diode
confi gurations used in the popular
Agilent E9300-Series wide-dynamic
range average-power sensors. An
extensive technical description of the
E9300-Series diode technology is given
in AN 1449–2. [Ref: 1.2, page 24 — 29]
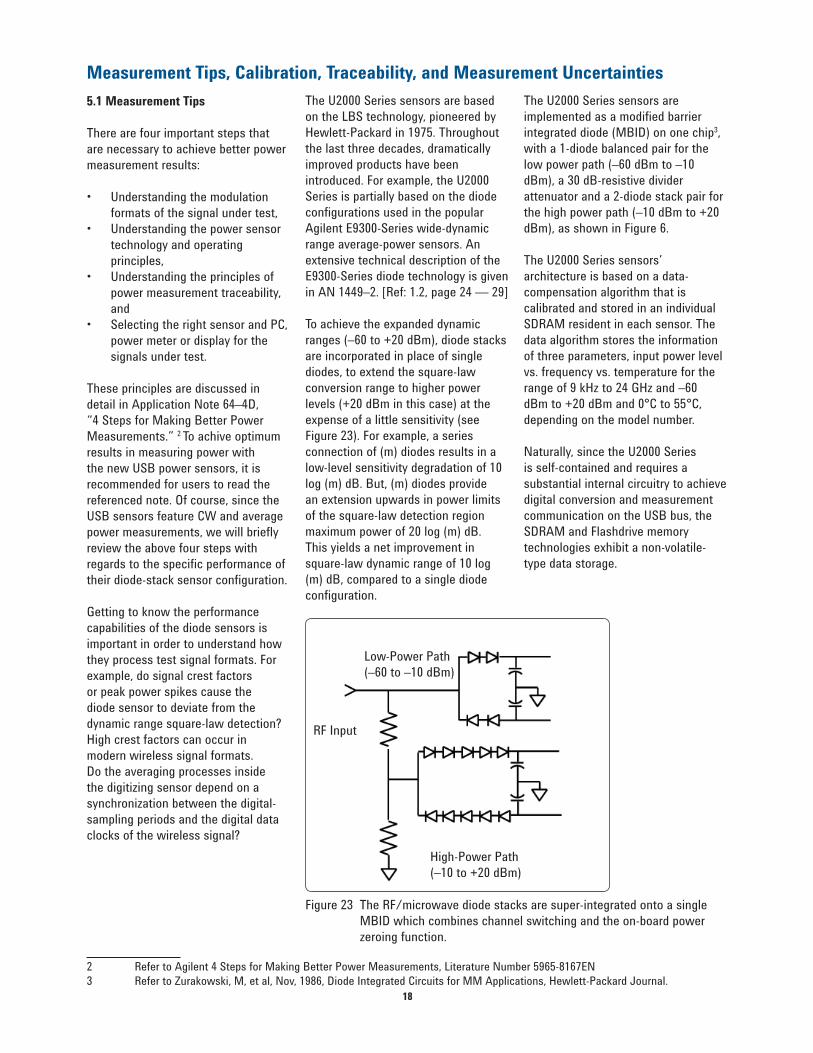
To achieve the expanded dynamic
ranges (–60 to +20 dBm), diode stacks
are incorporated in place of single
diodes, to extend the square-law
conversion range to higher power
levels (+20 dBm in this case) at the
expense of a little sensitivity (see
Figure 23). For example, a series
connection of (m) diodes results in a
low-level sensitivity degradation of 10
log (m) dB. But, (m) diodes provide
an extension upwards in power limits
of the square-law detection region
maximum power of 20 log (m) dB.
This yields a net improvement in
square-law dynamic range of 10 log
(m) dB, compared to a single diode
confi guration.
The U2000 Series sensors are
implemented as a modifi ed barrier
integrated diode (MBID) on one chip3,
with a 1-diode balanced pair for the
low power path (–60 dBm to –10
dBm), a 30 dB-resistive divider
attenuator and a 2-diode stack pair for
the high power path (–10 dBm to +20
dBm), as shown in Figure 6.
The U2000 Series sensors’
architecture is based on a data-
compensation algorithm that is
calibrated and stored in an individual
SDRAM resident in each sensor. The
data algorithm stores the information
of three parameters, input power level
vs. frequency vs. temperature for the
range of 9 kHz to 24 GHz and –60
dBm to +20 dBm and 0°C to 55°C,
depending on the model number.
Naturally, since the U2000 Series
is self-contained and requires a
substantial internal circuitry to achieve
digital conversion and measurement
communication on the USB bus, the
SDRAM and Flashdrive memory
technologies exhibit a non-volatile-
type data storage.
Figure 23 The RF/microwave diode stacks are super-integrated onto a single
MBID which combines channel switching and the on-board power
zeroing function.
RF Input
High-Power Path
(–10 to +20 dBm)
Low-Power Path
(–60 to –10 dBm)
2 Refer to Agilent 4 Steps for Making Better Power Measurements, Literature Number 5965-8167EN
3 Refer to Zurakowski, M, et al, Nov, 1986, Diode Integrated Circuits for MM Applications, Hewlett-Packard Journal.
19
The wide-dynamic square-law range
of the U2000 Series sensors makes
them ideally suited to measure signal
formats with complex modulation
formats which cause high crest
factors. The principle is that the
peaks of the crest factor spikes do
not exceed the square-law detection
range. Crest factors of ten are
easily handled by assuring that the
measurement range of the sensor is
dialed down in such a way that the
peak power does not exceed +20 dBm.
For users measuring complex power
formats with high crest factors, it is
recommended that they refresh their
background on signal formats on the
use of dual path sensors by referring
to [Ref: 2, pages 29 – 30] [Ref: 2, pages
3 – 6].
Applications that require power
measurements of pulsed RF/
microwave signals (such as radar
signals) are covered in the U2000
Series too, provided that it is permitted
to just measure the average power
of the pulsed modulation waveform.
In many if not most of the system
tests, pulsed power transmitters have
fi xed duty cycle (peak power duration
divided by pulsed repetition period),
thus, an average power reading can be
computed to peak power. Again, for
proper averaging, it must be assured
that the peak pulse power entering
the U2000 Series does not exceed +20
dBm so as not to get out of square-law
range. This may require an external
microwave attenuator pad of 10 dB or
20 dB.
The calibration factor versus frequency
versus temperature characterization is
done once at the factory during
manufacturing to measure each
individual diode stack assembly for
temperature variations. The data that
is run against a frequency response
test forms the basis for the
3-dimensional correction table stored
on-board within the U2000 Series in
the SDRAM and Flashdrive. [Ref: 5]
The test of the stability of the
correction table over several
time periods has resulted in
recommendations that re-calibration
is only required once per year. The
sensor works within a specifi ed
warranty period of one year.
Furthermore, when the yearly
calibration cycle is due, the calibration
facility only needs to make a
frequency response test at laboratory
temperature (25°C). It has been
determined that the temperature
sensitivity profi le stays constant over
time as long as no overload damage
has been experienced. The crucial
point of remote installations of the
U2000 Series is the capability to
perform automatic zeroing without
having to disconnect the RF connector
at the power sensing point, or shut
down the system power. This function
is described as an integrated function
on-board the same microcircuit that
holds the diode stacks, and the signal
switching from high to low sensitivity
channels. [Ref: 5]
The calibration process may be
performed by returning the U2000
Series to the Agilent Service Facility
or it can be done in the user’s Cal
Lab. Once the new correction data is
obtained, instructions are available to
permit the calibration facility to
input new data tables into the
individual sensor via the USB
communications bus.
Signal Formats
Calibration, Zero and Cal
20
All the previous technology history and knowledge acquired in using Agilent’s
power measurement equipment is preserved in the U2000 Series. Agilent
follows international standards and processes for assuring traceability to NMIs
(National Measurement Institutes) such as NIST in the U.S. Agilent’s Application
Note 1449–3, which provides exhaustive documentation on the subject. [Ref:
3]. This includes not only the detailed analysis of uncertainty factors, but also
extensive recommendations on how to improve measurement uncertainty and at
the same time reduce the effects of mismatches, and so forth.
Since the U2000 Series might be placed into operation in a location that does
not have ready access to a “Standard 50 MHz, 1 mW power source,” the user
will probably need to rely on the stability of the on-board correction data.
However, in critical measurements, with legal or economic considerations, it
is always possible to arrange to bring a traditional Agilent power meter to the
measuring point, or return the U2000 Series to an available power meter and
create the simple 50 MHz, 1 mW point reference.
Traceability and Uncertainty
21
References
[1] Zurakowski, M, et al, Nov, 1986,
Diode Integrated Circuits for MM
Applications, Hewlett-Packard
Journal.
[2] Anderson, Alan B., June, 2005, In
Context – Internal Zero and
Calibration for RF Power Sensors,
RF Design.
[3] Anderson, Alan B., October, 2000,
Measuring Power Levels in Modern
Communication Systems, MW/RF
Magazine.
Related Literatures
[1] Agilent Fundamentals of RF and
Microwave Power Measurements
(Part 1), Introduction to Power,
History, Defi nitions, International
Standards and Tracebility,
Literature Number 5988-9213EN
[2] Agilent Fundamentals of RF and
Microwave Power Measurements
(Part 2), Power Sensors and
Instrumentation, Literature Number
5988-9214EN
[3] Agilent Fundamentals of RF and
Microwave Power Measurements
(Part 3), Power Measurement
Uncertainty per International
Guides, Literature Number
5988-9215EN
[4] Agilent Fundamentals of RF and
Microwave Power Measurements
(Part 4), An Overview of Agilent
Instrumentation for RF/microwave
Power Measurement, Literature
Number 5988-9216EN
[5] Agilent 4 Steps for Making Better
Power Measurements, Literature
Number 5965-8167EN
Related Web Resources
For SCPI standards, refer to the
following URL:
www.scpiconsortium.org/scpiinfo2.
htm.
www.agilent.com/fi nd/emailupdates
Get the latest information on the
products and applications you select.
www.agilent.com/fi nd/agilentdirect
Quickly choose and use your test
equipment solutions with confi dence.
www.agilent.com/fi nd/open
Agilent Open simplifi es the process
of connecting and programming
test systems to help engineers
design, validate and manufacture
electronic products. Agilent offers
open connectivity for a broad range
of system-ready instruments, open
industry software, PC-standard I/O
and global support, which are
combined to more easily integrate test
system development.
Agilent Email Updates
Agilent Direct
AgilentOpen
Windows and Excel are the US
registered trademarks of Microsoft
Corporation in the United States and/
orother countries.
Remove all doubt
Our repair and calibration services
will get your equipment back to you,
performing like new, when prom-
ised. You will get full value out of
your Agilent equipment through-
out its lifetime. Your equipment
will be serviced by Agilent-trained
technicians using the latest factory
calibration procedures, automated
repair diagnostics and genuine parts.
You will always have the utmost
confi dence in your measurements.
Agilent offers a wide range of ad-
ditional expert test and measure-
ment services for your equipment,
including initial start-up assistance,
onsite education and training, as
well as design, system integration,
and project management.
For more information on repair and
calibration services, go to:
www.agilent.com/fi nd/removealldoubt
www.agilent.com
For more information on Agilent Technologies’
products, applications or services, please
contact your local Agilent office. The
complete list is available at:
www.agilent.com/fi nd/contactus
Americas
Canada (877) 894-4414
Latin America 305 269 7500
United States (800) 829-4444
Asia Pacifi c
Australia 1 800 629 485
China 800 810 0189
Hong Kong 800 938 693
India 1 800 112 929
Japan 0120 (421) 345
Korea 080 769 0800
Malaysia 1 800 888 848
Singapore 1 800 375 8100
Taiwan 0800 047 866
Thailand 1 800 226 008
Europe & Middle East
Austria 0820 87 44 11
Belgium 32 (0) 2 404 93 40
Denmark 45 70 13 15 15
Finland 358 (0) 10 855 2100
France 0825 010 700*
*0.125 €/minute
Germany 01805 24 6333**
**0.14 €/minute
Ireland 1890 924 204
Israel 972-3-9288-504/544
Italy 39 02 92 60 8484
Netherlands 31 (0) 20 547 2111
Spain 34 (91) 631 3300
Sweden 0200-88 22 55
Switzerland 0800 80 53 53
United Kingdom 44 (0) 118 9276201
Other European Countries:
www.agilent.com/fi nd/contactus
Revised: March 27, 2008
Product specifi cations and descriptions
in this document subject to change
without notice.
© Agilent Technologies, Inc. 2008
Printed in USA, June 18, 2008
5989-7268EN