Embed Size (px)
Citation preview

Unit 3 Managing the economy Steve Margetts
Page 1
CONTENTS
Aggregate Demand (AD) 2 Aggregate Supply 4 Equilibrium Between Aggregate Demand And Aggregate Supply 9 Consumption And Savings 11 Investment 17 Government Spending 25 Exports and Imports 29 Objectives Of Government Macroeconomic Policy 31 Inflation 34 Unemployment 50 Economic Growth 71 Balance of Payments 80 Conflicts Between Macro Economic Objectives 84 Demand Management or Supply Side? 87

Unit 3 Managing the economy Steve Margetts
Page 2
AGGREGATE DEMAND (AD) Aggregate demand (AD) is the total demand for goods and services produced in the economy over a period of time. DEFINING AGGREGATE DEMAND Aggregate planned expenditure for goods and services in the economy =
C + I + G + (X-M)
C Consumers' expenditure on goods and services: This includes demand for durables & non-durable goods. I Gross Domestic Fixed Capital Formation - i.e. investment spending by companies on capital goods. Investment also includes spending on working capital such as stocks of finished goods and work in progress. G General Government Final Consumption. i.e. Government spending on publicly provided goods and services including public and merit goods. Transfer payments in the form of social security benefits (pensions, job-seekers allowance etc.) are not included as they are not a payment to a factor of production for output produced. A substantial increase in government spending would be classified as an expansionary fiscal policy. X Exports of goods and services - Exports sold overseas are an inflow of demand into the circular flow of income in the economy and add to the demand for UK produced output. When export sales from the UK are healthy, production in exporting industries will increase, adding both to national output and also the incomes of those people who work in these industries. M Imports of goods and services. Imports are a withdrawal (leakage) from the circular flow of income and spending in the economy. Goods and services come into the economy - but there is a flow of money out of the economic system. Therefore spending on imports is subtracted from the aggregate demand equation. Note that X-M is the current account of the balance of payments. We can use a circular flow of income to show the movement of money around an economy. It is important to distinguish between the injections and withdrawals in the flow. Factor payments are received from households in return for use of factors of production, individually they are called:
• Capital – Interest • Enterprise – Profit • Land – Rent • Labour – Wages

Unit 3 Managing the economy Steve Margetts
Page 3
FactorpaymentsFactor
payments
Consumption ofdomestically
produced goodsand services (Cd)
Consumption ofdomestically
produced goodsand services (Cd)
BANKS, etc GOV. ABROAD
Investment (I)Investment (I)Investment (I)
Governmentexpenditure (G)
GovernmentGovernmentexpenditure (expenditure (GG))
Exportexpenditure (X)
ExportExportexpenditure (X)expenditure (X)
Netsaving (S)
NetNetsaving (S)saving (S)
Nettaxes (T)
NetNettaxes (T)taxes (T)
Importexpenditure (M)
ImportImportexpenditure (M)expenditure (M)
The circular flow of incomeThe circular flow of income
WITHDRAWALSWITHDRAWALS
INJECTIONSINJECTIONS
THE AGGREGATE DEMAND CURVE Aggregate demand normally rises as the price level falls. This can be explained in three main ways: • Real money balances effect: As the price level falls, the real value of
money balances held increases. This increases the real purchasing power of consumers.
• Prices and interest rates: A lower price level increases the real interest rate - there will be pressure on the monetary authorities to cut nominal interest rates as the price level falls. Lower nominal interest rates should encourage an increase in consumer demand and planned investment.
• International competitiveness: If the UK price level is lower than other countries (for a given exchange rate), UK goods and services will become more competitive. A rise in exports adds to aggregate demand and therefore boosts national output.
SHIFTS IN AGGREGATE DEMAND A change in one of the components of aggregate demand will cause a shift in the aggregate demand curve.

Unit 3 Managing the economy Steve Margetts
Page 4
O
Pric
e le
vel
National output
AD2
AD1
An increase in AD (AD1 → AD2) may be caused by:
• An increase in export demand causing an injection of foreign demand into the domestic economy.
• The government may also increase its own expenditure. • Businesses may raise the level of planned capital investment spending.
A decrease in AD (AD2 → AD1) may be caused by:
• Consumers feeling wealthier and increasing their consumption. • Businesses are pessimistic about the future of the economy and
reduce their level of investment.
AGGREGATE SUPPLY Aggregate Supply measures the volume of goods and services produced within the economy at a given aggregate price level. Normally there is a positive relationship between aggregate supply and the general price level. Rising prices are a signal for businesses to expand production to meet a higher level of aggregate demand. SHORT RUN AGGREGATE SUPPLY CURVE Aggregate supply is determined by the supply side performance of the economy. It reflects the productive capacity of the economy and the costs of production in each sector.

Unit 3 Managing the economy Steve Margetts
Page 5
O
AS 1
AD
Pric
e le
vel (
P)
Real National Income (Y)
P1
AS 2
P2
AS 3
P3
Y2Y3 Y1
Shifts in the AS curve can be caused by the following factors:
• changes in size & quality of the labour force available for production • changes in size & quality of capital stock through investment • technological progress and the impact of innovation • changes in factor productivity of both labour and capital • changes in unit wage costs (wage costs per unit of output) • changes in producer taxes and subsidies • changes in inflation expectations - a rise in inflation expectations is
likely to boost wage levels and cause AS to shift inwards In the diagram above - the shift from AS1 to AS2 shows an increase in aggregate supply at each price level might have been caused by improvements in technology and productivity or the effects of an increase in the active labour force. Supply side policies are a very important government tool for increases national income. An inward shift in AS (from AS1 to AS3) causes a fall in supply at each price level. This might have been caused by higher unit wage costs, a fall in capital investment spending (capital scrapping) or a decline in the labour force. LONG RUN AGGREGATE SUPPLY Long run aggregate supply is determined by the productive resources available to meet demand and by the productivity of factor inputs (labour, land and capital). In the short run, producers respond to higher demand (and prices) by bringing more inputs into the production process and increasing the utilisation of their existing inputs. Supply does respond to change in price in the short run.

Unit 3 Managing the economy Steve Margetts
Page 6
In the long run we assume that supply is independent of the price level, the productive potential of an economy (measured by LRAS) is driven by improvements in productivity and by an expansion of the available factor inputs (more firms, a bigger capital stock, an expanding active labour force etc). As a result we draw the long run aggregate supply curve as vertical.
O
SRAS
AD
Pric
e le
vel (
P)
Real National Income (Y)
P
Y
LRAS
Improvements in productivity and efficiency cause the long-run aggregate supply curve to shift out over the years. This is shown in the diagram below
O
Pric
e le
vel (
P)
Real National Income (Y)
LRAS1 LRAS2

Unit 3 Managing the economy Steve Margetts
Page 7
ELASTICITY OF AGGREGATE SUPPLY In contrast to the Monetarist view of the SRAS and LRAS, Keynesians believe the extent to which the economy as a whole can supply extra output of goods and services following a rise in aggregate demand is determined by the elasticity of the aggregate supply curve. Remember that elasticity is a measure of responsiveness - in other words, how easy it is for firms to respond to higher demand by utilising existing factor resources more efficiently or intensively, or by bringing unused factors (spare land, labour and capital) into the production process. The elasticity of the aggregate supply curve will depend on where the economy is in the economic cycle and critically the available of spare factor resources (or spare capacity)
O
Pric
e le
vel
National output
AS
Large amounts of spare capacity is available
Some spare capacity is available
All available resources are fully utilised
When the economy is operating at a low level of national output, there is a large stock of unused factor inputs. Unemployment in the labour market is likely to be high and there are many factories operating well below their productive capacity. In this situation, aggregate supply will be elastic. A change in aggregate demand can be met without any substantial upward pressure on costs and prices. This is shown in the diagram below

Unit 3 Managing the economy Steve Margetts
Page 8
O
Pric
e le
vel
National outputQ2Q1
AS
AD2
AD1
P1
P2
However if the economy is approaching full-employment, the amount of spare capacity available to raise output will have fallen. Supply-bottlenecks are likely to emerge as businesses compete with each other for the remaining labour and capital resources. In this situation the AS curve becomes inelastic. Indeed there may come a point when aggregate supply is perfectly inelastic (vertical). If aggregate demand increases the prices of goods and services will rise and real output will remain unchanged. This is shown in the diagram overleaf.
O
Pric
e le
vel
National outputQ1
AS
AD2
AD1
P1
P2

Unit 3 Managing the economy Steve Margetts
Page 9
Increases in aggregate demand shown in the diagram simply cause an increase in the general price level (i.e. inflation). The likely response of economic policy-makers would be an attempt to reduce aggregate demand through deflationary fiscal or monetary policy measures.
EQUILIBRIUM BETWEEN AGGREGATE DEMAND AND AGGREGATE SUPPLY
Macroeconomic equilibrium in the short run is established when aggregate demand intersects with short-run aggregate supply. This is shown in the diagram below
O
AS
AD
Pric
e le
vel (
P)
Real National Income (Y)
P
Y
At price level P, aggregate demand for goods and services is equal to the aggregate supply of output. The output and the general price level in the economy will tend to adjust towards this equilibrium position. If the price level is too high, there will be an excess supply of output. If the price level is below equilibrium, there will be excess demand in the short run. A SHIFT IN AGGREGATE SUPPLY Suppose that increased efficiency and productivity together with lower input costs causes the short run aggregate supply curve to shift outwards. (Assume no shift in aggregate demand). The diagram below shows what is likely to happen. AS shifts outwards and a new macroeconomic equilibrium will be established. The price level has fallen and real national output (in equilibrium) has increased to Y2.

Unit 3 Managing the economy Steve Margetts
Page 10
O
AS 1
AD
Pric
e le
vel (
P)
Real National Income (Y)
P1
AS 2
P2
Y2Y1
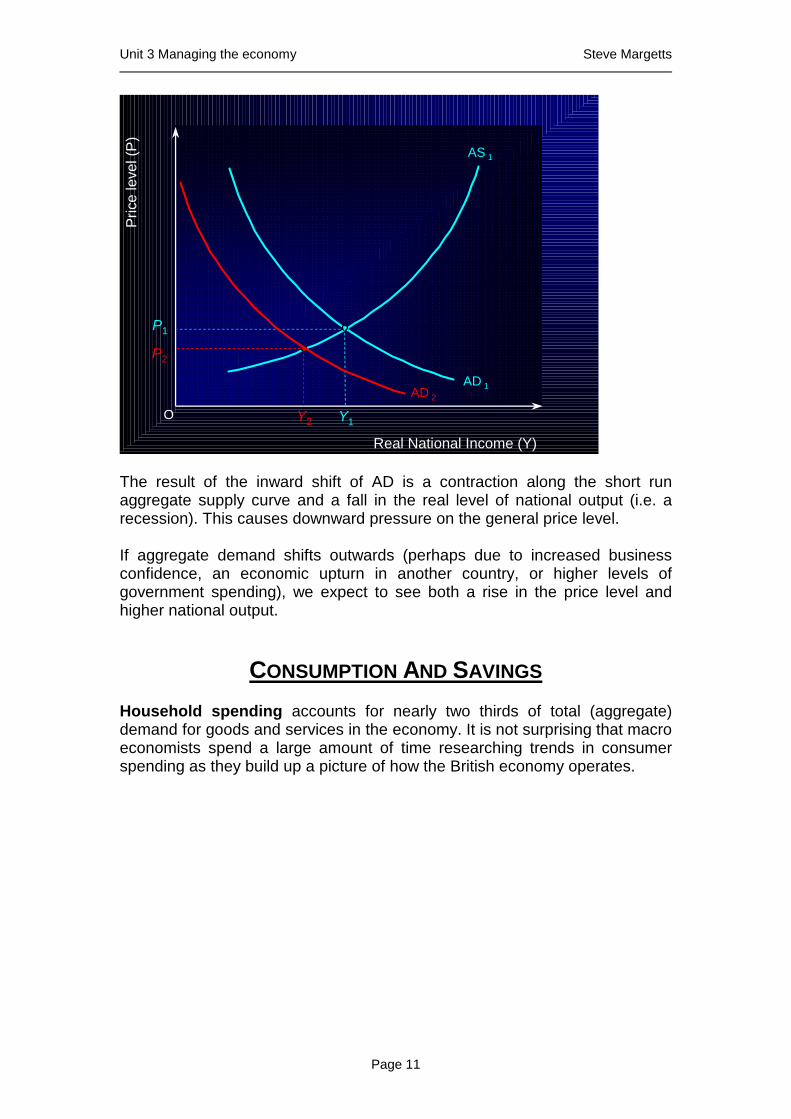
Aggregate supply would shift inwards if there is a rise in the unit costs of production in the economy. For example there might be a rise in unit wage costs perhaps caused by higher wages not compensated for by higher labour productivity. External economic shocks might also cause the aggregate supply curve to shift inwards. For example a sharp rise in global commodity prices. If AS shifts to the left, assuming no change in the aggregate demand curve, we expect to see a higher price level (this is known as cost-push inflation) and a lower level of real national output. A SHIFT IN AGGREGATE DEMAND In the diagram below we see the effects on an inward shift in aggregate demand in the economy. This might be caused for example by a decline in business confidence (reducing planned investment demand) or a fall in exports following a global downturn. It might also be caused by a cut in government spending or a rise in interest rates.
Unit 3 Managing the economy Steve Margetts
Page 11
O
AS 1
Pric
e le
vel (
P)
Real National Income (Y)
P1
AD 2
P2
Y2 Y1
AD 1
The result of the inward shift of AD is a contraction along the short run aggregate supply curve and a fall in the real level of national output (i.e. a recession). This causes downward pressure on the general price level. If aggregate demand shifts outwards (perhaps due to increased business confidence, an economic upturn in another country, or higher levels of government spending), we expect to see both a rise in the price level and higher national output.
CONSUMPTION AND SAVINGS Household spending accounts for nearly two thirds of total (aggregate) demand for goods and services in the economy. It is not surprising that macro economists spend a large amount of time researching trends in consumer spending as they build up a picture of how the British economy operates.

Unit 3 Managing the economy Steve Margetts
Page 12
There is a positive relationship between disposable income (Yd) and consumer spending (Ct). The gradient of the consumption function gives the marginal propensity to consume. As income rises, so does total consumer demand. When the consumption function cuts the 45 degree line, income = spending (i.e. saving = zero). A change in the marginal propensity to consume causes a pivotal change in the consumption function. In this case the marginal propensity to consume has fallen leading to a fall in consumption at each level of income. KEY CONSUMPTION DEFINITIONS
• Average propensity to consume = Total consumption divided by total income
• The marginal propensity to consume (MPC) is the change in consumption resulting from a change in disposable income. For example if out of an increase of income of £2000, £1600 is spent and £400 is saved, the marginal propensity to consume would be £1600 / £2000 = 0.8.
DEFINITIONS OF SAVING Saving is act of postponing consumption. Total savings (S) = Disposable Income (Yd) - Consumption (C). Gross Income (Y) can be spent (C), saved (S) or paid in tax (T).
• The average propensity to save (APS) is the proportion of disposable income that is saved rather than spent. This is also known as the household savings ratio
• The marginal propensity to save (MPS) is the change in saving resulting from a change in disposable income. For example if out of an increase of income of £2000, £1600 is spent and £400 is saved, the marginal propensity to save would be £400 / £2000 = 0.2.
• The marginal propensity to consume + the marginal propensity to save = 1

Unit 3 Managing the economy Steve Margetts
Page 13
THE CONSUMPTION AND SAVINGS FUNCTION
According to the Keynesian consumption function, savings are positively related to the level of disposable income. At low levels of income, total spending may exceed income causing dis-saving. As income rises, total savings rise - the gradient of the savings function is given by the marginal propensity to save TRENDS IN THE SAVINGS RATIO
For most of the post-war period the trend in the savings ratio was upward. Rising real incomes and living standards gave people the basic resources to save. High inflation and high interest rates in the 1970s also acted as an incentive to save – not least be-cause high-interest bearing accounts offered a hedge against the damaging impact of inflation on the real value of savings. From 1985-88 there was a dramatic fall in the savings ratio and the underlying reasons were not hard to find. This period coincided with the infamous Lawson Economic Boom – with highly expansionary policies being pursued that encouraged fast growth of consumer demand. Lower interest rates, much easier access to consumer credit and a booming housing market caused a surge in borrowing.

Unit 3 Managing the economy Steve Margetts
Page 14
This allowed millions of households to in-crease their spending way in excess of the growth of current come. Borrowing counted as dis-saving and the result was a high level of domestic demand which ultimately brought about inflation and recession. In contrast the 1990s was the decade of thrift with the savings ratio remaining high for seven years. Many consumers needed to save to repay accumulated debts and rebuild their own “balance sheets”. Other factors have encouraged a higher level of saving – notably the need to finance living standards in retirement at a time when the relative value of the state pension is falling. The latter years of the decade saw a fall in the household savings ratio - in part because consumer confidence picked up and people were prepared to spend more than their current income in a bid to improve their short term living standards. CONSUMER CONFIDENCE
Most theories of consumption place emphasis on the importance of consumer confidence in determining levels of spending. The willingness and ability of households to finance their spending can change as the state of the economy alters. For example in an economic slowdown, the fear of rising unemployment may cause confidence to decline. Spending on "big-ticket items" such as a new car or a new kitchen may then fall. Conversely, in a cyclical upswing we expect to see a recovery in consumer sentiment and a greater willingness to go out and commit to higher levels of spending. This was certainly apparent in 1997-98 when spending was fuelled by windfall gains and rising real incomes. Another rebound in confidence is apparent in 1999 early 2000 as the economy picks up from a slowdown in activity. The Bank of England looks closely at the consumer confidence figures when assessing future movements in demand and output. High confidence levels may be used as evidence to raise interest rates to control the growth of

Unit 3 Managing the economy Steve Margetts
Page 15
household demand. Lots of economic factors affect the overall state of consumer confidence. Some of these factors include:
• The level of interest rates (including mortgage rates) • Changes in unemployment and the state of job security / insecurity • Expectations of inflation • Changes to direct and indirect taxation • Windfall Gains (for example arising from the stock market floatation of
many former building societies) WEALTH AND CONSUMER DEMAND How do changes in the level of household wealth affect people's willingness and ability to spend on goods and services? The wealth effects of rising real asset values on consumer expenditure are difficult to quantify, but important. Trends in consumer wealth are taken into account by the Bank of England when deciding the appropriate level of interest rates for the economy. HOUSING When the value of housing and other assets (shares and bonds) is rising faster than income, individuals see a rise in their net worth (the difference between the value of their assets and liabilities). This increases consumer confidence and causes an upward shift in the consumption function. However, if asset prices fall consumers can be left with a net worth problem. That is, they have liabilities or debts that exceed the value of their assets (negative equity). To eliminate this problem consumers have to repay debts by saving.
Housing is perhaps the most important asset owned by the majority of the population. When house prices are rising and activity in the housing market is growing we often see a boost to total consumption. An appreciation in housing values leads to an increase in personal sector wealth and boosts consumer confidence. An increase in the volume of housing transactions is good news for complementary sectors to the housing market including estate agents, furniture retailers, DIY stores and local contractors.

Unit 3 Managing the economy Steve Margetts
Page 16
WINDFALL GAINS As mutual building societies and insurance companies have converted to public companies their members have received share windfalls. If recipients hold onto these shares they experience a rise in their net worth. This could indirectly boost consumption. Alternatively if they sell the shares, the cash raised can be spent directly on
goods and services. The windfall can also be used to pay off existing debts and allow increased spending in the future. 1997 was a record year for Windfall payments - they totalled over £36 billion pounds. Windfalls have continued through 1998 and 1999 although not on the same scale. Rising house prices and growing consumer confidence arising from an increase in personal sector wealth are two reasons why the annual growth of consumer spending accelerated during 1999. This is shown in the chart above. The pick-up in household demand was cited by the Bank of England when they started to raise interest rates in September 1999. FRIEDMAN'S PERMANENT INCOME HYPOTHESIS In Friedman's model, the key determinant of consumption is an individual's real wealth, not his current real disposable income. Permanent income is determined by a consumer's assets; both physical (shares, bonds, property) and human (education and experience). These influence the consumer's ability to earn income. The consumer can then make an estimation of anticipated lifetime income. The theory suggests that consumers try to smooth out consumer spending based on their estimates of permanent income. Only if there has been a change in permanent income will there be a change in consumption. The key conclusion of this theory is that transitory changes in income do not affect long run consumer spending behaviour. Suppose a government cuts taxes prior to a general election. If consumers perceive this to be only a temporary reduction in their tax burden to increase

Unit 3 Managing the economy Steve Margetts
Page 17
the government's popularity, then consumption will remain unchanged. If the tax cut is seen as permanent then this may cause increased spending.
INVESTMENT Investment is spending on capital goods by firms and government, which will allow increased production of consumer goods and services in future time periods. Be careful not to confuse the economist's definition of investment with another interpretation - that investment involves putting funds into financial assets such as stocks and shares.
The chart below shows the annual percentage change in capital investment spending in the British economy since 1975. You can see that investment demand is quite volatile from year to year. Indeed in years of economic recession, the real value of investment spending can fall quite sharply because businesses decide to postpone or cancel investment projects. Investment spending across the UK economy has increased (in real terms) in each of the last eight years partly because the economy as a whole has enjoyed a period of sustained economic growth. Service industries have enjoyed the lion's share of this spending on capital goods, but we have also seen large scale increases in capital expenditure in new economy sectors such as information technology and communication industries. GROSS AND NET INVESTMENT An import distinction to make is between gross and net capital investment spending. Net investment is positive when gross investment is higher than depreciation or capital consumption, then there will be an increase in the

Unit 3 Managing the economy Steve Margetts
Page 18
nation's stock of capital. Fixed Investment is spending on new capital machinery and plant, construction, housing, vehicles, etc. Working Capital is spending on stocks/inventories of finished goods and raw materials. The accumulation of stocks by firms, whether voluntary or involuntary, is counted as investment. Gross Domestic Fixed Capital Formation (GDFCF) is expenditure on fixed assets (buildings, vehicles and plant) either for replacing or adding to the stock of fixed assets. WHY DO FIRMS INVEST? A positive level of net investment implies a rise in the firm's capital stock and long run expansion in the size of a business. The reasons for undertaking an investment project are varied. Here are five main reasons. • To take advantage of higher expected profits from expanding output and
meeting a rise in consumer demand • To generate a rise in productive capacity • To improve efficiency through technological progress and innovation • To exploit economies of scale and thereby bring down long-run average
total cost • As a barrier to entry - extra capacity can force out potential competitors in
a market, protect the monopoly power of existing firms and thereby increase supernormal profits in the long run
The UK economy sets to benefit from a higher level of fixed capital investment. It should promote long run economic growth and boost the international competitiveness of domestic producer in home and overseas markets. UK INVESTMENT IN AN INTERNATIONAL CONTEXT

Unit 3 Managing the economy Steve Margetts
Page 19
Annual average growth in real investment spending for the UK, Euro Land and the United States for five separate periods are shown in the chart above. Total investment spending in the period 1996-01 for the UK has grown more strongly that in other periods (the 1991-95 period includes the years in which the British economy was last in recession). This should help to improve our economic performance in the long run. Notice though how strong total investment has been in the United States in recent years. Much of the investment boom has been concentrated in new economy sectors such as telecoms, media and technology (TMT). THE MARGINAL EFFICIENCY OF INVESTMENT - THE KEYNESIAN THEORY OF INVESTMENT Interest rates and planned capital investment: The Keynesian theory of investment places emphasis on the importance of interest rates in investment decisions. But other factors also enter into the model - not least the expected profitability of an investment project. Changes in interest rates should have an effect on the level of planned investment undertaken by private sector businesses in the economy. A fall in interest rates should decrease the cost of investment relative to the potential yield and as result planned capital investment projects on the margin may become worthwhile. A firm will only invest if the discounted yield exceeds the cost of the project. The inverse relationship between investment and the rate of interest can be shown in a diagram (see below). The relationship between the two variables is represented by the marginal efficiency of capital investment (MEC) curve. A fall in the rate of interest from R1 to R2 causes an expansion of planned investment.
O
MEC
Rat
e of
inte
rest
Planned Investment
R1
R2
I1 I2

Unit 3 Managing the economy Steve Margetts
Page 20
Shifts in the marginal efficiency of capital Planned investment can change at each rate of interest. For example a rise in the expected rates of return on investment projects would cause an outward shift in the marginal efficiency of capital curve. This is shown by a shift from MEC1 to MEC2 in the diagram below. Conversely a fall in business confidence (perhaps because of fears of a recession) would cause a fall in expected rates of return on capital investment projects. The MEC curve shifts to the left (MEC3) and causes a fall in planned investment at each rate of interest.
O
Rat
e of
inte
rest
Planned Investment
R1
I1I3 I2
MEC1MEC3
MEC2
The importance of hurdle rates for investment British firms are continuing to demand rates of return on new investments that are far too high, undermining industry's ability to re-equip and close the productivity gap with competitor countries according to a survey by the Confederation of British Industry. “Hurdle rates" for major investment projects are 50 per cent higher than they need to be, while the payback periods required are much shorter than in countries such as Germany. The CBI survey of more than 300 firms showed that they expected to earn an internal rate of return averaging 17 per cent and recover the cost of their investment in two to four years. But experts said that post-tax real returns of 10 per cent were sufficient to justify most investments. Britain's poor investment record has been a concern both for the CBI and government ministers. Gordon Brown believes that low investment is one of the main reasons for sluggish economic performance, and that macroeconomic stability and a tax regime less biased towards dividends will encourage capital spending.

Unit 3 Managing the economy Steve Margetts
Page 21
The CBI survey shows that small firms set the highest hurdle rates - averaging 24 per cent. Two thirds of all firms said that projects which failed to meet the required level of return were seldom or never given the go-ahead. WHAT IS THE ACCELERATOR? The accelerator model is based on an assumption of a stable (or fixed) capital to output ratio. It stresses that planned investment is demand induced. That is, the demand for new plant and machinery comes from the demand for final goods and services. If expected demand (output) is higher than the present capacity of the firm then additional plant and equipment may be required. Thus investment is a function of the rate of change in national income. A slowdown in the growth of consumer or export demand may actually cause the demand for planned capital investment to fall. Investment spending is usually more volatile than changes in national output as a whole. The accelerator theory offers one explanation for this volatility. There are some limitations of the accelerator model.
• Firstly, even if demand does increase, this change may be perceived as transitory and therefore the firm may have no incentive to invest.
• Secondly, firms may not have to invest if they are operating with spare capacity and can meet an increase in demand by using existing inputs more intensively or with greater efficiency.
• Thirdly the model assumes that firms are responding to changes in demand when they adjust the size of their capital stock. In reality most firms adjust their planned investment to predicted future levels of demand (they have forward looking expectations).

Unit 3 Managing the economy Steve Margetts
Page 22
RECENT TRENDS IN THE GROWTH OF CONSUMPTION AND INVESTMENT SPENDING The chart below suggests a positive relationship between the growth of consumer demand and gross fixed capital investment. Investment demand was fairly sluggish during the mid 1990s - in part because consumer demand recovered only slowly from the previous recession. There was a clear acceleration in consumer demand during 1997-98 and
business investment followed suit. Rising demand, capacity shortages and low interest rates all acted to stimulate increased capital expenditure. A slowdown in the British economy during 1998-99 is shown in the chart. The growth in consumption fell quite steeply from the 1st quarter of 1998 and investment demand has also grown more slowly. However the UK economy avoided a recession and this should mean an absence of economy-wide capital scrapping (negative growth of real capital spending) which has been a feature of previous slowdowns and recessions. Some capital investment spending is undoubtedly demand-induced by the rate of growth of consumer demand supporting the accelerator theory, however other factors also determine investment. RESEARCH AND DEVELOPMENT SPENDING Numerous studies have pointed to investment in research and development as an important factor driving productivity growth in the economy and in determining the international competitiveness of firms in competitive global industries. Research spending can take many forms. Typically it will be on the development of new products and production processes. Firms may be seeking patents from their investment - a way of providing protection of intellectual property rights that will help finance the development costs incurred.

Unit 3 Managing the economy Steve Margetts
Page 23
In recent years, the UK economy has invested less in new research spending than other industrialised countries. According to a recent Government report, in 1997 the UK expenditure on R&D was £14.7 billion which represents 1.80 per cent of GDP. This is just below the EU average of 1.83 per cent and puts the UK in fifth place compared to other G7 countries. Of the G7 countries the UK and the USA devoted the highest proportion of their total government R&D funding to defence. The highest expenditure on R&D in the business sector was in pharmaceuticals, medical chemicals and botanical products, which accounted for £2.2 billion, followed by motor vehicles and parts at £963 million. It is often the case that firms operating in oligopolistic markets invest more heavily in R&D because of the importance of non-price competition in protecting and gaining market share from rival firms. CAPITAL BASE British companies have a smaller capital base than their international competitors according to a survey published by the Department of Trade and Industry. Gross tangible fixed assets per employee - a measure of capital invested over time - is estimated to be £96,000, some £53,000 below the international average. Capital investment per employee by British companies in 1997 was £9,000, £4,700 less than the average for Europe, North America and Japan. The report highlights the problem of under-investment in the economy - which then impacts on the long-run trend growth for the economy FOREIGN DIRECT INVESTMENT AND THE UK ECONOMY In 1979 the former Conservative Government abolished foreign exchange controls – freeing up the movement of financial capital between the UK and the rest of the world. This proved to be a momentous decision for the long-term future of the economy. In its wake we have seen a tremendous growth in UK investment overseas and foreign direct investment into the domestic economy. The UK has proved particularly attractive to overseas investors particularly from North America and Asia. For the UK, foreign investment has become an integral source of production, employment and income in both manufacturing and service sectors. In UK manufacturing alone, foreign capital accounts for over one fifth of employment, a quarter of output and nearly half manufacturing exports. We are also seeing a fast growth of foreign investment in the service sector. London for example has by far the largest foreign exchange dealing platform

Unit 3 Managing the economy Steve Margetts
Page 24
in the world – much of which is provided by foreign banking institutions located within the City. The expansion of the European Single Market is likely to generate further inward investment flows. European service sector firms are making in roads into the UK banking and insurance sectors and in food retailing and domestic utilities. The flow of investment is not all one way! UK firms invested a record amount overseas last year – adding to sterling assets held overseas which should generate a flow of investment income back into the UK economy in future years. A substantial proportion of this investment has come via the global boom in mergers and acquisitions. Vodafone hit the headlines last month when it acquired US mobile phone giant Air Touch. This catapulted Vodafone into a position as one of the UK’s leading listed companies. INWARD INVESTMENT AND THE REGIONAL ECONOMIC PROBLEM It is no understatement that for some regions, inward investment flows have been crucial in reversing relative economic decline and offering renewed hope for increasing employment and living standards in depressed areas. For the North-East, direct investment has had several main benefits.
• Employment and the regional multiplier - Firstly it has created new employment and protected “at risk” jobs. This causes a regional-multiplier effect as factories generate extra employment and add to spending power in the local and regional economy.
• Supply-side impact - Many of the new jobs have been full-time, offering above average levels of pay. The third benefit focuses on the supply-side of the regional economy. There is evidence that foreign investment boosts average productivity – especially when new plants are capital-intensive, using the latest technology and effective management techniques and labour practices.
• Contribution to the balance of payments - Foreign firms producing within the UK and then exporting to countries inside the European Union and elsewhere also contribute positively to the UK balance of payments. This has been an important trend given the structural decline of domestic manufacturing industry over recent years. Finally for regions once heavily dependent on traditional industries, new investment helps to diversify the manufacturing base.
There are of course downsides to foreign investment – as workers in the North-East have found to their cost with the recent closure of plants by Siemens (North Tyneside) and Grove Engineering (Sunderland). In 1998 the UK secured 27 per cent of all European inward investment projects, more than three times as many as Germany, which got 8 per cent,

Unit 3 Managing the economy Steve Margetts
Page 25
and well ahead of France with 12 per cent, according to research by Ernst & Young. Britain is more popular with investors outside Europe. While the UK took 36 per cent of investment projects from the likes of Japan and the US, it only received 19 per cent of intra-European projects.
GOVERNMENT SPENDING General government expenditure - consists of the combined capital and current spending of central government including debt interest. General government final consumption - is government expenditure on currently provided goods and services excluding transfer payments. Transfer payments are transfers from tax-payers to benefit recipients through the working of the social security system. The total welfare bill now exceeds £100 billion per year.
WHY WE NEED GOVERNMENT EXPENDITURE Providing public and merit goods See unit 2. Redistribution of income and wealth One aim of the social security system is to carry out a redistribution of income and to reduce income inequalities by providing a basic minimum level of income for those out of employment and income replacement for those who have recently been made redundant. The social security system also tries to provide a safety-net for those who suffer unexpected falls in income arising from unemployment, separation and bereavement. Progressive taxes also have the effect of diminishing the gap between those on low and high incomes although the tax and benefit system on its own can never hope (or seek) to eliminate income disparities between individuals and groups. Regulation of economic activities The government intervenes via enforcement agencies to ensure that economic activities do not adversely affect the public interest. Examples include the Office of Fair Trading and the Competition Commission (formerly

Unit 3 Managing the economy Steve Margetts
Page 26
the Monopolies and Mergers Commission). In recent years there has been a growth in the number of regulatory agencies established. These include the regulatory bodies set up to monitor the performance of the privatised utilities. Examples include Ofwat, Ofgem, Offer (see unit 2 for more information). Influencing resource allocation and industrial efficiency This is achieved via regional policy which aims to reduce regional economic disparities within the UK. The Department of Trade & Industry implements policies to encourage the competitiveness and performance of the UK corporate sector. Influencing the level of macro- economic activity Public spending has an important role to play in stabilising the level of aggregate demand in the economy. Increases in government spending on state provided goods and services add to total domestic demand and can have multiplier effects on the final level of equilibrium national income. There is a debate about how effectiveness this form of expansionary fiscal policy is in stabilising the economy. When the economy is growing, certain items of government spending will tend to fall. These include social security payments. For example when real GDP is rising and more people are finding work, the government will not have to spend as much on the Job Seeker's Allowance and other benefits such as income support and housing benefit. GOVERNMENT BORROWING The Public Sector Net Cash Requirement (PSNCR) is the combined financial deficit of central government + local government + the public corporations. It measures the annual borrowing requirement of the government sector in the economy. When the government is running a budget deficit it means that total public expenditure exceeds revenue. As a result, the government has to borrow through the issue of government debt. If the government sector is taking in more revenue than it is spending, there is a budget surplus allowing the government to repay some of the accumulated debt, of perhaps cut the burden of tax or raise government expenditure. MEASURING THE PSNCR The amount that the government has to borrow each financial year can be measured in a number of ways: • Nominal PSNCR - is the total borrowing requirement in money terms
making no adjustment for the economic cycle • PSNCR as a % of GDP gives economists a good measure of the scale of
the debt problem that may exist. • Cyclically adjusted PSNCR takes into account the effect the economic
cycle can have on the PSNCR. For example, in a recession the PSNCR nearly always rises automatically because of higher benefit payments and reduced tax revenues.

Unit 3 Managing the economy Steve Margetts
Page 27
DOES A HIGH LEVEL OF GOVERNMENT BORROWING MATTER? The important question is what central government does with the money it has borrowed. When funds are allocated to public sector capital investment in roads, schools, hospitals and other items of infrastructure this enables the nation to increase the output it can produce. This will make it easier to pay off previous debts or to pay the interest on them. However, a budget deficit has to be financed - normally through the issue of new government debt to the capital markets. For a government with a good credit rating, the sale of new debt is rarely a problem. Most financial institutions are happy to purchase debt because they regard them as assets on their balance sheets. Secondly if there is a large pool of savings in the economy, the issue of government debt (which soaks up some of these savings) will have little impact on the ability of private sector businesses to find sufficient funds to finance their investment. There are some economic risks associated with a high level of government borrowing:
• If the economy has only a small supply of savings, increased government borrowing may force up interest rates and crowd out private sector investment
• Higher borrowing in the long-run requires an increase in the tax burden - this may dampen demand and economic growth
• If the national debt increases, annual interest payments on the debt goes up - money that might have been spent in priority areas
RECENT TRENDS IN UK GOVERNMENT BORROWING
The chart shows the fluctuations in government borrowing over the last thirty years. Small budget surpluses in the late 1980s were the result of very strong economic growth. But the recession in the early 1990s saw a return to historically large budget deficits. The economy has experienced sustained economic growth and falling unemployment since 1993 and this, together with a range of tax increases and better control of government spending, has seen a sharp improvement in government finances. A budget surplus is forecast for 1999-2000 and in subsequent years.

Unit 3 Managing the economy Steve Margetts
Page 28
LABOUR'S GOLDEN RULE FOR GOVERNMENT BORROWING Gordon Brown introduced the Golden Rule in his first budget statement in July 199. When a government borrows only to finance investment and not to fund day to day spending, it is following the Golden Rule. Government spending on current goods and services and social security benefits must be met by revenue from taxes, but investment for the future (asset accumulation) can be met by borrowing. STRUCTURAL AND CYCLICAL BUDGET BALANCES In the recession / slowdown phase of the economic cycle government finances worsen because tax revenues slow down and social security payments start to rise. The structural budget balance seeks to make an adjustment for the effects of the economic cycle.
The chart above shows the annual structural budget balance for the UK using OECD estimates. The UK has run a structural deficit in each year although the forecast for 1999 is the lowest yet. This suggests that steps to control government spending have been successful. Tax revenues have also grown considerably - in part because of the introduction of self-assessment a few years ago. THE NATIONAL DEBT The National Debt is the accumulated debt built up by the government over a number of years that has not yet been repaid (i.e. the debt issued to finance government spending has not yet "matured" - been paid back to holders of the debt). One way of measuring the scale of Government debt is by looking at the debt - to - GDP ratio. The trend in this for the UK economy and also the Euroland economies is shown in the chart below

Unit 3 Managing the economy Steve Margetts
Page 29
In recent years the UK economy has enjoyed a period of sustained and fairly strong economic growth. This has improved the government's own finances and lead to a gradual decline in the debt-to-GDP ratio. In 1996 the figure stood at 55%. By the end of 2000, this is forecast to have dipped to 51%. This is comfortably within the EU Maastricht Convergence Criteria target of a gross government debt / GDP ratio of 60%.
EXPORTS AND IMPORTS Exports are an injection into the circular flow of income. Goods and services are sold to foreigners who have to buy £s in order to purchase them. Imports occur when UK residents buy goods and services from abroad. THE EFFECT OF EXCHANGE RATES The value of exchange rates affect the demand for exports and imports. An appreciation of the pound (pound becomes stronger) will lead to exports becoming more expensive and imports cheaper. This will harm exporters and increase the leakages from the circular flow of income. Were the pound to depreciate the opposite effect would occur. In order to avoid confusion remember SPICED! Strong Pound Imports Cheap Exports Dear
The economic effects of changes in exchange rates take time to occur, this is due to time lags between a change in the pound and changes in the balance of payments. The extent to which exchange rates affect exports and imports will depend upon the elasticity of demand for the products and the nature of the contracts that have been agreed.

Unit 3 Managing the economy Steve Margetts
Page 30
After a depreciation of the pound demand for exports will grow faster if the demand for UK goods overseas is elastic. After a depreciation it may not be possible to switch away from imports as they maybe part of a long term contract, essential for production or cannot be made in the UK and have an inelastic demand. Then we end up spending more when the exchange rate falls in value causing the balance of payments to worsen in the short run a process known as the J curve effect. Assuming that the economy begins at position A with a substantial current account deficit and there is then a fall in the value of the exchange rate. Initially the volume of imports will remain steady partly because contracts for imported goods will have been signed.
0
X − M
Time
Surplus
DeficitA
The JThe J--curve effectcurve effect
C
B
However, the depreciation raises the sterling price of imports causing total spending on imports to rise. Export demand will also be inelastic in response to the exchange rate change in the short term, therefore the earnings from exports may be insufficient to compensate for higher spending on imports. The current account deficit may worsen for some months. This is shown by the movement from A to B on the diagram. Providing that the elasticities of demand for imports and exports are greater than one, in the longer term then the trade balance will improve over time. This is known as the Marshall-Lerner condition. In the diagram, as demand for exports picks up and domestic consumers switch their spending away from imported goods and services, the overall balance of payments starts to improve. This is shown by the movement A to C on the diagram.

Unit 3 Managing the economy Steve Margetts
Page 31
TRENDS IN EXCHANGE RATES
The last major depreciation in the value of sterling came in the early-mid 1990s following sterling's departure from the exchange rate mechanism. The pound was devalued by nearly 15% against a range of currencies in September 1992 and continued to drift lower in value for the next three years. Objectives Of Government Macroeconomic Policy
OBJECTIVES OF GOVERNMENT MACROECONOMIC
POLICY What is macroeconomics? Macroeconomics is concerned with issues, objectives and policies that affect the whole economy. All economic analysis that refers to aggregates is macro. The UK unemployment rate, the UK inflation rate, the rate of economic growth in the UK; these are all UK aggregates and therefore macro issues. WHAT ARE THE MAJOR OBJECTIVES OF MACROECONOMIC POLICY? The four major objectives are (i) full employment, (ii) price stability, (iii) a high, but sustainable, rate of economic growth, and (iv) keeping the Balance of

Unit 3 Managing the economy Steve Margetts
Page 32
Payments in equilibrium. First, we will look at the way in which these objectives are measured. Secondly, we shall discuss the relative importance of these objectives. Thirdly, we shall see how successful recent governments have been in achieving these goals. Finally, we will look at the difficulties that governments have in trying to achieve all the objectives at once.
WHICH OBJECTIVE IS THE MOST IMPORTANT? In the 1960s, the Balance of Payments was considered very important. A deficit was considered highly embarrassing in the days when many still believed, mistakenly, that Britain was a world power. The long term sustainability of a deficit was a big problem in the days before global free movements of capital, and so sterling would be affected which was unacceptable within the 'Bretton Woods' fixed exchange rate system. Nowadays, with a floating pound and huge global capital flows, many economists believe that balance of payments deficits or surpluses simply do not matter. This was reflected in the fact that nobody seemed to bat an eyelid at the continual deficits of the 90s. Full employment was considered very important after the Second World War. It was probably the number one objective of the socialist government of the late 40s and continued to be at the front of politicians' minds for the next three decades. Unemployment exploded under Thatcher in the 80s, but it was seen as an inevitable consequence of the steps taken to make industry more efficient. It was painful at the time but the lower levels of unemployment today are due, in part, to the structural changes made in the 80s. The fact that de-industrialisation was occurring throughout the western world also made higher unemployment feel inevitable, and so this objective became much less important than it had been. Growth and low inflation have always been important. Without growth peoples' standard of living will not increase, and if inflation is too high then the value of money falls negating any increase in living standards. Nowadays these are definitely the two most important objectives of UK macroeconomic policy. The Chancellor is always going on about 'sustainable growth', meaning growth without inflation. Probably the biggest piece of economic news each month is the decision taken by the Monetary Policy Committee (MPC) over interest rates, their sole objective being the 2.5% target for the growth in RPIX (plus or minus 1%). It is probably worth noting at this stage: do not confuse

Unit 3 Managing the economy Steve Margetts
Page 33
objectives of macroeconomic policy with the instruments used to achieve these aims. Low inflation is an objective, the rate of interest is an instrument used to control inflation, not an objective in itself. If one had to pick the most important objective today, it would have to be inflation. Although it should be growth, all government's efforts are devoted to the control of inflation. If this goal is missed, it is felt, then the goal of higher growth will not be attainable either. HOW SUCCESSFUL HAVE RECENT GOVERNMENTS BEEN IN ACHIEVING THESE GOALS? On growth, there tends to be periods of strength (booms) followed by periods of weak or even negative growth (recessions). This is known as the economic cycle. All governments have a goal of eliminating this cycle. In other words, they want continual, reasonable growth that never ignites inflation, perhaps 2½% - 3% per annum. Recent governments have moved closer to this 'Goldilocks' scenario (not too hot and not too cold). Notice that the growth rate has been over 2% without getting out of hand for six years. Following the bust/boom/bust of the early 80s/late 80s/early 90s, this is quite an achievement.
Inflation has also been remarkably subdued by historical standards. Following the horribly inflationary 70s (peaked at 25%) and the near 10% figure ten years ago, RPIX has been growing at 3% pa or less for six years. The goal of full employment has effectively been consigned to the history books. Unemployment reached one million in the 80s for the first time since the 30s, and then proceeded to reach 3 million (or 4 million, depending on the definition) within three years. Having said that, 'full employment' does not mean that everyone has a job. Even in the 'full employment' era of the 50s there were still 300,000 unemployed. Today's figure is falling towards one million which some consider to be fairly close to full employment given the increased flexibility of the UK labour . It is a sad fact of economic life that UK consumers prefer imported goods to those made in Britain. The extent of the current account deficit mainly depends, therefore, on how well we export our services. Unfortunately,

Unit 3 Managing the economy Steve Margetts
Page 34
services are not quite as exportable as goods, so the UK is always fighting a losing battle. Hopefully the changes in technology, and our abilities to exploit them, will allow us to increase our exports of services by enough in the future to allow for the deficit in goods. Some economists believe that there is no problem, because in a world of perfectly mobile capital, the UK no longer relies entirely on their own pool of foreign reserves to pay for its imports. Nowadays, if you want something from abroad but you do not have the foreign currency, then just buy it on the Foreign Exchange Markets.
INFLATION Inflation measures the annual rate of change of the general price level in the economy. Inflation is a sustained increase in the average price level.
INFLATION AND THE PRICE LEVEL When prices rise, the value of money falls. There is an inverse relationship between the price level and the internal purchasing power of money. When there is inflation money buys less in real terms. People can protect themselves against the effects of inflation by investing in financial assets that give a rate of return at least equal to the rate of inflation. Hyper-inflation is extremely rare, although some countries experience it. In fact even when the rate of inflation is rising, the prices of some goods will be falling. Deflation is also fairly unusual although some countries such as Japan and China have experienced price deflation in their economies in recent years. In the United Kingdom, the main measure of inflation is done through the Retail Price Index. THE RETAIL PRICE INDEX (RPI) The Retail Price Index (RPI) measures the average change in prices of a representative sample of over 600 goods and services. Each month, over 120,000 separate price samples are taken to compile the inflation statistics.

Unit 3 Managing the economy Steve Margetts
Page 35
The index is weighted according to the proportion of income spent by the average household on categories of goods such as food and housing. These are periodically changed to reflect changing consumer spending patterns in the economy. For example the weighting attached to food has fallen as average living standards have grown. The weighting attached to leisure services and transport has increased because these categories of spending have a relatively high income elasticity of demand. RPI WEIGHTS (%) Food 13.6 Catering 4.9 Alcohol 8.0 Tobacco 3.4 Housing 18.6 Fuel & Light 4.1 Household Goods 7.2 Household Services 5.2 Clothes 5.6 Personal Goods 4.0 Motoring 12.8 Fares 2.0 Leisure Goods & Services 10.6 UNDERLYING INFLATION (RPIX) The underlying rate of inflation, known as RPIX, was originally set a target of between 1-4%. However, the Labour Government's target is for an average of rate of growth of 2.5% over the duration of this parliament which ends in 2002. Inflation is allowed to move between 1% either side of the 2.5% benchmark. The Bank of England has been given the responsibility for meeting the inflation target. The chart below tracks RPIX also known as underlying inflation for the UK since 1988.

Unit 3 Managing the economy Steve Margetts
Page 36
The calculation of the RPIX is similar to the RPI, but excludes mortgage interest payments. This is because when interest rates are increased to control aggregate demand and inflation, the immediate effect is to increase mortgage interest payments and, therefore, housing costs. As housing costs are a significant component of the RPI (see the table above), inflation is artificially increased. Thus the very policy adopted to tackle inflation actually creates a greater problem in the short run, and explains why the Government discounts this component of the RPI. RPIY INFLATION RPIY, or the core rate of inflation, excludes indirect taxes and the council tax on the inflation rate. By stripping out the effect of these taxes, the Government can establish the core change of prices within the economy. Cynics would argue that it is just another way of reducing the headline rate. A new measure of inflation has recently been introduced by countries within the European Union. This is called the harmonised index of consumer prices (HICP) and is meant to provide a standardised measure of inflation for each member nation of the European Union. OTHER MEASURES OF INFLATION Input cost inflation measures prices paid by firms for raw materials, components and fuel. However, it does not include labour costs. Over recent years the prices of essential inputs have stayed fairly low. Indeed the rate of input price inflation has been negative for a long period (see chart below). This has helped keep cost-push inflationary pressure under control. These are measured separately by Unit Labour Costs (ULCs) which are calculated by dividing total labour costs by output - to give the labour cost per unit of output. A common misconception is that a rise in wages or average earnings immediately places upward pressure on producer prices. This is not necessarily true, since rising earnings may be offset by an equivalent increase in productivity with ULCs remaining unchanged .

Unit 3 Managing the economy Steve Margetts
Page 37
The prices at which finished goods leave the factory is measured by the Producer Price Index (PPI). The PPI is also a good leading indicator of the RPI. THE MAIN CAUSES OF INFLATION The British economy has experienced inflation throughout the last thirty years - but the rate at which prices have been rising has not been stable. The chart below tracks the annual rate of inflation for the British economy in each year since 1968.
In an open economy (i.e. a country that engages in international trade), price inflation can be caused by a number of factors. Economists divide them into two main groups, demand-pull and cost-push inflation. DEMAND PULL INFLATION Demand Pull inflation occurs when total demand for goods and services exceeds total supply. This type of inflation happens when there has been excessive growth in aggregate demand and there is an inflationary gap. Demand-pull inflation is often monetary in origin - because the authorities allow the money supply to grow faster than the ability of the economy to supply goods and services. The phrase that is often used is that there is "too much money chasing too few goods" An example of this was during the late 1980s with the so-called "Lawson Boom". There was a sharp rise in the demand for credit and an explosion in house prices. The amount of money in circulation grew at alarming rates and caused excess demand in the economy. By the autumn of 1990, retail price inflation had climbed to 10.9%. A recession was needed to bring it back down again. A similar though smaller inflationary gap appeared in the UK economy in 1997/98 after five years of sustained economic growth. This led the newly independent Bank of England to raise interest rates from 6% to 7.5% between May 1997 and June 1998. Fortunately the British economy responded well to the "monetary medicine" and experienced a slowdown through late 1998 and 1999. Demand-pull inflationary pressures subsided leaving retail price inflation comfortably within the Government's chosen target range.

Unit 3 Managing the economy Steve Margetts
Page 38
Demand pull inflation can be illustrated graphically using aggregate demand and aggregate supply analysis.
O
AS 1
Pric
e le
vel (
P)
Real National Income (Y)
P1
AD 2
P2
Y2Y1
AD 1
Aggregate supply (AS) shows the total supply of goods and services that firms are able to produce at each and every price level. At low levels of output when there is plenty of spare productive capacity, firms can easily expand output to meet increases in demand, resulting in a relatively elastic AS curve. As the economy approaches full employment (or full capacity), labour and raw material shortages mean that it becomes more difficult for firms to expand production to meet rising demand. As a result, the AS curve becomes more inelastic. When aggregate demand (AD) increases from AD1 to AD2 the economy is still operating at relatively low levels of capacity. Output can expand relatively easily so firms will only implement small increases in prices from P1 to P2. When aggregate demand increases from AD1 to AD2 the economy is moving towards the full employment of factors of production. Many firms choose to increase price to widen profit margins. Shortages of factor inputs mean that the firms' costs of production start to rise. Furthermore, it is likely that, as employment in the economy grows, demand for goods and services will become more inelastic. This will allow firms to pass on large price increases (P1 to P2) without any significant fall in demand. Main causes of increased aggregate demand: • Rapid growth of household consumption • Increases in government spending

Unit 3 Managing the economy Steve Margetts
Page 39
• Injections of demand from higher exports COST PUSH INFLATION This occurs when firms increase prices to maintain or protect profit margins after experiencing a rise in their costs of production. The main causes are: • Growth in Unit Labour Costs • Rising input costs • Increases in indirect taxes • Higher import prices (Imported inflation) An increase in input costs will mean that firms can produce less at each and every price level and, as a result, the AS curve will shift to the left from AS1 to AS2.
O
AS 2
AD
Pric
e le
vel (
P)
Real National Income (Y)
P2
AS 1
P1
Y1Y2
At the new equilibrium level of national output, the economy is producing a lower level of output (Y1) at a higher price level (P1). Higher cost push inflation therefore causes a contraction in real output as well a higher average price level. Will an increase in a firm’s costs always feed through into inflation? No, because a business can absorb an increase in costs by reducing its profit margin. An example of this occurred after the devaluation of Sterling in September 1992. The fall in the value of the pound caused a rise in the cost of imported fuel and raw materials. Although input costs rose in 1993, this increase did not fully feed through into the prices of goods and services leaving the factory gate, as measured by Producer Prices.

Unit 3 Managing the economy Steve Margetts
Page 40
Many firms were forced to reduce profit margins and absorb the increase in costs or face a loss in market share. This was due to the high level of spare capacity in the economy. Effectively, firms were facing elastic demand curves and any increases in price would have resulted in a fall in demand and total revenue. INFLATIONARY GAPS When aggregate demand exceeds an economy's productive potential there is an inflationary gap. We tend to see rising inflation and a worsening trade situation at these times
O
Pric
e le
vel
National outputQ1
AS
AD2
AD1
P1
P2
CONTROLLING AN INFLATIONARY GAP The government may use monetary and or fiscal policy to help reduce the size of the inflationary gap. An improvement in the supply-side performance of the economy would also achieve this.
• Monetary Policy: Higher interest rates to curb consumer demand • Fiscal Policy: A rise in the burden of taxation to reduce real
disposable incomes • Supply-side Policy: Measures to increase productivity and efficiency.
This leads to a rise in aggregate supply and reduces the amount of excess demand in the long run.
Inflationary gaps can arise when the economy has grown for a long time on the back of a high level of aggregate demand. Total spending may rise faster than the economy's ability to supply goods and services. As a result, actual GDP may exceed potential GDP leading to a positive output gap in the economy.

Unit 3 Managing the economy Steve Margetts
Page 41
COSTS AND EFFECTS OF INFLATION There is widespread agreement that high and volatile inflation can be damaging both to individual businesses and consumers and also to the economy as a whole. However, economists disagree about the relative seriousness of inflation. The revision notes below cover some of the main economic and social costs associated with persistent inflation in goods and services. Effect on UK competitiveness - if the UK has higher inflation than the rest of the world it will lose price competitiveness in international markets. This assumes a given exchange rate. If the exchange rate depreciates, this may help to restore some of the lost competitiveness. Consider the chart above which shows the annual average increase in consumer prices for the UK, the United States and Euroland during the last four decades. Inflation in Britain has been relatively higher than in other major competitor countries - although the chart also indicates a movement towards inflation convergence during the 1990s This rise in relative inflation leads to a fall in the world share of UK exports and a rise in import penetration. Ultimately, this will lead to a fall in the rate of economic growth and the level of employment. The problems of a wage-price spiral – price rises can lead to higher wage demands as workers try to maintain their real standard of living. Higher wages over and above any gains in labour productivity causes an increase in unit labour costs. To maintain their profit margins they increase prices. The process could start all over again and inflation may get out of control. Higher inflation causes an upward spike in inflationary expectations that are then incorporated into wage bargaining. It can take some time for these expectations to be controlled. Higher inflation expectations can cause an outward shift in the Philips Curve. Inflation can also cause a reduction in the real value of savings - especially if real interest rates are negative. This means the rate of interest does not fully compensate for the increase in the general price level. In contrast, borrowers see the real value of their debt diminish. Inflation, therefore, favours borrowers at the expense of savers. Consumers and businesses on fixed incomes will lose out. Many pensioners are on fixed pensions so inflation reduces the real value of their income year on year. The state pension is normally uprated each year in line with average inflation so that the real value of the pension is not reduced. However it is unlikely that pensioners have the same spending patterns as those used to create the weights from which the RPI figure is calculated. For example in November 1999, the state pension was up-rated by just 1.1% - the headline rate of inflation for that month.

Unit 3 Managing the economy Steve Margetts
Page 42
Inflation usually leads to higher nominal interest rates that should have a deflationary effect on GDP. Inflation can also cause a disruption of business planning – uncertainty about the future makes planning difficult and this may have an adverse effect on the level of planned capital investment. Budgeting becomes a problem as firms become unsure about what will happen to their costs. If inflation is high and volatile, firms may demand a higher nominal rate of return on planned investment projects before they will go ahead with the capital spending. These hurdle rates may cause projects to be cancelled or postponed until economic conditions improve. A low rate of new capital investment clearly damages long-run economic growth and productivity. Cost-push inflation usually leads to a slower growth of company profits which can then feed through into business investment decisions. Inflation distorts the operation of the price mechanism and can result in an inefficient allocation of resources. When inflation is volatile, consumers and firms are unlikely to have sufficient information on relative price levels to make informed choices about which products to supply and purchase. Shoe leather costs - when prices are unstable there will be an increase in search times to discover more about prices. Inflation increases the opportunity cost of holding money, so people make more visits to their banks and building societies (wearing out their shoe leather!). Menu costs - extra costs to firms of changing price information. This can be important for companies who rely on bulky catalogues to send price information to customers. (Note there are also significant menu costs associated with any future transition to the European Single Currency) Anticipated and unanticipated inflation In general the costs of inflation to consumers are smaller when inflation is anticipated. They can take steps to protect the real value of their income and savings. The economic problems from high and variable inflation are more serious for the whole economy in the long run - particularly for those countries that are heavily dependent on international trade for their prosperity. UNIT LABOUR COSTS AND INFLATION Changes in unit labour costs (ulc's) are important in determining the underlying rate of inflation for the economy in the medium term. When the economy experiences an increase in unit labour costs - the effect is to reduce aggregate supply at each price level. The diagram below shows how an inward shift of AS for a given level of aggregate demand causes an increase in the general level of prices - this is known as cost-push inflation

Unit 3 Managing the economy Steve Margetts
Page 43
O
AS 2
AD
Pric
e le
vel (
P)
Real National Income (Y)
P2
AS 1
P1
Y1Y2
Unit labour costs measure the labour cost per unit of output produced. ULCs will rise when total labour costs rise faster than output. For example if wages rise by 5% and labour productivity (output per worker) grows by 2%, unit labour costs will rise by 3%. A rise in labour productivity helps to control unit labour costs. This is because a producer is achieving a higher output from each unit of labour employed for a given wage cost. The annual change in UK unit labour costs since 1981 is shown in the chart below
Unit labour costs tend to rise fastest when (a) there is an acceleration in wage demands / basic pay settlements and (b) there is a slowdown in the growth of productivity. Unit labour costs have grown less quickly in the 1990s compared with the 1980s. In part this is because wage demands have been much lower on average during the current decade. This has been an important factor in

Unit 3 Managing the economy Steve Margetts
Page 44
explaining the continued low rates of inflation in the British economy over the last ten years. MONETARY INFLATION The Monetarist explanation of inflation operates through the Fisher equation. M.V = P.T M = Money Supply V = Velocity of Circulation P = Price level T = Transactions or Output As Monetarists assume that V and T are fixed, there is a direct relationship between the growth of the money supply and inflation. The mechanisms by which excess money might be translated into inflation are examined below. Individuals can also spend their excess money balances directly on goods and services. This has a direct impact on inflation by raising aggregate demand. The more inelastic is aggregate supply in the economy, the greater the impact on inflation. The increase in demand for goods and services may cause a rise in imports. Although this leakage from the domestic economy reduces the money supply, it also increases the supply of pounds on the foreign exchange market thus applying downward pressure on the exchange rate. This may cause imported inflation. If excess money balances are spent on goods and services, the increase in the demand for labour will cause a rise in money wages and unit labour costs. This may cause cost-push inflation. ECONOMIC POLICES TO CONTROL INFLATION Policies to control inflation need to focus on the underlying causes of inflation in the economy. For example if the main cause is excess demand for goods and services, then government policy should look to reduce the level of aggregate demand. If cost-push inflation is the root cause, production costs need to be controlled for the problem to be reduced. MONETARY POLICY - INTEREST RATES Since May 1997, the Bank of England has had operational independence in the setting of official interest rates in the United Kingdom. They set interest rates with the aim of keeping inflation under control over the next two years. Monetary policy can control the growth of demand through an increase in interest rates and a contraction in the real money supply. For example, in the late 1980s, interest rates went up to 15% because of the excessive growth in the economy and contributed to the recession of the early 1990s. This is shown in the chart above Higher interest rates reduce aggregate demand in three ways; • Discouraging borrowing by both households and companies

Unit 3 Managing the economy Steve Margetts
Page 45
• Increasing the rate of saving (the opportunity cost of spending has increased)
• The rise in mortgage interest payments will reduce homeowners' real 'effective' disposable income and their ability to spend. Increased mortgage costs will also reduce market demand in the housing market
Business investment may also fall, as the cost of borrowing funds will increase. Some planned investment projects will now become unprofitable and, as a result, aggregate demand will fall. Higher interest rates could also be used to limit monetary inflation. A rise in real interest rates should reduce the demand for lending and therefore reduce the growth of broad money. FISCAL POLICY • Higher direct taxes (causing a fall in disposable income) • Lower Government spending • A reduction in the amount the government sector borrows each year
(PSNCR) These fiscal policies increase the rate of leakages from the circular flow and reduce injections into the circular flow of income and will reduce demand pull inflation at the cost of slower growth and unemployment. AN APPRECIATION OF THE EXCHANGE RATE An appreciation in the pound sterling makes British exports more expensive and should reduce the volume of exports and aggregate demand. It also provides UK firms with an incentive to keep costs down to remain competitive in the world market. A stronger pound reduces import prices. And this makes firms' raw materials and components cheaper; therefore helping them control costs. A rise in the value of the exchange rate might be achieved by an increase in interest rates or through the purchase of sterling via Central Bank intervention in the foreign exchange markets. DIRECT WAGE CONTROLS - INCOMES POLICIES Incomes policies (or direct wage controls) set limits on the rate of growth of wages and have the potential to reduce cost inflation. The Government has not used such a policy since the late 1970s, but it does still try to influence wage growth by restricting pay rises in the public sector and by setting cash limits for the pay of public sector employees. In the private sector the government may try moral suasion to persuade firms and employees to exercise moderation in wage negotiations. This is rarely sufficient on its own. Wage inflation normally falls when the economy is heading into recession and unemployment starts to rise. This causes greater job insecurity and some workers may trade off lower pay claims for some degree of employment protection.

Unit 3 Managing the economy Steve Margetts
Page 46
LONG-TERM POLICIES TO CONTROL INFLATION LABOUR MARKET REFORMS The weakening of trade union power, the growth of part-time and temporary working along with the expansion of flexible working hours are all moves that have increased flexibility in the labour market. If this does allow firms to control their labour costs it may reduce cost push inflationary pressure. Certainly in recent years the UK economy has not seen the acceleration in wage inflation normally associated with several years of sustained economic growth and falling inflation. One reason is that rising job insecurity inside a flexible labour market has tilted the balance of power away from employees towards employers. SUPPLY SIDE REFORMS If a greater output can be produced at a lower cost per unit, then the economy can achieve sustained economic growth without inflation. An increase in aggregate supply is often a key long term objective of Government economic policy. In the diagram below we see the benefits of an outward shift in the short run aggregate supply curve. The equilibrium level of real national income increases and the average price level falls.
O
AS 1
AD
Pric
e le
vel (
P)
Real National Income (Y)
P1
AS 2
P2
Y2Y1
Supply side reforms seek to increase the productive capacity of the economy in the long run and raise the trend rate of growth of labour and capital productivity. A number of supply-side policies have been introduced into the British economy in recent years. Productivity gains help to control unit labour costs (an important cause of cost-push inflation) and put less pressure on producers to raise their prices. The key to controlling inflation in the long run is for the authorities to keep control of aggregate demand (through fiscal and monetary policy) and at the
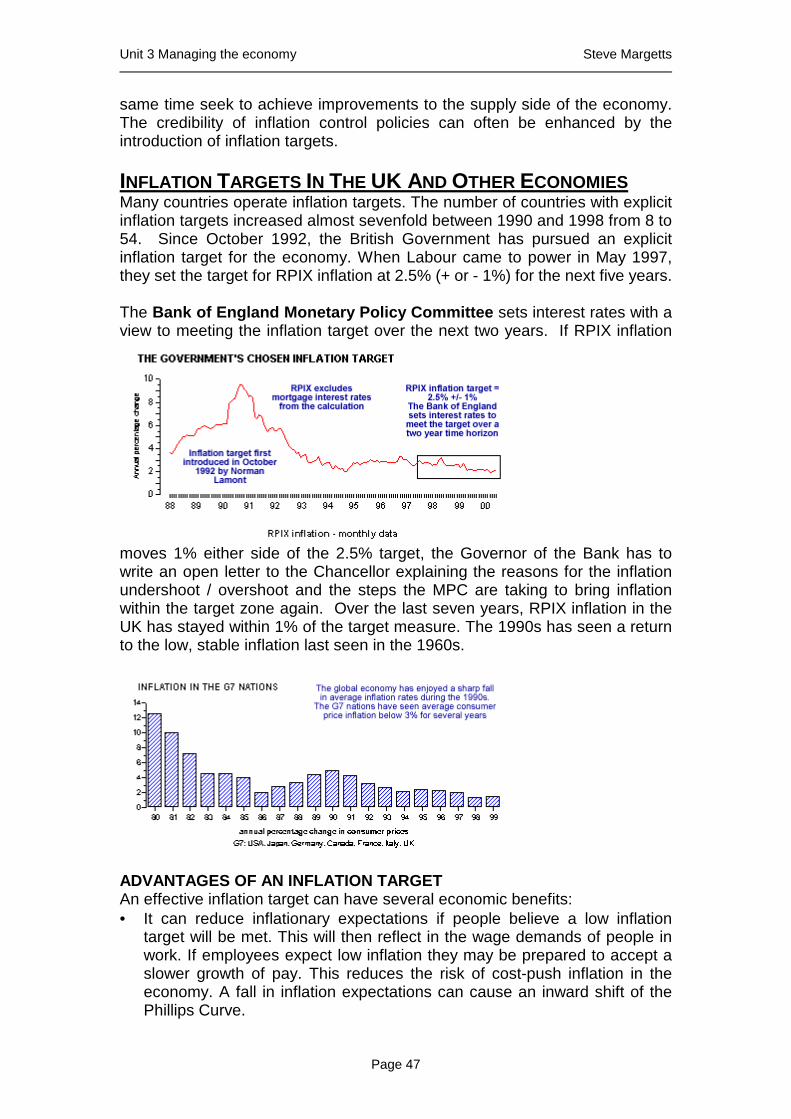
Unit 3 Managing the economy Steve Margetts
Page 47
same time seek to achieve improvements to the supply side of the economy. The credibility of inflation control policies can often be enhanced by the introduction of inflation targets. INFLATION TARGETS IN THE UK AND OTHER ECONOMIES Many countries operate inflation targets. The number of countries with explicit inflation targets increased almost sevenfold between 1990 and 1998 from 8 to 54. Since October 1992, the British Government has pursued an explicit inflation target for the economy. When Labour came to power in May 1997, they set the target for RPIX inflation at 2.5% (+ or - 1%) for the next five years. The Bank of England Monetary Policy Committee sets interest rates with a view to meeting the inflation target over the next two years. If RPIX inflation
moves 1% either side of the 2.5% target, the Governor of the Bank has to write an open letter to the Chancellor explaining the reasons for the inflation undershoot / overshoot and the steps the MPC are taking to bring inflation within the target zone again. Over the last seven years, RPIX inflation in the UK has stayed within 1% of the target measure. The 1990s has seen a return to the low, stable inflation last seen in the 1960s.
ADVANTAGES OF AN INFLATION TARGET An effective inflation target can have several economic benefits: • It can reduce inflationary expectations if people believe a low inflation
target will be met. This will then reflect in the wage demands of people in work. If employees expect low inflation they may be prepared to accept a slower growth of pay. This reduces the risk of cost-push inflation in the economy. A fall in inflation expectations can cause an inward shift of the Phillips Curve.

Unit 3 Managing the economy Steve Margetts
Page 48
• A target gives monetary policy a clear anchor and improves the accountability and transparency of economic policy-making. The quarterly Bank of England Inflation Report is a highly detailed assessment of economic trends and the Bank's best guess about future movements in inflation. All A-Level Economists and Degree students should make a habit of reading it!
• Sustained low inflation improves prospects for higher levels of capital investment in both manufacturing an service industries. This is because businesses will not demand such high nominal rates of return on potential investment projects if they believe that inflation will remain low and stable.
• A Bank of England report in August 1999 argued that inflation targets have been successful in reducing inflation expectations and improving people's understanding of the inflation process
POTENTIAL DISADVANTAGES OF AN INFLATION TARGET • The main drawback is that a narrow inflation target is risky for an open
economy such as the UK. Am open economy relies heavily on exports and imports and imposes few restrictions on free trade between countries.
• Fluctuations in the exchange rate and changes in inflation rates in other countries or in the prices of imported goods and services can push the domestic inflation rate higher and lead to increases in interest rates. Higher interest rates have the effect of damaging economic growth and employment.
• There is a danger that strict adherence to a tough inflation target may lead to the economy operating well below its long-run productive potential. This can create much higher unemployment - which in itself generates economic and social costs.
Nonetheless, most countries have decided that some target for inflation should be maintained. How they achieve the target is a matter of continuous economic debate! WHAT IS DEFLATION? Deflation refers to a decrease in the general price level of the economy. A fall in prices in particular markets, such as housing, share prices or the market for electronic goods or textiles is not the same as economy-wide deflation.

Unit 3 Managing the economy Steve Margetts
Page 49
Most economists believe that disinflation or falling inflation is beneficial for the economy. A stable price level can lead to better decisions and a more efficient use of scarce resources. Lower inflation also helps to stabilize inflationary expectations. A decline in prices after an improvement in productivity is allows companies to cut costs and prices, thereby raising living standards. The type of deflation that analysts fear is the kind that is broadly-based throughout the economy, long-lasting, and symptomatic of a weak economy stuck in recession. When prices are falling , consumers may decide to postpone purchases in the expectation of buying the item at a cheaper price later on. This causes a fall in demand and can create further price declines. Deflation also causes real interest rates to rise, curbing demand. As well, falling asset prices (including housing and equities) reduce personal sector wealth and inflate the real value of debt, resulting in higher business failures and personal bankruptcies. It is clear therefore that deflation in the economy brings risks as well as opportunities. This is something that a government and the monetary authorities (i.e. the Central Bank) might be concerned to avoid. DEFLATION AND ECONOMIC POLICY Deflation can normally be controlled by an expansionary monetary policy with the Central Bank or the Government allowing the money supply to expand. This causes interest rates to fall and stimulates consumer spending and investment demand. Occasionally though, when prices are falling, lenders may call in loans or refuse to lend out to potential borrowers. This is known as a credit crunch. Cutting interest rates may not be sufficient during a credit crunch. In this case, expansionary fiscal policy (lower direct and indirect taxes and higher government spending) is often prescribed to cure deflation. One reason deflation is difficult to cure is that nominal interest rates cannot fall below zero, while prices of goods and services can fall for a long time. In this event, monetary policy is unable to prevent higher real interest rates and the economy spirals downwards towards a slump caused by falling prices, contracting output, falling investment, plant closures and increasing levels of job losses in those industries affected.

Unit 3 Managing the economy Steve Margetts
Page 50
UNEMPLOYMENT
MEASURING UNEMPLOYMENT THE CLAIMANT COUNT The unemployed are those registered as able, available and willing to work at the going wage rate in any suitable job who cannot find employment. Unemployment is a flow concept - i.e. there are inflows and outflows from the total. Unemployment falls when more people leave the unemployment register (when they find work) than sign on each month. The annual average rate of unemployment for the UK since 1971 using the claimant count figures are shown in the chart below.
THE LABOUR FORCE SURVEY In April 1998, the Government introduced a new monthly Labour Force Survey using a different measure of unemployment. The new measure is based on the International Labour Organisation (ILO) definition of unemployment. It covers those who have looked for work in the past four weeks and are able to start work in the next two weeks.

Unit 3 Managing the economy Steve Margetts
Page 51
The previous monthly count only included those who were unemployed and claiming benefit. This excluded a number of people who are classed as unemployed under the ILO definition. The most significant group who are now included in the monthly unemployment statistics are women seeking work whose partners are on means tested benefit. SEASONAL ADJUSTMENT This is an adjustment made to economic data that allows for changes due solely to the period of time at which the data was collected, instead of examining the underlying forces in which we may in fact be interested. For example, at Christmas, the unemployment figures may be artificially reduced due to the number of people taking temporary employment in the retail sector. The seasonally adjusted unemployment figures will exclude this rise in temporary employment from their calculations.
ECONOMIC COSTS OF UNEMPLOYMENT Most economists agree that high levels of unemployment are costly not only to the individuals and families directly affected, but also to local and regional economies and the economy as a whole. We can make a distinction between the economic costs arising from people out of work and the social costs that often result.

Unit 3 Managing the economy Steve Margetts
Page 52
LOST OUTPUT OF GOODS AND SERVICES Unemployment causes a waste of scarce economic resources and reduces the long run growth potential of the economy. An economy with high unemployment is producing within its production possibility frontier. The hours that the unemployed do not work can never be recovered. But if unemployment can be reduced, total national output can rise leading to an improvement in economic welfare. FISCAL COSTS TO THE GOVERNMENT High unemployment has an impact on government expenditure, taxation and the level for government borrowing each year
• An increase in unemployment results in higher benefit payments and lower tax revenues. When individuals are unemployed, not only do they receive benefits but also pay no income tax.
• As they are spending less they contribute less to the government in indirect taxes.
• This rise in government spending along with the fall in tax revenues may result in a higher government borrowing requirement (known as a public sector net cash requirement)
DEADWEIGHT LOSS OF INVESTMENT IN HUMAN CAPITAL Unemployment wastes some of the scarce resources used in training workers. Furthermore, workers who are unemployed for long periods become de-skilled as their skills become increasingly dated in a rapidly changing job market. This reduces their chances of gaining employment in the future, which in turn increases the economic burden on government and society. Social Costs Of Unemployment Rising unemployment is linked to social and economic deprivation - there is some relationship between rising unemployment and rising crime and worsening social dislocation (increased divorce, worsening health and lower life expectancy).

Unit 3 Managing the economy Steve Margetts
Page 53
Areas of high unemployment will also see a decline in real income and spending together with a rising scale of income inequality. As younger workers are more geographically mobile than older employees, there is a risk that areas with above average unemployment will suffer from an ageing potential workforce - making them less attractive as investment locations for new businesses. The duration of unemployment affects the economic and social costs. It is clear therefore that unemployment carries substantial economic and social costs. These costs are greatest when long-term structural unemployment is high. Indeed many government focus their labour market policies on improving the employment prospects of the long-term unemployed.
THE MAIN CAUSES OF UNEMPLOYMENT
In a modern economy unemployment has a variety of causes. Some of them relate to the general level of economic activity, others are the result of a failure of the labour market in an economy to work optimally. Among the main types of unemployment we can consider:
• Real wage unemployment • Demand deficient unemployment • Frictional unemployment • Structural unemployment • Hidden unemployment
REAL WAGE UNEMPLOYMENT Real wage unemployment is a form of dis-equilibrium unemployment that occurs when real wages for jobs are forced above the market clearing level. Traditionally, trade unions and wages councils are seen as the institutions causing this type of unemployment although the importance of trade unions in the UK labour market has diminished significantly over recent years and this has not stopped unemployment reaching nearly three million twice in the last twenty years.

Unit 3 Managing the economy Steve Margetts
Page 54
DEMAND DEFICIENT UNEMPLOYMENT
Demand Deficient Unemployment is associated with an economic recession or a sharp economic slowdown. It occurs due to a fall in the level of national output in the economy causing firms to lay-off workers to reduce costs and protect profits. Remember that labour as a factor input is a derived demand and a fall in the demand for output will cause an inward shift in the demand for labour at each wage level. This is a process known as labour-shedding. Although demand deficient unemployment is usually associated with economic recessions it can also exist in the long run when the economy is constantly run below capacity. As the economy recovers from a downturn, we expect to see the problem of cyclical unemployment decline. FRICTIONAL UNEMPLOYMENT This type of unemployment reflects job turnover in the labour market. Even when there are plenty of vacancies available, it takes time to search and find new employment and workers will remain frictionally unemployed. STRUCTURAL UNEMPLOYMENT Structural unemployment exists even when there are unfilled job vacancies due to a mismatch between the skills of the registered unemployed and those required by employers. People made redundant in one sector of the economy cannot immediately take up jobs in other parts as they do not have the relevant skills. For example, it would be hard for a redundant ship yard worker to instantly take a job in a high-tech electronics business. Likewise workers laid-off in steel manufacturing may have problems in finding re-employment in financial services. This type of unemployment is linked to occupational immobility of labour.

Unit 3 Managing the economy Steve Margetts
Page 55
Structural unemployment often occurs more heavily in certain regions because of the long-run decline of traditional industries. For example the loss of manufacturing jobs in the north-east of England, the closure of coal mines in Scotland and Wales and the long-run decline of ship-building in the United Kingdom. Employment in these sectors contracts due to changes in the pattern of demand or methods of production. The scale of the problem depends on the regional concentration of the industry, the speed of changes in demand and the immobility of labour both occupational and geographical. Simply raising the level of aggregate demand in the economy will do little to alleviate the problem of structural unemployment. HIDDEN UNEMPLOYMENT Whatever the published figures for unemployment, there are bound to be people who are interested in taking paid work but who, for one reason or another, are not classified as unemployed. An example of this is discouraged workers - people who have effectively given up active search for jobs perhaps because they have been out of work for a long time and have lost both the motivation to apply for jobs and also the skills required. The poverty trap can also act to increase hidden unemployment. Jobless workers may not apply for jobs because of financial disincentives created by the interaction of the income tax and state benefits system.
POLICIES TO REDUCE UNEMPLOYMENT
A range of government policies are available for Governments wanting to reduce the scale of unemployment in the economy. These policies need to focus on the underlying causes of unemployment for them to be successful.
• Real Wage • Keynesian • Structural • Frictional

Unit 3 Managing the economy Steve Margetts
Page 56
REAL WAGE UNEMPLOYMENT Prescriptions for reducing real wage unemployment normally focus around the strategy of making each labour market more flexible so that pay conditions become more adaptable to changing demand and supply conditions. Real wages should rise when demand, output and employment and rising, but they may need to fall if an industry experiences recession which puts jobs at threat. The UK economy has developed a flexible labour market model similar to that of the United States during the last fifteen years. Trade Union reforms were a centre-piece of the Conservative Government's strategy to improve the performance of the labour market. The Labour Party under Tony Blair has not reversed these reforms since coming to office, although some new legislation has been introduced to give workers the right to achieve union recognition. A National Minimum Wage has also been introduced. KEYNESIAN UNEMPLOYMENT Policies to reduce Keynesian demand-deficient unemployment need to raise the level of aggregate demand for goods and services in the economy. A number of options are available. Increased Government Expenditure
The Government can raise the level of its own spending. This "fiscal pump-priming" directly increases aggregate demand and can have a multiplier effect

Unit 3 Managing the economy Steve Margetts
Page 57
on equilibrium national income. The government could raise current expenditure (for example raising pay levels in education and the health service) or expand spending on capital projects which add to the stock of capital (for example spending on new roads, new hospitals or other major infrastructural projects). Sustained economic growth provides a platform for more jobs to be created in the economy. Lower Taxation A reduction in direct taxation increases consumers' disposable income and should boost household spending. The effect may be greater if taxes are cut for people on lower than average incomes. These tax-payers are likely to spend a greater percentage of their disposable income. Lower interest rates A relaxation of monetary policy through lower interest rates encourages the demand for credit, reduces saving and increases consumers' real 'effective' disposable incomes; all of which will boost consumption and demand. It may also encourage firms to invest, as the marginal cost of investment will fall. Remember that interest rates are not set by the government. The Bank of England now sets interest rates each month at the meetings of the Monetary Policy Committee. Depreciation of the exchange rate A lower value for the pound should lead to a rise in the orders of exports from UK firms and to a reduction of import penetration by making exports cheaper and imports more expensive. Remember the importance of time lags! Government policies to stimulate increased aggregate demand for domestic output take time to have their effect. There are variable time lags between the government reflating the economy using fiscal and or monetary policy and the final effect on output and employment in specific industries. STRUCTURAL UNEMPLOYMENT

Unit 3 Managing the economy Steve Margetts
Page 58
There are a number of different approaches that can be adopted to help alleviate structural unemployment. These are sometimes known as active labour market policies. The first involves direct government action to match jobs to the unemployed. Regional policy incentives Gives grants and subsidies to firms to locate in areas of high unemployment. However, this does not solve the problem of occupational immobility. Often regional policy requires extra retraining schemes to give workers the relevant skills to allow them to take up new jobs. Investment in worker training Spending on training schemes to re-skill the unemployed through investment in vocational education or guaranteed work experience for unemployed "outsiders" in the labour market.
Improving geographical mobility of labour The government could provide grants or low cost housing to encourage workers to move to other regions where there are jobs. The problem with this policy is that people are inherently immobile as they are often bound by family and social ties. Market solution - no need for government to get involved! One approach is to simply leave the problem of structural unemployment to the market. Some economists argue that intervention slows the natural reallocation of resources to high growth areas and only makes the problem worse. In areas of above average unemployment it may make some sense to allow wage levels to fall to attract new capital into an area. FRICTIONAL UNEMPLOYMENT Lower real values of unemployment benefit and improved job information The implementation of the Job Seeker's Allowance in 1996 ensures that workers are actively seeking work as the payment of benefit is dependent on them proving this at fortnightly interviews.

Unit 3 Managing the economy Steve Margetts
Page 59
However, if the government reduced the real value of unemployment benefits, or limited the duration of a claim, search times between jobs could be reduced even further as workers would have to quickly take on new positions before their financial situations deteriorated. Better information on job vacancies in the labour market can help to reduce job search. Cuts in direct taxes The government could reduce direct taxes for the low paid to increase the post tax wage and, therefore, encourage them to find work more quickly. The Labour Government is introducing a 10% starting rate of tax to encourage more low income groups back into work. Most analysts believe that tax cuts on their own are insufficient to reduce frictional unemployment. Complementary reforms to the benefits system to reduce the problem of the poverty trap may also be needed.
THE CHANGING LEVEL AND PATTERN OF EMPLOYMENT
Changes in the level of employment The cyclical nature of the British economy is shown in the chart below. It shows the annual changes in total employment using data from the Labour Force Survey.
In the last two recessions we have seen severe cut-backs in employment levels throughout the economy. This had led to high unemployment and posed major problems for economic policy-makers. However in recent years the performance of the economy in creating and sustaining a higher level of employment has improved. Total employment has increased in each of the last six years. Despite fears of recession last year, the total number of people in paid work increased by 291,000.

Unit 3 Managing the economy Steve Margetts
Page 60
What have been the main structural changes in the UK labour market in recent years? The labour market is continuously evolving and this has implications for everybody involved in the world of work. Because the nature of the economy changes, we always expect to see structural change in the pattern of employment in the economy. Some of the main long term structural changes in the labour market are as follows: • Shift from manufacturing to services. There has been a long decline in
manufacturing employment in the economy and an increase in service sector employment. This is part of the process of de-industrialization. Total manufacturing employment now accounts for less than one-fifth of the employed labour force. The underlying reason behind this is the faster growth of output in the service sector. This trend is shown in the chart below
• Rising female employment - noticeably in service industries • Rise of flexible employment patterns including greater part-time
employment and a switch towards short-term contracts • Expansion of self-employment - now over 3,00,000 people registered as
self-employed. • Long term rise in part-time employment • Higher long-term unemployment • Long term decline in trade union membership and union density • Growing scale of economic inactivity - particularly for males over the
age of 50, lone parents and people with disabilities The UK labour market is a very different animal than twenty years ago. We have seen the development of a flexible labour market in which employment patterns change quite quickly - with important economic and social implications.

Unit 3 Managing the economy Steve Margetts
Page 61
FULL EMPLOYMENT Can the UK economy move towards full-employment? This question is now being raised as total unemployment continues to decline and evidence grows that the economy has managed to avoid a recession in the current economic cycle.
WHAT IS FULL-EMPLOYMENT? There is no unique definition of full-employment. Most economists are in agreement that unemployment cannot fall to zero since there will always be some frictional unemployment caused by people moving into the labour market (searching for work) and others switching between jobs and experiencing short periods of time out of work. Full-employment might also be defined as a situation where the labour market has reached a state of equilibrium - i.e. when those in the active labour force who are willing and able to work at going wage rates are able to find work. At this point the remaining unemployment would essentially be frictional. Several countries have made significant progress towards reaching full-employment in recent years. The chart below shows the standardised unemployment rates for the United States, UK and Germany since 1992. Germany clearly still has an unemployment problem - but in the States and the UK - the current unemployment rates are at their lowest rates for over twenty years.

Unit 3 Managing the economy Steve Margetts
Page 62
Another interpretation of full-employment is when the total of people out of work matches the number of unfilled job vacancies. The problem with this is that estimates of the scale of job vacancies vary considerably. Some economists believe that the true number of jobs available is three times the official published figure. HOW CLOSE IS THE UK TO REACHING FULL-EMPLOYMENT? According to the claimant count measure, there are 1.2 million people claiming the Job Seekers' Allowance (4.0% of the labour force). The alternative Labour Force Survey puts unemployment somewhat higher at 1.7m (5.9%). In some towns however we have already reached effective full-employment Assuming that full-employment is achieved when 2% of the labour force are out of work (i.e. when the employment rate has reached 98%) - the UK economy will have to create another 800,000 to 1,000,000 new jobs for full-employment to be achieved. Many of those unemployed at the moment are out of work for structural reasons and despite a series of active labour market policies designed to bring them back into work, they remain a major long-term problem for the economy.

Unit 3 Managing the economy Steve Margetts
Page 63
THE RISK OF WAGE INFLATION Another obstacle to reaching full-employment is the risk that inflation will pick up as more people find work and total spending in the economy causes businesses to raise prices. When unemployment is falling, there is pressure on firms to bid up wages both to attract and retain staff. Labour shortages that cause an acceleration in wage inflation might persuade the Bank of England to increase interest rates. This would slow down the economy and the rate of new job creation might suffer as a result.
Although the economy has enjoyed a sustained fall in unemployment over the last six years, bringing unemployment down much further may prove difficult.
THE NATURAL RATE OF UNEMPLOYMENT The natural rate of unemployment is the rate of unemployment where the labour market is in a position of equilibrium. This means that the labour supply = labour demand at a given real wage rate. All those people willing and able to take paid employment at the going wage rate do so. The diagram below shows the labour supply (those willing and able to take work at a going wage rate) and the labour force - the number of active participants in the labour market. The labour force expands as the real wage rises because there is a greater incentive to search for paid work and sacrifice leisure. Employment on the x-axis measures the total labour hours supplied by workers in the economy in a given time period. As the real wage increases, the total number of hours supplied by the labour force will expand.

Unit 3 Managing the economy Steve Margetts
Page 64
O
Labour Supply
Labour demand
Wag
e (W
)
Employment (E)
W1
Labour force
W2
E1
BA
The natural rate of unemployment is not zero - at the equilibrium wage W1 in the diagram above, there is unemployment measured by AB. This is made up of frictional plus structural unemployment. At a wage rate W2 (above the equilibrium "market-clearing wage") employment contracts along the labour demand curve and total unemployment rises (see the diagram below)
O
Labour Supply
Labour demand
Wag
e (W
)
Employment (E)
W1
Labour force
W2
E1
BA
C D

Unit 3 Managing the economy Steve Margetts
Page 65
Dis-equilibrium unemployment rises to the level shown by the distance CD. This is because labour demand has fallen and the labour force has expanded. There is an excess supply of labour - some people who are willing and able to find employment cannot get paid work.
Unemployment in the UK economy has fallen someway below the average for the leading 23 nations that comprise the Organisation of Economic Cooperation and Development (OECD). This is shown in the chart above. Some economists claim this is evidence that the natural rate of unemployment has fallen, allowing the economy to operate at a higher level of economic activity without experiencing an acceleration in inflation.
THE NAIRU The Non Accelerating Inflation Rate of Unemployment is the level of unemployment at which inflationary pressures in the economy are stable. According to supply-side economists, unemployment cannot be held permanently below its natural level. Some argue if actual unemployment falls below the natural rate (i.e. equilibrium unemployment) - there is upward pressure on wage inflation that then feeds into general price inflation. Clearly changes in unemployment do have an effect on the risk of inflation. Consider this comment from the Bank of England. "Developments in the labour market are a key determinant of domestically generated inflation." (UK Monetary Policy Committee minutes) As unemployment falls towards the NAIRU, skill shortages exert upward pressure on wages and producer prices, until any further falls in unemployment lead to future higher inflation. WHAT DETERMINES THE NAIRU? The NAIRU can and does vary between countries and changes over time for any one particular economy.

Unit 3 Managing the economy Steve Margetts
Page 66
The rate of unemployment at which inflation starts to accelerate is determined by the efficiency of the labour market and the relative strength of employers and employees in the wage bargaining process
THE CHANGING NATURE OF THE WAGE BARGAINING PROCESS
• Strength of Trade Unions - Unions have become much less powerful in the UK over the last twenty years. This has tilted the balance of power towards employers and helped to keep "inflation-busting" pay claims in check
• Centralisation / decentralisation of pay bargaining There has been a switch towards local and regional pay settlements that can take more account of local differences in labour demand and supply
• Scale of involuntary structural unemployment in the economy - measures to reduce structural unemployment should help to reduce the NAIRU if effective. This is because they increase the available labour supply in the economy
Competitiveness of product markets - impact on producers and labour
• When product markets are more competitive there is intensive pressure on firms to control costs. Wage increases might only be justified by improvements in productivity
"External-shock" effects on wage bargaining The economy can be affected by external economic shocks that effect expected inflation.
• The global economic crisis in 1998 has brought down expectations of inflation
• The fall in international commodity prices has had a similar effect - causing a sharp fall in inflation in many countries across the world. Lower input costs cause an outward shift in short run aggregate supply in the economy and should help to increase the real volume of national output

Unit 3 Managing the economy Steve Margetts
Page 67
O
AS 1
AD
Pric
e le
vel (
P)
Real National Income (Y)
P1
AS 2
P2
Y2Y1
Most economists believe that the natural rate of unemployment has fallen in the UK over the last decade. This means that the economy can sustain a lower rate of unemployment without triggering off a renewed burst of wage inflation. The evidence supports this positive view often improving trade-off between unemployment and wage/price inflation. By the summer of 2000, unemployment in the UK had fallen to just 3.8% of the labour force (using the claimant count measure) whilst retail price inflation had remained comfortably within the government's target (2.5%0 and wage inflation was under control. Economists at the OECD have estimated the NAIRU for the leading industrialised countries. Their estimates for 1997 are shown in the chart below. The UK comes out favourably in this international comparison. Our estimated NAIRU is substantially below that of Germany and France - although some way above that for the United States and Japan. The Netherlands (another country to have introduced widespread labour market reforms over the last fifteen years) is also estimated to have a lower NAIRU than the UK.

Unit 3 Managing the economy Steve Margetts
Page 68
JOB VACANCIES IN THE LABOUR MARKET Why are so many jobs left unfilled in the economy? Official unemployment has been falling for over six years yet the total stock of unfilled vacancies has remained at a very high level for some time. See the chart below.
One reason is that the new jobs created in the economy are not taken by the registered unemployed. Instead they are taken by new and re-entrants into the labour market (including females joining the active labour force and recently qualified graduates). Long-term structural unemployment remains a problem and many of those out of work do not have the specific skills, qualifications and relevant work experience to fill the available jobs. They suffer from occupational mobility of labour and require specific help to get them back into employment. Labour introduced the New Deal in the spring of 1998 but it will be some time before New Deal and other employment training programmes to have any significant impact. Another cause is the disincentive effects of the welfare system. Many vacancies offer relatively poorly paid jobs with little job security.

Unit 3 Managing the economy Steve Margetts
Page 69
For low-income households looking for new work, the “poverty trap” created by the interaction of the tax and benefit system is a real hurdle to them accepting paid employment. As a result many lowly paid jobs remain open.
LONG TERM UNEMPLOYMENT Long term unemployment occurs when workers fail to find new paid employment after six months of unemployment. Many workers remain out of work for very long periods and the economic and social costs are much higher than for those experiencing transitory periods of unemployment. Most of the long term unemployed are out of work for structural reasons.
The chart above shows the rate of long term unemployment in the UK using the labour force survey measure. Gradually, the scale of long term unemployment has fallen during the latter half of the 1990s. Employment prospects have improved and the Government's special employment measures have helped to take many thousands of people off the unemployment figures. However even after eight years of sustained economic growth, between March-May in 2000, an average of over 440,000 people were counted as having being out of work for over a year. As the chart below indicates, in the summer of 2000 there were still a quarter of a million people counted as unemployed for over two years.
THE COSTS OF LONG TERM UNEMPLOYMENT Long-term unemployment is an economic disaster. It damages individuals because they lose their self-respect and employers lose interest in them.

Unit 3 Managing the economy Steve Margetts
Page 70
Those who have been unemployed for a short time have a good chance of leaving unemployment, while those who have been unemployed for a long time have a much lower chance.
Employers often do not consider the long-term unemployed to be interesting candidates for vacancies because they perceive them to have lower productivity than other workers. It is therefore possible to have a large number of vacancies coexisting with high unemployment if many of the jobless have been out of work for a long time.
Policies to reduce long term unemployment normally focus on improving the employability of these "outsiders" in the labour market. If successful, structural unemployment can be reduced and the natural rate of unemployment can decline.
NEW DEAL - NEW HOPE? Labour’s New Deal programme for young unemployed people was introduced across the UK in April 1998. In June 1998 the Government launched a separate New Deal for Long-Term Unemployed People aged over 25+. Over two years later we are starting to see some of the effects of these active labour market policies on the UK economy.

Unit 3 Managing the economy Steve Margetts
Page 71
People enter New Deal by moving into a Gateway where they are given an interview and support in choosing a suitable option. The main options are: • a subsidised job with an employer • remaining in full-time education and training • work within the accredited voluntary sector and • work experience with an environmental task force. The fifth option of staying on benefits has been taken away! The programme is designed to provide pathways back into work for the long term unemployed – many of whom have become outsiders in the labour market despite the continuing strength of the British economy. Higher levels of employment and economic activity add to total national output and should help to improve the overall performance of the labour market in sustaining long run economic growth. IS NEW DEAL DELIVERING? The latest data on New Deal participants published shows that up to the end of July 2000, over 518,000 people have now passed through the New Deal scheme, 402,000 have left leaving 116,000 currently on the programme. 237,040 young people had entered employment. Of which 180,600 were in sustained jobs, and 56,440 in jobs lasting less than 13 weeks. There are wide differences in the success rate in getting New Deal participants into work across the regions. Just over one third of participants among 18-24 year olds have moved into employment but in some cities (including Birmingham) the percentage is only 25%. The New Deal programme for workers aged 25+ has been running for a shorter time period. Nonetheless less than 15% of participants have moved into employment. In some areas (Glasgow for example) only one person in ten has passed through the programme into either a subsidised job or non-subsidised employment. Note that these tables show people who have moved into “sustained” jobs involving employment for three months or more.
ECONOMIC GROWTH WHAT IS ECONOMIC GROWTH Economic growth is the percentage increase in real national output in a given time period or a sustained increase in the productive potential of an economy. Countries grow at different rates. Partly this is the simple fact that they are at different stages of their economic cycle. For example in 1999 the US economy was racing ahead but the Japanese economy seemed stuck in the mire of a prolonged slump.

Unit 3 Managing the economy Steve Margetts
Page 72
But there are also supply-side explanations for differences in long-run average growth rates. This is why many economists now give increased attention to improving productivity and efficiency as a means to enhancing the growth potential of the Uk economy. MEASURING THE SIZE OF AN ECONOMY
• Gross Domestic Product (GDP) – is the most commonly used statistic and it’s measured at market prices (includes indirect taxes) and includes imports and exports.
• Gross National Product (GNP) – is equal to the GDP plus income earned abroad on investments and other assets minus income paid to foreigners on their investments
There are a number of problems with GDP:
• Prices have increased over time therefore an increase in GDP may simply signify an increase in the price level rather than the size of the economy. Measuring GDP in real terms eradicates the effects of inflation and allows for comparison of figures over time.
• It is very difficult to compare GDP between nations, due to differences in prices in the countries, exchange rates, different patterns in spending etc.. It can be better to look at income per capita.
• Accuracy of information can vary due to the size of the black market or the way governments measure the GDP.
• An increase in population will lead to an increase in GDP, per capita information can rectify this problem.
• GDP takes no account of externalities. • GDP doesn’t address how the income is distributed amongst the
country’s population. BENEFITS AND COSTS OF ECONOMIC GROWTH The British economy has enjoyed continuous growth of real national output since the late autumn of 1992. Eight years of growth inevitably brings a range of economic and social benefits - but there are also dangers and risks when an economy rides a fast growth path. MAIN ADVANTAGES Employment Real economic growth stimulates higher employment since labour is a derived demand. An increase in real GDP should cause an outward shift in the aggregate demand for labour. Not all industries will share in the growth of an economy.

Unit 3 Managing the economy Steve Margetts
Page 73
The chart above tracks real GDP for the UK since 1955. There have been three main economic recessions over the last thirty years (1974-75, 1980-81 and 1990-92) but over the long run real output has increased on average by a little over 2% per year. Fiscal dividends from economic growth Growth has a positive effect on Government finances - boosting tax revenues and helping to reduce the budget deficit. More people in work, rising spending and higher company profits all contribute to an increased flow of revenue to the Treasury. Growth and Investment Rising demand and output encourages further investment in new capital machinery via the accelerator mechanism. This is known as income induced investment. Business Confidence Sustained economic growth should have a positive impact on company profits & business confidence Living Standards Growth improves living standards as measured by real GDP per capita although real GDP on its own is an inadequate measure of the true standard of living and quality of life.

Unit 3 Managing the economy Steve Margetts
Page 74
DISADVANTAGES OF ECONOMIC GROWTH Inflation risk If the economy grows too quickly there is the danger of inflation as demand races ahead of the ability of the economy to supply goods and services. Producer then take advantage of this by raising prices for consumers. Externalities Fast growth can create negative externalities (increased pollution and congestion) which damages overall social welfare Inequality Not all of the benefits of economic growth are evenly distributed. We can see a rise in national output but also growing income and wealth inequality in society. There will also be regional differences in the distribution of rising income and spending. THE ECONOMIC CYCLE EXPLAINED Real national output does not rise or fall at a uniform rate. All countries experience fluctuations in their rate of economic growth - some more volatile than others! The British economy experiences regular trade or business cycles. Annual and quarterly movements in real output are tracked to measure the cyclical movement of the economy.

Unit 3 Managing the economy Steve Margetts
Page 75
When Real GDP is rising quickly the economy is said to be experiencing economic growth or recovery. When real output falls or when the growth of output is below its long run trend rate - then an economic recession exists. One full economic cycle normally last between 6-10 years - but this is by no means guaranteed. The chart above shows the annual change in UK real national output since 1970. There have only been five full years of "technical recessionary conditions" during this period. For most of the last fifty years the economy has grown in size each year. Notice how the last recession came to an end in 1992 (in fact over the course of the year there was barely any noticeable growth to speak of!). But since then the economy has enjoyed one of the longest sustained expansions in output (and employment) in the post war period. Can this continue? Can the British economy manage at least a decade without experiencing another recession? TREND GROWTH The long-run average growth of real output - known as trend GDP - estimated to be 2.5% for the UK over the last thirty years. Trend growth is determined by the supply-side performance of the economy - in particular the annual increase (improvement) in the productivity of labour and capital. And, the quantity and quality of fixed capital investment which adds to the productive capacity of the economy. The chart below shows the level of real national output for the British economy over recent decades. The trend growth can be taken as the long run average growth rate over time
GROWTH OF OUTPUT BY SECTOR GDP measures the value of output produced by the economy as a whole. We can also track the growth of production in specific sectors such as manufacturing industry and service industries. The chart below shows the annual growth of real output for four separate sectors.

Unit 3 Managing the economy Steve Margetts
Page 76
Over the last six years, the service sector has grown more quickly than manufacturing or construction. Transport and Communication industries have enjoyed rapid growth as has Business Services. In contrast the construction industry has been in technical recession since the 4th quarter of 1998 and manufacturing output also dipped in the 1st quarter of 1999. It is often said that the UK has a two-tier economy with the industrial sector achieving slow growth of output whereas service industries have experienced above trend growth of demand and production THEORIES OF ECONOMIC GROWTH Growth has been a major concern on economic theorists for centuries.
Adam Smith Inquiry into the Nature and Causes of the Wealth of Nations (1776):
• Advocated division of labour, specialisation (absolute advantage) & accumulation of capital
• Advocated Laissez Faire - minimum government interference • Emphasised importance of a stable legal framework, within the market
could function David Ricardo:
• Formalised notion of diminishing returns, but did not take innovation into account

Unit 3 Managing the economy Steve Margetts
Page 77
• Showed some of the welfare gains from specialisation and international trade based on comparative advantage
Robert Solow: Neo-classical growth model:
• Growth depends on capital accumulation - increasing the stock of capital goods to expand productive capacity
• Net investment and the need for sufficient saving to finance investment • Higher savings - postponing consumption to finance increased
allocation of resources towards investment • Capital widening: capital stock rising at rate which keeps pace with
labour force growth. • Capital deepening: capital stock grows faster than labour force.
Considered more important. • Quality of capital goods - improvements due to R&D & innovation
Solow: Acombination of capital deepening & technological improvement explains major trends in economic growth
• Prediction - Adding more capital goods to a fixed amount of labour will lead to diminishing returns to capital.
• Increased capital accumulation drives the rate of return on capital down • Eventually, the rate of return may be so low that no further net capital
accumulation takes place. • In which case the rate of technological progress determined the rate of
growth of output • Technological progress is assumed to be exogenous i.e. lies outside
the growth model Schumpter: Schumpeterian innovation - an explanation of technological progress
• Schumpeter • Long waves of innovation - "gales of creative destruction" • Increased profits arise because of constant birth of new products and
new markets. • Technology raises productivity by increasing quantity and quality of all
those resources to which it is applied. NEW ECONOMIC GROWTH THEORY Associated with economists such as Paul Romer and Paul Ormerod Seeking to make technological progress endogenous.
• A firm will not innovate unless it thinks it can steal a march on its competition & earn higher profits.
• Inconsistent with Neo-Classical assumption of perfect competition - no "abnormal profits".
• Attention shifted to conditions under which a firm will innovate most productively:

Unit 3 Managing the economy Steve Margetts
Page 78
Endogenous growth theory says that government policy to increase capital or foster right kinds of investment in physical capital can permanently raise economic growth.
• If capital broadened to include human capital, law of diminishing returns may not apply - increasing returns to investment from education & efficiency - innovation not necessary.
• Extent of capacity usage - government encouragement of open markets
ECONOMIC RESOURCES AND LONG RUN GROWTH LABOUR FORCE
• Increase in population can stimulate growth by expanding domestic market.
• Rise in participation rates among population of working age • Quality of the labour force - human capital - conducive to high
productivity & real output ENTREPRENEURSHIP
• Entrepreneurial ability - organises and combines other resources to make a profit.
• The quantity of entrepreneurs - forces which encourage entrepreneurial talent include:
• A well-developed capital market, infrastructure & favourable social & political climate
• Quality of entrepreneurs improved by increasing education & government assistance to business.
CAPITAL STOCK
• Importance of gross and net investment • Quality of investment as important at quantity • Positive externality effects from higher investment (increasing returns
to scale?) Government Policies And Economic Growth
1. Open markets - internal and external competition in markets for goods and services
2. Promotion of liberal capital market providing a flow of liquidity to finance investment
3. Protection of private property rights 4. Scale of government spending - possible crowding out of the private
sector if government spending is too 5. Efficiency of the tax and benefit system - may create disincentives
which constrains the active labour supply 6. Incentives for entrepreneurial activity 7. Investment in human capital - active labour market policies 8. Macro-economic stability and credibility of macro economic policy
Young, 1994, Asian tiger's success resulted from:
• Rapid accumulation of capital (through high investment)

Unit 3 Managing the economy Steve Margetts
Page 79
• Labour (through population growth and increased labour-force participation)
• Government policies of encouraging education, opening economy to foreign technologies, promoting trade, keeping taxes low & encouraging savings (30% of GDP in 'tiger' economies)
• Small state - government spending around 20% of GDP compared to over 50% in Europe
ECONOMIC GROWTH AND JOBS Growth creates jobs! In the long term, for an economy to generate employment opportunities to absorb an expanding labour supply, requires sustained growth in real national output. The positive relationship between output and employment exists because labour as a factor input is a derived demand. People are employed for the output they are required to produce. If a country can raise the average rate of growth of real national output it stands a much better chance of a permanent fall in unemployment and a rise in economic activity. Some nations manage this better than others. The United States stands out over the last four years for its employment-creation record. The national pay-roll has expanded by more than 1% in each year since 1995.—not least because real GDP has grown by over 3% per year on average. The UK has a favourable record on new jobs created. Even in 1998, a year of cyclical economic slowdown, employment grew by 1.2%, bringing unemployment down to a twenty year low. Most new jobs are concentrated in the service sector—manufacturing employment is contracting. UNITED STATES— A MODEL TO FOLLOW? Unemployment in the United States has been falling continuously for the last seven years and the economy is speeding ahead towards full-employment. Underlying this success has been the sustained expansion of US non-farm payroll employment. The chart opposite shows this process. In 1996, total employment averaged 119.6 million. This year the total is expected to reach 128.4 million. Leading the way is the booming US construction sector, with employment up by an average of 5% in each of the last three years. Nearly 900,000 extra people have found work in this industry since 1996. THE STRUCTURE OF OUTPUT IN AN ECONOMY As an economy grows and reaches new stages of development, so the share of national output from each of the main production sectors changes. The standard hypothesis is that the long road to economic maturity brings a switch from manufacturing and construction towards service industries in the tertiary and quaternary sectors. Partly this is because the income elasticity of demand for services is higher than for primary and manufactured products. As average living standards grow, the pattern of consumer demand tilts away from goods towards

Unit 3 Managing the economy Steve Margetts
Page 80
services. Increased government spending on services (such as education and health) adds to this process. Because comparative advantage between countries changes over time, we expect to see nations switching their resources to industries where they can exploit a new advantage. In Britain’s case, it is widely held that financial services is a sector where we hold a significant advantage over other nations. However the rate at which this structural transformation takes place must vary from country to country. Even within the so-called advanced economies that make up the OECD¸ there are wide differences in the contributions to output from each industry. Consider the Group of Seven nations (whose data is shown in the table below). Most of these nations derive over two-thirds of their output from services and the relative size of the primary sector (which includes agriculture, forestry, fishing and other extraction industries) has become very small. But Germany and Japan still retain significantly large industrial bases. The speed of de-industrialisation has been slower in these two countries contrasted with the USA and the UK.
On a global scale, those countries still reliant on primary production as a key contributor to national income remain well down the world league for living standards.
BALANCE OF PAYMENTS The balance of payments is a record of all the financial dealings of the UK with the rest of the world. It can be split into two components: • The current account • The capital account Our trading performance with other countries has a big effect on prospects for the British economy. Over recent years we have tended to import more goods and services than we have exported. This is shown in the chart below which tracks the quarterly value of exports and imports since the mid 1980s.

Unit 3 Managing the economy Steve Margetts
Page 81
THE CURRENT ACCOUNT The current account is split into two sections itself: • Visible trade • Invisible trade TRADE IN GOODS (VISIBLE TRADE) Trade in goods includes:
• Manufactured goods • Semi-finished • Components • Energy products • Raw materials • Consumer and capital goods
The table overleaf shows the annual deficit in UK trade in goods with other countries since 1995
The economy has run a trade deficit since 1983 with the gap widening considerably because of the excessive economic growth in the mid-late 1980s. The deficit shrunk in the early 1990s recession and during 3-4 years of exchange rate weakness between 1993-96. However the trade gap has widened again in 1998-99. This is due to the slowdown in export volumes caused by recession in other leading economies and the lagged effects of a sustained appreciation in the exchange rate over the last three years.

Unit 3 Managing the economy Steve Margetts
Page 82
TRADE IN SERVICES (INVISABLE TRADE) Trade in services includes:
• Financial services, e.g., banking and insurance • Transport services, e.g., shipping and air travel • Tourism • Transfers resulting from the loan of factors of production abroad, e.g.,
interest received on a loan of capital to an American firm and a civil engineer working in Brazil on a construction project
The long-term growth and development of service sector industries is reflected in an improving trade balance for Britain with the rest of the world. This is shown in the chart below. The UK has now over-taken France and Germany to become the second biggest service exporter in the global economy.
Is this where our comparative advantage now lies? The surplus in net exports of services has been on an up-ward path since the downturn of the early 1990s as the chart makes clear. In 1997 the surplus reached nearly £12 billion and in 1998 this grew to over £13 billion.

Unit 3 Managing the economy Steve Margetts
Page 83
Not every service industry makes a net surplus in trade. The UK's main money earner is in business and financial services. Travel and tourism has been in deficit in recent years. THE CURRENT ACCOUNT FOR THE UK After recording small surpluses in the early 1980s, the UK balance of payments deteriorated badly in the late 1980s following the consumption driven economic boom. Recent years has seen a clear improvement in the figures although 1999 is forecast to see a return to deficit.
Often the root cause of a current account deficit is cyclical. During a boom the demand for imported goods and services rises strongly and if exports cannot keep pace the trade figures move into the red. The economic recession of the early 1990s caused the current account deficit to shrink. Then a boom in exports in 1994-96 lead to small quarterly surpluses in the bop accounts. The UK has enjoyed current account surpluses in five of the last seven quarters. This is despite a worsening of the balance of trade in goods. The main reason for the improvement in the figures is the growing surplus in trade in services and very strong net investment income from overseas assets. If the deficit is symptomatic of a lack of competitiveness in those sectors of the economy exposed to international trade, then specific policy measures may be required to help correct the deficit. In the UK's case, some economists believe that there is a structural problem in trade in goods - with the economy failing to export enough products to pay for the imports that we require. If a country has open capital markets where money can flow into and out of an economy with ease, it should not be a problem to attract the capital inflows needed to finance a balance of payments deficit on the current account. However, in the long-term if imports are increasingly taking over from domestic producers, this threatens economic growth, employment and living standards in the deficit country.

Unit 3 Managing the economy Steve Margetts
Page 84
THE CAPITAL ACCOUNT To aid simplicity it can be split into two:
• Short term money flows • Long term money flows
SHORT TERM MONEY FLOWS Sometimes we describe this money as hot money or speculative money. Money is moved from country to country in the hope of making a profit, whether it is from higher interest rates in one country or because changes in the exchange rate are expected. LONG TERM MONEY FLOWS These are mainly associated with long term savings and investment. Foreign companies may choose to invest in the UK by building a new factory or widening its share portfolio by investing in the London Stock Exchange. THE BALANCE OF PAYMENTS MUST BALANCE If the UK is experiencing a current account deficit, then we have to find the money from somewhere to pay for it. We could borrow money from abroad to pay for it, run down our savings from abroad or sell some of the gold and foreign currency reserves. CAN A COUNTRY SAFELY IGNORE A PERSISTENT CURRENT ACCOUNT DEFICIT? The answer depends in part on what is causing the net outflow of money from the economy.
• A current account deficit has to be financed. This is normally done by attracting inflows of capital from other economies. The UK has found few problems in achieving this in recent years.
• If the deficit is due to excessive consumer demand – a recession or slowdown should help to reduce the problem. Consumers cannot go on spending in excess of their income for ever. Eventually they have to control their spending and start saving again to improve their own finances.
CONFLICTS BETWEEN MACRO ECONOMIC OBJECTIVES Unfortunately, it is virtually impossible for a government to score in all the macro economic goals at once. We shall begin with the three major conflicts and then look at two more that are linked to microeconomics. 1. Low unemployment (or full employment) and low inflation This is the classic conflict in economic theory. In fact, an economist called Phillips constructed a curve using empirical data to show that this conflict existed (although this did not mean that the relationship would hold forever).

Unit 3 Managing the economy Steve Margetts
Page 85
O
P (%).
U (%)
aP1
.
U1
bP2
.
U2
A Phillips curveA Phillips curve
These two variables have, in theory, an inverse relationship. If a government tries to reduce unemployment through reflationary measures, such as lower interest rates or increased public spending, then the resulting reduction in unemployment will push wages, and then prices, higher. On the other hand, when the government tries to control high inflation with higher interest rates and reduced spending, the resulting reduced consumer spending and lower investment will result in job losses. Norman Lamont, Conservative Chancellor of the early 90s, famously said '…unemployment is the price worth paying for lower inflation.'
2. Healthy growth and low inflation If an economy grows too quickly, especially if it is due to excessive consumer spending as it tends to be in the UK, then demand will outstrip supply and prices will rise. Equally, the steps taken to keep inflation low, like relatively high interest rates, can often restrict growth via reduced consumer spending and investment. It is difficult to achieve both aims.

Unit 3 Managing the economy Steve Margetts
Page 86
The 'trend' rate of growth is seen as the rate of growth an economy can grow without igniting inflation. Most economists believe that this is around 2½% to 3% at the moment. For the last six years the UK has managed to walk this tightrope without slipping into either higher inflation or recession. Perhaps the economic cycle has been eliminated, but most economists find this difficult to believe. 3. Healthy growth and a Balance of Payments equilibrium When an economy is growing quickly, consumer spending tends to be high. As we have already noted, British consumers tend to buy goods from abroad in preference to home produced goods. Hence, import growth picks up relative to exports, assuming an average growth rate in the countries that buy British goods, leading to a worsening trade deficit. In the old days when the Balance of Payments was seen as possibly the most important macroeconomic objective, either the exchange rate would give, or import controls were used (not possible these days with the World Trade Organisation), or the government had to deflate the economy, implying a low rate of growth.
4. Healthy growth and the environment Of course, not everyone would consider the environment a 'minor' objective, but unfortunately governments have not quite woken up to the problem yet. Although there have been summits at which controls on various types of pollution were agreed, the US amongst others seem to find it difficult to keep their promises. Quite simply, the faster the rate of growth, the higher the level of production, and so the level of pollution from factories, cars, etc. rises. Also, vital rain forests tend to disappear, not just because we consume the wood; new factories, towns and housing are built on the resulting land. 5. Healthy growth and equality Equality was an objective of socialist governments and so is now obsolete in the world of 'new' Labour. Although it is true to say that forcing equality throughout a country can lead to inefficiencies (where are the incentives?), those on the left wing feel that it is an admirable and important aim. Ronald Reagan used to talk about the 'trickle down' effect. As an economy grows the

Unit 3 Managing the economy Steve Margetts
Page 87
poor may well get a smaller slice of the cake, but the cake gets so large that the poor man still gets more cake. Of course this does overlook the fact that the rich man is getting a larger slice of a bigger cake. The developed world has grown hugely since the Second World War, but even with the creation of welfare states it is the wealth creators that have benefited hugely whilst those at the bottom of the pile have seen their standard of living just plod along. The communist Soviet Union kept the more equality conscious socialist model going right into the 80s, but its inefficiencies meant that the rate of growth was much slower. Now even they have embraced capitalism, although the transition has not exactly been smooth!
DEMAND MANAGEMENT OR SUPPLY SIDE? This is the main area of debate between Keynesian and Monetarist economists. DEMAND MANAGEMENT Keynesians believe that governments should manage the level of aggregate demand in order to remove inflationary and deflationary gaps as well as smooth out the effects of cyclical fluctuations in national income. Monetarists feel that governments shouldn’t engage in such policies. They claim such policies will at best be ineffective and at worst actually be de-stabilising. Both Conservative and Labour governments pursued a policy of demand management throughout the 1960s and 1970s until stagflation gripped the UK economy. Thatcher opted for Monetarist supply side policies which set the tone for UK economic policy through the 1980s and 1990s. SUPPLY SIDE Supply side policies aim to shift both the SRAS and LRAS to the right, which will lead to a reduction in the price level and an increase in national income. This will lead to a reduction in unemployment, shifting the Phillips Curve inwards. Monetarists state that supply side policies should be used to free up the market and reduce the amount of government intervention, e.g., deregulation, provide incentives and encourage private enterprise. Keynesians also believe in supply side policies, but of a more interventionalist nature, e.g., training schemes and regional grants. “THIRD WAY” SUPPLY SIDE POLICIES The election of the labour government has brought about a third way, a mixture of Monetarist and Keynesian supply side policies.

Unit 3 Managing the economy Steve Margetts
Page 88
INDEX
Accelerator 21 Enterprise 2 Aggregate Demand (Ad) 2 Equilibrium Between Aggregate
Demand And Aggregate Supply 9
Aggregate Supply 4 Exchange Rates 29 Average Propensity To Consume
12 Exports And Imports 29
Average Propensity To Save 12 Foreign Direct Investment 23 Balance Of Payments 80 Frictional Unemployment 54 Business Confidence 11 Friedman's Permanent Income
Hypothesis 16
Capital 2 Full Employment 61 Capital Account 84 Demand Management 87 Capital Base 23 Demand Management Or Supply
Side? 87
Causes Of Inflation 37 Demand Pull Inflation 37 Causes Of Unemployment 53 Disincentive Effects 68 Changing Pattern Of Employment
59 Economic Costs Of Unemployment
51
Circular Flow Of Income 2 Economic Cycle 74 Conflicts Between Macro Economic Objectives
84 Economic Growth 71
Consumer Confidence 14 Enterprise 2 Consumption And Savings 11 Equilibrium Between Aggregate
Demand And Aggregate Supply 9
Consumption Function 13 Exchange Rates 29 Cost Push Inflation 39 Exports And Imports 29 Costs Of Inflation 41 Foreign Direct Investment 23 Current Account 81 Frictional Unemployment 54 Deflation 48 Government Borrowing 26 Demand Deficient Unemployment
54 Government Spending 25
Accelerator 21 Gross Domestic Fixed Capital Formation
2
Aggregate Demand (Ad) 2 Gross Domestic Product (Gdp 72 Aggregate Supply 4 Gross Investment 17 Average Propensity To Consume
12 Gross National Product (Gnp 72
Average Propensity To Save 12 Hidden Unemployment 55 Demand Management 87 Human Capital 52 Demand Management Or Supply Side?
87 Incomes Policies 45
Demand Pull Inflation 37 Inflation 34 Disincentive Effects 68 Inflation Targets 47 Economic Costs Of Unemployment
51 Inflationary Gaps 40
Economic Cycle 74 Injections 2 Economic Growth 71 Interest 2

Unit 3 Managing the economy Steve Margetts
Page 89
International Competitiveness
3 Psncr 26
Investment 17 Real Money Balances Effect 3 Invisable Trade 82 Real Wage Unemployment 53 Inward Investment 24 Regional Economic Problem 24 J Curve Effect 30 Regional Multiplier 24 Job Vacancies 68 Rent 2 Keynesian 87 Research And Development 22 Labour 2 Retail Price Index (Rpi) 34 Land 2 Rpiy Inflation 36 Long Run Aggregate Supply 5 Savings Function 13 Long Term Unemployment 69 Savings Ratio 13 Marginal Efficiency Of Investment
19 Seasonal Adjustment 51
Marginal Propensity To Consume
12 Short Run Aggregate Supply Curve
4
Marginal Propensity To Save 12 Spare Capacity 8 Marshall-Lerner Condition 30 Structural Unemployment 54 Measuring Unemployment 50 Supply Side 87 Monetarist 87 Supply Side Policies 5 Monetary Inflation 44 The Claimant Count 50 Nairu 65 The Labour Force Survey 50 National Debt 28 Theories Of Economic Growth 76 Natural Rate Of Unemployment
63 Third Way Supply Side Policies 87
Net Investment 17 Underlying Inflation (Rpix) 35 New Deal 70 Unemployment 50 Objectives Of Government Macroeconomic Policy
31 Unit Labour Costs 42
Permanent Income Hypothesis
16 Visable Trade 81
Phillips Curve 84 Wages 2 Policies To Reduce Unemployment
55 Wealth 15
Profit 2 Withdrawals 2


