Embed Size (px)
Citation preview

DRAG REDUCTION OF A RECTANGULAR PRISM THROUGH
MOMENTUM INJECTION
by
ANDREW DOBRIC
B.A.Sc., University of British Columbia, 1990
A THESIS SUBMITTED IN PARTIAL FULFILMENT OF
THE REQUIREMENTS FOR THE DEGREE OF
MASTER OF APPLIED SCIENCE
in
THE FACULTY OF GRADUATE STUDIES
Department of Mechanical Engineering
We accept this thesis as conforming
to the required standard
THE UNIVERSITY OF BRITISH COLUMBIA
August 1992
© Andrew Dobric, 1992

In presenting this thesis in partial fulfilment of the requirements for an advanced
degree at the University of British Columbia, I agree that the Library shall make it
freely available for reference and study. I further agree that permission for extensive
copying of this thesis for scholarly purposes may be granted by the head of my
department or by his or her representatives. It is understood that copying or
publication of this thesis for financial gain shall not be allowed without my written
permission.
(Signature)
Department of Mechanical Engineering
The University of British ColumbiaVancouver, Canada
Date September 2, 1992
DE-6 (2/88)

11
ABSTRACT
Drag of a two-dimensional rectangular prism in the presence of momentum
injection is studied experimentally. Moving Surface Boundary-Layer Control
(MSBC), achieved here through a pair of rotating cylinders serving as momentum
injection elements, was investigated to assess the effect of:
(i) tangential velocity (Uc ) of the cylinder surface with respect to the
free stream wind velocity (U);
(ii) angle of attack (a) of the prism surface with respect to the free
stream;
(iii) roughness of the cylinder surface.
As the wake-body interaction is an important aspect of the associated
aerodynamics, frequency of the shedding vortices, as reflected in the Strouhal
number, was also monitored. Results suggest that, under optimum combinations
of the system parameters, a drag reduction of around 70% can be realized. The
study has considerable implication to the drag reduction of road vehicles,
particularly the tractor-trailer truck configurations.

111
TABLE OF CONTENTS
ABSTRACT ii
TABLE OF CONTENTS iii
LIST OF FIGURES v
LIST OF TABLES ix
NOMENCLATURE x
ACKNOWLEDGEMENT xii
1 INTRODUCTION 1
1.1 Background 1
1.2 A Brief Review of the Relevant Literature 1
1.3 Scope of the Present Investigation 5
2 MODEL AND TEST PROCEDURES 8
2.1 Model and Support Arrangement 8
2.2 Wind Tunnel 10
2.3 Test-Model Configurations 10
2.4 Test Procedures 12
2.5 Flow Visualization 14
2.6 Data Analysis 16

iv
3 RESULTS AND DISCUSSION 17
3.1 Cylinders at Leading Edges 17
3.1.1 Drag 18
3.1.2 Lift 35
3.1.3 Surface pressure and the Strouhal number 37
3.2 Cylinders at Top Edges 64
3.2.1 Drag 65
3.2.2 Lift 80
3.2.3 Surface pressure and the Strouhal number 81
3.3 Flow Visualization 100
4 CONCLUDING REMARKS 103
4.1 Summary of Results 103
4.2 Recommendations for Future Work 104
REFERENCES 106
APPENDIX A: TYPICAL LIFT RESULTS 110
APPENDIX B: ADDITIONAL PRESSURE DISTRIBUTION DATA . . 115

V
LIST OF FIGURES
Figure page
1-1 Schematic diagrams explaining the pressure drag and vortexshedding frequency
1-2 Configurations investigated in the wind tunnel test-program 7
2-1 A photograph showing the experimental set-up during the windtunnel tests 9
2-2 A schematic diagram showing the model dimensions (1, length; d,diameter; h, height) and distribution of the pressure taps 11
2-3 A schematic diagram of the closed circuit water channel facility usedin the flow visualization study. The dimensions are in mm 15
3-1 A schematic diagram showing rotating cylinders as momentuminjection units located at leading edges of the two-dimensional prism.Note the cylinders rotate in the opposite sense 18
3-2 Reference drag coefficient as affected by the angle of attack inabsence of the MSBC with smooth cylinders 19
3-3 Variation of the drag coefficient with the angle of attack as affectedby the momentum injection through the rotation of the smoothcylinders. Uc2 /U is changed systematically with Uel /U held fixedat:
a) Uci /U 0; 21b) Uci /U = 1; 22c) UC1 /IJ = 1.5; 23d) Uci /U = 2 24
3-4 Plots summarizing the effect of momentum injection with smoothcylinders on the variation of CD with a 28
3-5 Reference drag coefficient as affected by the angle of attack inabsence of the MSBC with rough cylinders 30

vi
3-6 Variation of the drag coefficient with the angle of attack as affectedby the momentum injection through the rotation of the roughcylinders. Uc2 /U is changed systematically with Ucl /U held fixedat:
Uci = (); 31b) Uci /U 1; 32c) Ucl /U = 1.5; 33d) /U = 2. 34
3-7 Plots summarizing the effect of momentum injection with roughcylinders on the variation of CD with a 36
3-8 Surface pressure distribution as affected by the momentum injectionUc2 /LT with Ucl /U held fixed at 0:
a) a = 0'; 39b) a = 5'; 40c) a = 10'; 41d) a = 15'; 42e) a = 20'; 43f) a = 30'; 44g) a = 40'; 45h) a = 45° 46
3-9 Surface pressure distribution as affected by the momentum injectionUc2 /U with Uel /U held fixed at 2:
a) cc = 0°, 49b) cc = 5'; 50c) a = 10'; 51d) a = 15'; 52e) a = 20'; 53f) a = 30°; 54g) oc = 40'; 55h) oc = 45° 56
3-10 Variation of the Strouhal Number with the angle of attack asaffected by the momentum injection:
a) Uci /U = 0; 59b) Uci /LT = 1; 60c) UCi 2. 61
3-11 Effect of momentum injection on the Strouhal number at a = 0 0 -45° 62

vii
3-12 A schematic diagram showing rotating cylinders as momentuminjection units located at the top edges of the two-dimensional prism.Note the cylinders rotate in the same sense 64
3-13 Reference drag coefficient as affected by the angle of attack inabsence of the MSBC with smooth cylinders 66
3-14 Variation of the drag coefficient with the angle of attack as affectedby the momentum injection through the rotation of the smoothcylinders. Uc2 /U is changed systematically with Uci /U held fixedat:
a) Ucl /U = 0; 67b) Uci = 1; 68c) Ucl /U = 1.5; 69d) Uci /U = 2. 70
3-15 Plots summarizing the effect of momentum injection with smoothcylinders on the variation of CD with a 72
3-16 Reference drag coefficient as affected by the angle of attack inabsence of the MSBC with rough cylinders 73
3-17 Variation of the drag coefficient with the angle of attack as affectedby the momentum injection through the rotation of the roughcylinders. Uc2 /U is changed systematically with Ucl /U held fixedat:
a) Ucl /I1 = 0; 74b) Uci /U = 1; 75c) Ucl /U = 1.5; 76d) Uci /U = 2. 77
3-18 Plots summarizing the effect of momentum injection with roughcylinders on the variation of CD with a 79
3-19 Surface pressure distribution as affected by the momentum injectionUc2 /IJ with Ucl /U held fixed at 0:
a) cc = 60'; 82b) a = 75'; 83c) a = 90'; 84d) a = 105°; 85e) a = 120°. 86

viii
3-20 Surface pressure distribution as affected by the momentum injectionUc2 /U with Ucl /U held fixed at 2:
a) a = 60'; 89b) a = 75'; 90c) = 90'; 91d) a = 105°; 92e) a = 120°. 93
3-21 Variation of the Strouhal Number with the angle of attack asaffected by the momentum injection:
a) Uci /U = 0; 96b) Uci /U = 1; 97c ) UCi 2- 98
3-22 Effect of momentum injection on the Strouhal number at a = 60° -120° 99
3-23 Typical flow visualization photographs for a rectangular prism, witha smooth surface cylinder for a = 30° 101
3-24 Typical flow visualization photographs for a rectangular prism, witha smooth surface cylinder for a = 90° 102

LIST OF TABLES
Table page
3-1 Reference drag coefficient corresponding to a = U c / U = 0 (smooth
cylinders) 27
3-2 Drag coefficient as affected by the surface roughness (a = 0°) 37
3-3 Variation of the Strouhal number with the angle of attack and
Uc / U (0° < a < 45°) 63
3-4 Effect of the surface roughness on the drag coefficient (a = 90°) 80
3-5 Effect of the angle of attack and momentum injection on the Strouhal
number (60° < a < 120°) 95
ix

NOMENCLATURE
CD coefficient of drag; D / (1/2)pU2dh
CL coefficient of lift; L / ( 1/2)pU2dh
Cp coefficient of pressure; (p - p.) / (p o - poo )
Cpo coefficient of pressure at tap n; (po - p> ) / (po - p.)
D drag force
L lift force
U free stream velocity
Uc surface velocity of the rotating cylinder
UC1 , UC2 surface velocities of rotating cylinders 1 and 2, respectively
Re Reynolds number, Ud / v
St Strouhal number, fdo / U
ac alternating current
d width along cylinder surface edge, Figure 2-2
do projected width normal to the flow, varies with a, Figure 1-2
f pressure fluctuation frequency
h span of the model, Figure 2-2
1 length along the side surface, Figure 2-2
n pressure tap number
Pb base pressure

frontal pressure
pressure at tap n
stagnation pressure
reference pressure far upstream of the model
distance along circumference of the body
angle of attack
air viscosity
air density
angular velocity of the rotating cylinder
angular velocities of cylinders 1 and 2, respectively
xi

xii
ACKNOWLEDGEMENT
Special thanks is extended to my supervisor, Dr. V.J. Modi, for his time and
guidance throughout this project, whose insight has made this project a
thoroughly enjoyable experience.
The assistance of Mr. Ed Abell, Senior Technician, Oliver B. Ying, and
Simon St. Hill, with the installation of the instrumentation, is gratefully
appreciated.
The investigation reported here was supported by the Science Council of
British Columbia, Grant No. 5-53762, and The Natural Sciences and Engineering
Research Council of Canada, Grant No. A-2181.

1
1 INTRODUCTION
1.1 Background
Ever since the OPEC crisis of the early 1970's, the world is beset by a
growing concern for energy conservation. The rapidly shrinking petroleum
reserves and fast disappearing rain forests make the efficient utilization of energy
one of the most pressing issues of our time. Over the years, there has been a
growing interest in increasing the lift and decreasing the drag through the control
of the boundary-layer associated with the streamline as well as bluff bodies. This,
in turn, has reflected on the vortex shedding and wake characteristics of the body.
Introduction of the Moving Surface Boundary-layer Control (MSBC) represents
one approach to minimize drag thus contributing to the efficient use of the natural
resources.
1.2 A Brief Review of the Relevant Literature
Ever since Prandtl's introduction of the boundary-layer concept, there has
been concerted effort aimed at reducing its adverse effects. Methods including
suction, blowing, vortex generators, etc. have been researched at length and
applied in practice with some degree of success. Much of the literature on these

2
topics has been reviewed by Goldstein 1 , Lachmann 2, Rosenhead 3 ,
Schlichting 4, Chang 5 , and others. However, the use of Moving Surface
Boundary-layer Control (MSBC) has received less attention, relatively speaking.
The main goal is to delay, or even prevent, separation of the boundary-layer
from the body. A moving surface accomplishes this by:
- retarding the growth of the boundary-layer through reduction of
relative motion between the surface and the free stream;
- injecting momentum into the boundary-layer.
A practical application of the boundary-layer control has been demonstrated
by Alvarez-Calderon and Arnold 6, who carried out tests on a rotating cylinder
flap to develop a high-lift airfoil for STOL-type aircraft. The system was
successfully tested in flight on a high-wing research aircraft. Also, North
American Rockwell designed the OV-10A aircraft which was flight tested at
NASA's Ames Research Center 7 ' 8 ' 9. Cylinders, located at the leading edges
of the flaps, were rotated at high speed with the flaps in the lowered position, to
study the landing characteristics.
For understanding of the parameters affecting the boundary-layer control
process, Tennant et al. 10, 11 conducted tests with a wedge-shape flap having
a rotating cylinder at the leading edge. Flap deflection was limited to 15°, and
effect of the gap-size between the cylinder and the flap surface investigated.
However, the ratio of the cylinder's surface velocity with respect to the free stream
velocity was limited to 1.2.

3
Through a comprehensive wind tunnel test-program involving a variety of
airfoils with one or more cylinders forming the moving surfaces, along with the
surface singularity numerical approach and flow visualization studies, Modi et
12, 13, 14, 15al. and Mokhtarian 16 have shown the concept to be
remarkably effective. Results indicated an increase in the maximum lift
coefficient by at least 200% and a delayed stall angle to 48°.
The basic concepts involved in the pressure drag reduction are indicated in
Figure 1-1. Shown is a bluff body, a two dimensional prism, located in a free
stream at zero angle of attack. Here, p f and Pb are the pressures on the front and
rear surfaces, respectively. By increasing the base pressure, p h , or decreasing the
frontal pressure, pf , one can reduce the pressure drag of the body. Reduction of
the bluff body drag has been investigated by Modi et al. 17, 18, 19, 20 and
Ying 21 using the momentum injection through MSBC. Ying has also reviewed
the associated literature at considerable length.
Another relevant aspect of the bluff body aerodynamics and associated
dynamics is its potential for vibration when exposed to a fluid stream. A common
example is that of transmission lines humming in a breeze. Vortex resonance,
galloping, flutter and buffeting are some examples of such fluid-structure
interaction instabilities. A vast body of literature exists in the area including the
contributions by Blevins 22, Den Hartog 23, Vickery and Watkins 24, and
many others. Cermak 25 and Welt 26 have provided excellent overviews of
contributions in this area. Of course, the end objective would be to suppress, or

, 1.........1110.
1 ■110-
..■100. Bluff Body
.........1110.-.......
Drag
Figure 1-1 Schematic diagrams explaining the pressure drag and vortex shedding frequency.
14

5
at least minimize, the resulting oscillations. Zdravkovich 27, 28 , Wongong 29 ,
Kubo et al. 30 , and others have reviewed this literature quite effectively.
A circular cylinder best demonstrates the phenomenon of shedding vortices,
and the associated Strouhal number, observed with bluff bodies. The Strouhal
number (St) is the ratio of the vortex shedding frequency (f) and the exposed
diameter of the body (do ) to the free stream velocity of the fluid (U). A classical
paper of particular interest is that by Fage and Johansen 31 where the flow
behind an inclined flat plate is investigated, including the aerodynamics and
frequency of shed vortices. The suppression of these shedding vortices with the
use of moving surface boundary-layer control has been investigated by Kubo et
al. 32, 33.
1.3 Scope of the Present Investigation
The present study builds on this background and investigates application
of the Moving Surface Boundary-layer Control (MSBC) to a two-dimensional
rectangular prism. An organized wind tunnel test-program explores the effect of
MSBC on:
(i) the lift and drag forces;
(ii) the surface pressures; and
(iii) the vortex shedding frequency;
associated with the prism. A diagram of the different configurations investigated

6
is presented in Figure 1-2. The important parameters used during the MSBC
study are the angle of attack (a) of the model with respect to the free stream wind
direction; the cylinder surface roughness; and the ratio of the cylinder's surface
velocity (Uc ) to the free stream wind velocity (U). This ratio (U c /U) and the
angle of attack were systematically varied during the experiments for two cylinder
surface roughness conditions. A flow visualization study compliments the wind
tunnel test-data.

60 °< u< 120 °
-45 0< ot< 45 °
Figure 1-2 Configurations investigated in the wind tunnel test-program.

8
2 MODEL AND TEST PROCEDURES
2.1 Model and Support Arrangement
The model used in the present test-program is a modified version of that
employed in the previous work 21 investigating the flow around bluff bodies.
Figure 2-1 shows the model, supported by the strain-gauge balance, during a
typical wind tunnel test. The rotating cylinders were integrated into a
rectangular Plexiglas prism with, approximately, a 2 mm gap between the cylinder
and the body. The surface of the cylinders was flush mounted with the body
surface to prevent abrupt pressure gradients. End-plates were provided at the top
and bottom of the prism model to minimize edge effects, thus promoting the two-
dimensional flow condition.
The 25 4 mm diameter rotating drill-rod cylinders were connected by sewing
machine belt drives to high speed variac controlled 1/8 hp ac motors. The angular
velocity (w) of the cylinders was measured with a hand-held tachometer (Shimpo),
thus providing the surface velocity Uc .
The rectangular prism, with the attached cylinders and motors, was
suspended via two perpendicular flexible steel plates and a nylon bushing from
an aluminum frame The whole system can be rotated on the bushing in the
horizontal plane to alter the angle of attack of the model. Strain gauges were

Figure 2-1 A photograph showing the experimental set-up during thewind tunnel tests.

10
attached to each flexible steel plate to measure the deflection of the prism in two
normal directions.
2.2 Wind Tunnel
The wind tunnel used in the experiments was a suction-type with a
maximum speed of 50 m/s. The tunnel speed can be adjusted by a Variac
transformer and was measured using a pitot static tube, placed at the contraction
section of the tunnel and connected to an inclined alcohol manometer. The motor
and fan are positioned downstream of the test-section. Upstream of the test-
section is a contraction-section with a ratio of 10:1. The entrance to the wind
tunnel is provided with a series of honeycomb and wire screen panels to promote
uniformity of the velocity profile and reduce turbulence. The peak turbulence
intensity in the test-section was around 0.5%. The square test-section, 45 x 45
cm, has Plexiglas window inserts for easy viewing of the model.
2.3 Test-Model Configurations
Variations in the experimental set-up ranged from the two rotating
cylinders at the leading edges of the rectangular cross-section prism, with the
cylinders rotating in opposite directions, to the cylinders at the upper edges of the
body, with the cylinders rotating in the same direction (Figure 2-2). They

I = 100 mm
•
+S
Tap #1 -0.0332 -.0163 0.0004 0.0165 0.0336 0.1997 0.2248 0.2479 0.27410 0.30011 0.32412 0.35013 0.45014 -F. 0.50015 -0.45016 -0.35017 -0.32418 -0.30019 -0.27420 -0.24721 -0.22422 -0.199
54
32
1
Cl
C222 21 20 19 18 17 16
7 8 9 10 11 12
13
14'
15
d =
89.5 mm
h = 420 mm
Figure 2-2 A schematic diagram showing model dimensions (1, length; d, diameter; h, height) and distribution ofthe pressure taps.

12
provided the basis for studying the effects of momentum injection under different
orientations of the model. The angle of attack (a), with respect to the free stream
wind velocity, was changed in 5-degree increments from 0° to 25°, followed by
tests at 30°,40°, and 45° for the leading edge cylinder configuration. For the top
edge cylinder arrangement, the angle of attack was varied from 75° to 105° in the
same 5° increments as before, and in 15° increments in the 60° — 120° range.
In each case, the speed of the cylinders was independently varied to study
its influence on the drag, lift, pressure distribution, and Strouhal number. In
general, it was anticipated that higher cylinder rotation speeds would lead to
lower drag values up to a limit. There may also be some optimal combinations of
the cylinder speeds which may minimize the drag.
To begin with, the lift and drag measurements were carried out with
cylinders having a smooth surface. This was followed by tests with rough surface
cylinders. The surface roughness was characterized by eight, 2 mm deep, equally
spaced, triangular grooves in the direction parallel to the axis of the cylinders.
The vortex shedding frequency study also used the smooth and rough cylinder
configurations, however, the latter resulted in the higher Strouhal Number values.
2.4 Test Procedures
The test procedures involved are rather conventional and straightforward.
For the drag and lift measurements, bridge amplifier meters and digital

13
voltmeters were utilised, while for the pressure data, a Scanivalve and a personal
computer were the main data acquisition and processing tools.
At the beginning of the drag/lift experiments, the bridge amplifiers needed
warm-up before use. Under the no-load condition of the model, when the strain
gauges are not influenced by any bending forces, the bridge amplifiers were
adjusted so as to provide zero readings on the voltmeters to serve as a reference.
A simple loading device was then attached to the sides of the wind tunnel in
preparation for the strain gauge transducer calibration. This involved the use of
a light-weight string, connected to the midsection of the model, which was placed
over a sheave bearing on the calibration apparatus. Weights were attached to the
string providing a known force in one direction and the corresponding voltage
recorded. The procedure was repeated for the other strain gauge transducer upon
rotation of the model by 90°, thus providing calibration for the forces measured
in two orthogonal directions.
Now, the wind tunnel was turned on and the power adjusted to a desired
speed for the tests. The cylinder angular velocity was set using the tachometer.
The tunnel's free stream velocity was adjusted to remain constant, thus
maintaining a desired Reynolds number (Re) irrespective of a and U c / U. The
output voltages of the two transducers were read, followed by an analysis of the
data to give drag and lift coefficients.
For the pressure measurements, the taps, located at the mid span of the
model, were connected to a Scanivalve pressure transducer (pressure transducer

14
#PDCR23D-lpsid and signal conditioner #SCSG2±5V/VG), which provided an
analog signal proportional to the measured pressure. It may be emphasized that
changes in cylinder speed and angle of attack influence the free stream velocity
due to blockage effects. In the present study, the wind speed was held constant
irrespective of the model condition to facilitate comparison at a fixed free stream
Reynolds number.
2.5 Flow Visualization
The wind tunnel test results were complemented by an extensive flow
visualization study carried out in the laboratory of Professor T. Yokomizo at the
Kanto Gakuin University, Yokohama, Japan. The design of the models was
supplied to Professor Yokomizo and the models were constructed in his machine
shop. The tests were carried out by Dr. Yokomizo, Dr. Modi and two
undergraduate research assistants.
The flow visualization study was carried out using a closed-circuit water
channel facility. The models were constructed from Plexiglas and fitted with twin,
hollow, smooth surface cylinders driven by compressed-air motors. A suspension
of fine polyvinyl chloride powder was used as a tracer in conjunction with slit
lighting to visualize streak lines. Both the angle of attack and the cylinder speed
were systematically changed, and still photographs as well as videos were taken.
Figure 2-3 shows a schematic diagram of the test arrangement.

SHEET LIGHT
MODEL
HONEYCOMB
CDLt)
z
MIRROR SOURCE OF LIGHT SLIT
\
500 130 2630
Figure 2-3 A schematic diagram of the closed circuit water channel facility used in the flow visualization study.The dimensions are in mm.
IP
CDC\JCr)
PI

16
2.6 Data Analysis
Signals from the two force transducers were sent to a pair of bridge
amplifiers and displayed on two voltmeters. The voltage measured was directly
proportional to the model deflection. The relationship between the voltage and the
force was found to be linear.
With the addition of a personal computer, frequency analysis was possible
through monitoring of the pressure fluctuations at the surface of the model. The
pressure taps, distributed around the mid-section of the body, along with a
reference static pressure tap, were connected to a Scanivalve. The pressure signal
(voltage) was read into the computer through the use of an analog-to-digital card
and was stored for further analysis. Each sample consisted of five seconds of 100
Hz information, read by the computer using a data acquisition program developed
by Seto 34. Preliminary calculations suggested the sample frequency of 100 Hz
to be adequate for the intended information.
With reference to the stored information, a program was written to
determine the mean value of the pressure measured at each tap. The coefficient
of pressure at tap n (Cpn , n = 1 to 22) is based on the pressure at tap n (pa)
compared to the ambient pressure (R.) and the dynamic pressure ( 1/2pU2 ),
P„ Pm P„ PmC - Pn1 /I —PI—p U2
2

17
3 RESULTS AND DISCUSSION
During the entire experimental program, the wind speed was maintained
at approximately 5 m/s (corresponding to Re -., 40,000). The wind tunnel's Variac
controlled motor was adjusted to maintain a constant free stream dynamic
pressure as pointed out before, while the cylinder's rotational speed held fixed, to
offset any blockage and drag reduction effects on the upstream flow.
3.1 Cylinders at Leading Edges
The experimental set-up where the rotating cylinders are placed on the
prism face exposed to the free stream is shown in Figure 3-1. It indicates
positions of the two cylinders and their respective rotation directions, as well as
reference for the pressure tap position, s, along the perimeter. Here the angle of
attack ranges from -25° to 25° for the force measurements and from 0° to 45° in
the frequency study.

Figure 3-1 A schematic diagram showing rotating cylinders as momentuminjection units located at leading edges of the two-dimensionalprism. Note the cylinders rotate in the opposite sense.
3.1.1 Drag
Smooth Cylinders
To begin with, the drag results were obtained with the cylinders held
stationary providing the case which serves as reference to assess the effect of
momentum injection and surface roughness (Figure 3-2).
With the model at a = 0° and the cylinders rotating at the same speed (but
in opposite directions) the flow field should be symmetrical. The results confirmed
this observation for both the smooth and the rough cylinders at four different
18

0 5 10 15 20 252.45 2.38 2.13 2.35 2.64 2.91
4
CD
3--\
-15 -10 -5 0 5 10 15 20 25
2
1
0-25 -20
5
Figure 3-2
cy 0
Reference drag coefficient as affected by the angle of attack in absence of the MSBC with smoothcylinders

20
speed ratios. Only when the surface velocities (U ci , Uc2 ) of the two cylinders
differed did the drag results deviate from the symmetric case.
Another case of symmetry in the CD variation, as against the flow
symmetry, occurs when the pair of angular velocities are interchanged at a = 0°.
This is apparent in the results presented in Figure 3-3. Note the interchange of
Ucl and Uc2 ( i.e. Uci / U = 0 and Uc2 / U = 1 changed to Uci / U = 1 and
UC2 0).
A remark concerning the blockage effect would be appropriate here. Several
classical procedures for blockage correction of streamlined bodies are available,
and have been used in practice with some success depending on the situation.
However, their application to bluff geometries has proved to be of questionable
value. The problem is further complicated for the case of unsteady flows with
separation, reattachment and reseparation. In absence of any reliable procedure
for the blockage correction, the results are purposely presented here in the
uncorrected form. This is not a primary concern in the present study as the
objective is to assess the influence of the MSBC at the same blockage, i.e. relative
value of the drag without and with the cylinder rotation.
With the cylinders stationary at a = 0°, the drag coefficient (C D ) of the
rectangular prism was 2.45 (Figure 3-3(a)), which is higher than the classical
value of 2.1 for a sharp edged square prism due to the wall confinement effects.
For small angles of attack (a up to around 10°), the drag coefficient diminishes as
the flow on the top face reattached and that on the bottom face remains attached

5
1
CD
0-25 -20 -15 -10 -5 0 5 10 15 20 25
Variation of the drag coefficient with the angle of attack as affected by the momentum injectionthrough the rotation of the smooth cylinders. Uc2 /tJ is changed systematically with U ci /U held fixedat: a) Uel iU = 0.
Figure 3-3

X UC2/t-i= 0
Uc2/U=1
Uc2/U= 1.5
XX UC2 = 2
4 -
It /U = 1
3 -
1
1
-25 -20 -15 -10 -5 0 5 10 15 20 25
cv 0
Figure 3-3 Variation of the drag coefficient with the angle of attack as affected by the momentum injectionthrough the rotation of the smooth cylinders. U c2 /U is changed systematically with U ci /U held fixedat: b) 11c1 /1.1' = 1.
C D

0
1
-25 -20 -15 -10 -5 0 5 10 15 20 25
az °Figure 3-3 Variation of the drag coefficient with the angle of attack as affected by the momentum injection
through the rotation of the smooth cylinders. U c2 /U is changed systematically with Uel /U held fixedat: c) Ue l /U = 1.5.

5
CD
1 1 1 i 1 I I 1
-25 -20 -15 -10 -5 0 5 10 15 20 25
ceFigure 3-3 Variation of the drag coefficient with the angle of attack as affected by the momentum injection
through the rotation of the smooth cylinders. Uc2 /U is changed systematically with 11 c1 /tT held fixedat: d) Uci /U = 2.
0

25
due to a favourable pressure gradient. This leads to a reduced wake width which
is apparent from the pressure measurements and flow visualization study results
presented later. Beyond this critical angle, the separation point on the top face
moved upstream towards the leading edge of the prism with a corresponding
increase in CD. The plot has mirror symmetry about the a = 0° line as expected.
With the top leading edge cylinder stationary (U ci = 0) and the bottom
cylinder set into motion (Uc2 > 0), there was clear reduction in the drag for all
negative values of a. The momentum injection promoted the boundary layer to
remain attached further along the surface towards the trailing edge. The lowest
CD value of 1.58 corresponding to a = —5° represents a drag reduction of 34%.
Even at a = —25° and Uc2 /U = 2, the change in CD from 2.91 to 1.99 amounts to
a reduction of 31.6%. The corresponding reduction at a = 0° is 17.6%.
On the other hand, for a > 0° the drag coefficient increases significantly.
The pressure drag represents a cumulative effect of complex interactions between
the separation and reattachment conditions, pressure distribution and projected
dimension normal to the flow. Now the injected momentum carries the
accelerated boundary layer on the bottom face further along the direction normal
to the flow resulting in a wider wake. The largest C D was 4.52 (a 55.3% increase
from the base value) measured at a = 25°. Thus with the single cylinder rotation,
injection of momentum on the leeward face results in reduction of the drag while
that on the upstream face leads to an increase in the drag coefficient.
Figure 3-3(b) shows the effect of additional momentum injection on the

26
upper face of the prism through rotation of the upper leading edge cylinder
(Uci X = 1). With Ucl /UT T= - C2 /U 1 the CD plot is symmetrical about a = 0°
as expected. The reduction in drag for this case is 14.3% at a = 0° and an
increase in drag of 55% at a = 25°. Validity of the earlier observation concerning
injection of the momentum on the upstream or leeward face and its effect on drag
is strikingly apparent here. Note a significant increase in the drag at a negative
a, particularly at higher values, due to injection of the momentum on the
upstream face. However, at a positive angle of attack, the upper cylinder rotation
has a beneficial effect in reducing the drag. Of course, as expected, the effect
becomes progressively small at higher a. Note, at Ucl /LT = 1 and Uc2 /U = 2, the
reduction in drag with respect to the reference case (Uci = UC2 = 0) is 24.9% at
a = 0° , 28.9% at a = -25°, and an increase in drag of 1.7% at a = 25°. The lowest
CD occurred at a = -5° as in the previous case (Figure 3-3(a)). The lowest drag
coefficient of 1.45 at Um /U = 1, Uc2 /U = 2 represents a drag reduction of 39.1%
from the corresponding no rotation case (also at a = -5°).
With a further increase in Um , similar trends persisted with minor
variations due to a number of complex interactions between a variety of factors
governing the flow as pointed out before. The results for U cl /U = 1.5 and 2 are
presented in Figures 3-3(c) and 3-3(d), respectively. With both the cylinders
rotating at a relative speed of 1.5, the lowest CD = 1.65 at a = ±5° represents a
drag reduction of 30.7% with respect to the no rotation case. The corresponding
reduction at a = 0° is 31.2%. Similar results with U cl /U = 2 in Figure 3-3(d) are
27
apparent, however, with minor discrepancy in absolute values due to vibration
problems. A viscous damper was introduced, however, it did not completely
eliminate the problem.
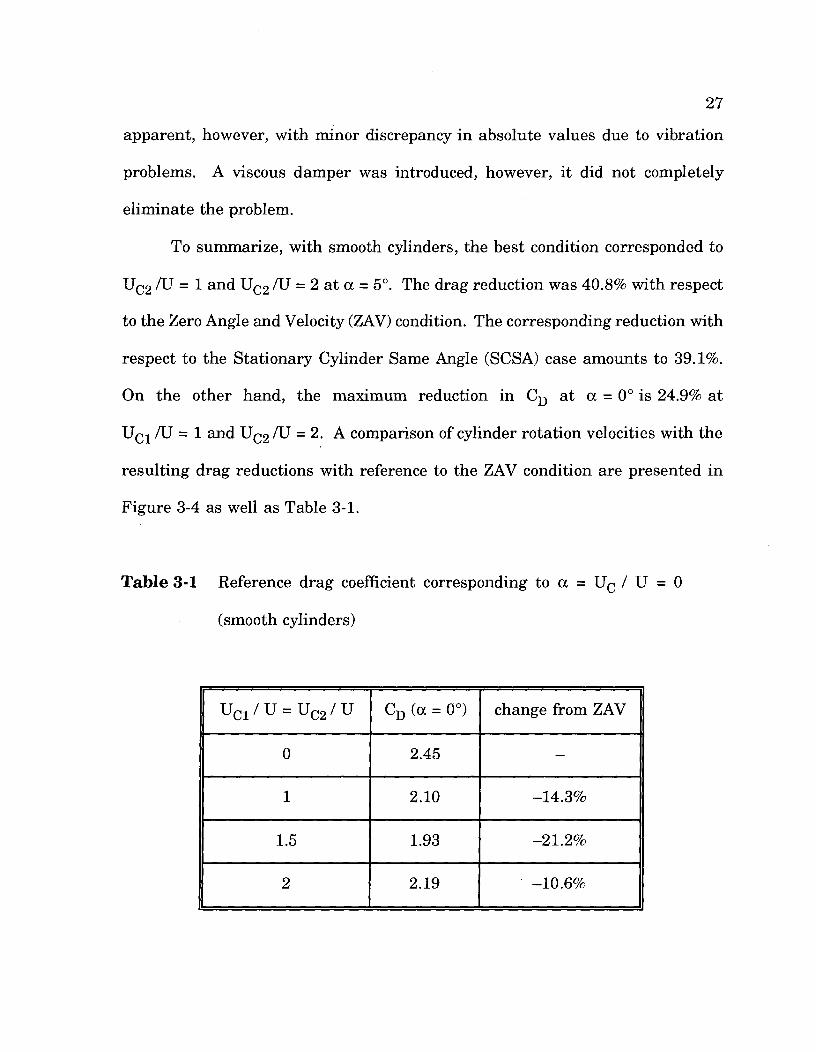
To summarize, with smooth cylinders, the best condition corresponded to
UC2 1 and Uc2 /U = 2 at a = 5°. The drag reduction was 40.8% with respect
to the Zero Angle and Velocity (ZAV) condition. The corresponding reduction with
respect to the Stationary Cylinder Same Angle (SCSA) case amounts to 39.1%.
On the other hand, the maximum reduction in CD at a = 0° is 24.9% at
1-1C1/U = 1 and Uc2 /U = 2. A comparison of cylinder rotation velocities with the
resulting drag reductions with reference to the ZAV condition are presented in
Figure 3-4 as well as Table 3-1.
Table 3-1 Reference drag coefficient corresponding to a = U c / U = 0
(smooth cylinders)
Um/U= Uc 2 / U CD (a = 0°) change from ZAV
0 2.45 —
1 2.10 —14.3%
1.5 1.93 —21.2%
2 2.19 —10.6%

:4, -----------
2
X ti c iti=0
1 -1-- Uc /U=1
Uc /U=1.5
--- H Lic /U=2
0-25
; 1 t 1 I I 1
-20 -15 -10 -5 0 5 10 15 20 25
CD
c o
Figure 3-4 Plot summarizing the effect of momentum injection with smooth cylinders on variation of CD with a.

29
Rough Cylinders
As in the smooth cylinder case, the rough cylinders exhibited symmetry
about a = 0° for identical cylinder speeds (but opposite in sense). Figure 3-5
displays the reference drag coefficient data with no rotation of the rough cylinders.
In Figure 3-6(a), with Ucl / U = 0, similarities are evident with reference to the
smooth cylinder case in Figure 3-3(a). For a > 0°, there is a decrease in the drag
for all Uc2 / U > 0 as compared to a drag increase for Uc2 / U = 0. The lowest
drag occurred at a = —5° with Uc2 / U = 2. Note with roughness the minimum CD
is 1.01 compared to 1.58 for the smooth cylinder case, a reduction of 36%.
It may be pointed out that, for stationary cylinders, the presence of splines
to provide roughness results in a larger separation angle leading to a wider wake
and higher drag compared to the case of smooth cylinders.
Figures 3-6(b) through 3-6(d) display the results when both the cylinders,
with surface roughness, are operating. In all the cases, there are substantial drag
reductions, particularly at low angles of attack. With U cl / U = 1.5 and
UC2 / U = 2 at a = 10° the lowest drag recorded was CD = 0.60. As can be
expected, the same value was also obtained in the symmetric configuration of
Uci / U = 2, Uc2 / U = 1.5 at a = —10°.
With both the cylinders rotating at the same angular rate, the drag values
for the rough cylinders showed a higher percentage reduction than the

0 5 10 15 20 252.28 2.49 2.79 3.19 3.78 4.37
-20 -15 -10 -5 0
4
CD
3
2
1
5 10 15 20 25
0-25
Figure 3-5
cv 0
Reference drag coefficient as affected by the angle of attack in absence of the MSBC with roughcylinders.

0 I 1 I I I I I I I
-25 -20 -15 -10 -5 0 5 10 15 20 25
Figure 3-6
ley 0
Variation of the drag coefficient with the angle of attack as affected by the momentum injectionthrough the rotation of the rough cylinders. Ue2 X is changed systematically with Uci /U held fixedat: a) Ucl /U = 0.

NUC1 /U= 1 >< uc2/1-J=0
uc2/ u= i
5
NN \ U c2 / U = 1.5
N zN ---a- uc2/u=z
N zN zN v
2 -
1
0-25 -20 -15 -10 -5 0 5 10 15 20 25
a°
CD
Figure 3-6 Variation of the drag coefficient with the angle of attack as affected by the momentum injectionthrough the rotation of the rough cylinders. Uc2 /U is changed systematically with Uci /U held fixedat: b) Uci /U 1. cA:
ND

4
UC2/U=0
Uc2/U=1
Uc2/U=1.5 //
Uc2/U=2/
><I N
N\
NN
UC1 /U = 1.5
0-25 -20 -15 -10 -5 0 5 10 15 20 25
5
v
u °Figure 3-6
Variation of the drag coefficient with the angle of attack as affected by the momentum injectionthrough the rotation of the rough cylinders. Ue2 fU is changed systematically with Uci /U held fixedat: c) Ucl X = 1.5.

XUC1 /U = 2 UC2/U= 0
Uc2/U=1
UC2/L1= 1.5 X
5 10 15 20 25-25 -20 -15 -10 -5 0
5
N
NN
4 -N,
NN
C D
Figure 3-6
ceVariation of the drag coefficient with the angle of attack as affected by the momentum injectionthrough the rotation of the rough cylinders. Uc2 /U is changed systematically with Uci AI held fixedat: d) Uci /U = 2.

35
corresponding smooth cylinders case. These results are displayed in Figure 3-7,
and summarized in Table 3-2 for a = 0. It is apparent that the highest drag
reduction of around 70% can be achieved for U c TU = 1.5. There is a possibility
of further improvement in the performance by optimizing the surface roughness
condition of the momentum injecting elements. The pressure distribution results
provide further appreciation of the flow field, particularly with respect to
separation and reattachment.
Figure 3-7 summarizes more useful information, from practical application
considerations, for several identical values of the speed ratios. In general (except
for —12° < a < 12° and Uc /U = 2), the momentum injection leads to a significant
reduction in drag as shown for a = 0 in Table 3-2. Even for a = ±25°, the
reduction in drag at Uc /U = 2 is around 35%.
3.1.2 Lift
During the wind tunnel tests, through measurements of two orthogonal
forces it was possible to determine the lift acting on the model. Although not the
objective of the present study, which focuses on the effect of momentum injection
on the drag, the lift results were also obtained (Appendix A). As the momentum
injection attempts to delay the boundary-layer separation, the effect, in general,
is to increase lift at a given a.

0 1 i 1 i I 1 I 1 I
-25 -20 -15 -10 -5 0 5 10 15 20 25
ce
Figure 3-7 Plot summarizing the effect of momentum injection with rough cylinders on variation of C D with a.

Table 3-2 Drag coefficient as affected by the surface roughness (a = 0°)
UC1 / U = UC2 / U Cylinder Type CD % reductiondue toroughness
% reductionwrt ZAV(smooth*)
0 smooth 2.45*
rough 2.28 6.9 6.9
1 smooth 2.10
rough 1.21 42.4 50.6
1.5 smooth 1.93
rough 0.73 62.2 70.2
2 smooth 2.19
rough 0.95 56.6 61.2
3.1.3 Surface pressure and the Strouhal number
Through a systematic variation of the angle of attack (a) and the
momentum injection parameters Ucl /U , Uc2 TIJ, a considerable amount of
information was obtained pertaining to the surface pressure distribution. For
conciseness, only some typical results useful in establishing trends are presented
37
38
here with further details recorded in Appendix B. It must be pointed out that,
due to the obvious practical difficulty, the pressure information at the location of
the rotating elements are missing. However, this does not affect the drag (and
lift) data as they are measured directly through strain gauge force transducers.
More importantly, the results provided better appreciation as to the physical
character of the flow particularly with reference to the boundary-layer separation,
reattachment, and base and frontal pressures. The fluctuating character of the
pressure due to the shedding Karman vortices also helped in arriving at the
corresponding Strouhal number.
For the analysis of pressure distribution around the rectangular prism, one
must try to interpret the pressure coefficients (Cp ) at each pressure tap.
Although the pressure information is incomplete, it may help explain drag and lift
variations observed through the force measurements. Major changes in CD and
CL can be correlated with pressure variations in certain regions over the bluff
body.
The first set of pressure values studied were for the case, as before, where
Uc /1-J. = 0 while the second cylinder is progressively rotated at higher speeds.
The results are presented in Figure 3-8. The objective is to assess the effect of
momentum injection on the pressure distribution at a given angle of attack. As
in the case when both the cylinders are stationary and a = 0°, there should not be
any lift since the flow field is symmetric. This is apparent in Figure 3-8(a). With
the momentum injection into the boundary-layer (U c2 / U > 0), there is a drop in

X u c2/ u =0
U c2 / U = 1
❑ U c2 / U = 2
0
Op
- 1
❑ ❑
/-\'' X-2
W I
xxxxxxx
-3-0.5 -0.4 -0.3 -0.2 -0.1 0 0.1 0.2 0.3 0.4 0.5
S
Figure 3-8 Surface pressure distribution as affected by the momentum injection Uc2 /U with Uci /U held fixedat 0: a) a = 0°.
X X

S
Figure 3-8 Surface pressure distribution as affected by the momentum injection Ue2 /U with Ucl /U held fixedat 0: b) a = 5°.

X Uc2/U=0 u c2 iu= 1
❑ Uc2/U=2
0
- 1
1- 1
/N.
-2 - X Xv
X
xx
C p
-3
1
-0.5 -0.4 -0.3 -0.2 -0.1 0 0.1 0.2 0.3 0.4 0.5
S
Figure 3 -8 Surface pressure distribution as affected by the momentum injection U c2 X with Ucl /U held fixedat 0: c) a = 10°.

-0.4 -0.3 -0.2 -0.1 0 0.1 0.2 0.3 0.4 0.5
S
Figure 3-8 Surface pressure distribution as affected by the momentum injection U c2 /U with Uci 1U held fixedat 0: d) a = 15°.

-3-0.5 -0.4 -0.3 -0.2 -0.1 0 0.1 0.2 0.3 0.4 0.5
S
Figure 3-8 Surface pressure distribution as affected by the momentum injection U 2 /U with Uel /U held fixedat 0: e) a = 20°.

1
0
Cp
- 1
-2
-3-0.5 -0.4 -0.3 -0.2 -0.1 0 0.1 0.2 0.3 0.4 0.5
S
Figure 3-8 Surface pressure distribution as affected by the momentum injection Uc2 /U with Uci /U held fixedat 0: f) a= 30°. 30°.

X U c2 /U=0
U c2 / U=1
❑ Uc2/U=2**i
c p
-1
-2
-3-0.5 -0.4 -0.3 -0.2 -0.1 0 0.1 0.2 0.3
0.4 0.5
S
Figure 3-8 Surface pressure distribution as affected by the momentum injection Uc2 with Uci /U held fixedat 0: g) a -= 40°.

-0.4 -0.3 -0.2 -0.1 0 0.1 0.2 0.3 0.4 0.5
S
Figure 3-8 Surface pressure distribution as affected by the momentum injection Uc2 /LT with Uci /LT held fixedat 0: h) a = 45°.

47
pressure immediately behind the rotating cylinder (s < — 0.20) due to an increase
in the local air speed. Further along the surface, the energy from the momentum
injection is dissipated into the boundary layer to create a higher pressure, with
a resulting increase in Cp in the wake and on the sides of the body. This was
reflected in the drag coefficient decreasing from 2.28 to 1.20 (U c2 iU = 0 and 2,
respectively). Also, the variation in Cp when 1.1c2 /U is increased from 0 to 1 is
greater than that for the Uc2 /U changing from 1 to 2. The drag results also
showed the similar trend.
With an increase in the angle of attack, the pressure distribution changes
markedly (Figure 3-8(b)). The top face of the body (0.20 < s < 0.37) seems to be
in a constant pressure zone, most likely a separation region produced by the flow
detaching from the top cylinder, which is not rotating. The bottom face shows a
low pressure region just behind the cylinder in the case where there is no rotation
of the second cylinder. This is due to the accelerated flow. As the second cylinder
starts rotating, the pressure increases due to the momentum injection as described
before, the effect becoming quite apparent in the wake on the top face at
UC2 /Ur = 2. As for the a = 0° case, the drag of the body decreased with the
introduction of the momentum injection.
The same trend persists for a = 10°. At a = 15° (Figure 3-8(d)), the
pressure distribution in the region —0.37 < s < —0.20 is essentially uniform. There
is only a small area of low pressure just behind the lower stationary cylinder.
With the rotation of the lower cylinder, the flow on the bottom face remains

48
essentially attached. The added energy does become apparent through an
increase in the pressure in the wake region.
At higher angles of attack the pressure distributions exhibit similar
character. Of particular note is the Cp distribution when a = 45°. Here the
pressure on the top and the rear faces (0.20 < s < 0.55) is essentially constant.
This indicates that the entire region is in the wake. The energy from the
momentum injection results in higher pressures as Uc2 iL1 increases.
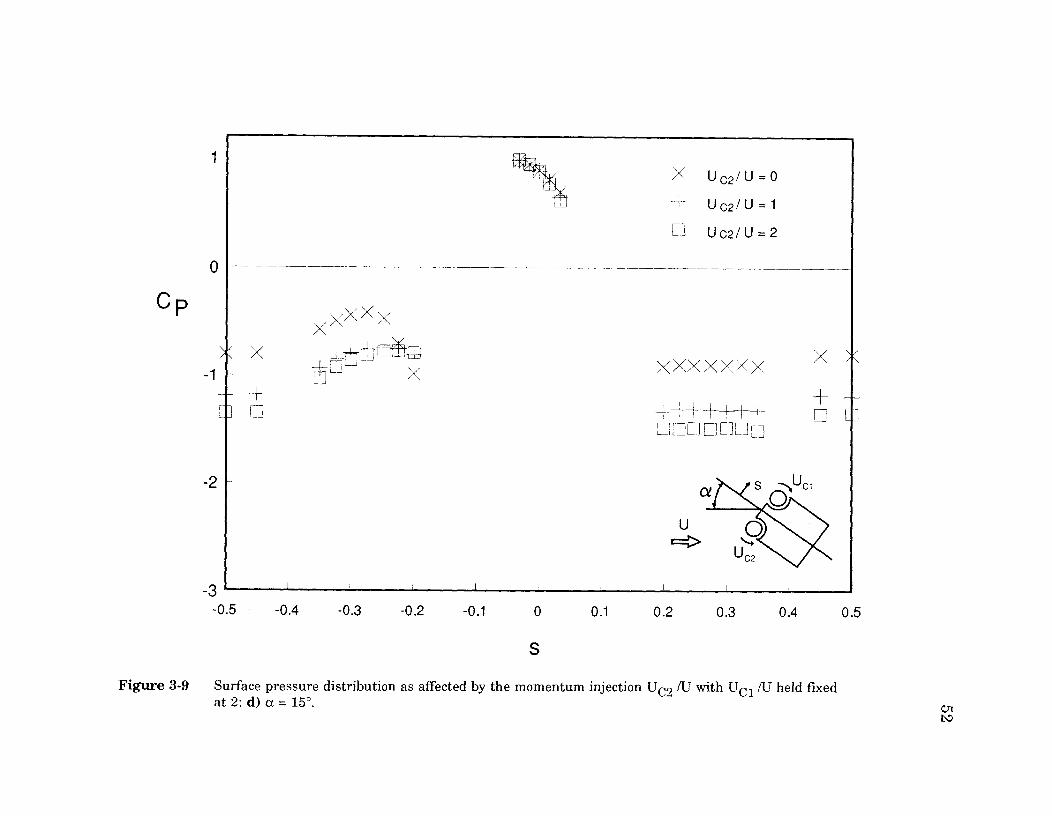
With an additional momentum injection through the rotation of the top
cylinder (Uc1 /I5 = 2), the pressure plots are further affected (Figure 3-9) in the
expected fashion. The observations here are very similar to those discussed
earlier,however, a few explanatory comments would be appropriate.
For a = 0°, as expected, there is a low pressure region in the vicinity of the
cylinders, due to local acceleration of the flow. Further along the top and bottom
faces, the decrease in the fluid speed due to convection of the momentum and
energy dissipation, the pressure shows a slight increase. On the bottom face, with
the second cylinder not rotating, the pressure is essentially constant corresponding
to only minor changes in velocity in the separated region. With the momentum
injection on the top face, the similar behaviour was observed. The same
observations can be made as given for the case of Um / U = 0 for Ucl / U = 2.
The effect of raising the momentum injection level to Um. /U = 2 has a
striking effect on the pressure plots. As can be expected, for a = 0° and
1-/C2 /1-J 0, results are similar to those for the case where U cl /15 = 0 and

X u c2 iu=o u c2 /u=i
Uc2iu= 2
±±LJXxx XX
fX
El
II II XXX X,4}xX
X
Cp
-3-0.5 -0.4 -0.3 -0.2 -0.1 0 0.1 0.2 0.3 0.4 0.5
S
Figure 3-9 Surface pressure distribution as affected by the momentum injection Uc2 /U with Ucl /U held fixedat 2: a) a = 0°.

X Uc2/u=0
uc2/U=1
❑ Uc2/U=2
X
zfl
-3
-2
41-
-0.5 -0.4 -0.3 -0.2 -0.1 0 0.1 0.2 0.3 0.4 0.5
S
Figure 3-9 Surface pressure distribution as affected by the momentum injection U e2 /U with Uci /U held fixedat 2: b) = 5°.
op

X
-2
-3
X X
1X uc2/u=0 u c2 iu=i
Uc2/U=2
0
Cp
4]
-0.5 -0.4 -0.3 -0.2 -0.1 0 0.1 0.2 0.3 0.4 0.5
S
Figure 3-9 Surface pressure distribution as affected by the momentum injection Ue2 /IJ with Ucl /U held fixedat 2: c) a = 10°.
-3
-2
X
0
Cp
X uc2/U=0 ti c2 iu=i
El Uc2iu=2
zX X
du XXX XXX X
ECJOELIll ❑
-0.5 -0.4 -0.3 -0.2 -0.1 0 0.1 0.2 0.3 0.4 0.5
S
Figure 3-9 Surface pressure distribution as affected by the momentum injection Ue2 /U with Uci /U held fixedat 2: d) a = 15°.

xXIL
-1>< X ❑X Xx X XX xII
1X U c2 / U = 0
U c2 / U = 1
[1] U c2 / U = 2
0
Cp
L11 F-1
-2
-3-0.5 -0.4 -0.3 -0.2 -0.1 0 0.1 0.2 0.3 0.4 0.5
SFigure 3-9 Surface pressure distribution as affected by the momentum injection Uc2 /U with Uci /U held fixedat 2: e) a = 20°.

X uc2/u =0uc2/u=i
uc2iu=2
XxX x X
gr.±±63:1[4:th
-3 I I
-0.5 -0.4 -0.3 -0.2 -0.1 0 0.1 0.2 0.3 0.4 0.5
S
Figure 3-9 Surface pressure distribution as affected by the momentum injection U 2 /LT with Uci /LT held fixedat 2: f) a = 30°.
Cp

-0.5 -0.4 -0.3 -0.2 -0.1 0 0.1 0.2 0.3 0.4 0.5
S
Figure 3-9 Surface pressure distribution as affected by the momentum injection 13-c2 X with Uci /U held fixedat 2: g) a = 40°.

X uc2/u=0 u c2/u=i
❑ Uc2 /U=2
- 1
X X XXXXXXX Xth
-2
-3-0.5 -0.4 -0.3 -0.2 -0.1 0 0.1 0.2 0.3 0.4 0.5
S
Figure 3-9 Surface pressure distribution as affected by the momentum injection Uc2 AI with Ucl /C1 held fixedat 2: h) a = 45°.
0
Op

57
UC2/U = 2, presented earlier. Note, on the lower face, the pressure is uniform as
the second cylinder is not rotating. However, on the top face, due to the
momentum injection, there is a remarkable recovery of pressure. As Uc2 / U is
increased, the pressure on the lower face also shows a significant increase in
pressure.
With the angle of attack set at 5° (Figure 3-9(b)) and Uc2 /U = 0, the
pressure on both the top and the bottom face increases significantly, and so does
the base pressure. This reflected in a large reduction in drag as seen before. The
fluid is now directed towards the upper cylinder, where the momentum injection
is being applied. This causes a reduction in the flow around the bottom side of the
body resulting in the higher pressures.
With the introduction of momentum injection through the lower cylinder,
the local fluid speed around the body increases and the pressure drops. The fluid
flux is now divided and, for a given U ci /LT, the relative increase in momentum is
larger at the top face, and hence the pressure drop. This character is also
apparent in the Cp distributions at higher angles of attack.
As apparent from the pressure plots, the base pressure for an increase in
a tends to drop with the inclusion of the second cylinder's rotation. This is
evident at both Uc2 /U = 1 as well as 2. However, complex interactions in the flow
field reflect in the associated drag differently. For the lower level of momentum
injection corresponding to Uc2 X = 1, seen in the drag, the drag increases,
however, at a higher energy level (Uc2 /U = 2), CD diminishes.

58
With respect to the Strouhal number analysis, the measured frequencies for
the various combinations followed the expected trend as suggested by the drag
results: an increase in the Strouhal number with a decrease in the effective
bluffness. The frequency data (Figures 3-10, 3-11 and Table 3-3), show the
Strouhal number (St) variation as affected by the angle of attack and cylinder
rotation speed. With the injection of momentum the Strouhal number shows a
distinct increase in the range a 5 10° as the wake is narrowed and the body
becomes effectively more streamlined. However, at higher angles of attack
(a 15°), the cylinder rotation has virtually no effect on the vortex shedding
frequency. This can be expected because of the larger separating angles of the
shear layers requiring a vertical component of the momentum to reduce the wake-
size as against the tangential component provided by the present arrangement.

0
5
1 0
15
20
25
30
35
40
45
Figure 3-10 Variation of the Strouhal Number with the angle of attack as affected by the momentum injection:a) Uci /U = 0.

0.5
0.45
0.4
St 0 .35
0.3 -X f)
X
X Lic2 / U = 0
UC2 / U = 1
❑ C2 U = 2
00 5 10 15 20 25 30 35 40 45
Figure 3-10 Variation of the Strouhal Number with the angle of attack as affected by the momentum injection:b) Uel /U = 1.
0.25
0.2
0.15
0.1
0.05

XSt0.25 -
0.4
0.35D
0.2 -
0.15 -
0.1 -
0.05 -
0
X Lic2 / U = 0
UC2 / U = 1
❑ UC2 U = 2
0 5 10 15 20 25 30 35 40 45
Figure 3-10 Variation of the Strouhal Number with the angle of attack as affected by the momentum injection:c) Ucl /U = 2.

0.15 -
0
X
X U c
U c /U=1
❑ U c /U= 2
5 10 15 20 25 30 35 40 45
0.4
0.35
0.3 -
St0.25 -
0.2 -
0.1 -
0.05-
0
Figure 3-11 Effect of momentum injection on the Strouhal number at a = 0° - 45°.
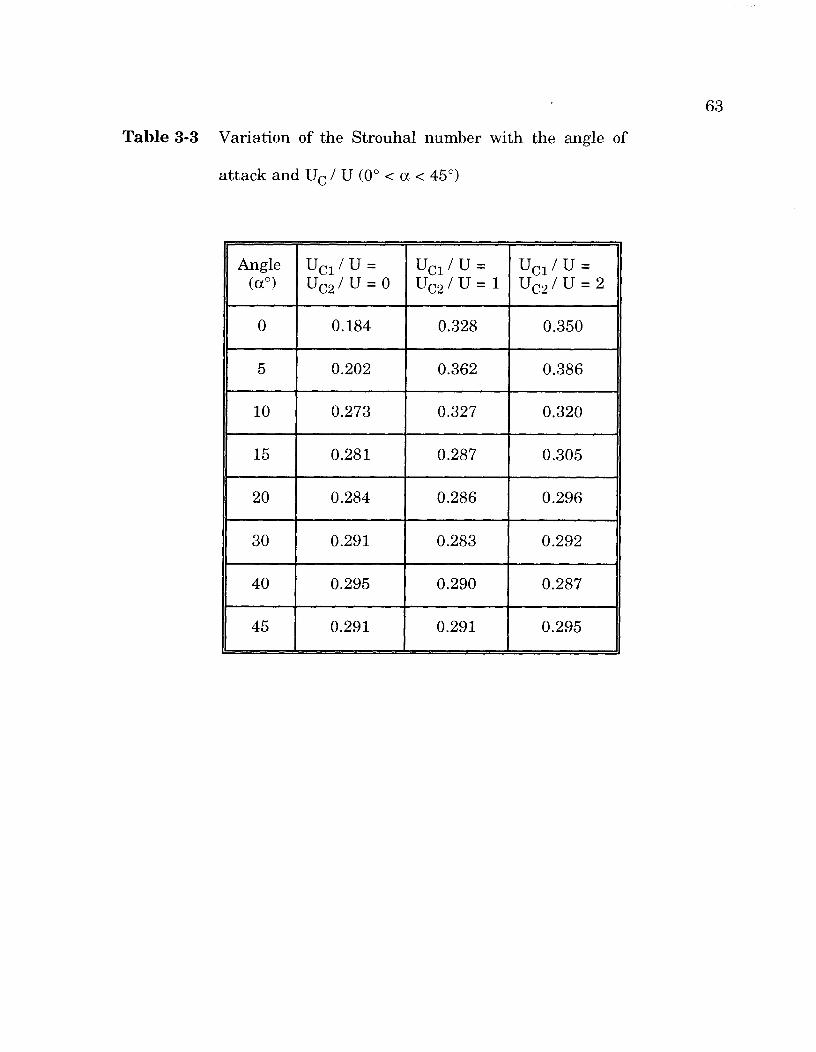
Table 3-3 Variation of the Strouhal number with the angle of
attack and Uc / U (0° < a < 45°)
Angle(a°)
Uci / U .Uc2 /U. 0
Uci/U.Uc2 /U.1
Uci /U.Uc2 /U.2
0 0.184 0.328 0.350
5 0.202 0.362 0.386
10 0.273 0.327 0.320
15 0.281 0.287 0.305
20 0.284 0.286 0.296
30 0.291 0.283 0.292
40 0.295 0.290 0.287
45 0.291 0.291 0.295
63

U
64
3.2 Cylinders at Top Edges
The experimental arrangement for rotating cylinders at the top edges is
illustrated in Figure 3-12. It shows position of the two cylinders and their
respective direction of rotation, which is the same (clockwise) as against the
previous case. Reference for the circumferential position (s) is the same as before.
Here the angle of attack (a) ranges from 75° to 105° for the force measurements
and from 60° to 120° for the frequency measurements.
Figure 3-12 A schematic diagram showing rotating cylinders asmomentum injection units located at the top edges of thetwo-dimensional prism. Note the cylinders rotate in thesame sense.
65
3.2.1 Drag
Smooth Cylinders
To simulate the effects of rotating cylinders along the top surface of a two-
dimensional rectangular prism in a fluid stream, the configuration with
75° 105° was used. A reference drag coefficient plot without any momentum
injection is shown in Figure 3-13. Note, the smallest drag is not at a = 90° as one
would intuitively expect but occurs at around 95° because of the reattachment of
the separating shear-layer at the bottom face. It should be emphasized that the
situation is not the same at a = 85°.
It should be recognized that now the momentum injection is at the two top
edges. The flow field is rather complex as the fluid flux is divided unevenly
between the top and bottom sides depending upon the level of the momentum
injection. Contribution to the separation region, and hence the wake, is also
different. The complex character of the flow is further accentuated at the top face
due to the momentum injection leading to a delay in separation, perhaps
reattachment of the separated shear-layer and even reseparation. Add to this the
effect of the angle of attack and one has a rather challenging flow field for
analysis. Fortunately, the general trends are rather well established.
In general, the highest drag coefficient is associated with a = 75°
(Figure 3-14). This is due to separation at the lower edges where there is no

cy 0
Figure 3-13 Reference drag coefficient as affected by the angle of attack in absence of the MSBC with smoothcylinders.

C
UC 1 /U = 0
Uc2 U = 0
Uc2 / U = 1
Uc2 / U = 1 .5
Uc2 / U = 2
0 75 80 85 90 95 100 105
ce °Figure 3-14 Variation of the drag coefficient with the angle of attack as affected by the momentum injection
through the rotation of the smooth cylinders. Uc2 /U is changed systematically with Uel TU held fixedat: a) Uci /U = O.

5
C
2
UC2 / U = 0
1 - 1 UC2 / U = 1
UC2 / U = 1.5
El- Uc2 U = 2
0 75 80 85 90 95 100 105
cv o
Figure 3-14 Variation of the drag coefficient with the angle of attack as affected by the momentum injectionthrough the rotation of the smooth cylinders. Uc2 X is changed systematically with Ucl /IJ held fixedat: b) Uci /U = 1.

5
Uc2 / U = 0
1 - UC2 / U = 1
UC2 / U = 1.5
f=3. Uc2 / U = 2
2
0 75 80 85 90 95 100 105
cv o
Figure 3-14 Variation of the drag coefficient with the angle of attack as affected by the momentum injectionthrough the rotation of the smooth cylinders. Ue2 /U is changed systematically with tic]. /U held fixedat: c) Uc 1 /U = 1.5. cs)
C D
3
UC1 /U = 1.5

UC1 /U = 2\
100
105
C
UC2 / U = 0
- UC2 / U = 1
X UC2 / U = 1.5
-R . Uc2 / U = 2
0 1 1 1
75 80 85 90 95
u o
Figure 3-14 Variation of the drag coefficient with the angle of attack as affected by the momentum injectionthrough the rotation of the smooth cylinders. Uc2 TU is changed systematically with Uci /LT held fixedat: d) Uci (U = 2. -.4
0

71
momentum injection. As can be expected, now the lower face contributes
relatively higher to the drag than the upper face. Even at higher angles of attack
(a up to 100°), the upstream cylinder is successful in delaying separation,
resulting in a narrower wake and a reduction in the pressure drag. The optimum
configuration leading to the maximum drag reduction (from the reference value
at Ucl /UaUC2 =corresponds= 90°) co to Uci. /U -C2 1.5 at a = 90°.
Here, a change in CD from 3.07 to 2.06 amounts to a decrease of around 33%.
Figure 3-15 summarizes performance of the momentum injection at the top edges.
Rough Cylinders
In general, with the rough cylinders at the top edges of the prism and
Uc /U = 0, the drag was observed to be higher than that in the corresponding
smooth cylinder cases (Figures 3-16, 3-13). This may be attributed to the spline
surface geometry of the cylinders (particularly the leading edge cylinder) leading
to a turbulent separation at a higher angle. With the momentum injection, there
is an overall decrease in drag compared to the corresponding smooth cylinder case
(Figure 3-17, 3-14). It is of interest to note that, with Uc2 /U = 0, injection of
momentum through rotation of the trailing edge cylinder (Uci /U > 0) has
virtually no effect on the drag. This is understandable, as now the rear cylinder
is submerged in the wake of the leading edge cylinder rendering it essentially
ineffective.

C D
—X Lic /U=0
tic /U=1
X Lic /U=1.5
Lic /U=2
0 75 80 85 90 95 100 105
Figure 3-15 Plot summarizing the effect of momentum injection with smooth cylinders on variation of C D with a.

cv 0
Figure 3-16 Reference drag coefficient as affected by the angle of attack in absence of the MSBC with roughcylinders.

75 80 85 90 95 100 105
116L0*0U c2
UC 1 /U = 0
Uc2 / U = 0
UC2 / U = 1
UC2 / U = 1.5
- Uc2 / U = 2
0
C D
cv o
Figure 3-17 Variation of the drag coefficient with the angle of attack as affected by the momentum injectionthrough the rotation of the rough cylinders. Uc2 /13 is changed systematically with U el /U held fixedat: a) Uc i. /LT = 0.

CD
UC2 / U = 0
UC2 / U = 1
UC2 / U = 1.5
-E3 Uc2 / U = 2
075 80 85 90 95 100 105
cy 0
Figure 3-17 Variation of the drag coefficient with the angle of attack as affected by the momentum injectionthrough the rotation of the rough cylinders. Uc2 /U is changed systematically with U el /U held fixedat: b) Uel /U = 1.

CD
UC2 / U = 0
UC2 / U = 1
UC2 / U = 1.5
UC2 / U = 2
0 75 80 85 90 95 100 105
cv o
Figure 3-17 Variation of the drag coefficient with the angle of attack as affected by the momentum injectionthrough the rotation of the rough cylinders. U c2 /LT is changed systematically with Uci /U held fixedat: c) Ucl /U = 1.5.

5
UC2 / U = 0
1
UC2 / U = 1
UC2 / U = 1.5
UC2 / U = 2
0 75 80 85 90 95 100 105
Figure 3-17 Variation of the drag coefficient with the angle of attack as affected by the momentum injectionthrough the rotation of the rough cylinders. Uc2 /U is changed systematically with Ucl /U held fixedat: d) Ucl /U = 2.

78
The optimum configuration resulting in the maximum drag reduction was
UCi /U = 1 . 5, UC2 /15 = 2 with a = 95°. Here there was a drag reduction of around
49%, with the CD decreasing from 3.16 to 1.60. For the a = 90° case, the largest
decrease was realised for Ucl AT = 1.5 and Uc2 it.T = 2, leading to a CD value of
1.60, a 45.8% reduction.
With the rectangular prism set at a = 90°, the average drag for four
different values of Uc2/U (averaged over the values of U ci ) were obtained and
percentage reductions compared with the corresponding smooth cases. These
results are presented in Table 3-4. It is evident that, in general, for the cases
considered, an increase in the leading edge cylinder speed appears to effect the
drag reduction favourably. Figure 3-18 summarizes the drag reduction
information for the rough cylinder cases at four different values of U c /U. Note,
for Uc /U = 2 and a = 90°, the drag reduction of around 37% is indeed impressive.

CD
u 0
Figure 3-18 Plot summarizing the effect of momentum injection with rough cylinders on variation of C D with a.

80
Table 3-4 Effect of surface roughness on the drag coefficient (a = 90°)
UC2 / U Cylinder Type CD % reduction*
0 smooth 3.21*
rough 2.85 11.4
1 smooth 2.60
rough 1.95 39.3
1.5 smooth 2.29
rough 1.83 43.0
2 smooth 2.46
rough 1.80 43.9
3.2.2 Lift
During the wind tunnel tests, through measurements of two orthogonal
forces, it was possible to determine the lift acting on the model. Although not the
objective of the present study, the lift results were also obtained (Appendix A).
As the momentum injection attempts to delay the boundary-layer separation, the
effect is to increase lift at a given a.

81
3.2.3 Surface pressure and the Strouhal number
With the rotating cylinders at the top edges of the rectangular prism, both
rotating in the same direction, the flow field lacks symmetry as against the
previous case with cylinders at the leading edges and rotating in the opposite
sense. Also, the two bottom edges are sharp, providing a distinct separation point
near s = —0.38 for a 90°.
To begin with, the case with the trailing edge cylinder held stationary was
considered with the leading edge cylinder velocity varied systematically. The
pressure data results, presented in Figure 3-19, clearly show an increase in the
base pressure with an injection of momentum suggesting a corresponding decrease
in the drag coefficient as shown earlier by the force measurements.
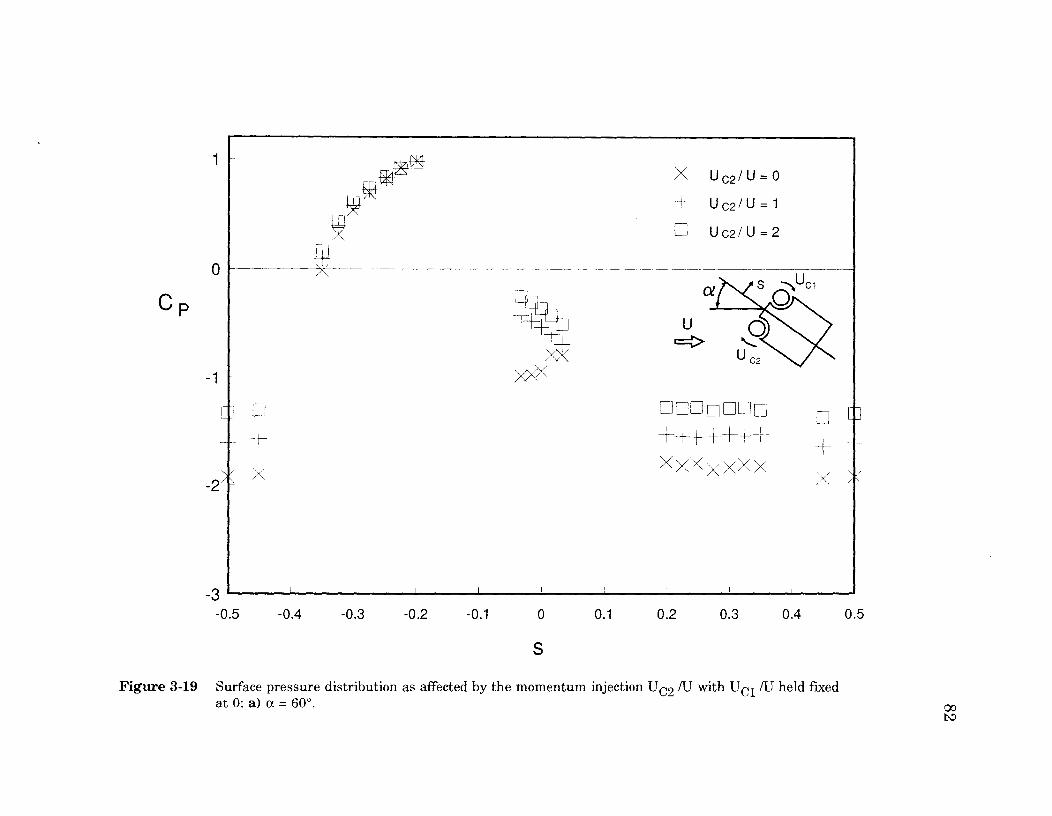
With both the cylinders stationary and a = 60° (Figure 3-19(a)), there seems
to be a separation region just downstream of the leading edge cylinder
(-0.05 < s < 0.00) caused by the flow detaching from the surface of the cylinder.
There is reattachment due to the positive pressure gradient promoting the flow
to move along the surface before detaching again at the location of the trailing
cylinder. With the introduction of momentum injection, the first separation region
is eliminated due to the increased energy in the flow near the body. This
increased energy is also reflected in the overall increase in the pressure coefficient
around the whole body.
As the angle of attack is increased to a = 75° (Figure 3-19(b)) and with the
0
o p
- 1
X Uc2/U=0
Uc2/U=1
❑ Uc2/U =2
-2X
❑ DO
X X
DI] ❑
X X
-3-0.5 -0.4 -0.3 -0.2 -0.1 0 0.1 0.2 0.3 0.4 0.5
S
Figure 3-19 Surface pressure distribution as affected by the momentum injection Uc2 /U with Ucl /U held fixedat 0: a) a --= 60°.

X
X
X u c2 / u = 0
c2 / U = 1
U c2 / U = 2
❑ElE1 ['Et1I
X XX XX X
X /-\
-3-0.5 -0.4 -0.3 -0.2 -0.1 0 0.1 0.2 0.3 0.4 0.5
S
Figure 3-19 Surface pressure distribution as affected by the momentum injection U c2 /U with Uci. /U held fixedat 0: b) a = 75°.
1
0
-2

0
CP
❑ED Ei ED Ej + [
\•/ X 44. X
X-2
-0.4 -0.3 -0.2 -0.1 0 0.1 0.2 0.3 0.4 0.5
S
Figure 3-19 Surface pressure distribution as affected by the momentum injection U c2 /U with Um /U held fixedat 0: c) a = 90°. oo
-1 - ❑F1
-3-0.5
XXX X X
I
1LP X u c2/ti =
U c2/ U = 1
❑ U c2/ U = 2

[i]al L
X XXXXXXXXXxx
X uc2/u
U c2 / U = 1
U c2 / U = 2
1
0
C P
-2 / X
-3-0.5 -0.4 -0.3 -0.2 -0.1 0 0.1 0.2 0.3 0.4 0.5
S
Figure 3-19 Surface pressure distribution as affected by the momentum injection U 2 /U with Ucl /U held fixedat 0: d) a = 105°.

C p
1X u c2 u o U c2/ U = 1
❑ U c 2 / U = 2
Ei
OM ELME] ■ XXX X xX X
Rim R.
- 1
-2
-3-0.5 -0.4 -0.3 -0.2 -0.1 0 0.1 0.2 0.3 0.4 0.5
S
Figure 3-19 Surface pressure distribution as affected by the momentum injection U c2 /U with Ucl (U held fixedat 0: e) a = 120°.

87
two cylinders stationary, there appears a large separation bubble. Reattachment
occurs near the trailing edge and the Cp tends to the wake pressure as s
approaches +0.05. With the introduction of the momentum injection, the
separated region is eliminated and the overall pressure distribution about the
rectangular prism increases as before.
At a = 90°, the pressure plots show interesting features, hence further
interpretation of the Cp data (Figure 3-19(c)) is in order. Along the surface of the
body, near s = 0, the pressure is nearly uniform and very close to that recorded
in the wake region behind the body (0.20 < s < 0.35), indicating the absence of
reattachment upstream of the trailing edge cylinder, hence, this area is a part of
the wake. With the momentum injection, the flow is accelerated and remains
attached, with a significant level of pressure recovery and a higher value of the
base pressure.
For a =105°, there is a distinct separation from the leading edge cylinder,
as shown in Figure 3-19(d). The separation region is quite apparent from the
nearly uniform and identical pressure coefficients in the range —0.05 < s < 0.05
and 0.20 < s < 0.35, for the three cases of Uc2 iU studied. Even with the
separation, the momentum injection continues to increase the pressures around
the body, except at the surface directly exposed to the free stream. The bottom
face (0.38 < s < 0.62) is partially exposed to the free stream and experiences the
decrease in pressure corresponding to an increase in the surface velocity. There
may be a separated region at the corner (s = 0.38), but this could not be detected
88
due to the lack of pressure data in that area.
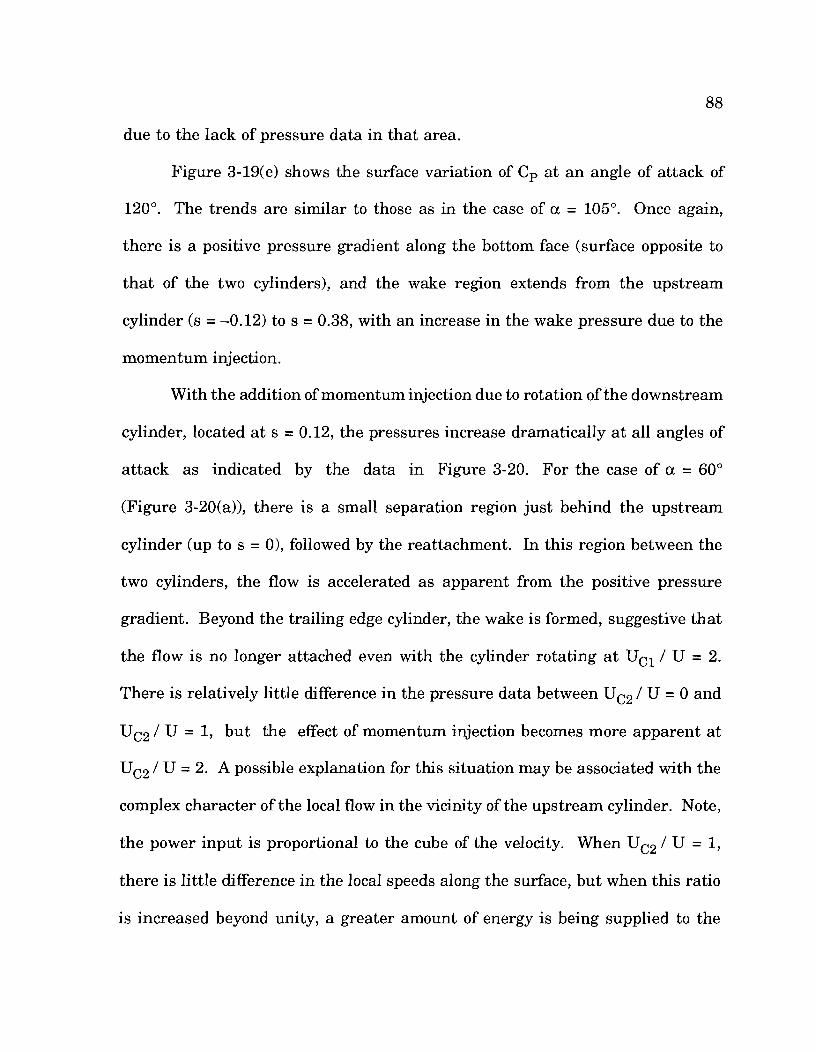
Figure 3-19(e) shows the surface variation of C p at an angle of attack of
120°. The trends are similar to those as in the case of a = 105°. Once again,
there is a positive pressure gradient along the bottom face (surface opposite to
that of the two cylinders), and the wake region extends from the upstream
cylinder (s = —0.12) to s = 0.38, with an increase in the wake pressure due to the
momentum injection.
With the addition of momentum injection due to rotation of the downstream
cylinder, located at s = 0.12, the pressures increase dramatically at all angles of
attack as indicated by the data in Figure 3-20. For the case of a = 60°
(Figure 3-20(a)), there is a small separation region just behind the upstream
cylinder (up to s = 0), followed by the reattachment. In this region between the
two cylinders, the flow is accelerated as apparent from the positive pressure
gradient. Beyond the trailing edge cylinder, the wake is formed, suggestive that
the flow is no longer attached even with the cylinder rotating at U cl / U = 2.
There is relatively little difference in the pressure data between UC 2 / U = 0 and
UC2 / U = 1, but the effect of momentum injection becomes more apparent at
UC2 / U = 2. A possible explanation for this situation may be associated with the
complex character of the local flow in the vicinity of the upstream cylinder. Note,
the power input is proportional to the cube of the velocity. When UC2 / U = 1,
there is little difference in the local speeds along the surface, but when this ratio
is increased beyond unity, a greater amount of energy is being supplied to the

1
0
C P
- 1
-2
-3-0.5 -0.4 -0.3 -0.2 -0.1 0 0.1 0.2 0.3 0.4 0.5
S
Figure 3-20 Surface pressure distribution as affected by the momentum injection Uc2 /U with Ucl /U held fixedat 2: a) a = 60°.

1
0
C P
- 1
-2
-3-0.5 -0.4 -0.3 -0.2 -0.1 0 0.1 0.2 0.3 0.4 0.5
S
Figure 3-20 Surface pressure distribution as affected by the momentum injection U e2 with Uel /1..T held fixedat 2: b) a 75°.

1X uc2/U= 0
uc2/U=1
❑ uc2/U=2
❑ ❑
X
C D1 F,ii L-1
\-/ X.--,-1 -
❑❑❑❑❑III III
XXX X XX X
-2
-3-0.5 -0.4 -0.3 -0.2 -0.1 0 0.1 0.2 0.3 0.4 0.5
S
Figure 3-20 Surface pressure distribution as affected by the momentum injection Uc2 /I.J with Lie' /U held fixedat 2: c) a = 90°.
I I t t 1 t t t 1
0

1X uc2/u=0± u c2 iu=i❑ uc2iu=2
X —C D ❑ [ME ❑DOMM
XXXXXXX
-2 -
-3-0.5 -0.4 -0.3 -0.2 -0.1 0 0.1 0.2 0.3 0.4 0.5
S
Figure 3-20 Surface pressure distribution as affected by the momentum injection Uc2 X with Ucl /U held fixedat 2: d) a = 105°.

1
L
0
p
- 1
-2
X Uc2/U=0
UO2/U=1
Uc2/U=2
LEJEJDELIEJ
X I F>i<>< XXXX
T 1
-3-0.5 -0.4 -0.3 -0.2 -0.1 0 0.1 0.2 0.3 0.4 0.5
S
Figure 3-20 Surface pressure distribution as affected by the momentum injection Ue2 /U with Ucl /U held fixedat 2: e) a = 120°.

94
flow.
A large separation region is apparent along the surface containing the two
cylinders when a = 75° and the leading edge cylinder is stationary, indicating an
adverse pressure gradient near the upstream edge (Figure 3-20(b)). The flow may
attempt to reattach further along the surface, but this cannot be certain without
direct measurements in this region. When Uc2 / U is increased, the Cp values in
this region are fairly constant indicating a near balance of the positive pressure
gradient with the dispersion of the concentrated energy from the downstream
cylinder.
At a = 90° and Uc2 /U = 0, separation occurs on the surface between the
two cylinders (Figure 3-20(c)). With the momentum injection, the wake pressure
is slightly higher than the pressure along the surface near s = 0. Here, unlike the
case where a = 60°, the difference in the change in pressures for the upstream
cylinder's surface velocity ratio between 0 and 1 is greater than that between 1
and 2. This may be due to the flow remaining attached to the surface of the two
cylinders (rather than injecting momentum into the fluid stream) with the
rotation of the second cylinder.
In Figures 3-20(d) and 3-20(e) there is a marked wake region beyond the
upstream cylinder as the top face moves from the free stream (a > 90°). The
momentum injection does tend to increase the average pressure around the body,
as expected, but no other effects can be distinguished from the data available.
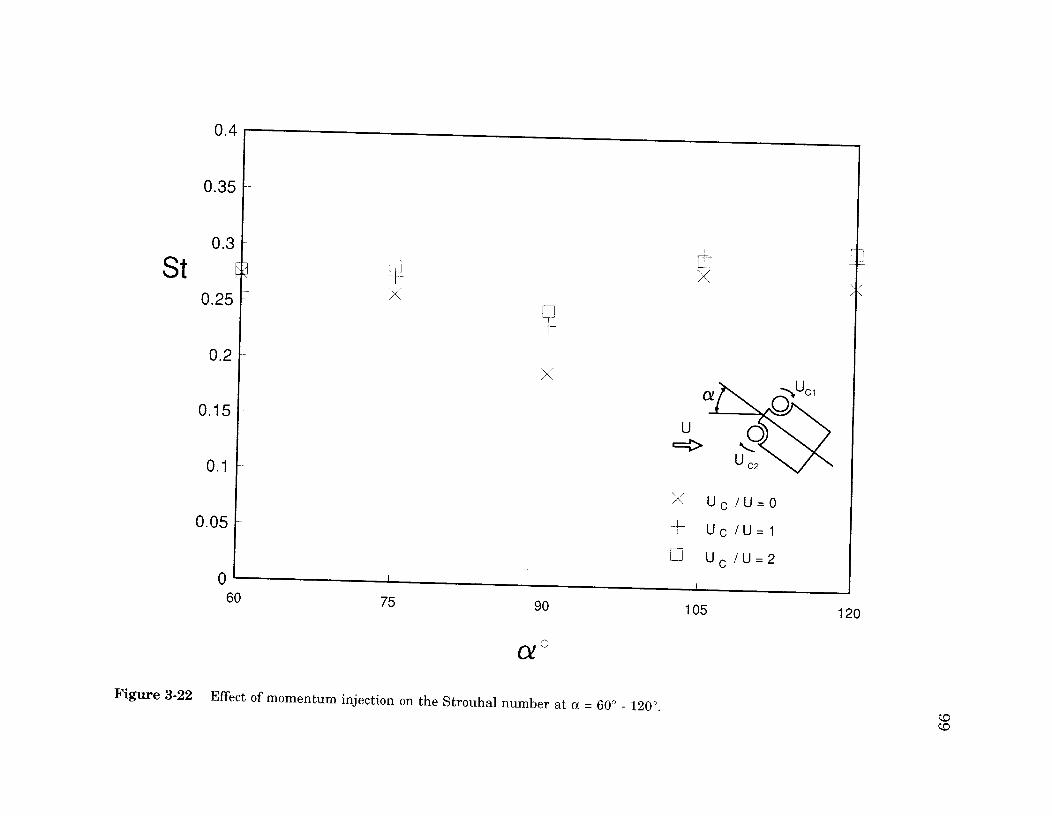
With respect to the Strouhal number analysis, the frequencies measured for

95
the various combinations resembled what was expected. The frequency data
(Table 3-5, Figures 3-21 and 3-22) show the Strouhal number (St) as a function
of the angle of attack and cylinder rotation speed. With the injection of
momentum into the flow, in most cases the St was found to increase as the wake
is narrowed and the body becomes effectively more streamlined. As in the case
of —45° a 5_ 45°, the effectiveness of the momentum injection is limited to a
certain range of angles of attack. The most significant change in St occurred at
a= 90° (an increase of 29.5%), while at other angles of attack it was around 10%.
Table 3-5 Effect of the angle of attack and momentum injection on
the Strouhal number (60° < a < 120°)
Angle(a° )
Um / U =Uc2 / U = 0
Um / U =Uc2 / U = 1
UCi / U =Uc2 / U = 2
60 0.274 0.257 0.277
75 0.258 0.274 0.283
90 0.190 0.233 0.246
105 0.281 0.298 0.294
120 0.272 0.295 0.303

0.4
X
X
X Uc2 / U = 0
UC2 / U = 1
UC2 U = 2
0.35
0.3
St0.25 -
0.2
0.15 -
0.1
0.05
Ci
0 60 75 90 105 120
Figure 3-21 Variation of the Strouhal Number with the angle of attack as affected by the momentum injection:a) Ucl /U = 0.

0.4
0.35 -
0.3
St0.25a
0.2 --
0.15 -
0.1 -
0.05 --
X Lic2 / U = 0
UC2 / U = 1
❑ UC2 = 2
WW
060 75 90 105 120
ce ,
Figure 3-21 Variation of the Strouhal Number with the angle of attack as affected by the momentum injection:b) Uci /U = 1.

X
X Uc2 / U = 0
UC2 / U = 1
UC2 U = 2
0.4
0.35
75 90 105 120
ce °Figure 3-21 Variation of the Strouhal Number with the angle of attack as affected by the momentum injection:
c) Uel /LT = 2.
0.3
St '-0.25
0.2
0.15
0.1
0.05
060
0.4
0.35
0.3
St0.25
0.2
Li}
X
X
X ti c /U= 0
—I - (Jc /U-= 1
U c /U= 2
0.15
0.1
0.05
0 1 I
60 75 90 105 120
a°Figure 3-22 Effect of momentum injection on the Strouhal number at a = 60° - 120°.

100
3.3 Flow Visualization
In conjunction with the research completed here, flow visualization studies
were performed. A water tunnel model with scaled dimensions to that used in the
wind tunnel tests was utilized. Figures 3-23 and 3-24 show dramatic effects of
momentum injection as applied to a rectangular prism. The drag reduction and
pressure distributions from the wind tunnel experiments seem to be validated by
the flow visualization study shown.


102
Uc / U 0
Uc / U -- 2
Uc / U -- 4
_ --.-- `7----------..._ '---'''7...-=-, -••••,, --- --,„..,.._ _ -... -..--,-7-__. ___- ---------------- **---- -:-+--- ':
---------•.-- -4:--Z,41.444,
--̀ ‘t":---NNI, ,,.,,y-
---.404.____.;.. ,,,.-',- ,,_--x,,,,. `- ,...*:-........■1-..: '-- - -.4,.. otti-.....
Figure 3-24 Typical flow visualization photographs for a rectangular prism,with a smooth surface cylinder for a = 90°.

103
4 CONCLUDING REMARKS
4.1 Summary of Results
The study, aimed at assessing the effect of momentum injection on the fluid
dynamics of a two-dimensional rectangular prism, has provided information of
fundamental value and far-reaching consequence never reported before. Detailed
measurements of the pressure distribution, force and Strouhal number clearly
suggest that the MSBC can significantly reduce the drag of the prism. Effectively,
it affects the bluffness of the body, thus changing its Strouhal number, which can
be used to advantage in controlling the fluid-structure interaction instabilities
such as the vortex resonance and galloping.
With the momentum injection through smooth cylinders at the leading
edges, a drag reduction of around 39% was realized at a = —5° with U cl / U = 1
and Uc2 / U = 2. Further reduction can be achieved through the use of cylinders
with surface roughness. With the spline geometry used in the present study, a
drag reduction of 75% was achieved with Um / U = 1.5, Uc2 / U = 2 and a = 10°.
With the momentum injection at the top face, the leading edge cylinder
played the dominant role in governing the boundary-layer separation. The MSBC
with the smooth cylinders reduced the drag coefficient with respect to the base
values by up to 36% (Uci / U = 0, Uc2 / U = 2, a = 105°). Introduction of the

104
surface roughness further improved the performance by around 39% (U ci /U = 1.5,
Uc2 /II = 2, a = 90°).
The pressure data helped explain the trends predicted by the force
measurements. Their time dependent variations formed bases for calculation of
the vortex shedding frequency and the associated Strouhal numbers. Both the
pressure and Strouhal data, in general, substantiated the trends predicted by the
force data, and provided better appreciation of the flow field. An increase in the
Strouhal number with the momentum injection suggests effective reduction in
bluffness of the body, leading to a narrower wake and corresponding reduction in
the drag.
4.2 Recommendations for Future Work
The investigation reported here represents only a small step in exploration
of the new field with exciting possibilities. As can be expected with any emerging
area of research, there are numerous avenues one can pursue to have a better
understanding of the governing process at the fundamental level. A few issues
demanding immediate attention, which are likely to be of practical value, are
indicated below:
(i) Uc /LT range should be extended further, to the level of at least 4, to arrive
at a limiting value beyond which the momentum injection has little effect.
(ii) Effect of surface roughness in improving efficiency of the MSBC needs more

105
attention.
(iii) Cross-section (1/d) of the rectangular cylinder should be changed
systematically to cover a wide range of rectangular prisms. For a small 1/d
(- 0.1), this will yield a widely investigated plate type geometry, while l/d
4 - 6 will tend toward trailer-type configurations presently under
investigation 35 .
(iv) The present model should be modified in several ways to:
(a) include more pressure taps in the vicinity of the rotating elements
to better predict the pressure distribution in that critical region;
(b) provide arrangement for constructing rectangular prisms with
different 1/d in a modular fashion;
(c) incorporate rotating elements at other locations.
(v) For assessment of the overall efficiency, it would be useful to monitor the
power input precisely. For better appreciation, it would be useful to
present information also in terms of saving in power for probable
application to truck configurations.
(vi) Several alternate approaches to boundary-layer control should also be
explored for relative assessment of effectiveness. Of particular interest are
the application of fences on the front face; oscillating flap at the leading
edges; communication of the front stagnation pressure to the rear face, etc.
These concepts are only in the preliminary stage of development in Dr.
Modi's laboratory, and show considerable promise.
106
REFERENCES
[1] Goldstein, S., Modern Developments in Fluid Mechanics, Vols. I and II,Oxford University Press, 1938.
[2] Lachmann, G.V., Boundary Layer and Flow Control, Vols. I and II,Pergamon Press, 1961.
[3] Rosenhead, L., Laminar Boundary Layers, Oxford University Press, 1966.
[4] Schlichting, H., 1968, Boundary Layer Theory, McGraw-Hill Book Company.
[5] Chang, P.K., Separation of Flow, Pergamon Press, 1970.
[6] Alvarez-Calderon, A., and Arnold, F. R.,"A Study of the AerodynamicCharacteristics of a High Lift Device Based on Rotating Cylinder Flap",Stanford University Technical Report RCF-1, 1961.
[7] Cichy, D.R., Harris, J. W., and MacKay, J. K.,"Flight Tests of a RotatingCylinder Flap on a North American Rockwell OV-10A Aircraft", NASA CR-2135, Nov. 1972.
[8] Weiberg, J.A., Giulianettij, D., Gambucci, B., and Innis, R.C.,"Takeoff andLanding Performance and Noise Characteristics of a Deflected STOLAirplane with Interconnected Propellers and Rotating Cylinder Flaps",NASA TM X-62, 320, Dec., 1973.
[9] Cook, W.L., Mickey, D.M., and Quigley, H.G.,"Aerodynamics of Jet Flap andRotating Cylinder Flap STOL Concepts", AGARD Fluid Dynamics Panel onV/STOL Aerodynamics, Delft, Netherlands, April 1974, Paper No. 10.
[10] Tennant, J.S., Johnson, W.S., and Krothapalli, A., "Rotating Cylinder forCirculation Control on an Airfoil", Journal of Hydronautics, Vol. 11, No. 3,1976.
[11] Johnson, W.S., Tennant, J.S., and Stamps, R.E.,"Leading Edge RotatingCylinder for Boundary-Layer Control on Lifting Surfaces", Journal ofHydrodynamics, Vol. 9, No. 2, April 1975, pp. 76-78.

107
[12] Modi, V.J., Sun, J.L.C., Akutsu, T., Lake, P., MacMillan, K., Winton, P.J.,and Mullins, D., "Moving Surface Boundary Control for Aircraft Operationat High Incidence", Journal of Aircraft, AIAA, Vol. 18, No. 11, 1981, pp.963-968.
[13] Mokhtarian, F., and Modi, V.J., "Fluid Dynamics of Airfoils with MovingSurface Boundary-Layer Control", AIAA Paper 86-2184, Aug. 1986; alsoJournal of Aircraft, Vol. 25, 1988, pp. 163-169.
[14] Mokhtarian, F., Modi, V.J., and Yokomizo, T., "Effect of Moving Surfaceson the Airfoil Boundary-Layer Control", AIAA Paper 88-4303, Aug. 1988;also Journal of Aircraft, Vol. 27, 1990, pp. 44-50.
[15] Modi, V.J., Fernando, M., and Yokomizo, T., "Drag Reduction of BluffBodies Through Moving Surface Boundary Layer Control", 28th AerospaceSciences Meeting, Reno, Nevada, U.S.A., January 1990, Paper No. AIAA 90-0298; also as "Moving Surface Boundary-Layer Control: Studies with BluffBodies and Application", AIAA Journal, Vol. 29, No. 9, Sept. 1991, pp. 1400-1406.
[16] Mokhtarian, F., "Fluid Dynamics of Airfoils with Moving Surface Boundary-Layer Control", Ph.D. Thesis, The University of British Columbia, 1988.
[17] Modi, V.J., Shih, E., and Yokomizo, T., "On the Drag Reduction of BluffBodies Through Momentum Injection", Proceedings of the AIAA 8th AppliedAerodynamics Conference, Portland, Oregon, U.S.A., Paper No. 90-3076,AIAA Publisher, Washington, D.C., 1990, pp. 866-874.
[18] Modi, V.J., Fernando, M.S.U.K., and Yokomizo, T., "Moving SurfaceBoundary-Layer Control as Applied to Two-Dimensional and Three-Dimensional Bluff Bodies", Journal of Wind Engineering and IndustrialAerodynamics, Vol. 38, 1991, pp. 83-92.
[19] Modi, V.J., Ying, B., and Yokomizo, T., "Boundary-Layer Control of BluffBodies Through Momentum Injection", 1990 SAE International Bus/TruckMeeting and Exposition, Detroit, Nov. 1990, Paper No. 90-2225; also SAETransactions, Journal of Commercial Vehicles, Section 2, Vol. 99, pp. 778-794.
[20] Modi, V.J., Ying, B., and Yokomizo, T., "Effect of Momentum Injection onthe Aerodynamics of Several Bluff Bodies", Proceedings of the 8thInternational Conference on Wind Engineering, London, Ontario, Canada,July 1991, Editor: A.G. Davenport, in press.

108
[21] Ying, B.,"Boundary-Layer Control of Bluff Bodies With Application to DragReduction of Tractor-Trailer Truck Configurations", M.A.Sc. Thesis, TheUniversity of British Columbia, 1991.
[22] Blevins, R.D., Flow Induced Vibrations, McGraw-Hill, 1990.
[23] Den Hartog, J.P., Mechanical Vibrations, McGraw-Hill, New York, 1956,Ch. 7, pp. 282-329.
[24] Vickery, B., and Watkins, R., "Flow induced vibrations of cylindricalstructures", Proceedings of the 1st Australian Conference on Hydraulics andFluid Mechanics, Editor: R. Silvester, Pergamon Press, 1964, pp. 213-241.
[25] Cermak, J.E.,"Application of Fluid Mechanics to Wind Engineering",Freeman Scholar Lecture, Transactions of ASME, Journal of FluidsEngineering, Vol. 97, No. 1, 1975, pp. 9-38.
[26] Welt, F.,"A Study of Nutation Damper with Application to Wind InducedOscillations", Ph.D. Thesis, The University of British Columbia, 1988.
[27] Zdravkovich, M.M., "Review and Classification of Various Aerodynamic andHydrodynamic Means for Suppressing Vortex Shedding", Journal of WindEngineering and Industrial Aerodynamics, Vol. 7, 1981, pp. 145-189.
[28] Zdravkovich, M.M., "Reduction of Effectiveness of Means for SuppressingWind-induced Oscillation", Engineering Structures, Vol. 6, 1984, pp. 344-350.
[29] Wong, H.Y., "Vortex-induced Wake Buffeting and Its Suppression", Journalof Wind Engineering and Industrial Aerodynamics, Vol. 6, 1980, pp. 49-57.
[30] Kubo, Y., Yasuda, H., and Kato, K., "Suppression of Aerodynamic Vibrationof a Square Section by Acceleration of the Boundary-Layer", Journal ofStructural Engineering, JSCE, Vol. 37a, 1991, pp. 989-994.
[31] Fage, A., and Johansen, F.C., "On the Flow of Air Behind an Inclined FlatPlate of Infinite Span", Proceedings of the Royal Society of London, SeriesA, Vol. 116, 1927, pp. 170-197.
[32] Kubo, Y., Modi, V.J., Yasuda, H., and Kato, K., "On the Suppression ofAerodynamic Instabilities Through Moving Surface Boundary-layerControl", Proceedings of the 8th International Conference on WindEngineering, London, Ontario, Canada, July 1991, Editor: A.G. Davenport,in press; also Journal of Wind Engineering and Industrial Aerodynamics,in press.

109
[33] Kubo, Y., and Yasuda, H., "Surface Pressure Characteristics of a SquarePrism Under Aerodynamic Response Control by Boundary LayerAcceleration", Proceedings of the Conference on Flow-Induced Vibrations,Brighton, U.K., May 1991, Paper No. C416/101, The Institution ofMechanical Engineers, pp. 411-416.
[34] Seto,M.,"Flow Interference Effects Between Two Circular Cylinders ofDifferent Diameters", M.Sc. Thesis, The University of British Columbia,1990.
[35] St. Hill, S.,"Effect of Boundary-Layer Control on the Drag of a Cube-TypeTruck Configuration: Wind Tunnel and Prototype Tests", M.A.Sc. Thesis,The University of British Columbia, November 1992.
APPENDIX A: TYPICAL LIFT RESULTS
Ito

C L
-3-25 -20 -15 -10 -5 0
5 10 15 20 25
ce °
Plot summarizing the effect of momentum injection with smooth cylinders on variation of C L with a.

>< Uc iti=o
U c / U = 1
U c / U = 1.5
U c / U = 2
2
C L
1
-3 -25 -20 -15 -10 -5 0 5 10 15 20 25
cv 0
Plot summarizing the effect of momentum injection with rough cylinders on variation of C L with a.

X- 1
U c /U= 0
U /U= 1
U C /U=1.5
U c /U= 2
-2 -
-3
3
0
75 80 85 90 95
100 105
ce °
Plot summarizing the effect of momentum injection with smooth cylinders on variation of C L with a.

2 -
CL
0
-1
X— u c iu=o uciu=i
-2 -U c / U = 1.5 =4>
XX u c iu=2
-375 80 85 90 95
X
100 105
u °Plot summarizing the effect of momentum injection with rough cylinders on variation of C L with a.

APPENDIX B: ADDITIONAL PRESSURE DISTRIBUTION DATA
I IS

X Uc2/U=0 tic2 iu=i
❑ Uc2/U=2
XX❑ I X
X
•
L ElXXXXX
0
Op
-2
-3-0.5 -0.4 -0.3 -0.2 -0.1 0 0.1 0.2 0.3 0.4 0.5
S
Surface pressure distribution as affected by the momentum injection Uc2 iU with Um /U held fixed at 1: a) a =
El

X u c2 / u = o
U c2/ U = 1
U c2 / U = 2
c p
0❑*
-3-0.5 -0.4 -0.3 -0.2 -0.1 0 0.1 0.2 0.3 0.4 0.5
S
Surface pressure distribution as affected by the momentum injection Uc2 /13 with Uci /U held fixed at 1: b) a = 5°.

-3-0.5 -0.4 -0.3 -0.2 -0.1 0 0.1 0.2 0.3 0.4 0.5
S
Surface pressure distribution as affected by the momentum injection U c2 /U with Uci /U held fixed at 1: c) a = 10°,

S
-3-0.5 -0.4 -0.3 -0.2 -0.1 0 0.1 0.2 0.3 0.4 0.5
Surface pressure distribution as affected by the momentum injection U c2 /U with Uci /U held fixed at 1: d) a = 15°.

1
0
Cp
-1
-2
-3-0.5 -0.4 -0.3 -0.2 -0.1 0 0.1 0.2 0.3 0.4 0.5
S
Surface pressure distribution as affected by the momentum injection Uc2 /U with Uci /U held fixed at 1: e) a = 20°.

1
0
C p
- 1
-2
-3-0.5 -0.4 -0.3 -0.2 -0.1 0 0.1 0.2 0.3 0.4 0.5
S
Surface pressure distribution as affected by the momentum injection U c2 /U with Uci /U held fixed at 1: 0 a = 30°.

1
0
Cp
-1
-2
-3-05 -0.4 -0.3 -0.2 -0.1 0 0.1 0.2 0.3 0.4 0.5
S
Surface pressure distribution as affected by the momentum injection Uc2 /U with Ucl /U held fixed at 1: g) a = 40°.

S
Surface pressure distribution as affected by the momentum injection Uc2 AI with Ucl X held fixed at 1: h) a = 45°.