Embed Size (px)
DESCRIPTION
report
Citation preview
1
How Pakistan is Coping with the Challenge of High
Oil Prices
Afia Malik
Pakistan Institute of Development Economics
2
1. Introduction
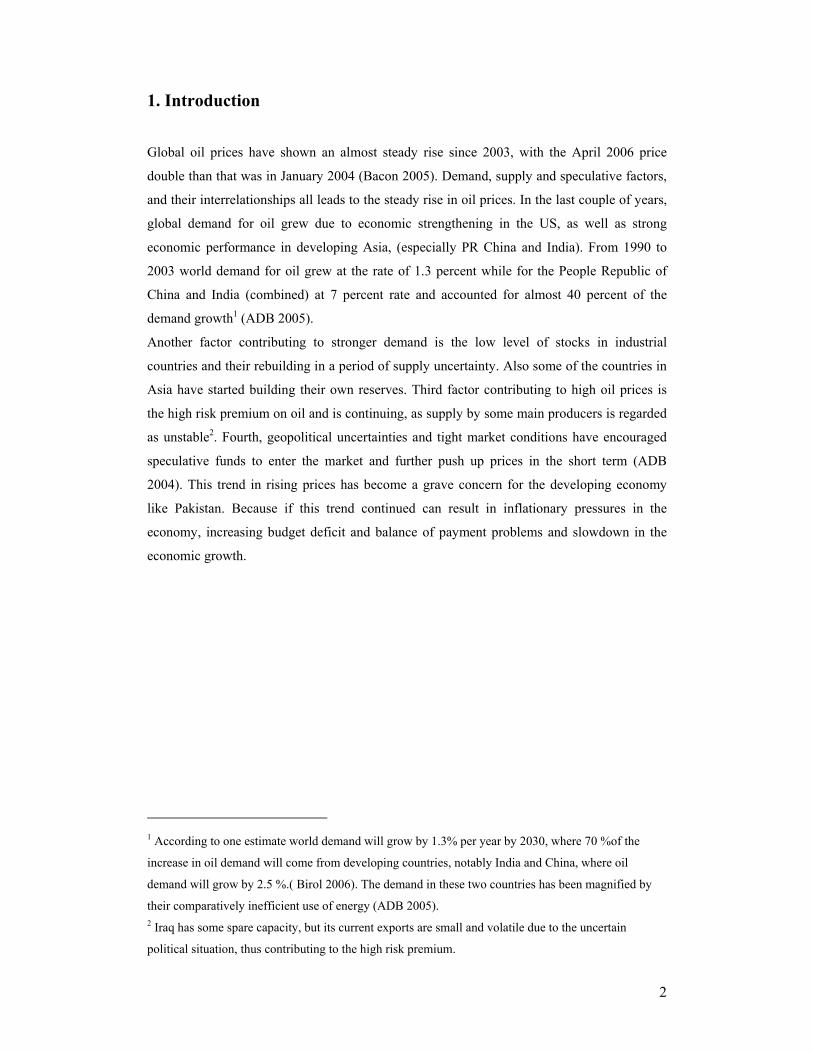
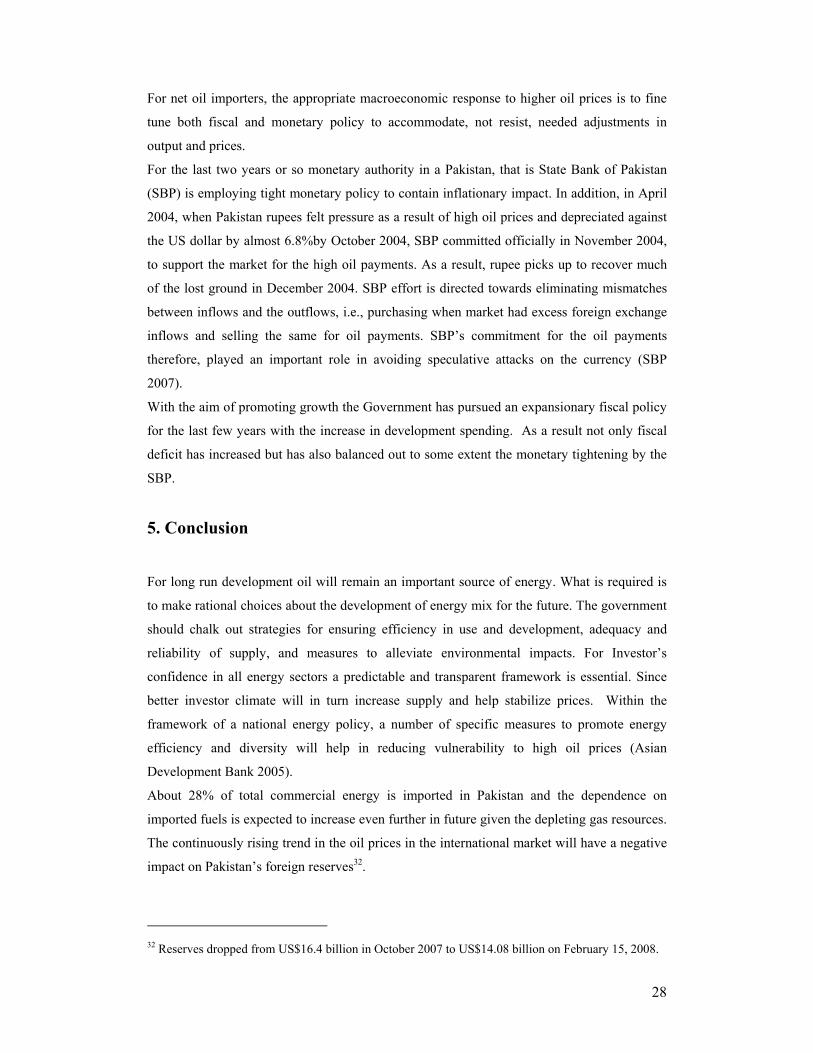
Global oil prices have shown an almost steady rise since 2003, with the April 2006 price
double than that was in January 2004 (Bacon 2005). Demand, supply and speculative factors,
and their interrelationships all leads to the steady rise in oil prices. In the last couple of years,
global demand for oil grew due to economic strengthening in the US, as well as strong
economic performance in developing Asia, (especially PR China and India). From 1990 to
2003 world demand for oil grew at the rate of 1.3 percent while for the People Republic of
China and India (combined) at 7 percent rate and accounted for almost 40 percent of the
demand growth1 (ADB 2005).
Another factor contributing to stronger demand is the low level of stocks in industrial
countries and their rebuilding in a period of supply uncertainty. Also some of the countries in
Asia have started building their own reserves. Third factor contributing to high oil prices is
the high risk premium on oil and is continuing, as supply by some main producers is regarded
as unstable2. Fourth, geopolitical uncertainties and tight market conditions have encouraged
speculative funds to enter the market and further push up prices in the short term (ADB
2004). This trend in rising prices has become a grave concern for the developing economy
like Pakistan. Because if this trend continued can result in inflationary pressures in the
economy, increasing budget deficit and balance of payment problems and slowdown in the
economic growth.
1 According to one estimate world demand will grow by 1.3% per year by 2030, where 70 %of the
increase in oil demand will come from developing countries, notably India and China, where oil
demand will grow by 2.5 %.( Birol 2006). The demand in these two countries has been magnified by
their comparatively inefficient use of energy (ADB 2005). 2 Iraq has some spare capacity, but its current exports are small and volatile due to the uncertain
political situation, thus contributing to the high risk premium.
3
The objective of this paper is to reviews the possible consequences and challenges presented
by high oil prices for Pakistan. The introduction is followed by the review of Pakistan's
energy sector in general and oil sector in particular. In the third section the paper will look at
some of the indicators that will reflect on the oil dependency in Pakistan, that is, why high oil
prices matter for Pakistan. This section will also express some views on the possible impact
of high oil prices in Pakistan at the macroeconomic level. In section four, a brief reflection on
policy responses required to counter structurally high oil prices. Final section is the
conclusion.
2. Pakistan Energy Sector Scenario
Pakistan with a population of more than 150 million has been on the path of rising GDP
growth for the last three four years, where GDP growth reaching 8.4 percent in 2004-05, 6.6
percent in 2005-06, and a moderate recovery in 2006-07 with real GDP growth reaching 7
percent. Energy sector has a direct link with the economic development of a country. In line
with the rising growth rate of GDP demand for energy has also grown rapidly. Per capita
energy consumption of the country is estimated at 14 million Btu3, the energy consumption
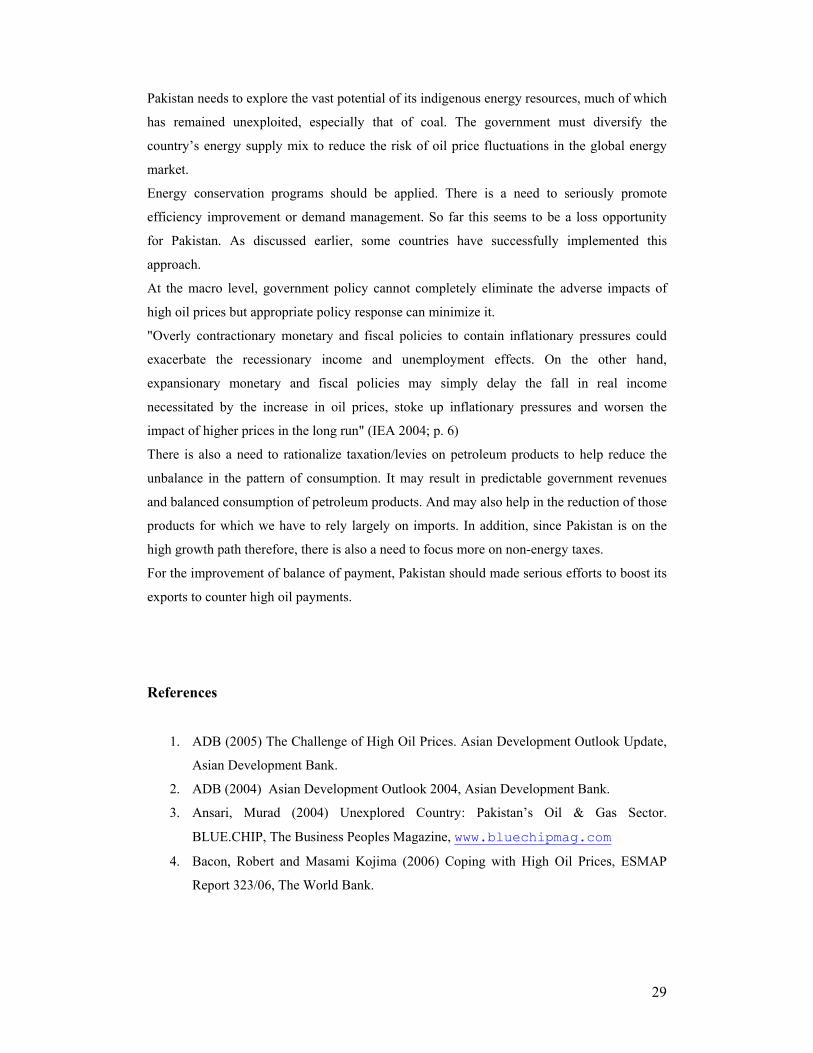
has grown at an annual average rate of 4.4 percent from 1990-91 to 2005-064. Figure 2 below
3 Although it is only a fraction of other industrialising countries in the region as Thailand and Malaysia. 4 Pakistan Energy Book (various years) is used for energy data.
Figure 1. World Oil Prices US$ per Barrel
0.00
10.00
20.00
30.00
40.00
50.00
60.00
70.00
80.00
90.00
100.00
1970 1975 1980 1985 1990 1995 2000 2005
Years
Nominal Real
4
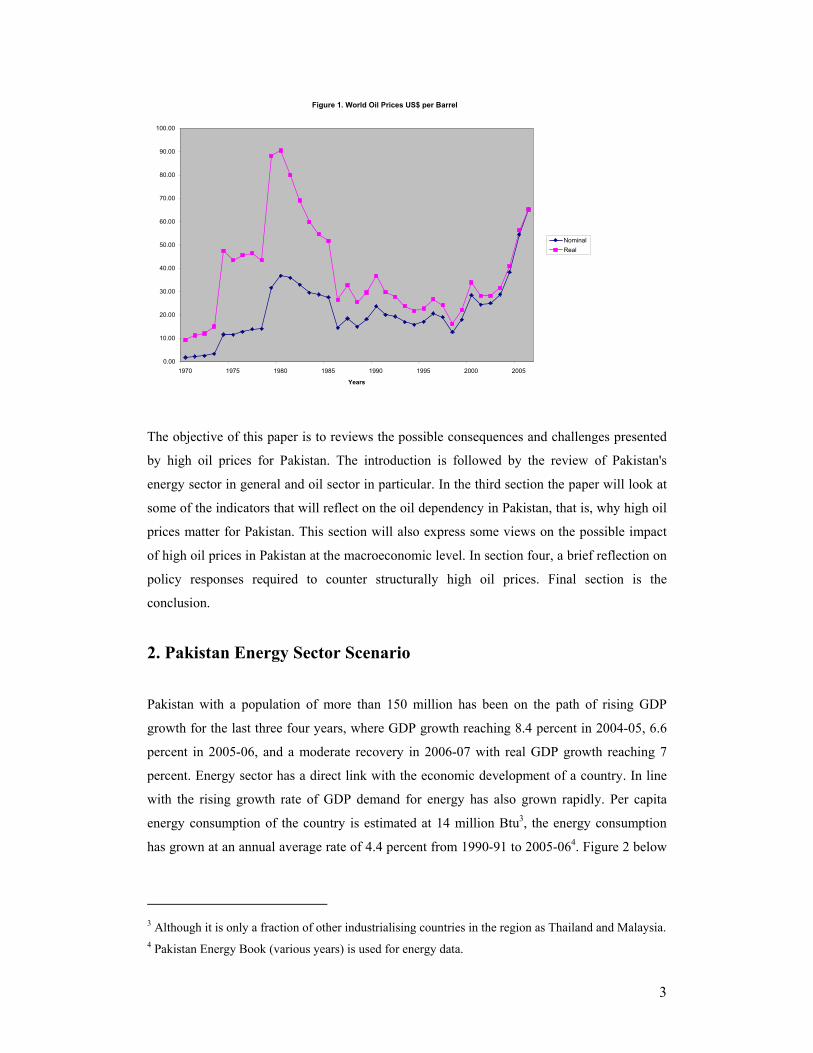
demonstrates the energy mix in 2005-06, where oil accounts for 32 percent of the total energy
used.
Figure 2. Energy Consumption in 2005-06
Oil32%
Gas39%
Coal11%
Electricity16%
LPG2%
Figure 3 shows the trend in the use of different sources of energy in the last six years. Oil
consumption although has declined in the last few years but still accounts for 32 percent of
the total energy consumed. This much of oil consumption along with almost flat oil
production (Figure 4) in Pakistan has led to rising crude oil imports from Middle East
exporters (Saudi Arab playing the lead role). In addition, limited refining capacity leads to
heavy dependence on the imports of petroleum products. According to the Ministry of
Petroleum and Natural Resources (MPNR) the demand of petroleum products in the country
is about 16 million tons out of which only 18 % are met through local resources while the
balance 82 % is met through imports. Therefore, the international oil price fluctuations have a
direct impact on the oil prices in the local market.

5
Figure 4
2.1 Oil Reserves and Refining Capacity
Pakistan has oil reserves of around 300 million barrels as on June 2006 (Table 1). The major
part of produced oil comes from the reserves located in the southern half of the country,
where the three largest oil producing fields are located (in the Southern Indus Basin). In
addition, some producing fields are located in the middle and upper Indus Basins. Since the
late 1980s, Pakistan has not experienced many new oil fields. As a result oil production has
remained fairly flat, at around 60,000 barrels per day. While there is no prospect for Pakistan
to reach self sufficiency in oil, the government has encouraged private (including foreign)
firms to develop domestic production capacity.
In the downstream oil sector there are seven refineries working in Pakistan as on 01.07.2006,
with the total capacity of refining 284660 barrels per day or 12.88 million tons per annum
(MPNR 2005-06).
Figure 3. Energy Consumption
0
5000000
10000000
15000000
20000000
25000000
30000000
2000-01 2001-02 2002-03 2003-04 2004-05 2005-06
TOE Oil products GasCoal
6
In the oil marketing sector there are nine Oil Marketing Companies (OMCs) operating in
Pakistan. Pakistan State Oil (PSO) state owned company is the oil market leader in Pakistan
having around 78% share of Black Oil market and around 57% share of White Oil market. It
is engaged in import, storage, distribution and marketing of various petroleum products,
including Mogas, HSD, Fuel Oil, Jet Fuel, LDO, SKO, petro-chemicals, LPG and CNG. PSO
was historically the sole importer of finished products and remains the largest importer and
owns a well developed infrastructure for this purpose. The main OMC besides Pakistan State
oil (PSO), are Caltex and Shell.
Table 1. Crude Oil Reserves as on June 30
Original recoverable Reserves Cumulative Production Balance Recoverable Reserves
(million barrels) (million TOE) (million barrels) (million TOE) (million barrels) (million TOE)
2006 883.471 118.52 558.998 74.99 324.473 43.53
Source: Pakistan Energy Yearbook 2006
Table 2. Crude Oil Production
U.S. Barrels TOE Barrels per day Annual growth rate
2000-01 21083621 2828498 57763 3.66%
2001-02 23195048 3111759 63548 10.01%
2002-03 23457844 3147014 64268 1.13%
2003-04 22624943 3035275 61817 -3.81%
2004-05 24118780 3235683 66079 6.89%
2005-06 23935630 3211112 65577 -0.76%
Source: Pakistan energy yearbook 2006
Total 3. Crude Processed (Tonnes)
Local Imported Total Total in TOE
2000-01 2290103 6701374 8991477 9217983
2001-02 2549520 7032646 9582166 9819869
2002-03 2640258 7116881 9757139 9997690
2003-04 2688234 7781793 10470027 10733052
2004-05 2963615 8370557 11334172 11616547
2005-06 2839085 8511595 11350680 11638372
Annual growth rate 4.4% 4.9% 4.8% 4.8%
Source: Pakistan Energy yearbook 2006
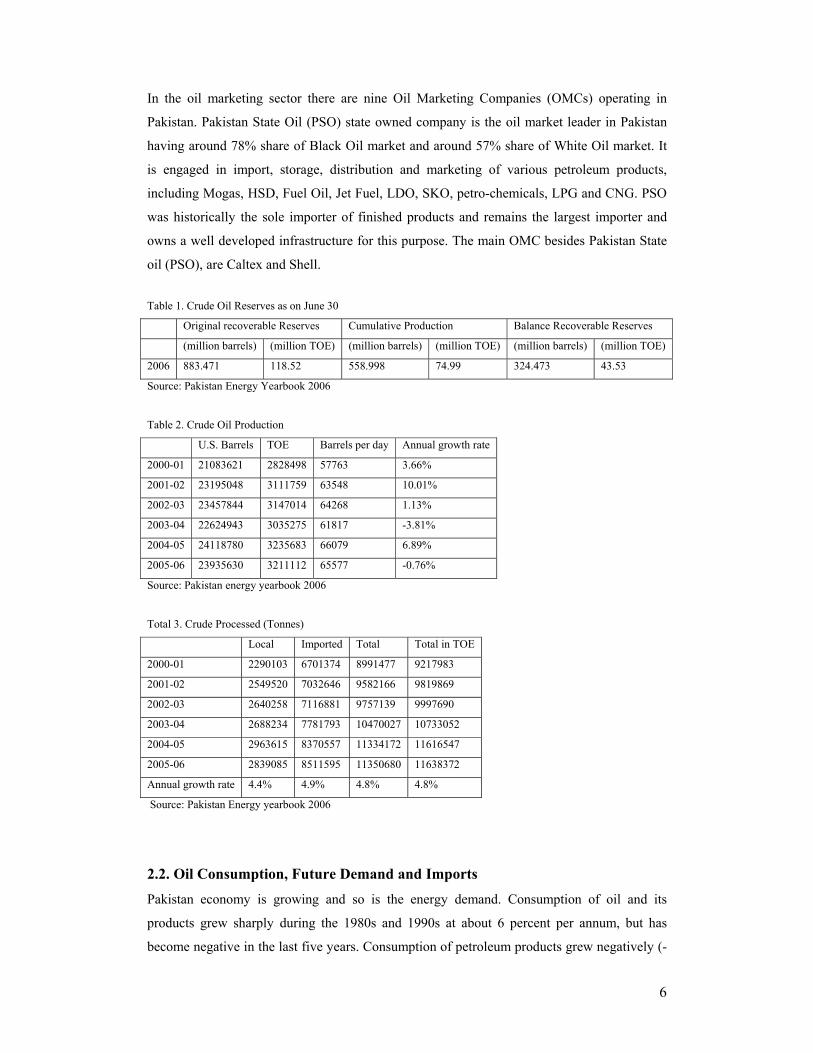
2.2. Oil Consumption, Future Demand and Imports
Pakistan economy is growing and so is the energy demand. Consumption of oil and its
products grew sharply during the 1980s and 1990s at about 6 percent per annum, but has
become negative in the last five years. Consumption of petroleum products grew negatively (-
7
3.4 %) in between 2000-01 and 2005-06 (Table 4). In 2005-06 Pakistan consumes 16 million
TOE of petroleum products (in Table 4 below non-energy products consumed are not
included). Out of which almost 15 million TOE are energy products. Diesel despite negative
growth in the last five years accounts for 52 % of total oil (energy) products consumed, motor
spirit accounts for 8.4%, aviation fuel 5 %, kerosene 2%, and HOBC accounts for a very
minor share of 0.06 %. Table 4. Petroleum Products Consumption
Product 2000-01 2005-06 Growth
Furnace Oil 7973775 4926797 -9.20%
Motor Spirit 1031566 1259369 4.07%
HOBC 16118 9342 -10.30%
HSD 7346450 7673581 0.90%
Aviation Fuel 651125 744716 2.72%
Kerosene 471671 242983 -12.42%
Light Diesel Oil 293316 131340 -14.8%
Total 17784021 14988128 -3.36%
Source. Pakistan Energy Yearbook 2006
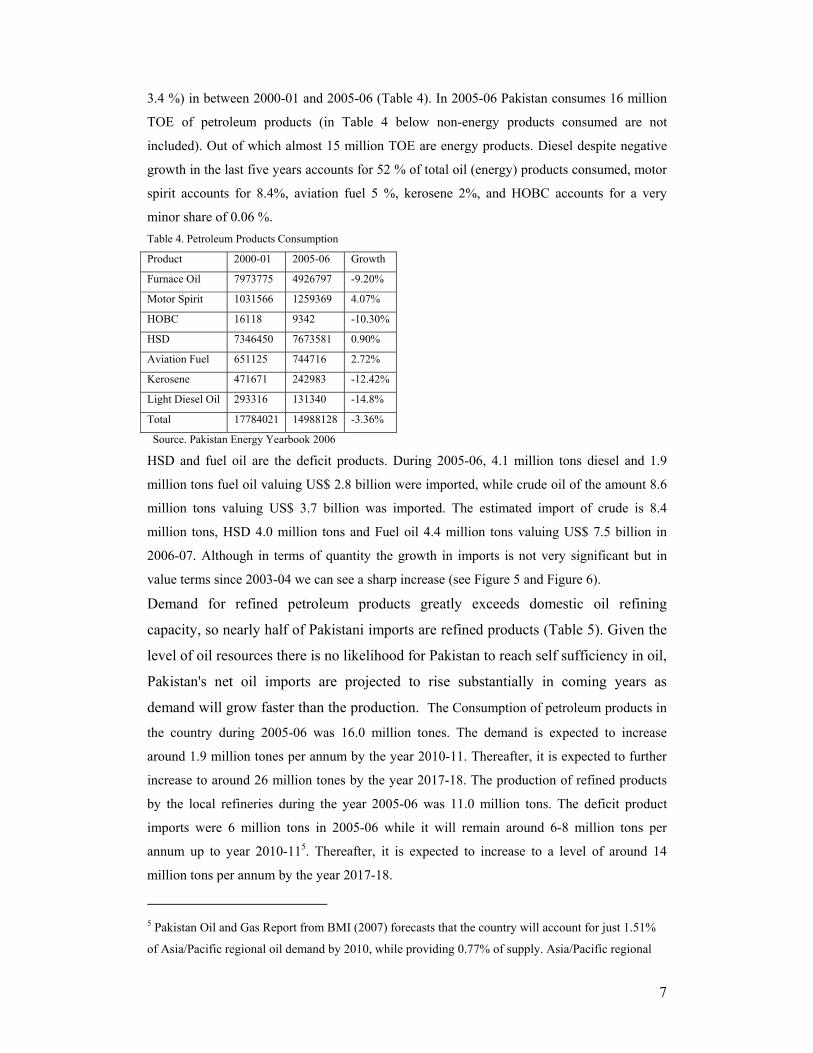
HSD and fuel oil are the deficit products. During 2005-06, 4.1 million tons diesel and 1.9
million tons fuel oil valuing US$ 2.8 billion were imported, while crude oil of the amount 8.6
million tons valuing US$ 3.7 billion was imported. The estimated import of crude is 8.4
million tons, HSD 4.0 million tons and Fuel oil 4.4 million tons valuing US$ 7.5 billion in
2006-07. Although in terms of quantity the growth in imports is not very significant but in
value terms since 2003-04 we can see a sharp increase (see Figure 5 and Figure 6).
Demand for refined petroleum products greatly exceeds domestic oil refining
capacity, so nearly half of Pakistani imports are refined products (Table 5). Given the
level of oil resources there is no likelihood for Pakistan to reach self sufficiency in oil,
Pakistan's net oil imports are projected to rise substantially in coming years as
demand will grow faster than the production. The Consumption of petroleum products in
the country during 2005-06 was 16.0 million tones. The demand is expected to increase
around 1.9 million tones per annum by the year 2010-11. Thereafter, it is expected to further
increase to around 26 million tones by the year 2017-18. The production of refined products
by the local refineries during the year 2005-06 was 11.0 million tons. The deficit product
imports were 6 million tons in 2005-06 while it will remain around 6-8 million tons per
annum up to year 2010-115. Thereafter, it is expected to increase to a level of around 14
million tons per annum by the year 2017-18.
5 Pakistan Oil and Gas Report from BMI (2007) forecasts that the country will account for just 1.51%
of Asia/Pacific regional oil demand by 2010, while providing 0.77% of supply. Asia/Pacific regional
8
Table 5: Petroleum products Demand / Supply Forecast (in Million tons)
2006-07 2011-12 2016-17
Demand of Petroleum Products 17.5 22.4 28.4
Production from Local Refineries 11.0 12.4 13.2
Surplus Naptha/ Motor Gasoline available for Exports 1.0 1.3 1.5
Deficit of HSD and FO 8.4 11.3 16.6
Source: Ministry of Petroleum and Natural Resources.
Even if the high cost of oil imports is managed, the country lacks the necessary infrastructure
to handle the increasing volumes of imported oil. Since prices are rising swiftly there is a
need for huge investment to improve the infrastructure (i.e., refinery) to reduce the import bill
of the country. The government has given incentives in the form of Petroleum policy 1997 to
attract private investors (see Appendix A1). But the current situation is far from satisfactory.
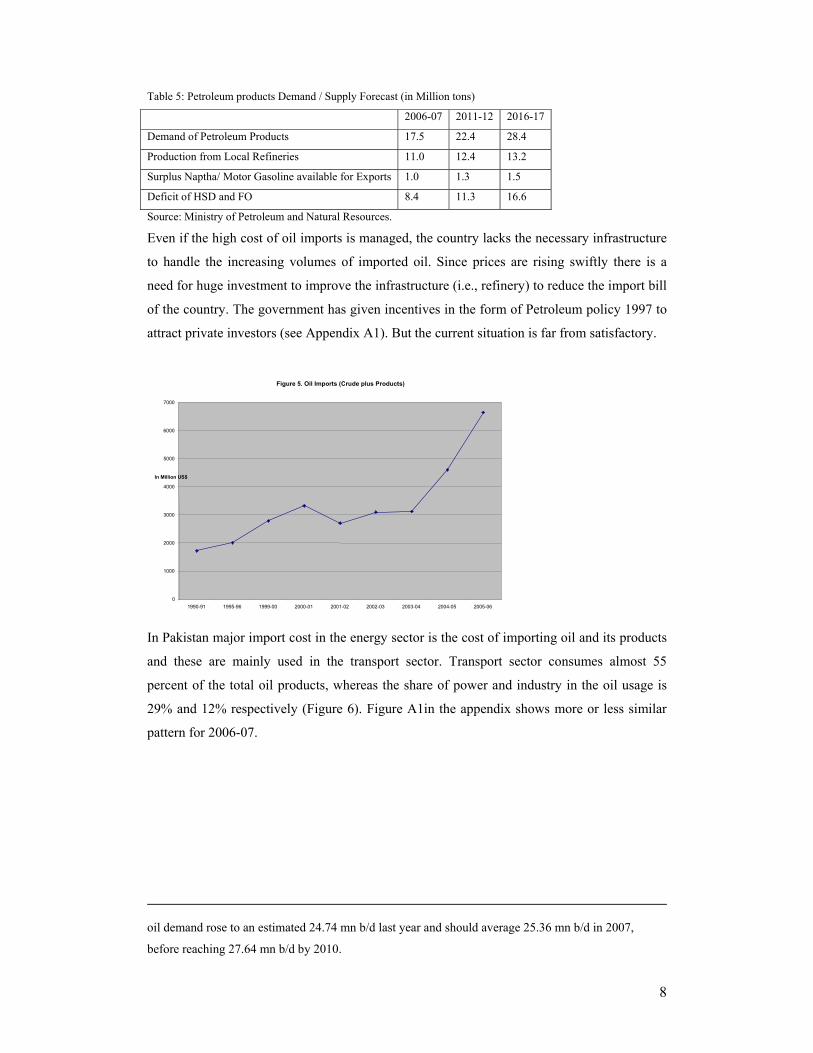
In Pakistan major import cost in the energy sector is the cost of importing oil and its products
and these are mainly used in the transport sector. Transport sector consumes almost 55
percent of the total oil products, whereas the share of power and industry in the oil usage is
29% and 12% respectively (Figure 6). Figure A1in the appendix shows more or less similar
pattern for 2006-07.
oil demand rose to an estimated 24.74 mn b/d last year and should average 25.36 mn b/d in 2007,
before reaching 27.64 mn b/d by 2010.
Figure 5. Oil Imports (Crude plus Products)
0
1000
2000
3000
4000
5000
6000
7000
1990-91 1995-96 1999-00 2000-01 2001-02 2002-03 2003-04 2004-05 2005-06
In Million US$
9
2.3. Crude oil and Petroleum Product Pricing in Pakistan
2.3.1. Deregulation
Until 1999, the government had tight control over the petroleum sector in Pakistan. All the
decisions were made solely by the government and were often based on political as opposed
to economic considerations. Petroleum product prices were under tight government
regulation. Since 2000, the government has initiated an ambitious pro-market reform
programme in the sector. The objective behind these market base policies was to limit the
government role to only policy related issues, and pricing and regulatory responsibilities
passing to an independent regulatory authority.
The government also changed the guaranteed return formula of the refineries to an Import
Parity Price (IPP) formula. Previously, the refineries were working under a fixed return
formula where the return was capped in the range of 10-40% of their equity. Thus,
Figure 6. Oil Imports (Crude plus Products)
0
2000000
4000000
6000000
8000000
10000000
12000000
14000000
16000000
18000000
20000000
1990-91 1995-96 1999-00 2000-01 2001-02 2002-03 2003-04 2004-05 2005-06
Qty. in TOE
Figure 7. Oil Consumption by Sector 2005-06
Domestic1% Industrial
12%
Agriculture1%
Transport55%
Power29%
Other Govt2%
10
government was liable to meet any loss in the profitability of the refineries. Under the new
formula, an import tariff is applied to the FOB price of the petroleum product to determine the
ex-refinery prices. The import protection is essentially the margins of the refineries (Ansari
2004).
Here it would be useful to add that the bulk of the crude oil requirement of Pakistan refineries
is met through government to government contracts with Saudi Arabia. The terms of these
contracts are not made public and refineries are charged market (international) related prices,
any benefit or discount goes to the government6. Domestic crude is supplied to the refineries
at prices consistent with the policy applicable at the time the concession was awarded.
In 2001, the government authorized the Oil Companies Advisory Committee (OCAC) to
review, fix and announce the prices of petroleum products on fortnightly basis in accordance
with the approved pricing formula with effect from July 1, 2001 as a part of deregulation
policy. Therefore, between July 1, 2001 and April 1, 2006, OCAC reviewed and announced
the ex-depot prices of motor spirit (gasoline), kerosene, and light diesel oil fortnightly in
accordance with the approved formula (Table A1). Later on, the function of price fixation was
transferred to Oil and Gas Regulatory Authority (OGRA). Since April 16, 2006 OGRA is
responsible for price notification.
In the pricing formula, ex-refinery price (or import parity price (IPP)) are determined on the
basis of average fortnightly prices of petroleum products in international market (Arab Gulf
market) (see details in Appendix A2 and A3). Other components are customs and excise duty,
petroleum development levy (PDL), distribution margin for oil marketing companies
(currently 3.5% of ex-depot sale price), dealer's commission (4 %) and a 15% sales tax. Most
components of the end user price, other than IPP are relatively stable, although the
government has often adjusted PDL in an ad-hoc fashion to keep the final price constant.
Government decides to increase, decrease or maintain the consumer prices by making
adjustments in PDL through its notifications issued under Petroleum Products (Petroleum
Development Levy) Ordinance, 1961 (XXV of 1961). Government advises PDL on
fortnightly basis to OGRA (for current petroleum product price build up see Table A1 & A2).
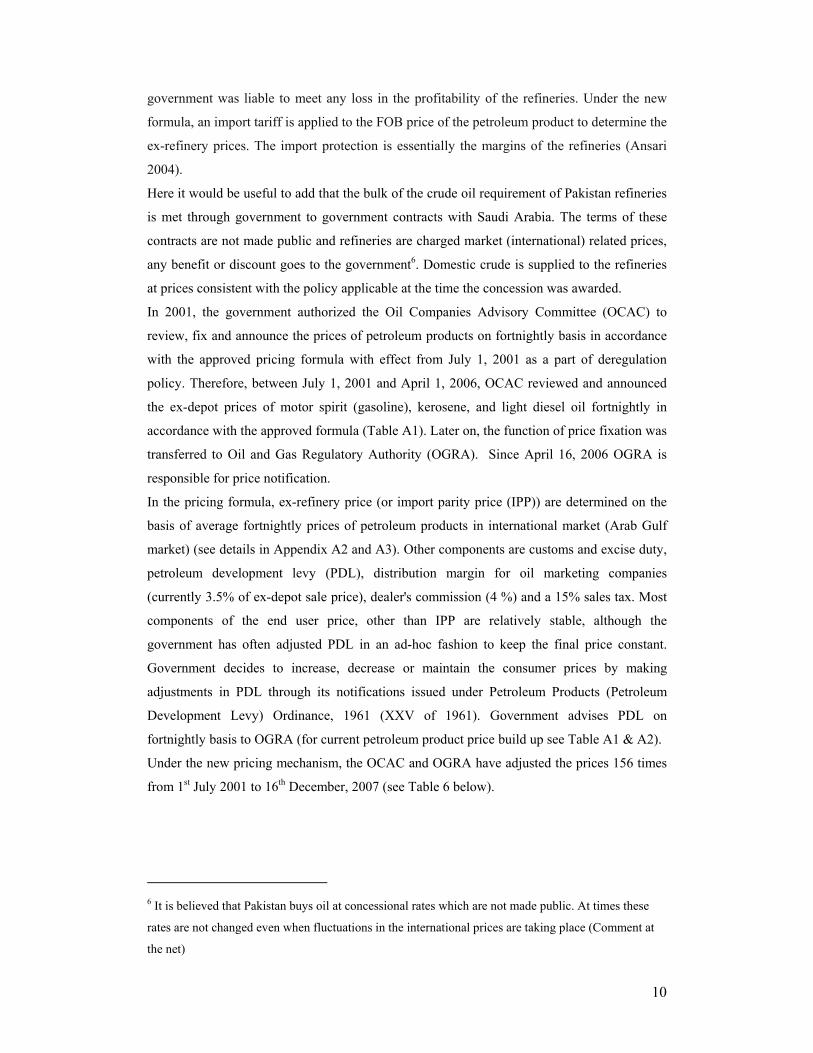
Under the new pricing mechanism, the OCAC and OGRA have adjusted the prices 156 times
from 1st July 2001 to 16th December, 2007 (see Table 6 below).
6 It is believed that Pakistan buys oil at concessional rates which are not made public. At times these
rates are not changed even when fluctuations in the international prices are taking place (Comment at
the net)
11
Table 6. Price Adjustments (01.07.2001 to 16.12.2007)
Petrol (Motor Spirit) High Speed Diesel
No of times prices increased 46 43
No of times prices decreased 24 21
Unchanged 86 88
Source: OGRA and OCAC
Apart from components described above, Government continues to allow inland freight
equalisation margin (IFEM) to oil marketing companies that varies (currently between Rs2
and Rs7) on different petroleum products. It goes up and down without any prescribed
formula. The IFEM is charged on all petroleum products to maintain uniform rates at 29
depots across the country. This is a primary transportation cost representing actual cost
without including any profit element for the marketing companies. The auditors facilitate the
settlements between OMCs and Oil Refineries under IFEM mechanism on a quarterly basis.
OMCs pass refinery freight to refineries through fortnightly billing on uplifted products.
OGRA has now directed OMCs including PARCO and ARL to provide certificates of actual
transportation cost for current months by the end of subsequent month, duly verified by their
respective Chief Executives (OGRA 2006).
When we look at the price build up formula in the last few years it is revealed that IFEM has
been changing over time (even fortnightly) for all the products, sometimes moving up and
sometimes moving down.
Since 2000, oil imports have been deregulated; as a result all licensed refineries are free to
import crude oil. The government gradually lifted controls on the imports of petroleum
products. All licensed oil marketing companies (OMCs) are now free to import as per their
requirements7. However, they are required to first meet their requirement from the local
refineries and then meet any deficit through imports. Prior to that petroleum imports were
carried through Pakistan State Oil, the state owned oil marketing company. None of the
private company was allowed to import directly. After market based reforms, the margins of
oil marketing companies has been increased and now capped at 3.5% of the retail price of the
petroleum product.
Despite government move towards market liberalization, competition level on the supply side
of the oil industry is almost insignificant. It is the lack of proper incentives not giving space to
competition and efficient operation of companies. As a result no benefits of market reforms
7 Import duties of 6% on kerosene and LDO and 10% on HSD have been imposed since July 2002,
offering protection to domestic refineries. Fuel oil and aviation fuel have been fully deregulated; HSD
is partially deregulated (World Bank 2003). Crude oil, motor spirit, aviation spirit, spirit type jet fuel,
JPI, furnace oil and MTBE are exempted from import duty. The import of crude petroleum and furnace
oil is quite significant (Ministry of Finance 2008).
12
have so far trickled down to consumers. Regulatory benefits are going mainly to industry
(through protected profits). There is a need for a level playing field to enable competition
(World Bank 2003).
2.3.2. Capping of Sale Price
Despite deregulation in the oil sector, some elements of regulation have still remained its part.
The international prices of crude oil are increasing sharply since 2003; creating disturbing
situation for the economy, which is dependent largely on imports for its petroleum products
demand. This prompted the government to strengthen its control of the sector.
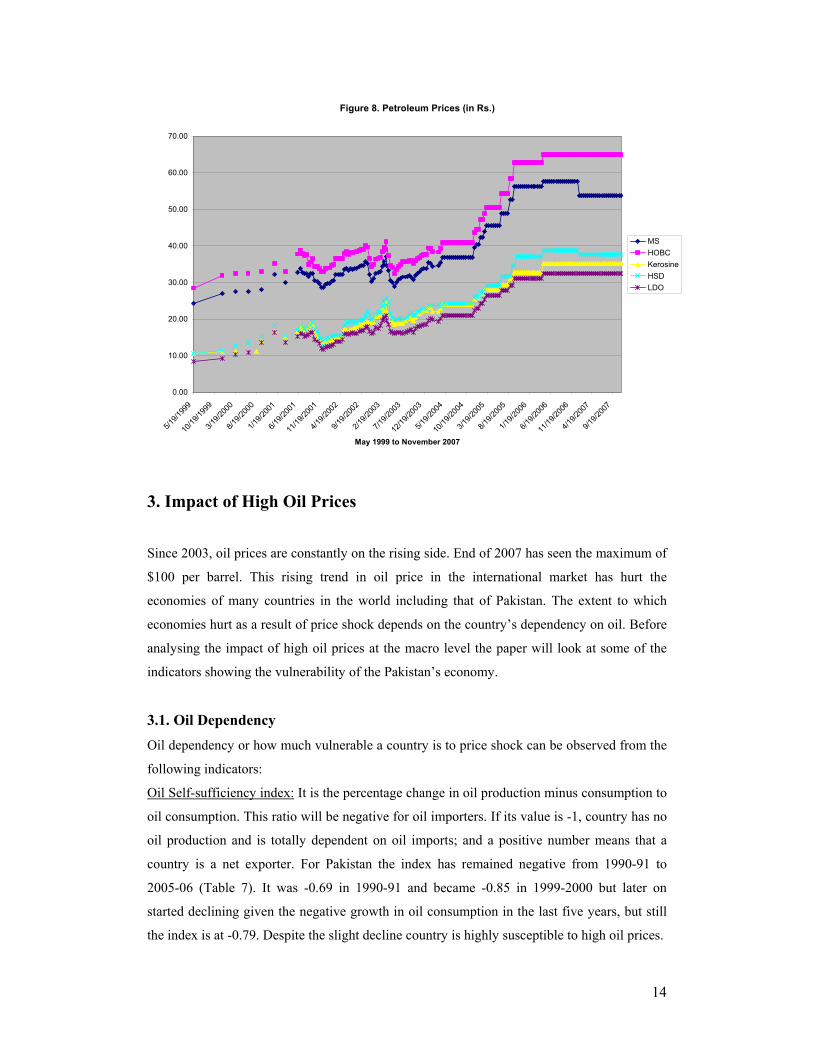
To protect the consumer from the impact of high prices government has capped the domestic
sale prices of petroleum products on and off (May to December 2004, April to June 2005, 16th
July to 30th August 2005, October 2005 to April 2006, 16th May, 2006 to 1st January, 2007
and 1st February 2007 to date). The straight lines in prices in Figure 8 indicate Government's
attempt at price smoothing.
Since 16th January 2007 prices of motor spirit has remained unchanged; while prices of
HOBC, Kerosene and LDO have remained unchanged since 1st May 2006. The maximum
price of motor spirit and HSD reached so far was Rs. 57.7 and Rs. 38.73 respectively from 1st
May, 2006 to 15th January 2007. The government has made adjustments in Petroleum
Development Levy (PDL) (other taxes were not changed) to absorb the impact of increase in
international price, thus loss to government revenue as PDL is a significant contributor to
indirect taxes8. The argument for changes in PDL is, to act as a short-term hedging
mechanism, that is, a device to offset temporary changes in international oil prices as well as
the rupee dollar parity to keep retail prices constant (Khan and Ali 2000). This rate is different
for different products. It is highest for HOBC. It reaches to even Rs. 23.69 in October 2006
(highest ever in the last few years, when the international price was going down, the
government increased PDL to keep prices constant). At the same time it was Rs. 18.94 for
motor spirit (gasoline), while zero PDL was charged on kerosene and LDO (OGRA 2008).
In addition, the government introduced a Price Differential Claim (PDC) on August 16, 2004.
The objective is to reimburse oil companies for the subsidy to consumers. The PDC
particularly targeted kerosene and diesel. Negative PDC was charged till November 01, 2005
(that is, the fuels were subsidized) between August 16 and December 15, 2004, and between
8 Loss in PDL is estimated to be around Rs. 20 Billion until April 2007 despite downward revision in
PDL budget targets. There is no PDL budget as revenue to government of Pakistan for the current year
2006-07. The total hit in revenue taken by the government of Pakistan till April 2007 is almost Rs 69.5
billion. The total PDC due to price capping till April 2007 is around Rs 50 Billion. (MPNR).
13
March 16, and November 15, 2005. The PDC for motor spirit and HOBC became negative
from September 01, 2004 to November 30, 2004.
According to government sources, prices of petroleum products in the international (Arab
Gulf) market have increased in the range of 91 % to 104 % during the period May 2004 to
April 2007, against this increase domestic sale prices have increased from 45 % to 55% in the
same period9 (see Table A3 and Table A4 ). Despite the partial increase, government is
subsidising the price of kerosene by Rs. 6.20 per litre, HSD by Rs. 4.03 per litre and LDO by
Rs. 5.90 per litre. Also there is no PDL on these products (MPNR 2008).
The government claimed that if the international prices had passed on entirely to the
government, the prices of kerosene and diesel would have increased by Rs. 17 and Rs. 15 per
litre, respectively. However, the government has never mentioned the fact that the prices of
Motor Spirit and HOBC could also be reduced by Rs. 14 and Rs. 24, respectively. Moreover,
naphtha, which is a surplus produce is exported at the rate of Rs. 40 per litre and sold in the
domestic market at Rs. 54 per litre10 (Kiani 2007). Government has fixed the price of
kerosene at Rs. 35. But in the winter season kerosene was sold at the rate of Rs. 45 per litre
and in some areas at the rate of Rs. 50, but there was no regulatory check on these price
irregularities.
9 Bacon and Kojima (2006) estimated the pass through coefficient of international prices at the retail
level equivalent to 1.98 for motor spirit (MS) and 0.78 for diesel in Pakistan (between January 2004 to
April 2006), indicating the increase at the retail level more than fifty percent than the international
price for MS but for diesel government is less willing to pass on the international price at the retail
level. 10 May be because of the sales tax exemption on the quantity which is exported.
14
Figure 8. Petroleum Prices (in Rs.)
0.00
10.00
20.00
30.00
40.00
50.00
60.00
70.00
5/19/1
999
10/19
/1999
3/19/2
000
8/19/2
000
1/19/2
001
6/19/2
001
11/19
/2001
4/19/2
002
9/19/2
002
2/19/2
003
7/19/2
003
12/19
/2003
5/19/2
004
10/19
/2004
3/19/2
005
8/19/2
005
1/19/2
006
6/19/2
006
11/19
/2006
4/19/2
007
9/19/2
007
May 1999 to November 2007
MSHOBCKerosineHSDLDO
3. Impact of High Oil Prices
Since 2003, oil prices are constantly on the rising side. End of 2007 has seen the maximum of
$100 per barrel. This rising trend in oil price in the international market has hurt the
economies of many countries in the world including that of Pakistan. The extent to which
economies hurt as a result of price shock depends on the country’s dependency on oil. Before
analysing the impact of high oil prices at the macro level the paper will look at some of the
indicators showing the vulnerability of the Pakistan’s economy.
3.1. Oil Dependency
Oil dependency or how much vulnerable a country is to price shock can be observed from the
following indicators:
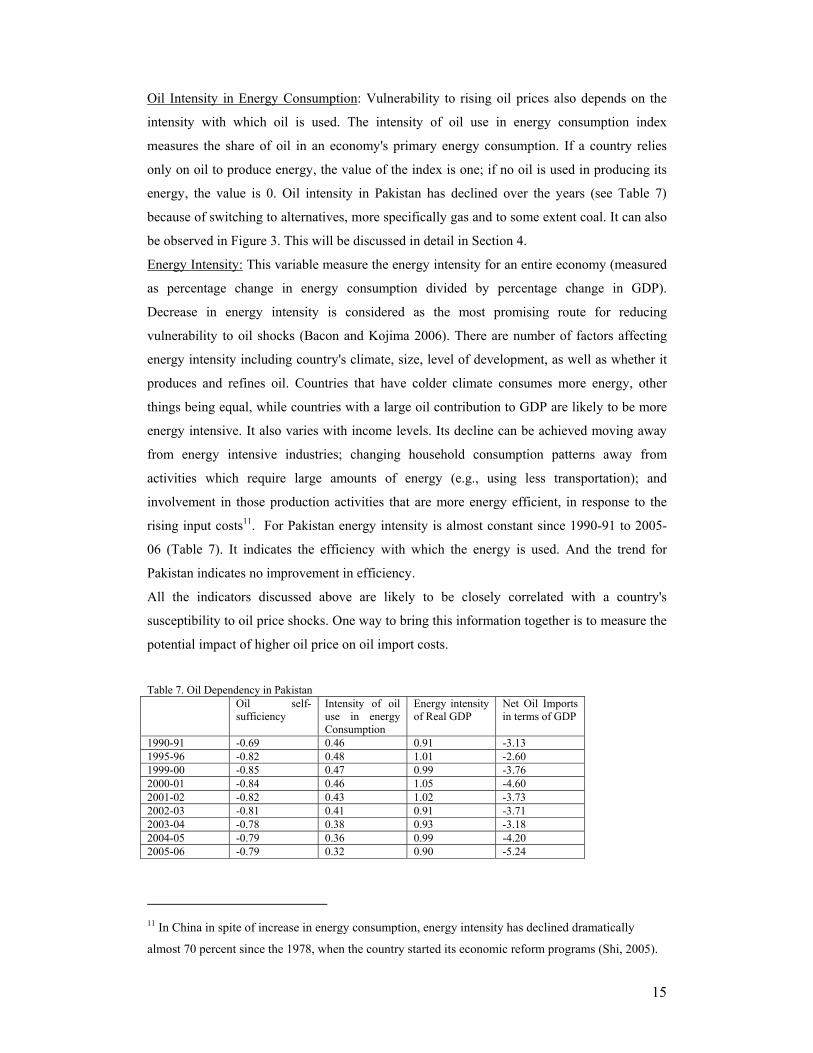
Oil Self-sufficiency index: It is the percentage change in oil production minus consumption to
oil consumption. This ratio will be negative for oil importers. If its value is -1, country has no
oil production and is totally dependent on oil imports; and a positive number means that a
country is a net exporter. For Pakistan the index has remained negative from 1990-91 to
2005-06 (Table 7). It was -0.69 in 1990-91 and became -0.85 in 1999-2000 but later on
started declining given the negative growth in oil consumption in the last five years, but still
the index is at -0.79. Despite the slight decline country is highly susceptible to high oil prices.
15
Oil Intensity in Energy Consumption: Vulnerability to rising oil prices also depends on the
intensity with which oil is used. The intensity of oil use in energy consumption index
measures the share of oil in an economy's primary energy consumption. If a country relies
only on oil to produce energy, the value of the index is one; if no oil is used in producing its
energy, the value is 0. Oil intensity in Pakistan has declined over the years (see Table 7)
because of switching to alternatives, more specifically gas and to some extent coal. It can also
be observed in Figure 3. This will be discussed in detail in Section 4.
Energy Intensity: This variable measure the energy intensity for an entire economy (measured
as percentage change in energy consumption divided by percentage change in GDP).
Decrease in energy intensity is considered as the most promising route for reducing
vulnerability to oil shocks (Bacon and Kojima 2006). There are number of factors affecting
energy intensity including country's climate, size, level of development, as well as whether it
produces and refines oil. Countries that have colder climate consumes more energy, other
things being equal, while countries with a large oil contribution to GDP are likely to be more
energy intensive. It also varies with income levels. Its decline can be achieved moving away
from energy intensive industries; changing household consumption patterns away from
activities which require large amounts of energy (e.g., using less transportation); and
involvement in those production activities that are more energy efficient, in response to the
rising input costs11. For Pakistan energy intensity is almost constant since 1990-91 to 2005-
06 (Table 7). It indicates the efficiency with which the energy is used. And the trend for
Pakistan indicates no improvement in efficiency.
All the indicators discussed above are likely to be closely correlated with a country's
susceptibility to oil price shocks. One way to bring this information together is to measure the
potential impact of higher oil price on oil import costs.
Table 7. Oil Dependency in Pakistan Oil self-
sufficiency Intensity of oil use in energy Consumption
Energy intensity of Real GDP
Net Oil Imports in terms of GDP
1990-91 -0.69 0.46 0.91 -3.13 1995-96 -0.82 0.48 1.01 -2.60 1999-00 -0.85 0.47 0.99 -3.76 2000-01 -0.84 0.46 1.05 -4.60 2001-02 -0.82 0.43 1.02 -3.73 2002-03 -0.81 0.41 0.91 -3.71 2003-04 -0.78 0.38 0.93 -3.18 2004-05 -0.79 0.36 0.99 -4.20 2005-06 -0.79 0.32 0.90 -5.24
11 In China in spite of increase in energy consumption, energy intensity has declined dramatically
almost 70 percent since the 1978, when the country started its economic reform programs (Shi, 2005).
16
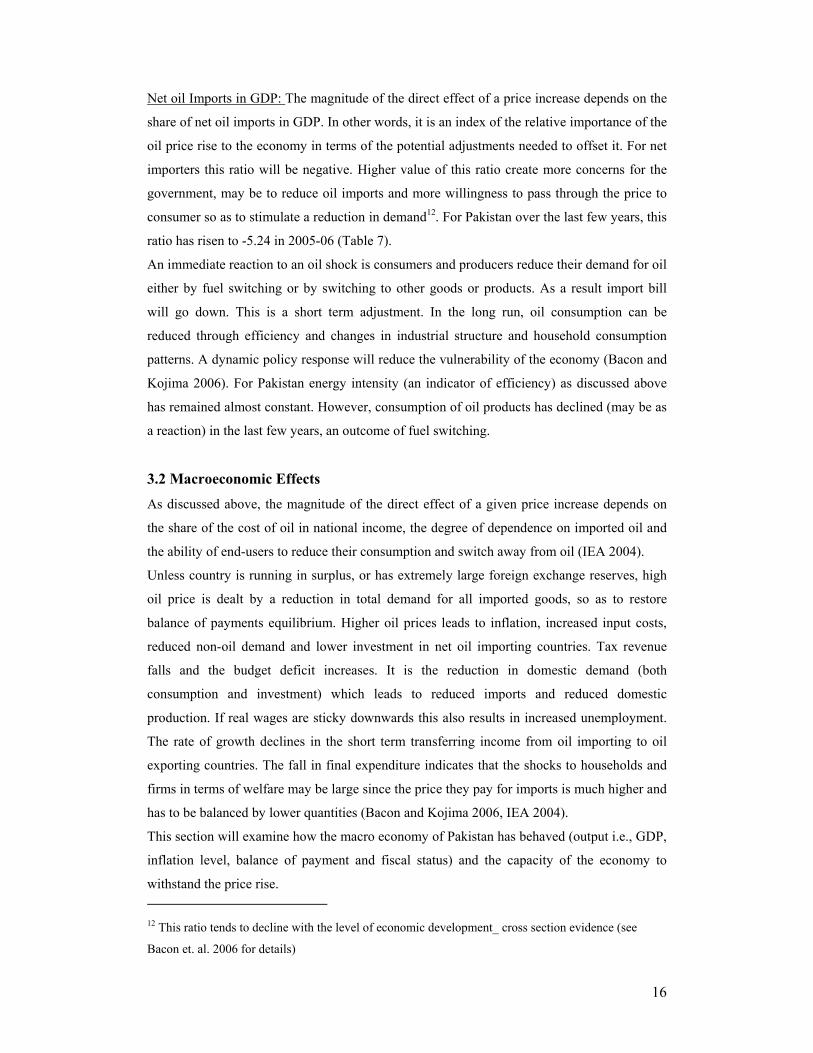
Net oil Imports in GDP: The magnitude of the direct effect of a price increase depends on the
share of net oil imports in GDP. In other words, it is an index of the relative importance of the
oil price rise to the economy in terms of the potential adjustments needed to offset it. For net
importers this ratio will be negative. Higher value of this ratio create more concerns for the
government, may be to reduce oil imports and more willingness to pass through the price to
consumer so as to stimulate a reduction in demand12. For Pakistan over the last few years, this
ratio has risen to -5.24 in 2005-06 (Table 7).
An immediate reaction to an oil shock is consumers and producers reduce their demand for oil
either by fuel switching or by switching to other goods or products. As a result import bill
will go down. This is a short term adjustment. In the long run, oil consumption can be
reduced through efficiency and changes in industrial structure and household consumption
patterns. A dynamic policy response will reduce the vulnerability of the economy (Bacon and
Kojima 2006). For Pakistan energy intensity (an indicator of efficiency) as discussed above
has remained almost constant. However, consumption of oil products has declined (may be as
a reaction) in the last few years, an outcome of fuel switching.
3.2 Macroeconomic Effects
As discussed above, the magnitude of the direct effect of a given price increase depends on
the share of the cost of oil in national income, the degree of dependence on imported oil and
the ability of end-users to reduce their consumption and switch away from oil (IEA 2004).
Unless country is running in surplus, or has extremely large foreign exchange reserves, high
oil price is dealt by a reduction in total demand for all imported goods, so as to restore
balance of payments equilibrium. Higher oil prices leads to inflation, increased input costs,
reduced non-oil demand and lower investment in net oil importing countries. Tax revenue
falls and the budget deficit increases. It is the reduction in domestic demand (both
consumption and investment) which leads to reduced imports and reduced domestic
production. If real wages are sticky downwards this also results in increased unemployment.
The rate of growth declines in the short term transferring income from oil importing to oil
exporting countries. The fall in final expenditure indicates that the shocks to households and
firms in terms of welfare may be large since the price they pay for imports is much higher and
has to be balanced by lower quantities (Bacon and Kojima 2006, IEA 2004).
This section will examine how the macro economy of Pakistan has behaved (output i.e., GDP,
inflation level, balance of payment and fiscal status) and the capacity of the economy to
withstand the price rise. 12 This ratio tends to decline with the level of economic development_ cross section evidence (see
Bacon et. al. 2006 for details)
17
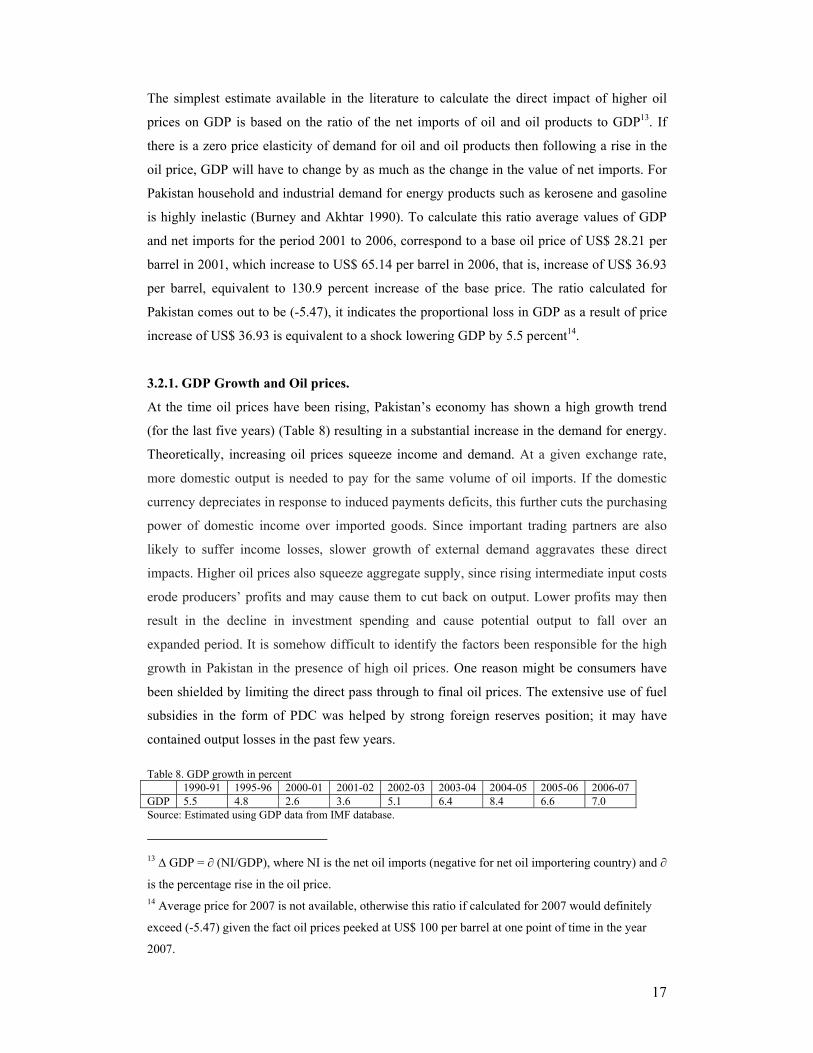
The simplest estimate available in the literature to calculate the direct impact of higher oil
prices on GDP is based on the ratio of the net imports of oil and oil products to GDP13. If
there is a zero price elasticity of demand for oil and oil products then following a rise in the
oil price, GDP will have to change by as much as the change in the value of net imports. For
Pakistan household and industrial demand for energy products such as kerosene and gasoline
is highly inelastic (Burney and Akhtar 1990). To calculate this ratio average values of GDP
and net imports for the period 2001 to 2006, correspond to a base oil price of US$ 28.21 per
barrel in 2001, which increase to US$ 65.14 per barrel in 2006, that is, increase of US$ 36.93
per barrel, equivalent to 130.9 percent increase of the base price. The ratio calculated for
Pakistan comes out to be (-5.47), it indicates the proportional loss in GDP as a result of price
increase of US$ 36.93 is equivalent to a shock lowering GDP by 5.5 percent14.
3.2.1. GDP Growth and Oil prices.
At the time oil prices have been rising, Pakistan’s economy has shown a high growth trend
(for the last five years) (Table 8) resulting in a substantial increase in the demand for energy.
Theoretically, increasing oil prices squeeze income and demand. At a given exchange rate,
more domestic output is needed to pay for the same volume of oil imports. If the domestic
currency depreciates in response to induced payments deficits, this further cuts the purchasing
power of domestic income over imported goods. Since important trading partners are also
likely to suffer income losses, slower growth of external demand aggravates these direct
impacts. Higher oil prices also squeeze aggregate supply, since rising intermediate input costs
erode producers’ profits and may cause them to cut back on output. Lower profits may then
result in the decline in investment spending and cause potential output to fall over an
expanded period. It is somehow difficult to identify the factors been responsible for the high
growth in Pakistan in the presence of high oil prices. One reason might be consumers have
been shielded by limiting the direct pass through to final oil prices. The extensive use of fuel
subsidies in the form of PDC was helped by strong foreign reserves position; it may have
contained output losses in the past few years. Table 8. GDP growth in percent 1990-91 1995-96 2000-01 2001-02 2002-03 2003-04 2004-05 2005-06 2006-07 GDP 5.5 4.8 2.6 3.6 5.1 6.4 8.4 6.6 7.0 Source: Estimated using GDP data from IMF database.
13 ∆ GDP = ∂ (NI/GDP), where NI is the net oil imports (negative for net oil importering country) and ∂
is the percentage rise in the oil price. 14 Average price for 2007 is not available, otherwise this ratio if calculated for 2007 would definitely
exceed (-5.47) given the fact oil prices peeked at US$ 100 per barrel at one point of time in the year
2007.
18
In addition, the continued strong performance of the services sector had made contribution to
the GDP outcome. On the demand side it is the consumption expenditure that has proved to
be the main source of growth in GDP for the last couple of years, here credit flow to private
sector in the form of consumer financing played a significant role15. But since 2006-07
situation has somewhat started changing. Private credit is showing a downward trend16 (Table
9), which may effect GDP growth. Private sector consumed Rs. 23.533 billion from July 1st to
Oct 20th, 2007against Rs. 69.870 billion in the corresponding period last year. Credit to small
and medium enterprises is also on the decline given high interest rates and undocumented
trade (Khan 2008). With this scenario it would be difficult to maintain the high growth
pattern.
High price of oil in the international market, and declining volumes of exports along with
private transfers in 2006-07 resulted in the current account deficit equal to 4.9 percent of GDP
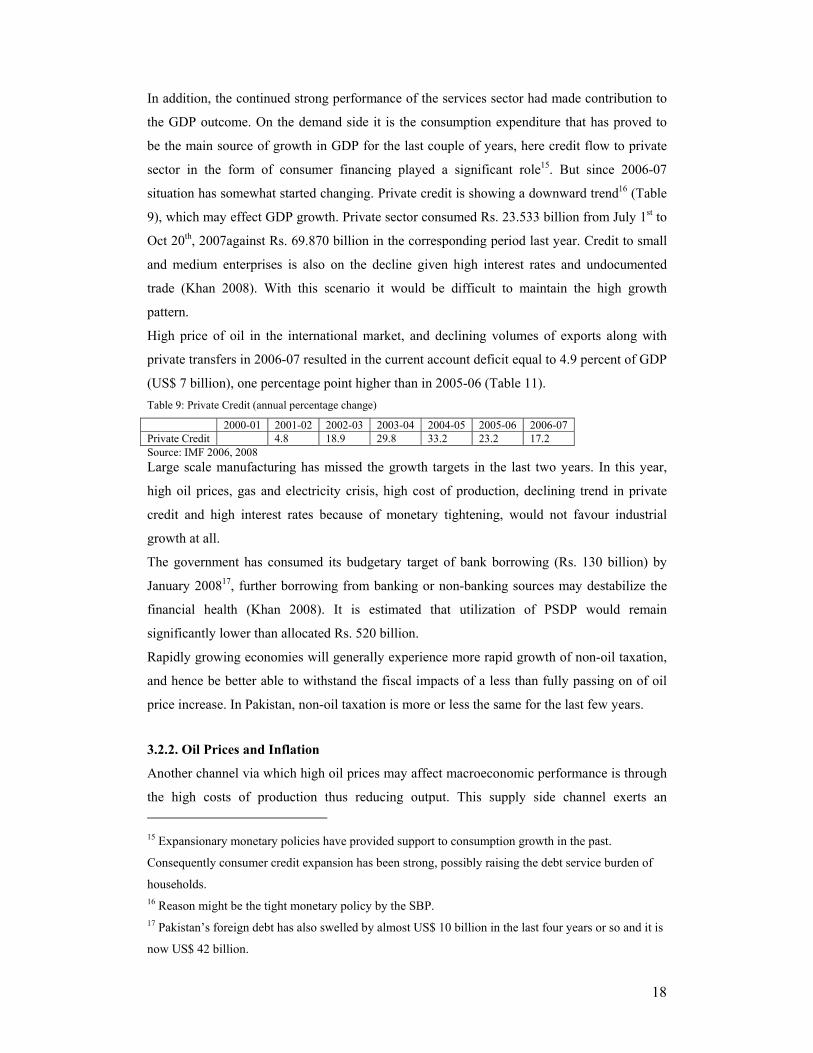
(US$ 7 billion), one percentage point higher than in 2005-06 (Table 11). Table 9: Private Credit (annual percentage change)
2000-01 2001-02 2002-03 2003-04 2004-05 2005-06 2006-07 Private Credit 4.8 18.9 29.8 33.2 23.2 17.2 Source: IMF 2006, 2008 Large scale manufacturing has missed the growth targets in the last two years. In this year,
high oil prices, gas and electricity crisis, high cost of production, declining trend in private
credit and high interest rates because of monetary tightening, would not favour industrial
growth at all.
The government has consumed its budgetary target of bank borrowing (Rs. 130 billion) by
January 200817, further borrowing from banking or non-banking sources may destabilize the
financial health (Khan 2008). It is estimated that utilization of PSDP would remain
significantly lower than allocated Rs. 520 billion.
Rapidly growing economies will generally experience more rapid growth of non-oil taxation,
and hence be better able to withstand the fiscal impacts of a less than fully passing on of oil
price increase. In Pakistan, non-oil taxation is more or less the same for the last few years.
3.2.2. Oil Prices and Inflation
Another channel via which high oil prices may affect macroeconomic performance is through
the high costs of production thus reducing output. This supply side channel exerts an 15 Expansionary monetary policies have provided support to consumption growth in the past.
Consequently consumer credit expansion has been strong, possibly raising the debt service burden of
households. 16 Reason might be the tight monetary policy by the SBP. 17 Pakistan’s foreign debt has also swelled by almost US$ 10 billion in the last four years or so and it is
now US$ 42 billion.
19
inflationary pressure on the economy. In addition, higher oil prices directly raise consumer
prices via higher prices of imported goods and petroleum products in the consumption basket.
Another implicit effect is felt as producers pass some part of higher input (oil) costs to the
price of final goods. Moreover, consumers who experience a loss in real income may consider
seeking wage increases, which feed back into higher production costs, and then into prices.
However, when oil prices fall, nominal wage and other price rigidities can limit the pass
through to lower final goods prices18.
When the rate of inflation is high, governments may be concerned with adding it further and
hence less willing to see a full passing on of oil price increase. High oil prices has also
become an important factor (along with rising house rents and shortage of food items)
contributing to high inflation in Pakistan in the past few years. General Price level (for
virtually all goods and assets) has been increasing (9.3 percent in 2004-05 considerably very
high compared to the previous years). Even in the last two years average inflation was near 8
percent (Table 10). Despite efforts from SBP through tight monetary policy19 (high interest
rates) average inflation was 7.1 percent in the first quarter of 2007/0820 (IMF 2008).
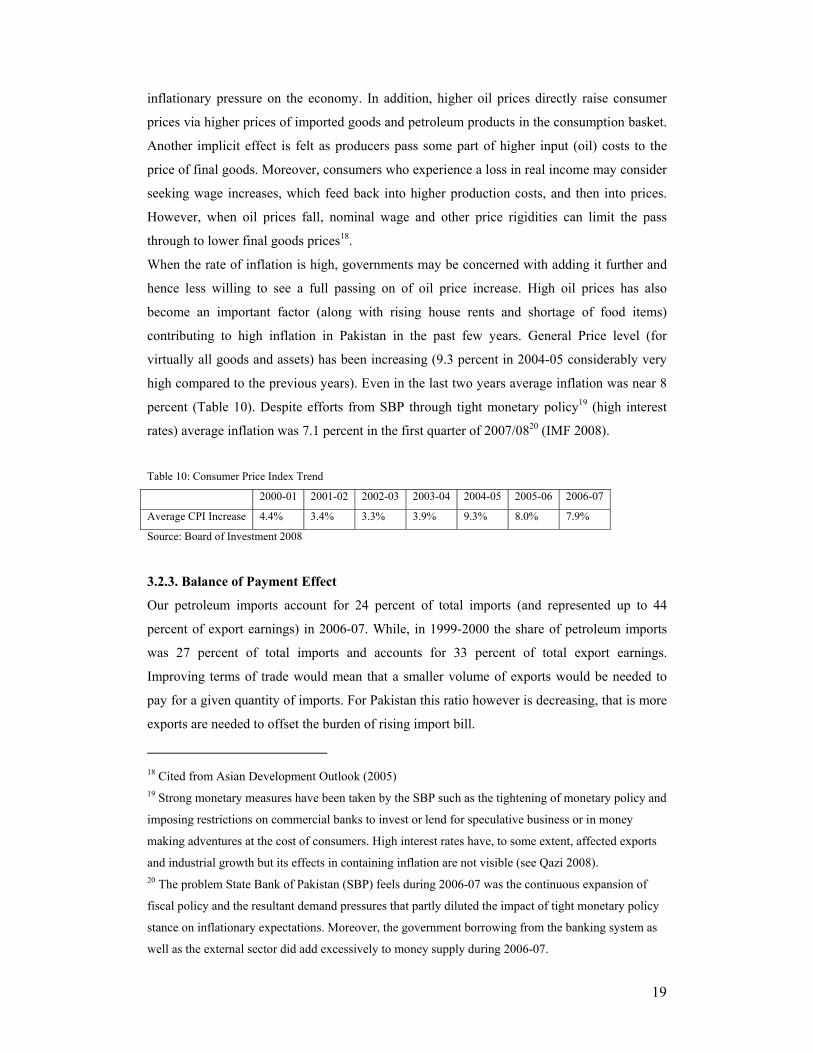
Table 10: Consumer Price Index Trend
2000-01 2001-02 2002-03 2003-04 2004-05 2005-06 2006-07
Average CPI Increase 4.4% 3.4% 3.3% 3.9% 9.3% 8.0% 7.9%
Source: Board of Investment 2008
3.2.3. Balance of Payment Effect
Our petroleum imports account for 24 percent of total imports (and represented up to 44
percent of export earnings) in 2006-07. While, in 1999-2000 the share of petroleum imports
was 27 percent of total imports and accounts for 33 percent of total export earnings.
Improving terms of trade would mean that a smaller volume of exports would be needed to
pay for a given quantity of imports. For Pakistan this ratio however is decreasing, that is more
exports are needed to offset the burden of rising import bill.
18 Cited from Asian Development Outlook (2005) 19 Strong monetary measures have been taken by the SBP such as the tightening of monetary policy and
imposing restrictions on commercial banks to invest or lend for speculative business or in money
making adventures at the cost of consumers. High interest rates have, to some extent, affected exports
and industrial growth but its effects in containing inflation are not visible (see Qazi 2008). 20 The problem State Bank of Pakistan (SBP) feels during 2006-07 was the continuous expansion of
fiscal policy and the resultant demand pressures that partly diluted the impact of tight monetary policy
stance on inflationary expectations. Moreover, the government borrowing from the banking system as
well as the external sector did add excessively to money supply during 2006-07.
20
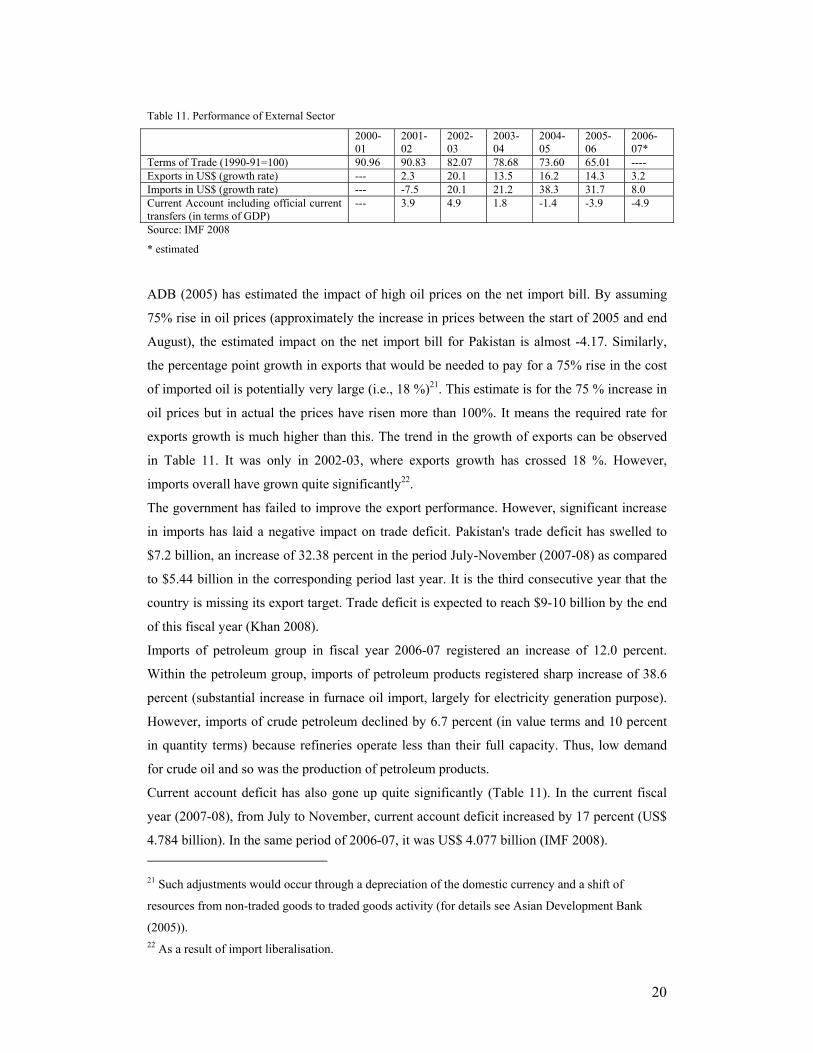
Table 11. Performance of External Sector
2000-01
2001-02
2002-03
2003-04
2004-05
2005-06
2006-07*
Terms of Trade (1990-91=100) 90.96 90.83 82.07 78.68 73.60 65.01 ---- Exports in US$ (growth rate) --- 2.3 20.1 13.5 16.2 14.3 3.2 Imports in US$ (growth rate) --- -7.5 20.1 21.2 38.3 31.7 8.0 Current Account including official current transfers (in terms of GDP)
--- 3.9 4.9 1.8 -1.4 -3.9 -4.9
Source: IMF 2008
* estimated
ADB (2005) has estimated the impact of high oil prices on the net import bill. By assuming
75% rise in oil prices (approximately the increase in prices between the start of 2005 and end
August), the estimated impact on the net import bill for Pakistan is almost -4.17. Similarly,
the percentage point growth in exports that would be needed to pay for a 75% rise in the cost
of imported oil is potentially very large (i.e., 18 %)21. This estimate is for the 75 % increase in
oil prices but in actual the prices have risen more than 100%. It means the required rate for
exports growth is much higher than this. The trend in the growth of exports can be observed
in Table 11. It was only in 2002-03, where exports growth has crossed 18 %. However,
imports overall have grown quite significantly22. The government has failed to improve the export performance. However, significant increase
in imports has laid a negative impact on trade deficit. Pakistan's trade deficit has swelled to
$7.2 billion, an increase of 32.38 percent in the period July-November (2007-08) as compared
to $5.44 billion in the corresponding period last year. It is the third consecutive year that the
country is missing its export target. Trade deficit is expected to reach $9-10 billion by the end
of this fiscal year (Khan 2008).
Imports of petroleum group in fiscal year 2006-07 registered an increase of 12.0 percent.
Within the petroleum group, imports of petroleum products registered sharp increase of 38.6
percent (substantial increase in furnace oil import, largely for electricity generation purpose).
However, imports of crude petroleum declined by 6.7 percent (in value terms and 10 percent
in quantity terms) because refineries operate less than their full capacity. Thus, low demand
for crude oil and so was the production of petroleum products.
Current account deficit has also gone up quite significantly (Table 11). In the current fiscal
year (2007-08), from July to November, current account deficit increased by 17 percent (US$
4.784 billion). In the same period of 2006-07, it was US$ 4.077 billion (IMF 2008). 21 Such adjustments would occur through a depreciation of the domestic currency and a shift of
resources from non-traded goods to traded goods activity (for details see Asian Development Bank
(2005)). 22 As a result of import liberalisation.
21
In Pakistan, in the last few years, external financial sector (that is, remittances, US aid, and
foreign inflows from FDI) has shown a solid performance23. It has helped the government in
the maintenance of the fiscal situation. However, this is only a short term solution. The
government has extensively utilised this facility but has not made substantial efforts to
explore other options to reduce trade deficit or explore areas that would have decreased its
fiscal burden. Because of this fiscal deficit has also started increasing (Qazi 2008).
3.2.4. Fiscal Impact
Fuel taxes have important revenue implications for Pakistan. Oil and gas sector together
accounts for a significant share of government revenues. Taxes on Petroleum products are the
largest source of indirect revenues in Pakistan. Petroleum product prices are higher than the
import parity price because of these taxes. Petroleum products contributed Rs.120 billion to
government revenues in the form of indirect taxes (custom duty, excise taxes and sales tax) in
2006-07. It is 23.2 percent of total indirect taxes (net)24 collected in 2006-07, while this share
was only 12 percent in 2000-01. Petroleum development levy (PDL) is not included in this
total. Petroleum development levies collected in 2005-06 were Rs 24500 million25. Adding
this will make total indirect tax revenue from petroleum products to Rs. 129.6 billion for the
year 2005-06 (that is 26.6 % of total indirect taxes). The share of PDL in petroleum taxes is
almost 18.9 for 2005-06. For the fiscal year 2006-07 exact figure is not available. However,
the estimated sum of development surcharge in both gas and petroleum sector is Rs. 74 billion
as compared to Rs. 54 billion last year, 2006-07 (IMF Report 2008). The taxing of fuel is one
of the easiest and relatively straight forward way to raise revenue, as consumption of
petroleum products is relatively price inelastic and income elastic, ensuring buoyant revenue
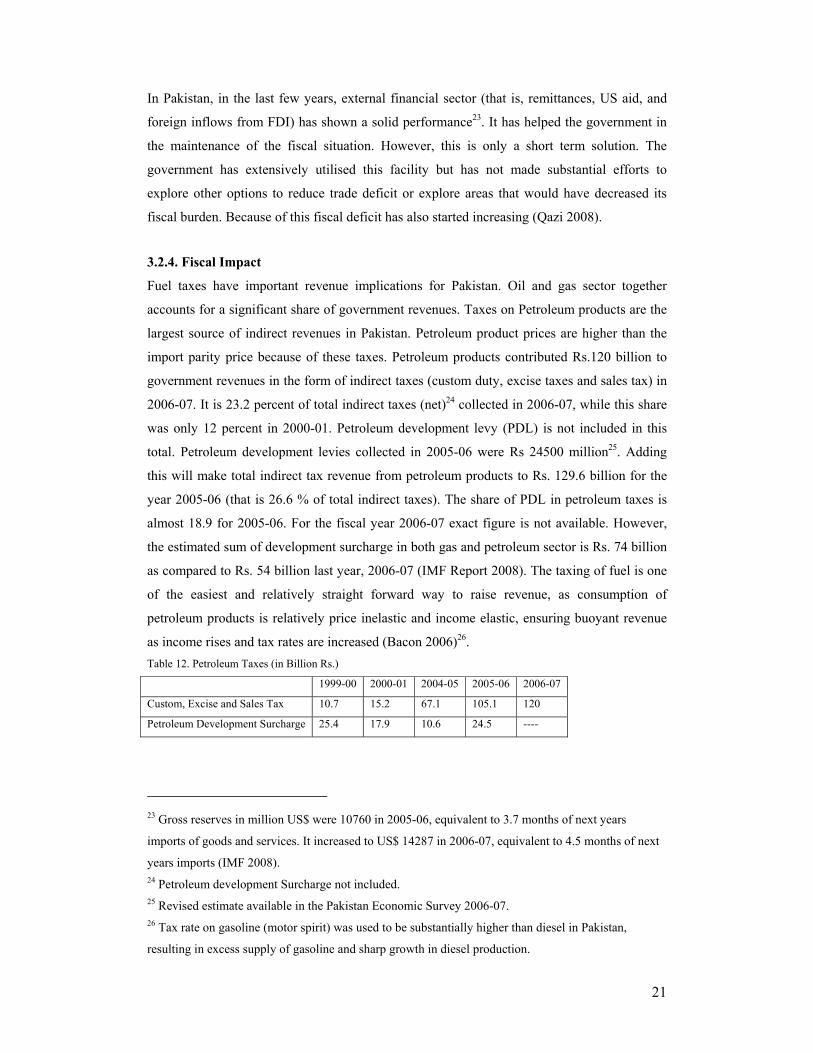
as income rises and tax rates are increased (Bacon 2006)26. Table 12. Petroleum Taxes (in Billion Rs.)
1999-00 2000-01 2004-05 2005-06 2006-07
Custom, Excise and Sales Tax 10.7 15.2 67.1 105.1 120
Petroleum Development Surcharge 25.4 17.9 10.6 24.5 ----
23 Gross reserves in million US$ were 10760 in 2005-06, equivalent to 3.7 months of next years
imports of goods and services. It increased to US$ 14287 in 2006-07, equivalent to 4.5 months of next
years imports (IMF 2008). 24 Petroleum development Surcharge not included. 25 Revised estimate available in the Pakistan Economic Survey 2006-07. 26 Tax rate on gasoline (motor spirit) was used to be substantially higher than diesel in Pakistan,
resulting in excess supply of gasoline and sharp growth in diesel production.
22
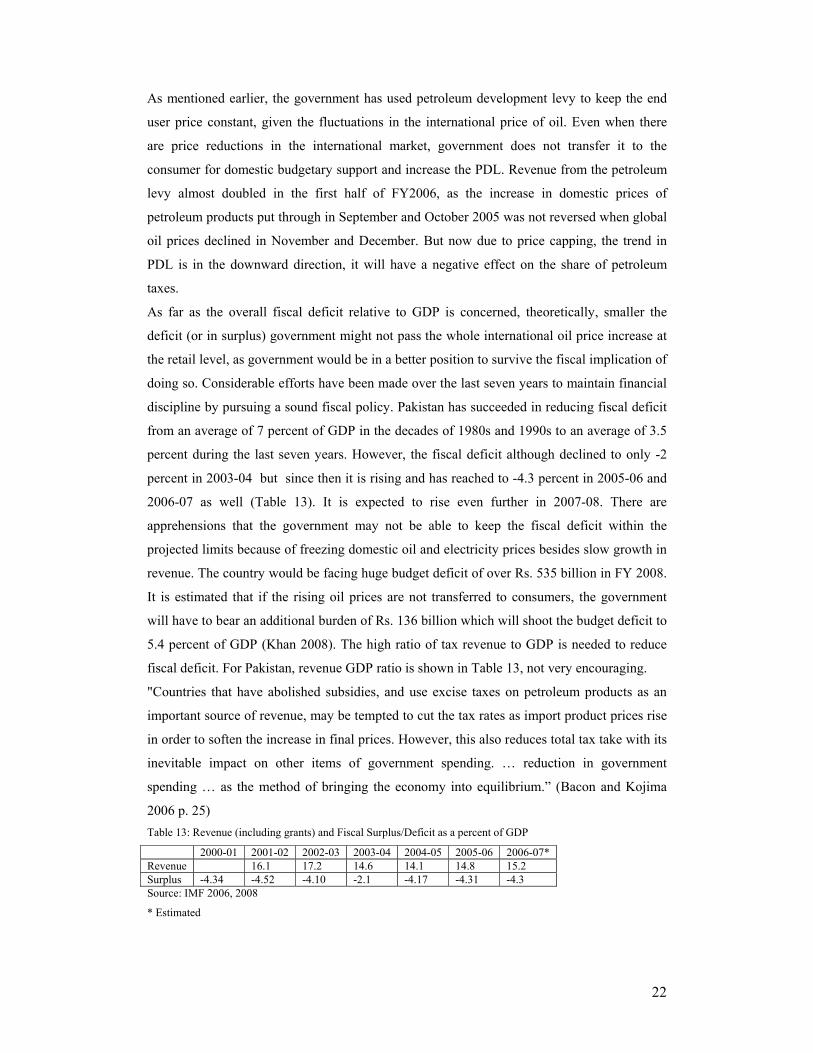
As mentioned earlier, the government has used petroleum development levy to keep the end
user price constant, given the fluctuations in the international price of oil. Even when there
are price reductions in the international market, government does not transfer it to the
consumer for domestic budgetary support and increase the PDL. Revenue from the petroleum
levy almost doubled in the first half of FY2006, as the increase in domestic prices of
petroleum products put through in September and October 2005 was not reversed when global
oil prices declined in November and December. But now due to price capping, the trend in
PDL is in the downward direction, it will have a negative effect on the share of petroleum
taxes.
As far as the overall fiscal deficit relative to GDP is concerned, theoretically, smaller the
deficit (or in surplus) government might not pass the whole international oil price increase at
the retail level, as government would be in a better position to survive the fiscal implication of
doing so. Considerable efforts have been made over the last seven years to maintain financial
discipline by pursuing a sound fiscal policy. Pakistan has succeeded in reducing fiscal deficit
from an average of 7 percent of GDP in the decades of 1980s and 1990s to an average of 3.5
percent during the last seven years. However, the fiscal deficit although declined to only -2
percent in 2003-04 but since then it is rising and has reached to -4.3 percent in 2005-06 and
2006-07 as well (Table 13). It is expected to rise even further in 2007-08. There are
apprehensions that the government may not be able to keep the fiscal deficit within the
projected limits because of freezing domestic oil and electricity prices besides slow growth in
revenue. The country would be facing huge budget deficit of over Rs. 535 billion in FY 2008.
It is estimated that if the rising oil prices are not transferred to consumers, the government
will have to bear an additional burden of Rs. 136 billion which will shoot the budget deficit to
5.4 percent of GDP (Khan 2008). The high ratio of tax revenue to GDP is needed to reduce
fiscal deficit. For Pakistan, revenue GDP ratio is shown in Table 13, not very encouraging.
"Countries that have abolished subsidies, and use excise taxes on petroleum products as an
important source of revenue, may be tempted to cut the tax rates as import product prices rise
in order to soften the increase in final prices. However, this also reduces total tax take with its
inevitable impact on other items of government spending. … reduction in government
spending … as the method of bringing the economy into equilibrium.” (Bacon and Kojima
2006 p. 25) Table 13: Revenue (including grants) and Fiscal Surplus/Deficit as a percent of GDP
2000-01 2001-02 2002-03 2003-04 2004-05 2005-06 2006-07* Revenue 16.1 17.2 14.6 14.1 14.8 15.2 Surplus -4.34 -4.52 -4.10 -2.1 -4.17 -4.31 -4.3 Source: IMF 2006, 2008
* Estimated
23
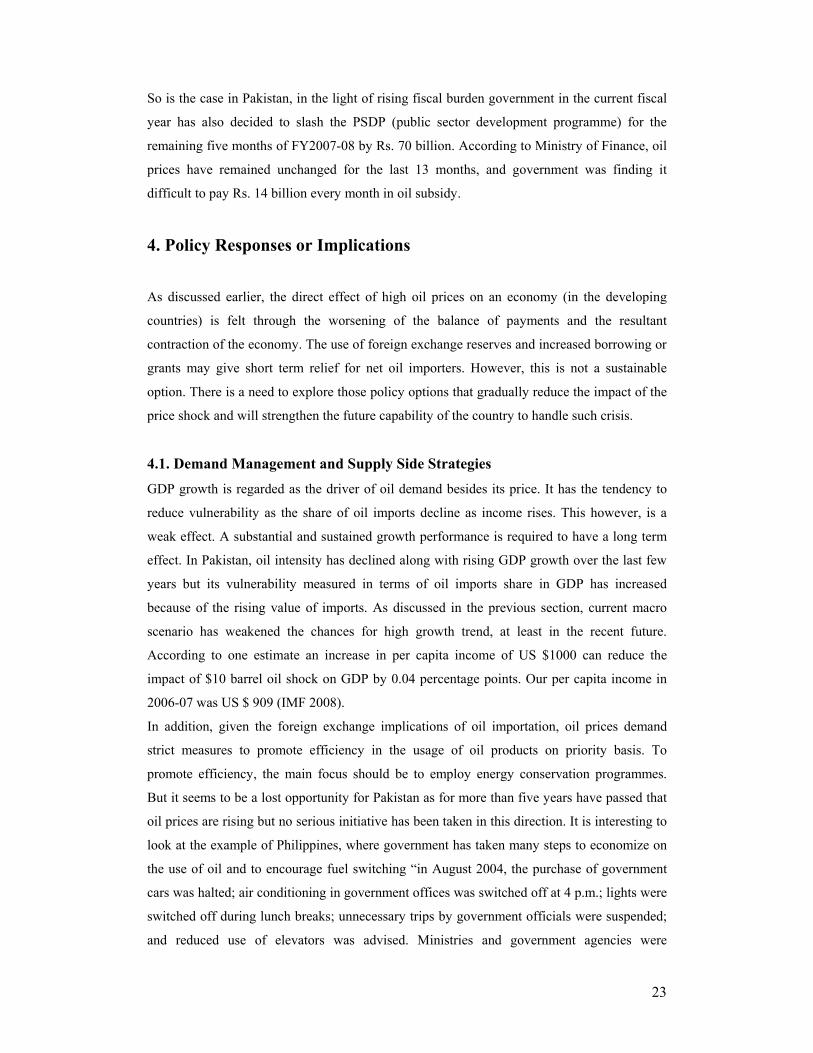
So is the case in Pakistan, in the light of rising fiscal burden government in the current fiscal
year has also decided to slash the PSDP (public sector development programme) for the
remaining five months of FY2007-08 by Rs. 70 billion. According to Ministry of Finance, oil
prices have remained unchanged for the last 13 months, and government was finding it
difficult to pay Rs. 14 billion every month in oil subsidy.
4. Policy Responses or Implications
As discussed earlier, the direct effect of high oil prices on an economy (in the developing
countries) is felt through the worsening of the balance of payments and the resultant
contraction of the economy. The use of foreign exchange reserves and increased borrowing or
grants may give short term relief for net oil importers. However, this is not a sustainable
option. There is a need to explore those policy options that gradually reduce the impact of the
price shock and will strengthen the future capability of the country to handle such crisis.
4.1. Demand Management and Supply Side Strategies
GDP growth is regarded as the driver of oil demand besides its price. It has the tendency to
reduce vulnerability as the share of oil imports decline as income rises. This however, is a
weak effect. A substantial and sustained growth performance is required to have a long term
effect. In Pakistan, oil intensity has declined along with rising GDP growth over the last few
years but its vulnerability measured in terms of oil imports share in GDP has increased
because of the rising value of imports. As discussed in the previous section, current macro
scenario has weakened the chances for high growth trend, at least in the recent future.
According to one estimate an increase in per capita income of US $1000 can reduce the
impact of $10 barrel oil shock on GDP by 0.04 percentage points. Our per capita income in
2006-07 was US $ 909 (IMF 2008).
In addition, given the foreign exchange implications of oil importation, oil prices demand
strict measures to promote efficiency in the usage of oil products on priority basis. To
promote efficiency, the main focus should be to employ energy conservation programmes.
But it seems to be a lost opportunity for Pakistan as for more than five years have passed that
oil prices are rising but no serious initiative has been taken in this direction. It is interesting to
look at the example of Philippines, where government has taken many steps to economize on
the use of oil and to encourage fuel switching “in August 2004, the purchase of government
cars was halted; air conditioning in government offices was switched off at 4 p.m.; lights were
switched off during lunch breaks; unnecessary trips by government officials were suspended;
and reduced use of elevators was advised. Ministries and government agencies were

24
encouraged to undertake proper maintenance of vehicles (including correct tire inflation); and
driving of government vehicles was reduced. An administrative order signed in August 2005
directed all government offices to implement a mandatory 10 percent reduction in their fuel
consumption. Government agencies and offices were prohibited from using vehicles, aircraft,
and watercraft for purposes other than official business; the use of government vehicles was
banned on Sundays and official holidays, or outside regular office hours…” (cited from
Bacon and Kojima 2006, p. 80)
That is, first of all the government itself is economising on fuel consumption, setting an
example for the general public. As a result of these energy conservation programmes,
consumption of petroleum products in Philippines declined by 8 percent in almost two years.
There are so many examples of energy saving programmes employed in developing countries
(for details see Bacon and Kojima 2006). Contrary to that in Pakistan there is so much misuse
of energy, e.g., government vehicles are used by their families. Moreover, according to new
notification issued, officers in grade 20 are now entitled for official vehicle, allowing for
more burden on oil consumption and national exchequer.
In Pakistan, liquid fluids are primarily used in the transport sector and power sector. There is
a need to improve efficiency in the use of petroleum products in these sectors. The demand
for oil products, however, did not increase because of a strong substitution of natural gas for
heavy fuel in the power sector. In addition, some 1,600, 000 vehicles are converted to
Compressed Natural Gas (CNG) and have replaced motor spirit (gasoline) vehicles27.
Pakistan’s CNG vehicle industry is the second largest in the world after Argentine. The
government's pricing policy gives large financial incentives for switching from gasoline to
CNG. Its reserves-to-production ratio stood at slightly less than 35 years in 2004 (BP 2006).
Pakistan is not importing gas at the moment. However, for some reasons alarming situation
arises in the winter seasons, especially winter season in the fiscal year 2007-08 has seen the
worst kind of energy crisis (severe power as well as gas load shedding)28.
No doubt Pakistan should continue this strategy but at the same time explore other
appropriate options like for instance, for cross-border natural gas pipeline development.
Although government in order to reduce the oil bill is planning to import natural gas from
Iran, Turkmenistan, or Qatar, but so far nothing has been finalized. The reliance on energy
source depends significantly on the availability of resource endowment. In Pakistan switching
27 As a result of fuel switching over the last 15 years or so oil consumption has declined by 10 percent
while that of gas has increased by 6.5 percent. 28 It was also considered at one point to stop the gas supply to CNG stations, even happened also in
some areas. If this will be done again and for a long period of time CNG transport will be forced to
switch back to petrol, then where will be the ratio of oil intensity in energy consumption.
25
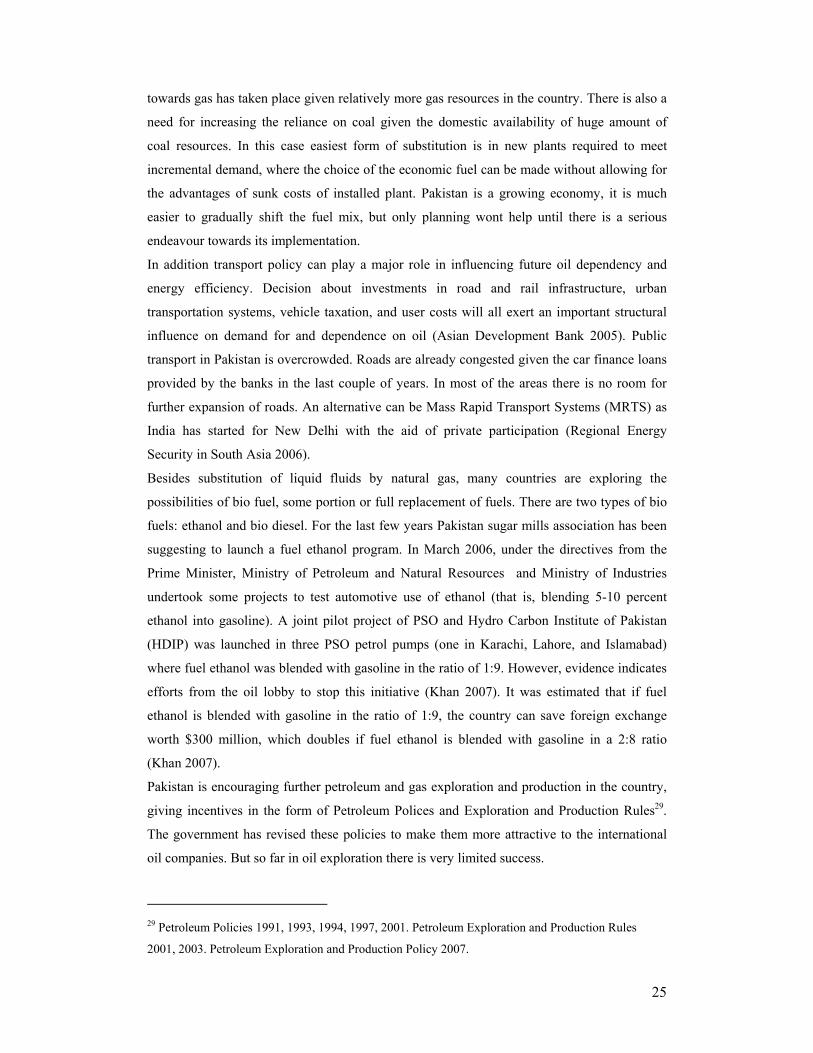
towards gas has taken place given relatively more gas resources in the country. There is also a
need for increasing the reliance on coal given the domestic availability of huge amount of
coal resources. In this case easiest form of substitution is in new plants required to meet
incremental demand, where the choice of the economic fuel can be made without allowing for
the advantages of sunk costs of installed plant. Pakistan is a growing economy, it is much
easier to gradually shift the fuel mix, but only planning wont help until there is a serious
endeavour towards its implementation.
In addition transport policy can play a major role in influencing future oil dependency and
energy efficiency. Decision about investments in road and rail infrastructure, urban
transportation systems, vehicle taxation, and user costs will all exert an important structural
influence on demand for and dependence on oil (Asian Development Bank 2005). Public
transport in Pakistan is overcrowded. Roads are already congested given the car finance loans
provided by the banks in the last couple of years. In most of the areas there is no room for
further expansion of roads. An alternative can be Mass Rapid Transport Systems (MRTS) as
India has started for New Delhi with the aid of private participation (Regional Energy
Security in South Asia 2006).
Besides substitution of liquid fluids by natural gas, many countries are exploring the
possibilities of bio fuel, some portion or full replacement of fuels. There are two types of bio
fuels: ethanol and bio diesel. For the last few years Pakistan sugar mills association has been
suggesting to launch a fuel ethanol program. In March 2006, under the directives from the
Prime Minister, Ministry of Petroleum and Natural Resources and Ministry of Industries
undertook some projects to test automotive use of ethanol (that is, blending 5-10 percent
ethanol into gasoline). A joint pilot project of PSO and Hydro Carbon Institute of Pakistan
(HDIP) was launched in three PSO petrol pumps (one in Karachi, Lahore, and Islamabad)
where fuel ethanol was blended with gasoline in the ratio of 1:9. However, evidence indicates
efforts from the oil lobby to stop this initiative (Khan 2007). It was estimated that if fuel
ethanol is blended with gasoline in the ratio of 1:9, the country can save foreign exchange
worth $300 million, which doubles if fuel ethanol is blended with gasoline in a 2:8 ratio
(Khan 2007).
Pakistan is encouraging further petroleum and gas exploration and production in the country,
giving incentives in the form of Petroleum Polices and Exploration and Production Rules29.
The government has revised these policies to make them more attractive to the international
oil companies. But so far in oil exploration there is very limited success.
29 Petroleum Policies 1991, 1993, 1994, 1997, 2001. Petroleum Exploration and Production Rules
2001, 2003. Petroleum Exploration and Production Policy 2007.

26
In Pakistan policies are intended to protect domestic refineries: import parity pricing for
products that are exported, requiring fuel markets to buy from domestic refineries, and zero
customs duties on the import of crude oil.
There is a perception that undue profits are going to oil refineries on account of deemed
duties and guaranteed rates of return. Refineries continued to benefit from the 10 percent
deemed duty allowed for one year about six years ago to modernize their system to European
standards. Moreover, the refineries have not been able to increase their storage and improve
their products to Euro-IV standards as they had promised to do in return. Refineries in
Pakistan are earning much higher than their counterparts in other countries. For example, in
Pakistan refineries are earning between $ 8 and $11 per barrel. Compared to that, refineries in
Singapore are earning $2 to $3 per barrel. Mainly because of the protections, the profitability
of four refineries that ranged between Rs. 23 million and Rs. 1.3 billion depending on their
capacity in 2000-01 increased to between Rs. 1.7 billion and Rs. 11 billion in 2007, showing a
total increase of about 2,000 percent (Kiani 2008). Large profits earned by oil Refineries,
though reflects the global trend caused by shortages of refining capacity, but has increased the
worries of the population that oil companies are exploiting the global oil market and taking
advantage of consumers (Bacon and Kojima 2006).
Secondly, in the last two years imports of petroleum products in Pakistan have gone up
because of the lower production in refineries. What was the point in giving so many
incentives to these refineries? What the regulatory authority is doing to check it.
Another long-term response can be the increase in the strategic reserve position (as done by
the Peoples Republic of China and India). Strategic stocks are not exactly intended to guard
against high prices; their main objective is to ensure availability in the event of a physical
disruption in supply. Pakistan’s oil reserves dropped to the lowest-ever level in the country’s
history and the stocks of major oil products, kerosene and diesel, left were sufficient for four
and six days respectively at one point in Dec 2007 (as a result kerosene prices shoot up and
was sold in the black market). Under the standard operating procedures (SOPs), government
and all companies (private as well as public) are required to maintain a minimum of 21-day
stocks of every product at all times to cope with any eventuality. The SOPs are defined in the
‘Blue Book’ meant for strategic government organisations to handle crises. The country has
the storage capacity to fulfil the demand for 80 days for kerosene and 39 days for HSD. The
major reason for the drop in stocks was cash problems faced by the oil companies to have
sufficient imports and non-availability of cargo in Arab countries because of advance supply
orders. The situation was comparatively better for furnace oil, petrol, HOBC and jet
fuel as their stocks but still below their capacity (Kiani 2007).
27
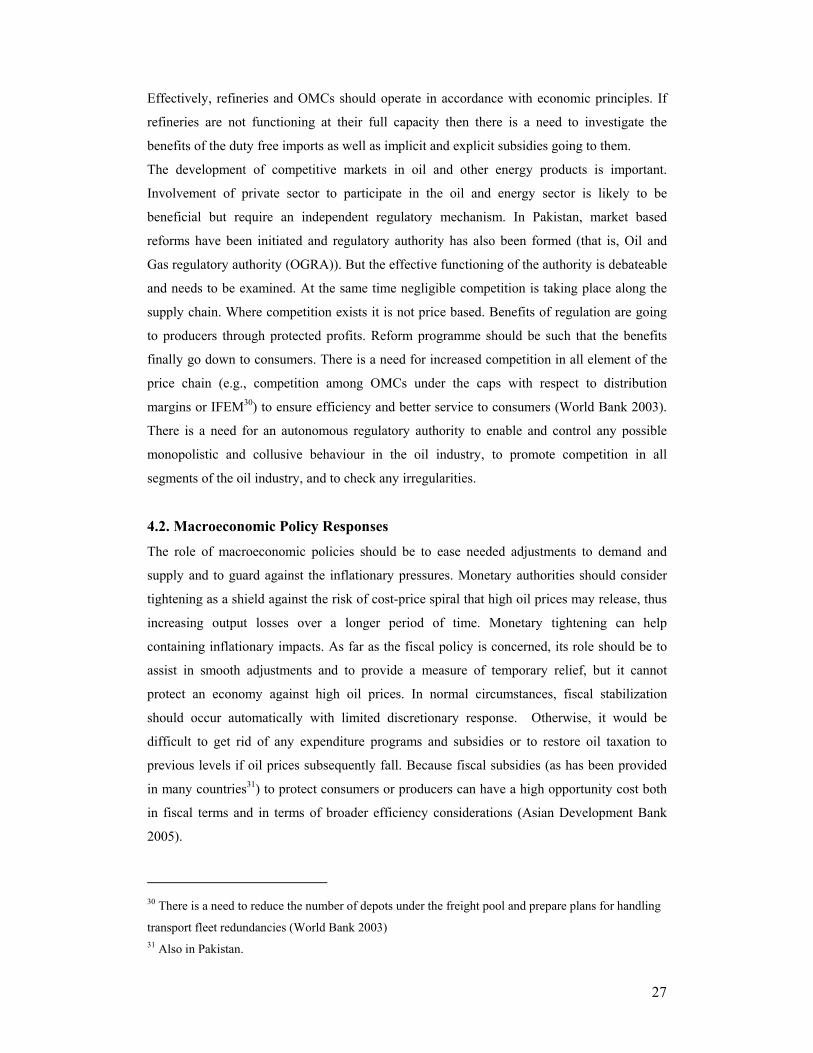
Effectively, refineries and OMCs should operate in accordance with economic principles. If
refineries are not functioning at their full capacity then there is a need to investigate the
benefits of the duty free imports as well as implicit and explicit subsidies going to them.
The development of competitive markets in oil and other energy products is important.
Involvement of private sector to participate in the oil and energy sector is likely to be
beneficial but require an independent regulatory mechanism. In Pakistan, market based
reforms have been initiated and regulatory authority has also been formed (that is, Oil and
Gas regulatory authority (OGRA)). But the effective functioning of the authority is debateable
and needs to be examined. At the same time negligible competition is taking place along the
supply chain. Where competition exists it is not price based. Benefits of regulation are going
to producers through protected profits. Reform programme should be such that the benefits
finally go down to consumers. There is a need for increased competition in all element of the
price chain (e.g., competition among OMCs under the caps with respect to distribution
margins or IFEM30) to ensure efficiency and better service to consumers (World Bank 2003).
There is a need for an autonomous regulatory authority to enable and control any possible
monopolistic and collusive behaviour in the oil industry, to promote competition in all
segments of the oil industry, and to check any irregularities.
4.2. Macroeconomic Policy Responses
The role of macroeconomic policies should be to ease needed adjustments to demand and
supply and to guard against the inflationary pressures. Monetary authorities should consider
tightening as a shield against the risk of cost-price spiral that high oil prices may release, thus
increasing output losses over a longer period of time. Monetary tightening can help
containing inflationary impacts. As far as the fiscal policy is concerned, its role should be to
assist in smooth adjustments and to provide a measure of temporary relief, but it cannot
protect an economy against high oil prices. In normal circumstances, fiscal stabilization
should occur automatically with limited discretionary response. Otherwise, it would be
difficult to get rid of any expenditure programs and subsidies or to restore oil taxation to
previous levels if oil prices subsequently fall. Because fiscal subsidies (as has been provided
in many countries31) to protect consumers or producers can have a high opportunity cost both
in fiscal terms and in terms of broader efficiency considerations (Asian Development Bank
2005).
30 There is a need to reduce the number of depots under the freight pool and prepare plans for handling
transport fleet redundancies (World Bank 2003) 31 Also in Pakistan.
28
For net oil importers, the appropriate macroeconomic response to higher oil prices is to fine
tune both fiscal and monetary policy to accommodate, not resist, needed adjustments in
output and prices.
For the last two years or so monetary authority in a Pakistan, that is State Bank of Pakistan
(SBP) is employing tight monetary policy to contain inflationary impact. In addition, in April
2004, when Pakistan rupees felt pressure as a result of high oil prices and depreciated against
the US dollar by almost 6.8%by October 2004, SBP committed officially in November 2004,
to support the market for the high oil payments. As a result, rupee picks up to recover much
of the lost ground in December 2004. SBP effort is directed towards eliminating mismatches
between inflows and the outflows, i.e., purchasing when market had excess foreign exchange
inflows and selling the same for oil payments. SBP’s commitment for the oil payments
therefore, played an important role in avoiding speculative attacks on the currency (SBP
2007).
With the aim of promoting growth the Government has pursued an expansionary fiscal policy
for the last few years with the increase in development spending. As a result not only fiscal
deficit has increased but has also balanced out to some extent the monetary tightening by the
SBP.
5. Conclusion
For long run development oil will remain an important source of energy. What is required is
to make rational choices about the development of energy mix for the future. The government
should chalk out strategies for ensuring efficiency in use and development, adequacy and
reliability of supply, and measures to alleviate environmental impacts. For Investor’s
confidence in all energy sectors a predictable and transparent framework is essential. Since
better investor climate will in turn increase supply and help stabilize prices. Within the
framework of a national energy policy, a number of specific measures to promote energy
efficiency and diversity will help in reducing vulnerability to high oil prices (Asian
Development Bank 2005).
About 28% of total commercial energy is imported in Pakistan and the dependence on
imported fuels is expected to increase even further in future given the depleting gas resources.
The continuously rising trend in the oil prices in the international market will have a negative
impact on Pakistan’s foreign reserves32.
32 Reserves dropped from US$16.4 billion in October 2007 to US$14.08 billion on February 15, 2008.
29
Pakistan needs to explore the vast potential of its indigenous energy resources, much of which
has remained unexploited, especially that of coal. The government must diversify the
country’s energy supply mix to reduce the risk of oil price fluctuations in the global energy
market.
Energy conservation programs should be applied. There is a need to seriously promote
efficiency improvement or demand management. So far this seems to be a loss opportunity
for Pakistan. As discussed earlier, some countries have successfully implemented this
approach.
At the macro level, government policy cannot completely eliminate the adverse impacts of
high oil prices but appropriate policy response can minimize it.
"Overly contractionary monetary and fiscal policies to contain inflationary pressures could
exacerbate the recessionary income and unemployment effects. On the other hand,
expansionary monetary and fiscal policies may simply delay the fall in real income
necessitated by the increase in oil prices, stoke up inflationary pressures and worsen the
impact of higher prices in the long run" (IEA 2004; p. 6)
There is also a need to rationalize taxation/levies on petroleum products to help reduce the
unbalance in the pattern of consumption. It may result in predictable government revenues
and balanced consumption of petroleum products. And may also help in the reduction of those
products for which we have to rely largely on imports. In addition, since Pakistan is on the
high growth path therefore, there is also a need to focus more on non-energy taxes.
For the improvement of balance of payment, Pakistan should made serious efforts to boost its
exports to counter high oil payments.
References
1. ADB (2005) The Challenge of High Oil Prices. Asian Development Outlook Update,
Asian Development Bank.
2. ADB (2004) Asian Development Outlook 2004, Asian Development Bank.
3. Ansari, Murad (2004) Unexplored Country: Pakistan’s Oil & Gas Sector.
BLUE.CHIP, The Business Peoples Magazine, www.bluechipmag.com
4. Bacon, Robert and Masami Kojima (2006) Coping with High Oil Prices, ESMAP
Report 323/06, The World Bank.
30
5. Bacon, Robert (2005) The Impact of High Oil Prices on Low Income Countries and
the Poor. UNDP/ESMAP (United Nation Development Programme/ World Bank
Energy Sector Management Assistant Programme), The World Bank.
6. Birol, Fatih (2006) Oil Market Outlook and Policy Implications. United States
Committee on Energy and Natural Resources, Prepared Testimony 10 January 2006.
7. BOI (2008) Pakistan Economy. Board of Investment, Islamabad,
www.boi.org.pk
8. Burney, A. Nadeem and Naeem Akhtar (1990) Fuel Demand Elasticities in Pakistan:
An Analysis of Household’s Expenditure on Fuels using Micro Data, The Pakistan
Development Review, Vol. 29, No. 2, pp. 155-174.
9. Government of Pakistan (2006) Yearbook 2005-06. Ministry of Petroleum and
Natural Resources.
10. Government of Pakistan (2008) Fiscal Policy Statement 2007-08. Debt Policy
Coordination Office, Ministry of Finance.
11. Pakistan Energy Yearbook (various Issues). Hydrocarbon Development Institute of
Pakistan, Ministry of Petroleum and Natural Resources, Government of Pakistan.
12. IEA (2004) Analysis of the Impact of High oil Prices on the Global Economy.
International Energy Agency, Paris.
13. IMF (2008) Pakistan 2007. IMF Country Report No. 08/21, International Monetary
Fund.
14. IMF (2006) Pakistan 2006. IMF Country Report No. 06/426, International Monetary
Fund.
15. Khan, Bashir Ahmed and Syed Mubashir Ali (2000) Energy Policy in Pakistan: An
Investigation of the Tariff Structure of Petroleum Products. Working Paper No. 00-
24, Working Paper Series, Centre for Management and Economic Research, Lahore
University of Management Sciences.
16. Khan, Mehmood-ul-Hassan (2008) Negative Aspects of Macro-economy. Business &
Finance Review, The News, Monday February 4, 2008.
17. Khan, Shaheen Rafi Khan (2007) Need for Enabling Polices Part II, The News,
September 30, 2007.
18. Kiani, Khaleeq (2008) Oil Pricing System under Review. DAWN, February 10, 2008.
19. Kiani, Khaleeq (2008) Rs.25 bn Earned from Tax on POL Products. DAWN,
November 28, 2007.
20. Kiani, Khaleeq (2007) Crisis as Oil Stocks Hit Rock Bottom. DAWN, December 11,
2007.
21. MPNR (2008) Ministry of Petroleum and Natural Resources, Government of
Pakistan. www.mpnr.gov.pk
31
22. OCAC (2008) Oil Companies Advisory Committee. www.ocac.org.pk
23. OGRA (2006) Annual Report 2005-06. Oil and Gas Regulatory Authority, Islamabad.
24. OGRA (2008) www.ogra.org.pk
25. Qazi, M. S. (2008) State of the Economy and Mid-Year Review. Business & Finance
Review, The News, Monday February 4, 2008.
26. Regional Energy Security for South Asia (2006) Regional Report, www.sari-energy.org
27. SBP (2007) Annual Report 2006-07. State Bank of Pakistan.
28. WB (2003) Pakistan Oil & Gas Sector Review. Report No. 26072-Pk, The World
Bank.
32
Appendix
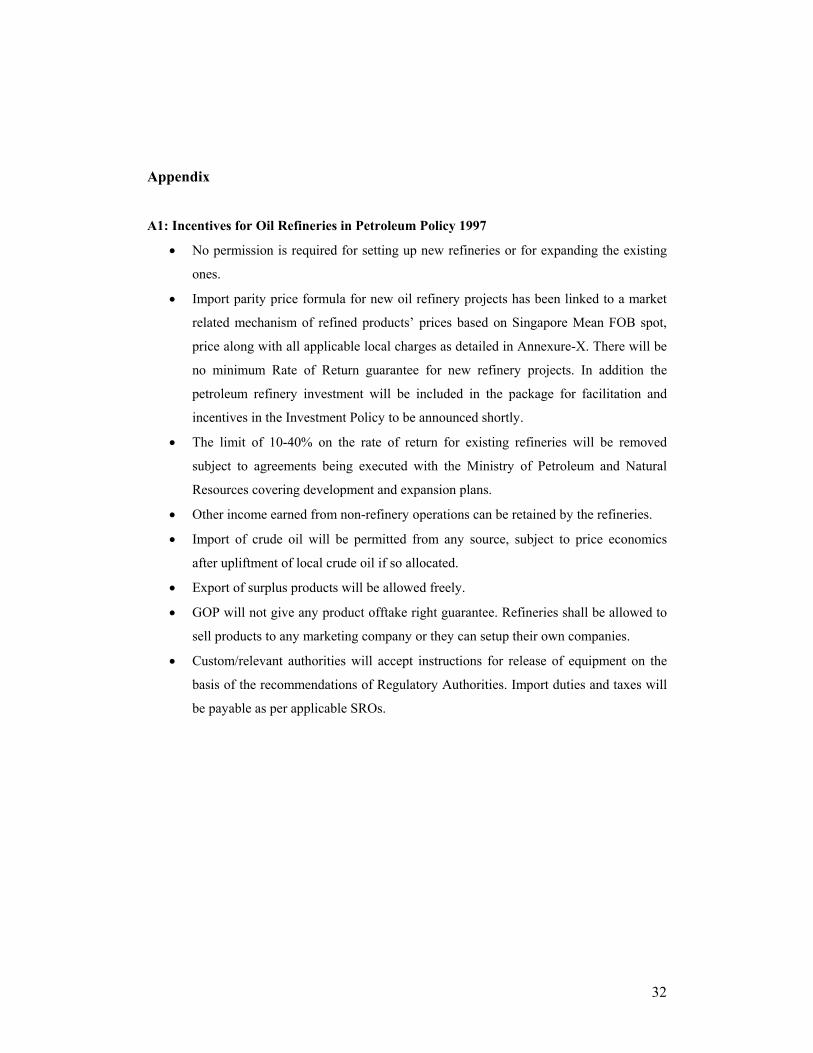
A1: Incentives for Oil Refineries in Petroleum Policy 1997
• No permission is required for setting up new refineries or for expanding the existing
ones.
• Import parity price formula for new oil refinery projects has been linked to a market
related mechanism of refined products’ prices based on Singapore Mean FOB spot,
price along with all applicable local charges as detailed in Annexure-X. There will be
no minimum Rate of Return guarantee for new refinery projects. In addition the
petroleum refinery investment will be included in the package for facilitation and
incentives in the Investment Policy to be announced shortly.
• The limit of 10-40% on the rate of return for existing refineries will be removed
subject to agreements being executed with the Ministry of Petroleum and Natural
Resources covering development and expansion plans.
• Other income earned from non-refinery operations can be retained by the refineries.
• Import of crude oil will be permitted from any source, subject to price economics
after upliftment of local crude oil if so allocated.
• Export of surplus products will be allowed freely.
• GOP will not give any product offtake right guarantee. Refineries shall be allowed to
sell products to any marketing company or they can setup their own companies.
• Custom/relevant authorities will accept instructions for release of equipment on the
basis of the recommendations of Regulatory Authorities. Import duties and taxes will
be payable as per applicable SROs.
33
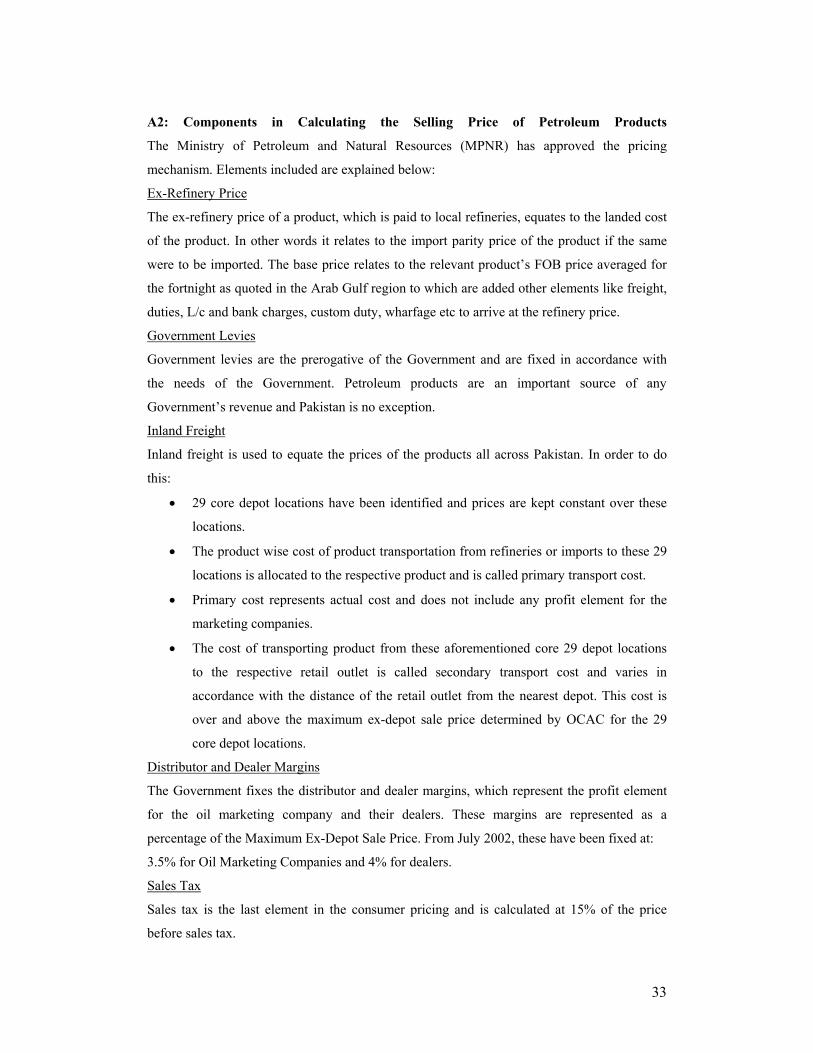
A2: Components in Calculating the Selling Price of Petroleum Products
The Ministry of Petroleum and Natural Resources (MPNR) has approved the pricing
mechanism. Elements included are explained below:
Ex-Refinery Price
The ex-refinery price of a product, which is paid to local refineries, equates to the landed cost
of the product. In other words it relates to the import parity price of the product if the same
were to be imported. The base price relates to the relevant product’s FOB price averaged for
the fortnight as quoted in the Arab Gulf region to which are added other elements like freight,
duties, L/c and bank charges, custom duty, wharfage etc to arrive at the refinery price.
Government Levies
Government levies are the prerogative of the Government and are fixed in accordance with
the needs of the Government. Petroleum products are an important source of any
Government’s revenue and Pakistan is no exception.
Inland Freight
Inland freight is used to equate the prices of the products all across Pakistan. In order to do
this:
• 29 core depot locations have been identified and prices are kept constant over these
locations.
• The product wise cost of product transportation from refineries or imports to these 29
locations is allocated to the respective product and is called primary transport cost.
• Primary cost represents actual cost and does not include any profit element for the
marketing companies.
• The cost of transporting product from these aforementioned core 29 depot locations
to the respective retail outlet is called secondary transport cost and varies in
accordance with the distance of the retail outlet from the nearest depot. This cost is
over and above the maximum ex-depot sale price determined by OCAC for the 29
core depot locations.
Distributor and Dealer Margins
The Government fixes the distributor and dealer margins, which represent the profit element
for the oil marketing company and their dealers. These margins are represented as a
percentage of the Maximum Ex-Depot Sale Price. From July 2002, these have been fixed at:
3.5% for Oil Marketing Companies and 4% for dealers.
Sales Tax
Sales tax is the last element in the consumer pricing and is calculated at 15% of the price
before sales tax. 53.
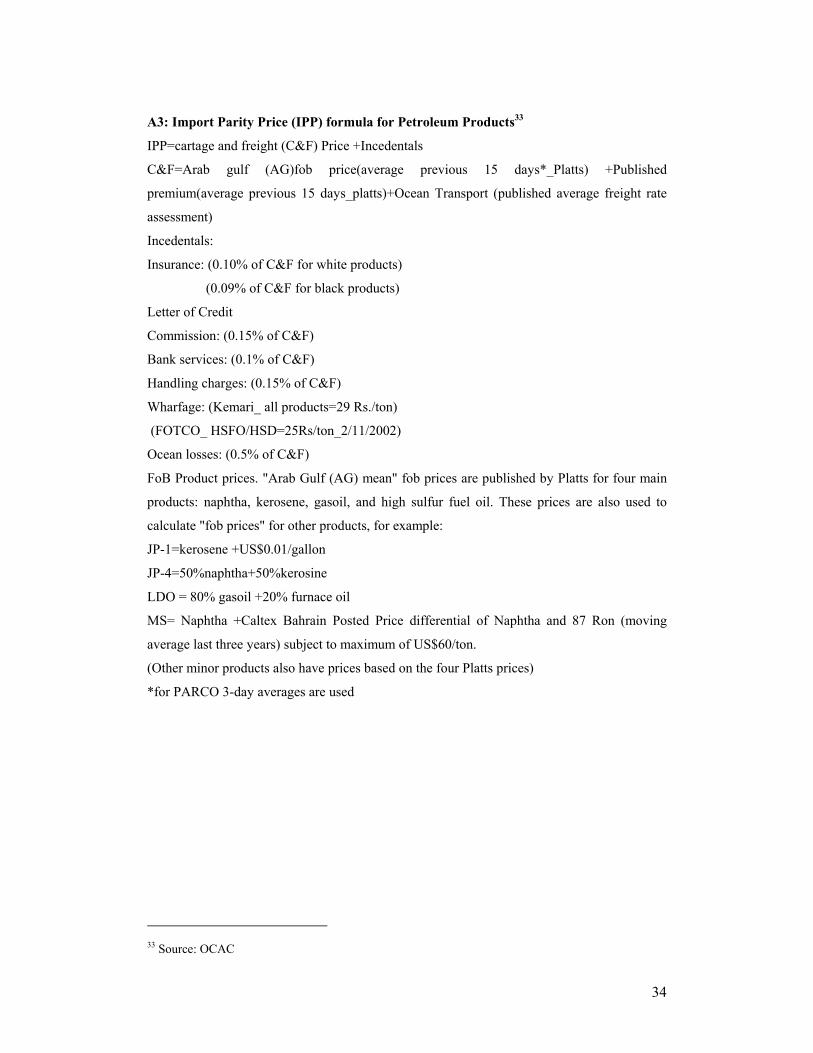
34
A3: Import Parity Price (IPP) formula for Petroleum Products33
IPP=cartage and freight (C&F) Price +Incedentals
C&F=Arab gulf (AG)fob price(average previous 15 days*_Platts) +Published
premium(average previous 15 days_platts)+Ocean Transport (published average freight rate
assessment)
Incedentals:
Insurance: (0.10% of C&F for white products)
(0.09% of C&F for black products)
Letter of Credit
Commission: (0.15% of C&F)
Bank services: (0.1% of C&F)
Handling charges: (0.15% of C&F)
Wharfage: (Kemari_ all products=29 Rs./ton)
(FOTCO_ HSFO/HSD=25Rs/ton_2/11/2002)
Ocean losses: (0.5% of C&F)
FoB Product prices. "Arab Gulf (AG) mean" fob prices are published by Platts for four main
products: naphtha, kerosene, gasoil, and high sulfur fuel oil. These prices are also used to
calculate "fob prices" for other products, for example:
JP-1=kerosene +US$0.01/gallon
JP-4=50%naphtha+50%kerosine
LDO = 80% gasoil +20% furnace oil
MS= Naphtha +Caltex Bahrain Posted Price differential of Naphtha and 87 Ron (moving
average last three years) subject to maximum of US$60/ton.
(Other minor products also have prices based on the four Platts prices)
*for PARCO 3-day averages are used
33 Source: OCAC
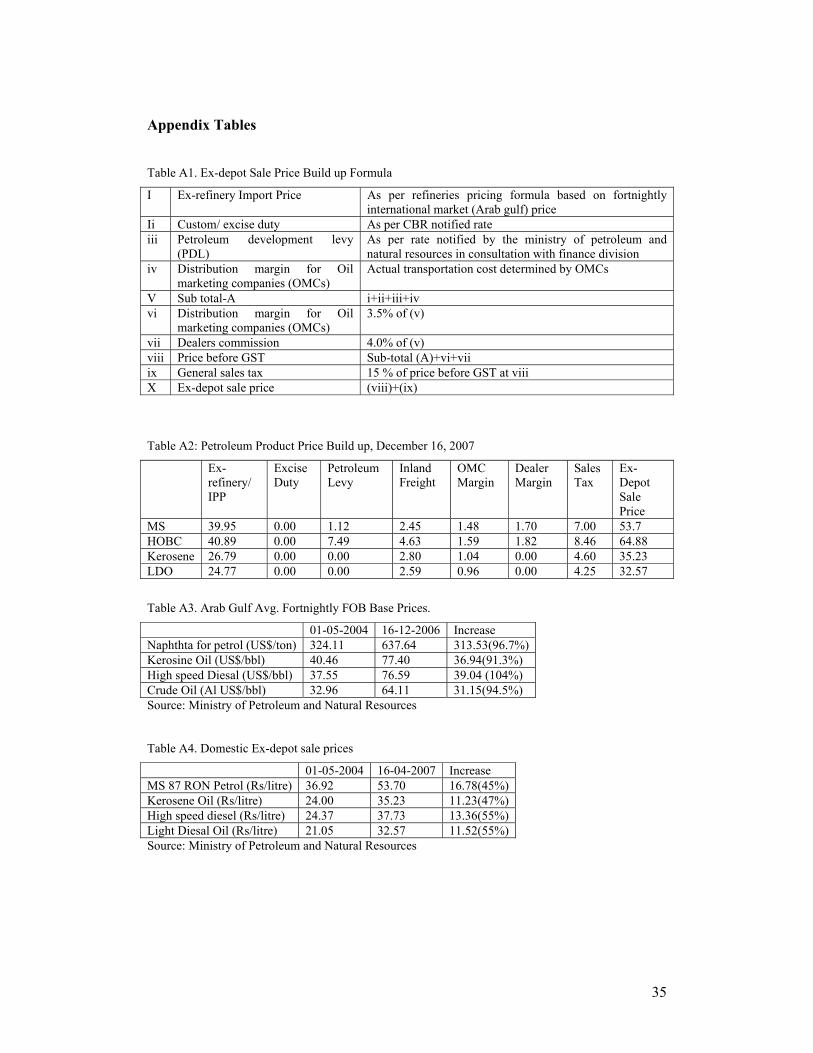
35
Appendix Tables
Table A1. Ex-depot Sale Price Build up Formula
I Ex-refinery Import Price As per refineries pricing formula based on fortnightly international market (Arab gulf) price
Ii Custom/ excise duty As per CBR notified rate iii Petroleum development levy
(PDL) As per rate notified by the ministry of petroleum and natural resources in consultation with finance division
iv Distribution margin for Oil marketing companies (OMCs)
Actual transportation cost determined by OMCs
V Sub total-A i+ii+iii+iv vi Distribution margin for Oil
marketing companies (OMCs) 3.5% of (v)
vii Dealers commission 4.0% of (v) viii Price before GST Sub-total (A)+vi+vii ix General sales tax 15 % of price before GST at viii X Ex-depot sale price (viii)+(ix)
Table A2: Petroleum Product Price Build up, December 16, 2007
Ex-refinery/ IPP
Excise Duty
Petroleum Levy
Inland Freight
OMC Margin
Dealer Margin
Sales Tax
Ex-Depot Sale Price
MS 39.95 0.00 1.12 2.45 1.48 1.70 7.00 53.7 HOBC 40.89 0.00 7.49 4.63 1.59 1.82 8.46 64.88 Kerosene 26.79 0.00 0.00 2.80 1.04 0.00 4.60 35.23 LDO 24.77 0.00 0.00 2.59 0.96 0.00 4.25 32.57
Table A3. Arab Gulf Avg. Fortnightly FOB Base Prices.
01-05-2004 16-12-2006 Increase Naphthta for petrol (US$/ton) 324.11 637.64 313.53(96.7%) Kerosine Oil (US$/bbl) 40.46 77.40 36.94(91.3%) High speed Diesal (US$/bbl) 37.55 76.59 39.04 (104%) Crude Oil (Al US$/bbl) 32.96 64.11 31.15(94.5%) Source: Ministry of Petroleum and Natural Resources
Table A4. Domestic Ex-depot sale prices
01-05-2004 16-04-2007 Increase MS 87 RON Petrol (Rs/litre) 36.92 53.70 16.78(45%) Kerosene Oil (Rs/litre) 24.00 35.23 11.23(47%) High speed diesel (Rs/litre) 24.37 37.73 13.36(55%) Light Diesal Oil (Rs/litre) 21.05 32.57 11.52(55%) Source: Ministry of Petroleum and Natural Resources
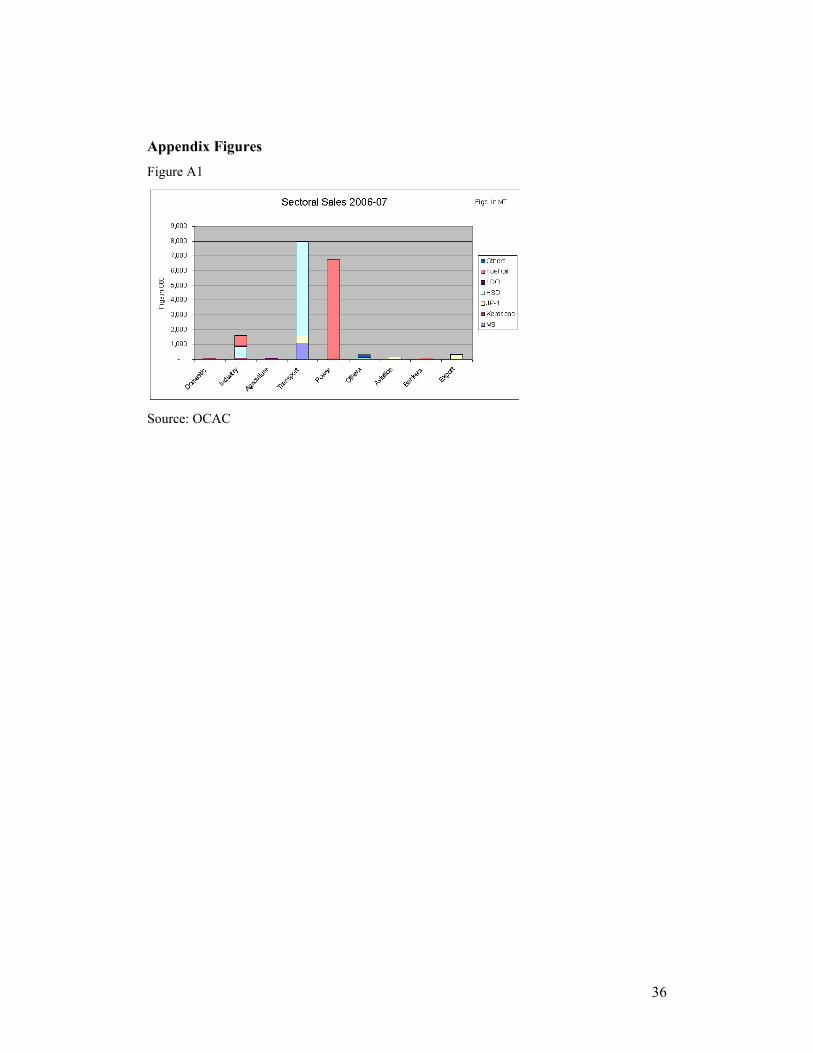
36
Appendix Figures
Figure A1
Source: OCAC