Embed Size (px)
Citation preview
AFFIN INVESTMENT CONFERENCE SERIES
2014
8 April 2014

Disclaimer
These materials have been prepared by Felda Global Ventures Holdings Berhad (“FGVH” or the “Company”) solely for informational purposes, and
are strictly confidential and may not be taken away, reproduced or redistributed to any other person. By attending this presentation, participants
agree not to remove this document from the conference room where such documents are provided without express written consent from the
Company. Participants agree further not to photograph, copy or otherwise reproduce these materials at any point of time during the presentation or
while in your possession. By attending this presentation, you are agreeing to be bound by the foregoing restrictions. Any failure to comply with
these restrictions may result in a violation of applicable laws and commencement of legal proceedings against you.
It is not the Company’s intention to provide, and you may not rely on these materials as providing, a complete or comprehensive analysis of the
Company’s financial position or prospects. The information contained in these materials has not been independently verified and is subject to
verification, completion and change without notice. The information contained in these materials is current as of the date hereof and are subject to
change without notice, and its accuracy is not guaranteed. The Company is not under any obligation to update or keep current the information
contained in these materials subsequent to the date hereof. Accordingly, no representation or warranty, express or implied, is made or given by or
on behalf of the Company, or any of its directors and affiliates or any other person, as to, and no reliance should be placed for any purposes
whatsoever on, the fairness, accuracy, completeness or correctness of, or any errors or omissions in, the information contained in these materials.
Neither the Company, its directors, officers or employees nor any other person accepts any liability whatsoever for any loss howsoever arising from
any use of these materials or their contents or otherwise arising in connection therewith.
These materials contain historical information of the Company which should not be regarded as an indication of future performance or results.
These materials may also contain forward-looking statements that are, by their nature, subject to significant risks and uncertainties. These forward-
looking statements reflect the Company’s current views with respect to future events and are not a guarantee of future performance or results.
Actual results, performance or achievements of the Company may differ materially from any future results, performance or achievements expressed
or implied by such forward-looking statements. Such forward-looking statements are based on numerous assumptions regarding the Company’s
present and future business strategies and the environment in which the Company will operate in the future, and must be read together with such
assumptions. Predictions, projections or forecasts of the economy or economic trends of the markets are not necessarily indicative of the future or
likely performance of the Company, and the forecast financial performance of the Company is not guaranteed. No reliance should be placed on
these forward-looking statements, if any.
2
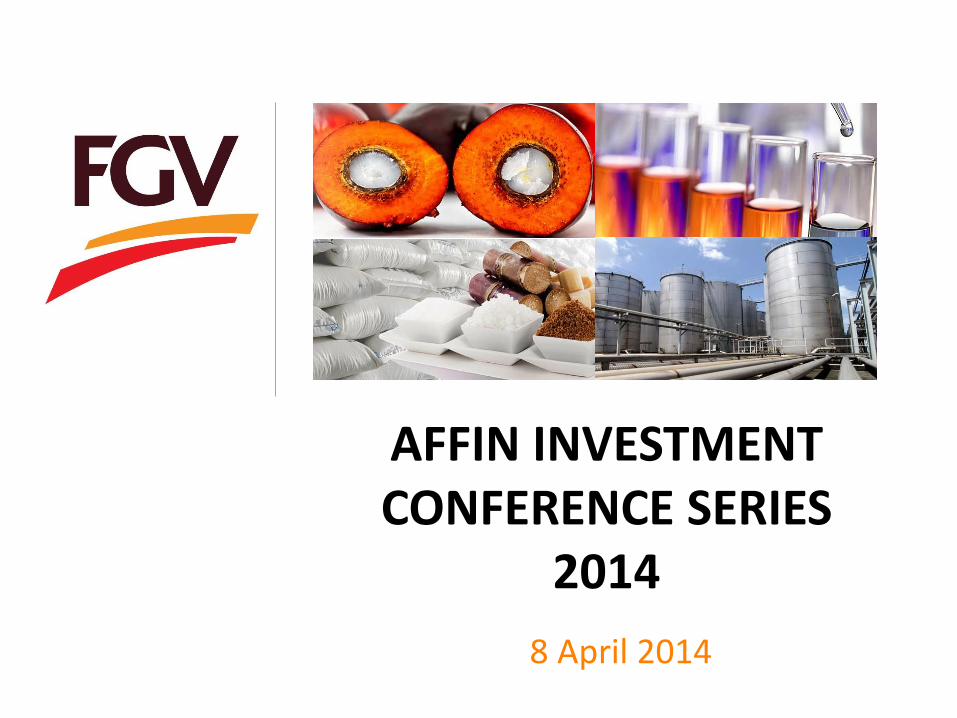
Management Team
Dr. Suzana Idayu Wati Osman
Chief Strategy Officer
PhD (Finance), MBA (Finance),BA Hons
(Business Studies), Advanced Management Program (Harvard)
Dr. Mohd Emir Mavani Abdullah
Chief Executive Officer
PhD (Govt Reforms) Warnborough University, MA
(Engineering Mgmt) Warwick University, BA Hons
(Chemistry) UKM
Dato’ Khairil Anuar Aziz
Chief Operating Officer
Head of Manufacturing Logistic
& Others
BA Hons (Marketing Management)
Fairuz Ismail
Head of Transformation
Management Office
Diploma in Planting & Industry
Management, member of Asian Institute
Management (AIM), and Incorporated
Society of Planters (ISP)
Ahmad Tifli Dato’ Hj Mohd Talha
Chief Financial Officer
Acting Chief Human Resource
Officer
ICAEW, member of Malaysia Institute
of Accountants
Abdul Halim Ahmad
Head of Global Plantations
Diploma in Mechanical Engineering, Chairman of Technical Research of
Malaysia Palm Oil Association
Zakaria Arshad
Head of Downstream Business
Degree of Bachelor of Social Science (Economics), USM, 1984
Palaniappan Swaminathan
Head of Research and
Development B.Sc (Hons), M.Sc. , Cert Dip. A.F
Master of Science, Bachelor of Science
Dato 'Sheikh Awab Sheikh Abod
CEO of MSM Holdings
3
1. Information Background
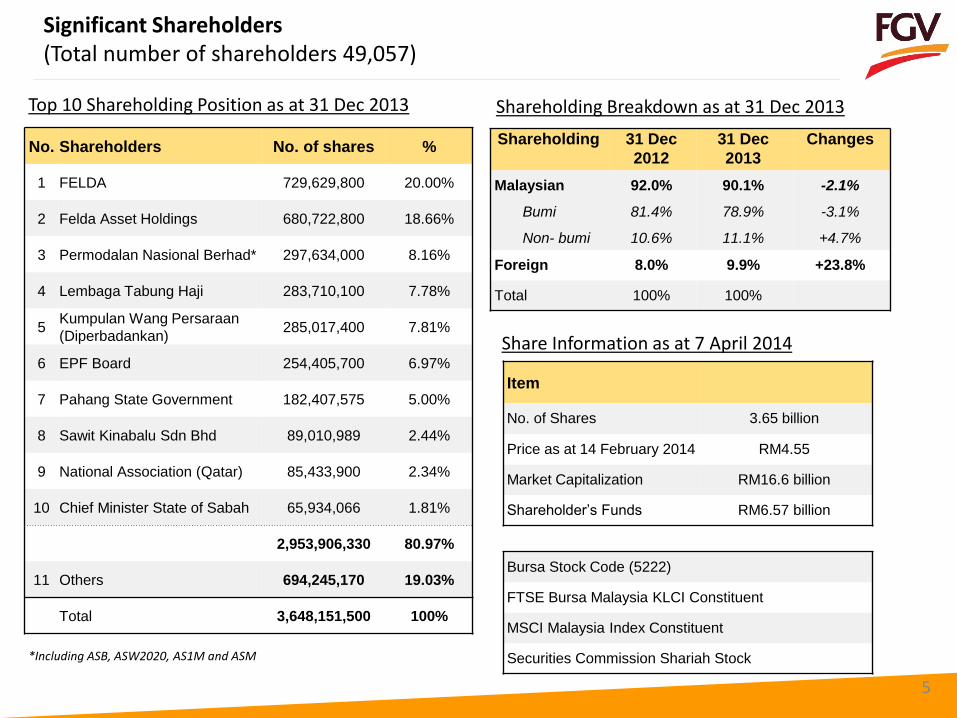
Significant Shareholders (Total number of shareholders 49,057)
Top 10 Shareholding Position as at 31 Dec 2013
Shareholding 31 Dec
2012
31 Dec
2013
Changes
Malaysian
Bumi
Non- bumi
92.0%
81.4%
10.6%
90.1%
78.9%
11.1%
-2.1%
-3.1%
+4.7%
Foreign 8.0% 9.9% +23.8%
Total 100% 100%
Shareholding Breakdown as at 31 Dec 2013
Share Information as at 7 April 2014
Item
No. of Shares 3.65 billion
Price as at 14 February 2014 RM4.55
Market Capitalization RM16.6 billion
Shareholder’s Funds RM6.57 billion
Bursa Stock Code (5222)
FTSE Bursa Malaysia KLCI Constituent
MSCI Malaysia Index Constituent
Securities Commission Shariah Stock
5
No. Shareholders No. of shares %
1 FELDA 729,629,800 20.00%
2 Felda Asset Holdings 680,722,800 18.66%
3 Permodalan Nasional Berhad* 297,634,000 8.16%
4 Lembaga Tabung Haji 283,710,100 7.78%
5 Kumpulan Wang Persaraan
(Diperbadankan) 285,017,400 7.81%
6 EPF Board 254,405,700 6.97%
7 Pahang State Government 182,407,575 5.00%
8 Sawit Kinabalu Sdn Bhd 89,010,989 2.44%
9 National Association (Qatar) 85,433,900 2.34%
10 Chief Minister State of Sabah 65,934,066 1.81%
2,953,906,330 80.97%
11 Others 694,245,170 19.03%
Total 3,648,151,500 100%
*Including ASB, ASW2020, AS1M and ASM

History
1956 Federal Land
Development Authority ("FELDA”) was established as a statutory body under Land Development Ordinance
1959 – 1990 More than 850,00 Ha of land granted by state government under Group Settlement Area Act 1960 (“GSA”) had been brought under cultivation through FELDA operations
1980 Koperasi
Permodalan Felda (“KPF”) was established under the Co-operative Act
1990 FELDA decided
to stop further intake of small holders
1995 Incorporation of
Felda Holdings Berhad (“FHB”) as a wholly owned subsidiary of FELDA
2007 Incorporation of
FGV as a wholly owned subsidiary of FELDA
2008 FGV acquired
FGV North America from FELDA
2009 FGV acquired
49% equity interest in FHB from FELDA
2010 FGVH acquired
sugar business
2011 MSM Holdings
was listed on the Main Market of Bursa Securities
2012 Adoption of
New Business Model
28 June 2012 FGV was listed on the Main Market of Bursa Securities on 28 June 2012
2013 FGV gained full
control of FHB by acquiring 51% from KPF
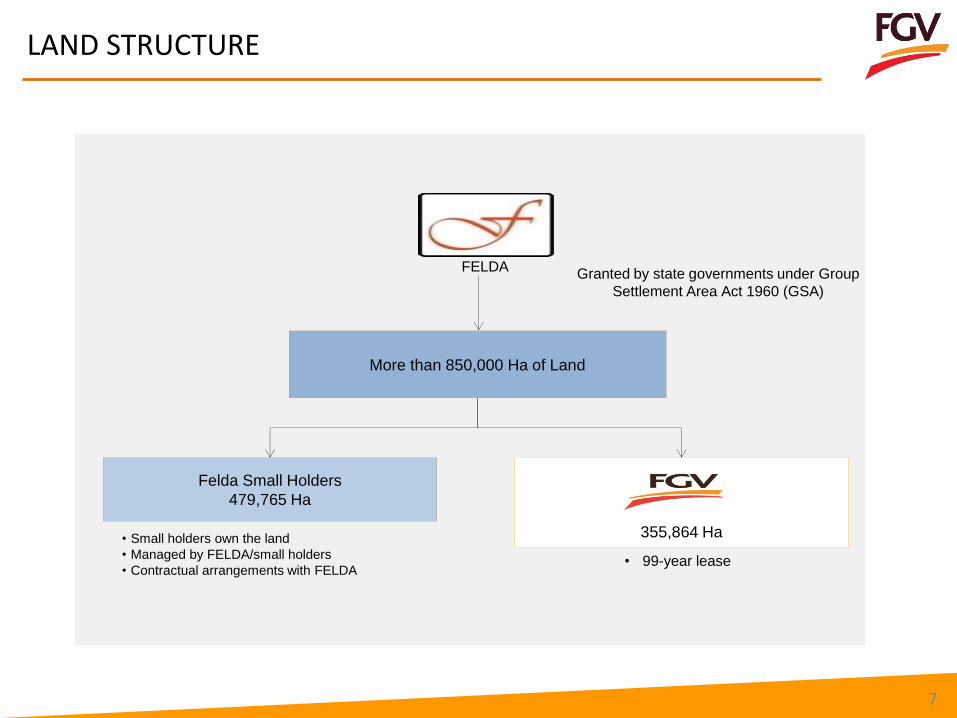
LAND STRUCTURE
More than 850,000 Ha of Land
355,864 Ha
Felda Small Holders
479,765 Ha
• Small holders own the land
• Managed by FELDA/small holders
• Contractual arrangements with FELDA • 99-year lease
Granted by state governments under Group
Settlement Area Act 1960 (GSA)
FELDA
7

1. Business Snapshot

• Total land approx.
467,656 ha of which 357
723 are leased from
FELDA.
• Malaysia:
Approx. 390,234 ha of
plantation of which:
335,336 ha of oil
palm
14,487 ha of rubber
• Indonesia
Approx. 77,422 ha of
plantation of which:
53,392 ha of oil
palm plantation
12,844 ha of rubber
plantation
Plantations
MSM
57% market
share
2 sugar refineries
− Chuping, Perlis
− Seberang Prai,
Penang
Sugar
• United States:
– 1 oleo-chemical
facility
• Canada:
– 1 soybean and
canola crushing and
refining facility in
Canada
• Through JVs
– 2 refineries in
Malaysia
– 4 refineries in
Indonesia, China and
Turkey
– 1 downstream
processing facilities in
China
– 1 other oils & fats
facility in the United
States
Downstream
3.2 MM MT of CPO
produced in 2013
72 palm oil mills
5 palm oil refineries and 2
refineries in Pakistan and
China through an associate
and a joint venture
1 oleochemical plant
through an associate in
Kuantan
Other Businesses
• Manufacturing and
Logistics
• Support services
Manufacturing, Logistic & Others
FGV GROUP STRUCTURE
9
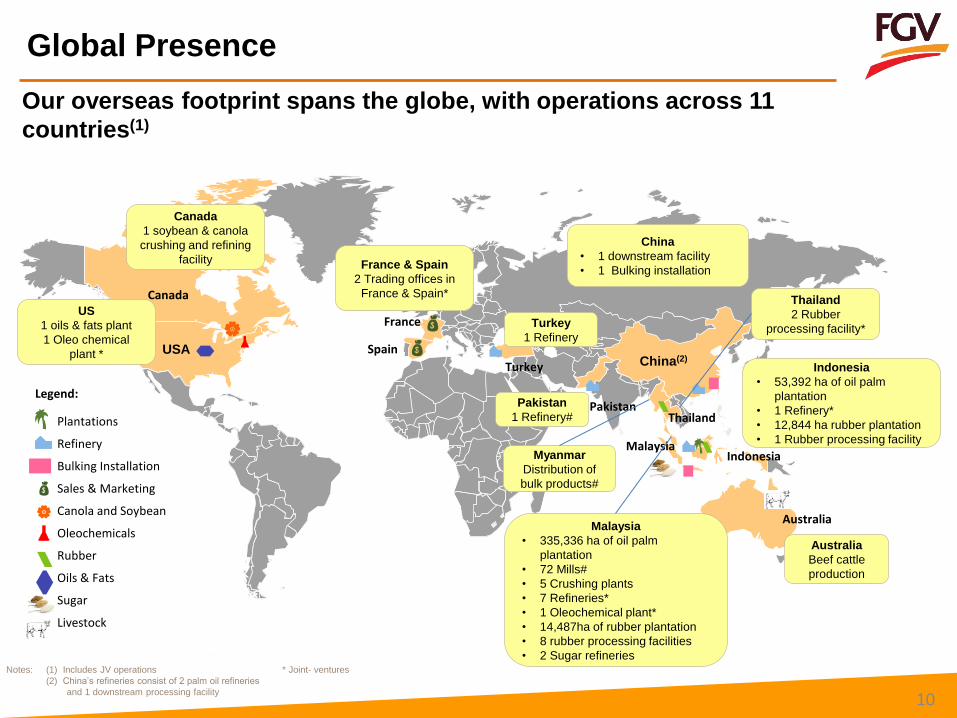
Global Presence
Notes: (1) Includes JV operations * Joint- ventures
(2) China’s refineries consist of 2 palm oil refineries
and 1 downstream processing facility
Our overseas footprint spans the globe, with operations across 11
countries(1)
Plantations
Refinery
Bulking Installation
Sales & Marketing
Canola and Soybean
Oleochemicals
Rubber
Oils & Fats
Sugar
Livestock
Legend:
Canada
USA China(2)
Indonesia
Pakistan
France
Spain
Malaysia
Thailand
Turkey
10
Australia
US
1 oils & fats plant
1 Oleo chemical
plant *
Canada
1 soybean & canola
crushing and refining
facility France & Spain
2 Trading offices in
France & Spain*
Turkey
1 Refinery
Pakistan
1 Refinery#
Myanmar
Distribution of
bulk products#
Malaysia
• 335,336 ha of oil palm
plantation
• 72 Mills#
• 5 Crushing plants
• 7 Refineries*
• 1 Oleochemical plant*
• 14,487ha of rubber plantation
• 8 rubber processing facilities
• 2 Sugar refineries
Australia
Beef cattle
production
Indonesia
• 53,392 ha of oil palm
plantation
• 1 Refinery*
• 12,844 ha rubber plantation
• 1 Rubber processing facility
Thailand
2 Rubber
processing facility*
China
• 1 downstream facility
• 1 Bulking installation
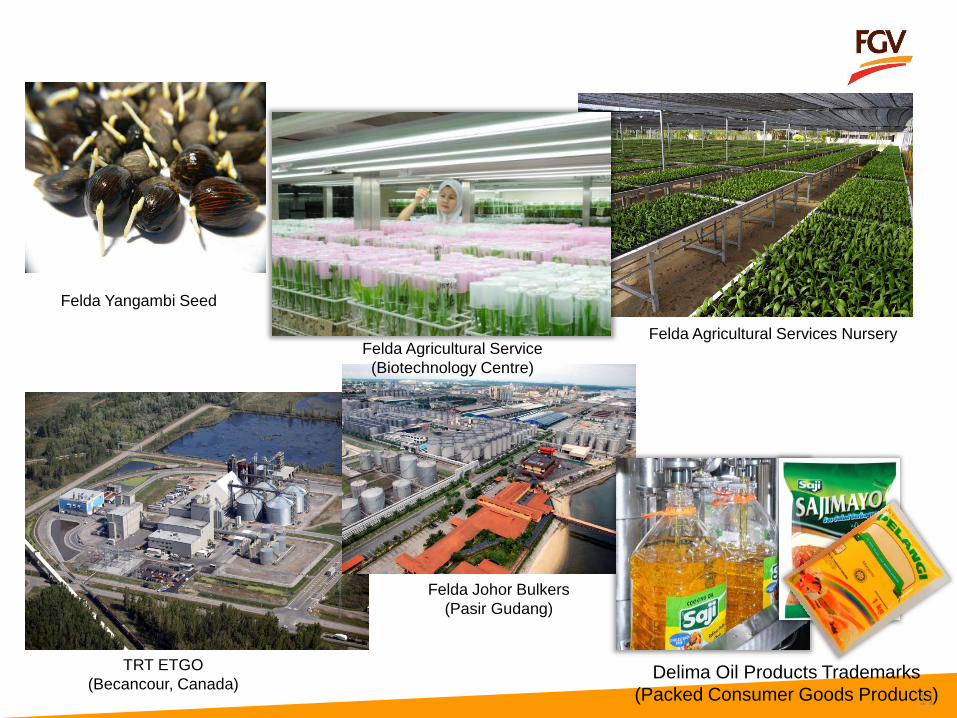
Felda Yangambi Seed
Felda Agricultural Services Nursery Felda Agricultural Service
(Biotechnology Centre)
TRT ETGO
(Becancour, Canada)
Felda Johor Bulkers
(Pasir Gudang)
Delima Oil Products Trademarks
(Packed Consumer Goods Products) 11
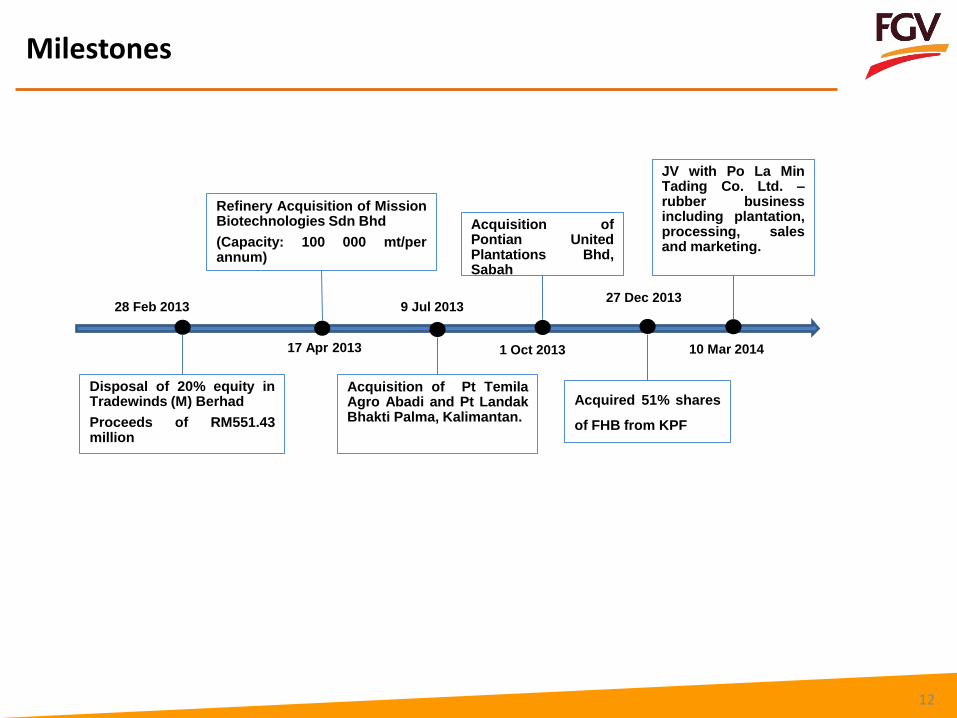
Milestones
12
28 Feb 2013
Disposal of 20% equity in Tradewinds (M) Berhad
Proceeds of RM551.43 million
Refinery Acquisition of Mission Biotechnologies Sdn Bhd
(Capacity: 100 000 mt/per annum)
17 Apr 2013
Acquisition of Pt Temila Agro Abadi and Pt Landak Bhakti Palma, Kalimantan.
9 Jul 2013
Acquisition of Pontian United Plantations Bhd, Sabah
1 Oct 2013
Acquired 51% shares
of FHB from KPF
27 Dec 2013
JV with Po La Min Tading Co. Ltd. – rubber business including plantation, processing, sales and marketing.
10 Mar 2014
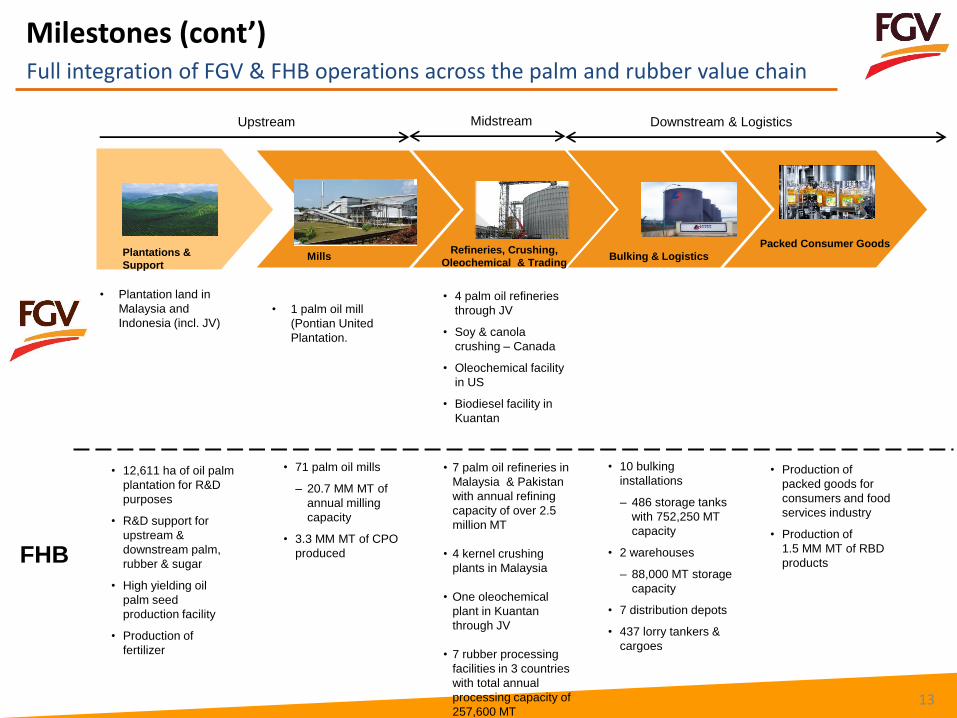
Full integration of FGV & FHB operations across the palm and rubber value chain
• 71 palm oil mills
– 20.7 MM MT of
annual milling
capacity
• 3.3 MM MT of CPO
produced
• 4 palm oil refineries
through JV
• Soy & canola
crushing – Canada
• Oleochemical facility
in US
• Biodiesel facility in
Kuantan
• Plantation land in
Malaysia and
Indonesia (incl. JV)
• Production of
packed goods for
consumers and food
services industry
• Production of
1.5 MM MT of RBD
products
Upstream Downstream & Logistics
• 10 bulking
installations
– 486 storage tanks
with 752,250 MT
capacity
• 2 warehouses
– 88,000 MT storage
capacity
• 7 distribution depots
• 437 lorry tankers &
cargoes
Plantations &
Support Mills Refineries, Crushing,
Oleochemical & Trading Bulking & Logistics
Packed Consumer Goods
• 7 palm oil refineries in
Malaysia & Pakistan
with annual refining
capacity of over 2.5
million MT
• 4 kernel crushing
plants in Malaysia
• One oleochemical
plant in Kuantan
through JV
• 7 rubber processing
facilities in 3 countries
with total annual
processing capacity of
257,600 MT
FHB
• 12,611 ha of oil palm
plantation for R&D
purposes
• R&D support for
upstream &
downstream palm,
rubber & sugar
• High yielding oil
palm seed
production facility
• Production of
fertilizer
Midstream
Milestones (cont’)
13
• 1 palm oil mill
(Pontian United
Plantation.

1. Our Business
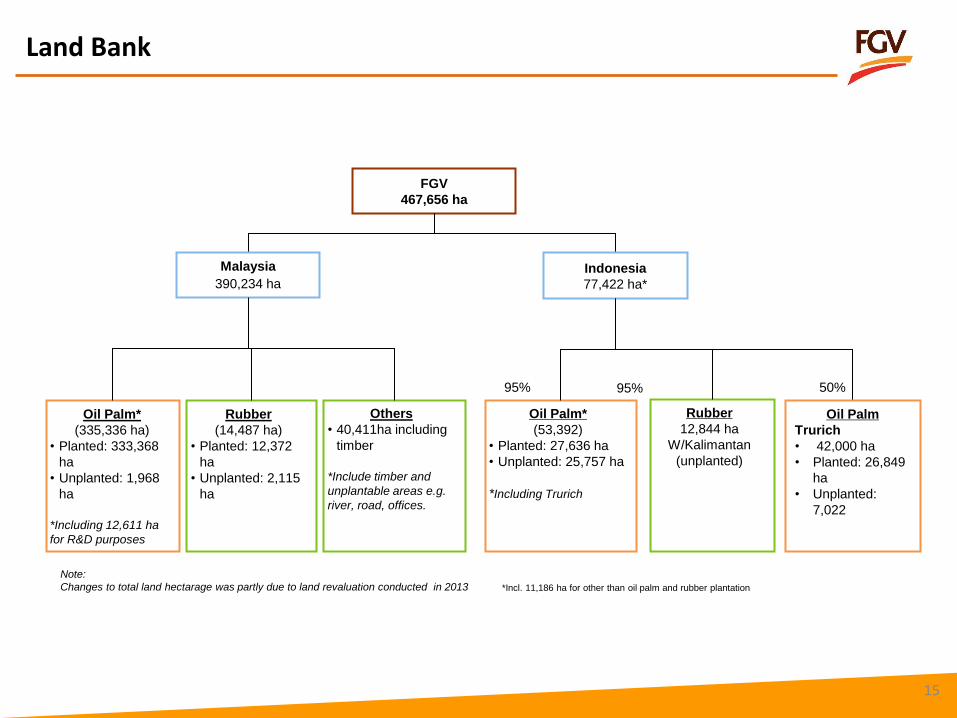
Land Bank
Total Land Bank
15
Palm Plantation Age Profile
Oil Palm*
(335,336 ha)
• Planted: 333,368
ha
• Unplanted: 1,968
ha
*Including 12,611 ha
for R&D purposes
Rubber
(14,487 ha)
• Planted: 12,372
ha
• Unplanted: 2,115
ha
FGV
467,656 ha
Malaysia
390,234 ha
Oil Palm
Trurich
• 42,000 ha
• Planted: 26,849
ha
• Unplanted:
7,022
50%
Indonesia
77,422 ha*
Oil Palm*
(53,392)
• Planted: 27,636 ha
• Unplanted: 25,757 ha
*Including Trurich
95%
Rubber
12,844 ha
W/Kalimantan
(unplanted)
95%
Others
• 40,411ha including
timber
*Include timber and
unplantable areas e.g.
river, road, offices.
*Incl. 11,186 ha for other than oil palm and rubber plantation
Note:
Changes to total land hectarage was partly due to land revaluation conducted in 2013
Perlis
Kedah
Penang
Perak
Kelantan Terengganu
Pahang
Selangor
Negeri
Sembilan
Johor Malacca
Oil Palm Land Sabah
Sarawak
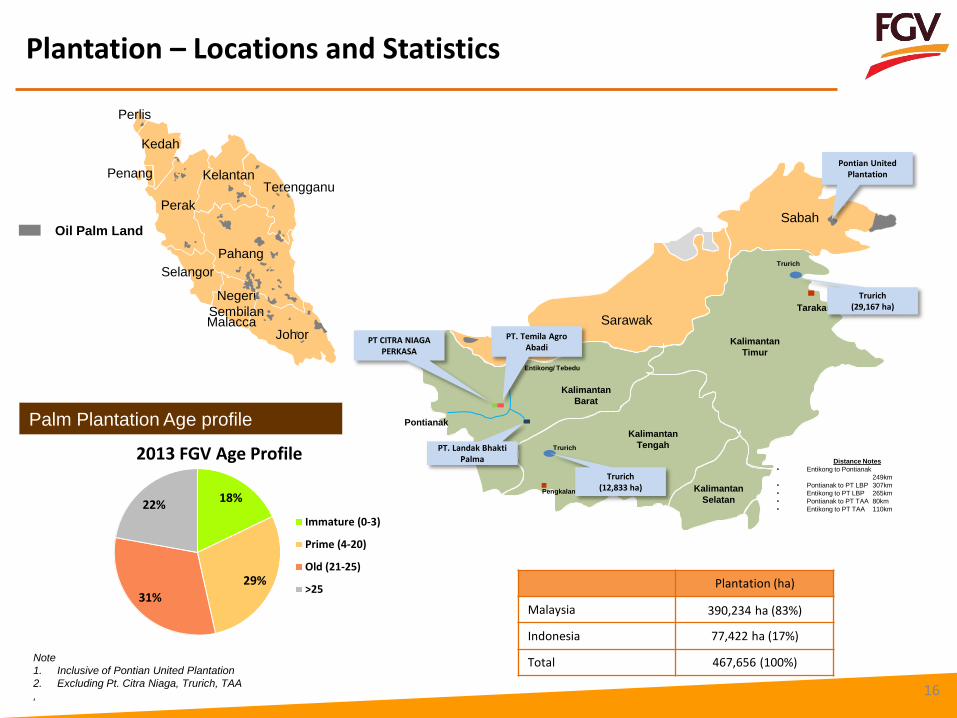
Distance Notes
• Entikong to Pontianak
249km
• Pontianak to PT LBP 307km
• Entikong to PT LBP 265km
• Pontianak to PT TAA 80km
• Entikong to PT TAA 110km
Pontianak
Kalimantan
Barat
Entikong/ Tebedu
Kalimantan
Tengah
Kalimantan
Timur
Kalimantan
Selatan
PT CITRA NIAGA PERKASA
PT. Temila Agro Abadi
PT. Landak Bhakti Palma
Pengkalanbun
Tarakan
Trurich
Trurich
Trurich (12,833 ha)
Trurich (29,167 ha)
Pontian United Plantation
Plantation – Locations and Statistics
Plantation (ha)
Malaysia 390,234 ha (83%)
Indonesia 77,422 ha (17%)
Total 467,656 (100%)
16
Palm Plantation Age profile
Note
1. Inclusive of Pontian United Plantation
2. Excluding Pt. Citra Niaga, Trurich, TAA
,
18%
29%
31%
22%
2013 FGV Age Profile
Immature (0-3)
Prime (4-20)
Old (21-25)
>25

Plantation Indicators
5.16
4.91
5.05
2011 2012 2013
FFB Production (million MT)
19.92
19.16
19.59
2011 2012 2013
FFB Yield (MT/ ha)
3.29 3.29 3.22
2011 2012 2013
CPO Production (million MT)
20.48% 20.51%
20.44%
2011 2012 2013
Oil Extraction Rate
17
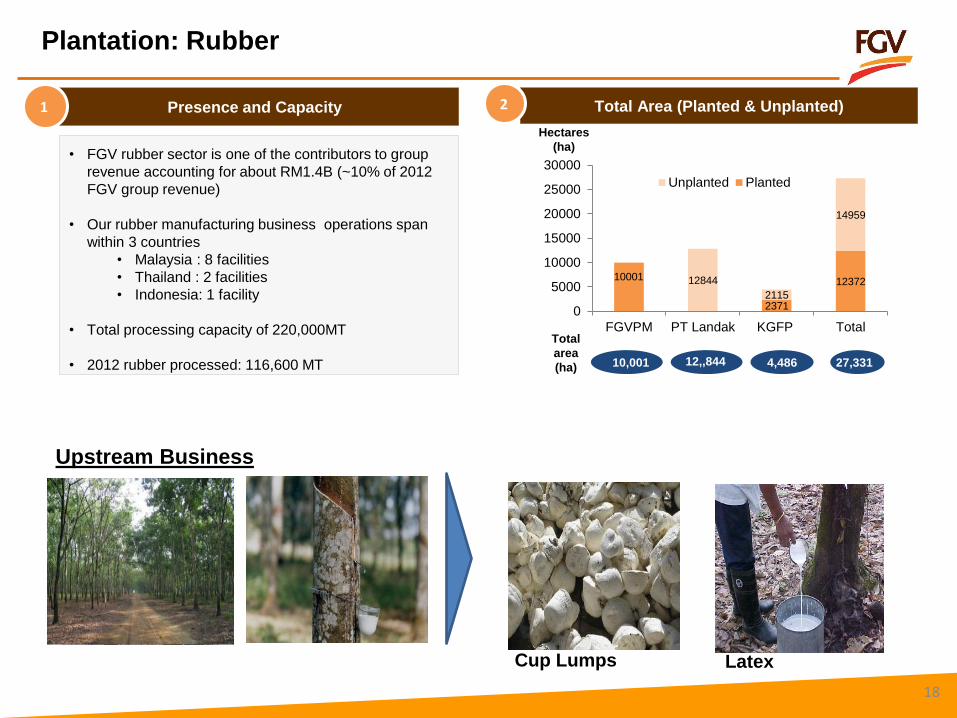
Presence and Capacity 1
• FGV rubber sector is one of the contributors to group
revenue accounting for about RM1.4B (~10% of 2012
FGV group revenue)
• Our rubber manufacturing business operations span
within 3 countries
• Malaysia : 8 facilities
• Thailand : 2 facilities
• Indonesia: 1 facility
• Total processing capacity of 220,000MT
• 2012 rubber processed: 116,600 MT
Plantation: Rubber
Total Area (Planted & Unplanted) 2
10001
2371
12372 12844
2115
14959
0
5000
10000
15000
20000
25000
30000
FGVPM PT Landak KGFP Total
Unplanted Planted
10,001 12,,844 4,486 27,331
Total
area
(ha)
Hectares
(ha)
Upstream Business
Cup Lumps Latex
18
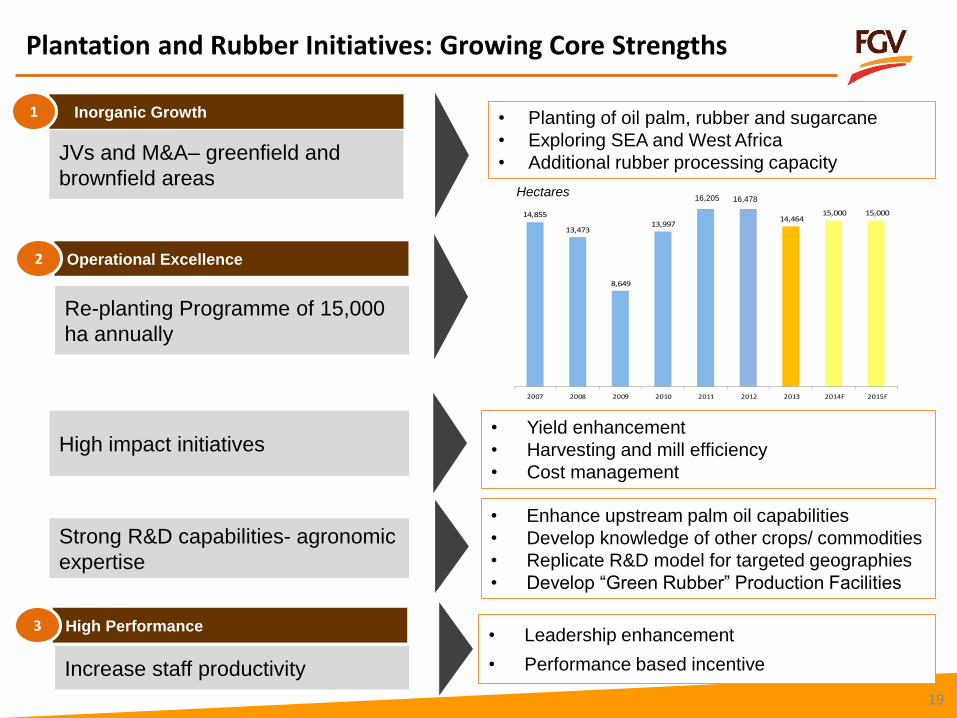
Plantation and Rubber Initiatives: Growing Core Strengths
Operational Excellence 2
19
14,855
13,473
8,649
13,99714,464
15,000 15,000
2007 2008 2009 2010 2011 2012 2013 2014F 2015F
Hectares
JVs and M&A– greenfield and
brownfield areas
• Planting of oil palm, rubber and sugarcane
• Exploring SEA and West Africa
• Additional rubber processing capacity
Inorganic Growth 1
Re-planting Programme of 15,000
ha annually
High impact initiatives • Yield enhancement
• Harvesting and mill efficiency
• Cost management
Strong R&D capabilities- agronomic
expertise
High Performance 3
Increase staff productivity
• Leadership enhancement
• Performance based incentive
• Enhance upstream palm oil capabilities
• Develop knowledge of other crops/ commodities
• Replicate R&D model for targeted geographies
• Develop “Green Rubber” Production Facilities
16,478 16,205
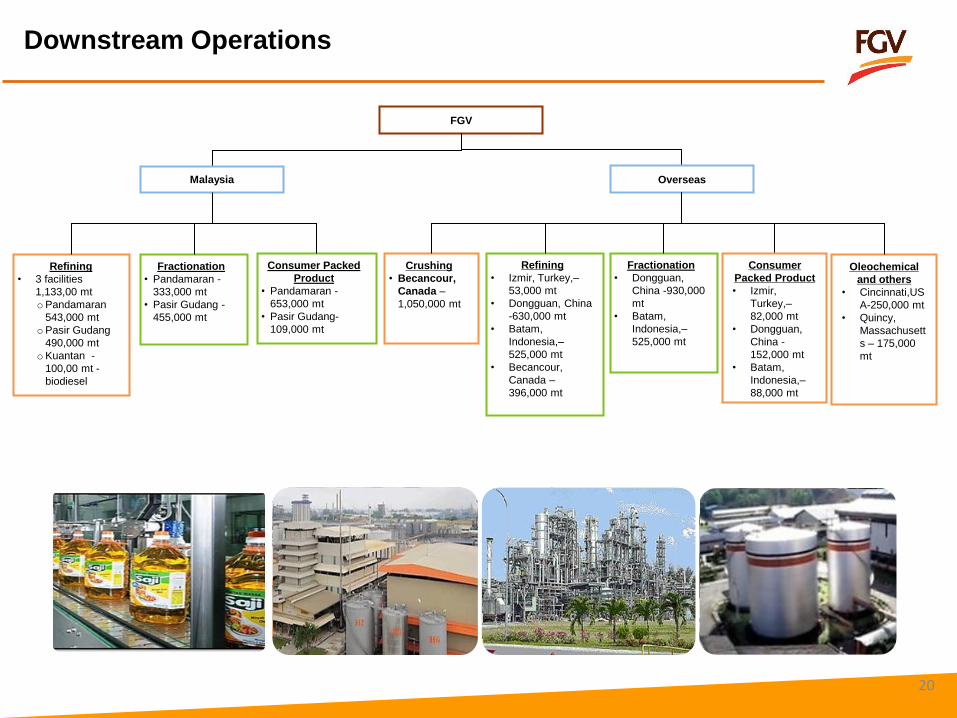
Downstream Operations
20
Refining
• 3 facilities
1,133,00 mt
oPandamaran
543,000 mt
oPasir Gudang
490,000 mt
oKuantan -
100,00 mt -
biodiesel
Fractionation
• Pandamaran -
333,000 mt
• Pasir Gudang -
455,000 mt
FGV
Malaysia
Consumer
Packed Product
• Izmir,
Turkey,–
82,000 mt
• Dongguan,
China -
152,000 mt
• Batam,
Indonesia,–
88,000 mt
Overseas
Crushing
• Becancour,
Canada –
1,050,000 mt
Refining
• Izmir, Turkey,–
53,000 mt
• Dongguan, China
-630,000 mt
• Batam,
Indonesia,–
525,000 mt
• Becancour,
Canada –
396,000 mt
Consumer Packed
Product
• Pandamaran -
653,000 mt
• Pasir Gudang-
109,000 mt
Oleochemical
and others
• Cincinnati,US
A-250,000 mt
• Quincy,
Massachusett
s – 175,000
mt
Fractionation
• Dongguan,
China -930,000
mt
• Batam,
Indonesia,–
525,000 mt
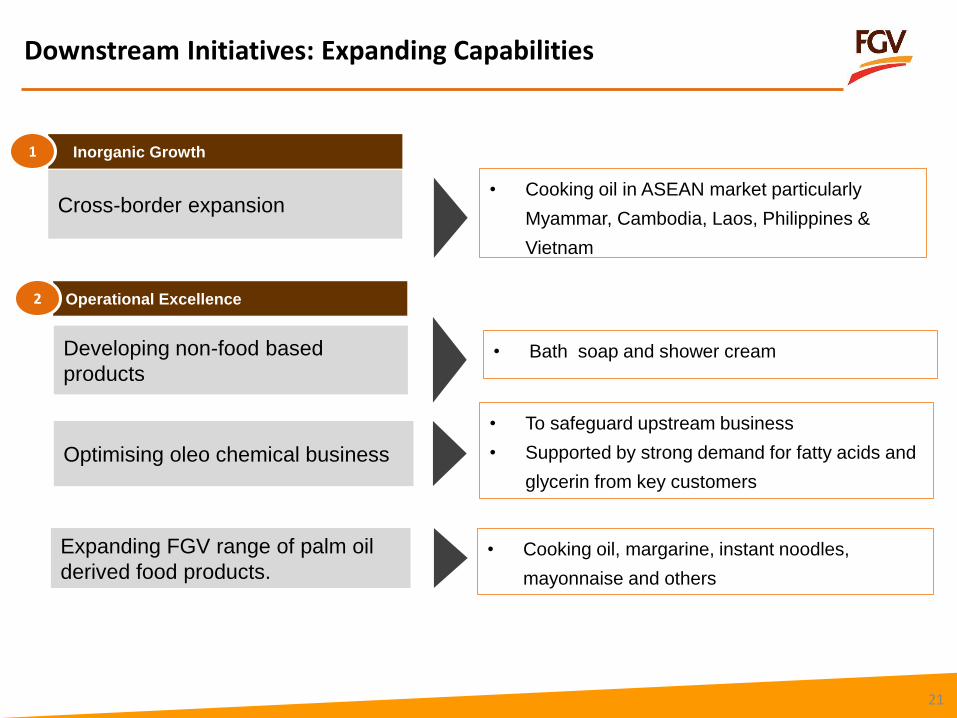
Downstream Initiatives: Expanding Capabilities
Operational Excellence 2
21
Cross-border expansion • Cooking oil in ASEAN market particularly
Myammar, Cambodia, Laos, Philippines &
Vietnam
Inorganic Growth 1
Developing non-food based
products
Optimising oleo chemical business
• Bath soap and shower cream
Expanding FGV range of palm oil
derived food products. • Cooking oil, margarine, instant noodles,
mayonnaise and others
• To safeguard upstream business
• Supported by strong demand for fatty acids and
glycerin from key customers
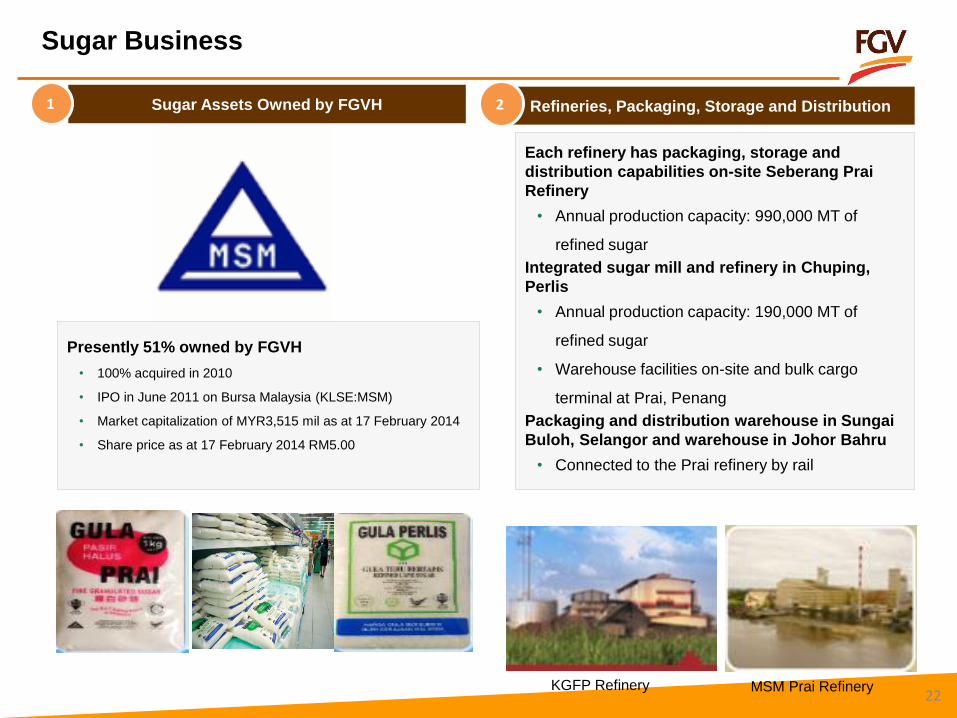
Presently 51% owned by FGVH
• 100% acquired in 2010
• IPO in June 2011 on Bursa Malaysia (KLSE:MSM)
• Market capitalization of MYR3,515 mil as at 17 February 2014
• Share price as at 17 February 2014 RM5.00
Refineries, Packaging, Storage and Distribution 2
Each refinery has packaging, storage and
distribution capabilities on-site Seberang Prai
Refinery
• Annual production capacity: 990,000 MT of
refined sugar
Integrated sugar mill and refinery in Chuping,
Perlis
• Annual production capacity: 190,000 MT of
refined sugar
• Warehouse facilities on-site and bulk cargo
terminal at Prai, Penang
Packaging and distribution warehouse in Sungai
Buloh, Selangor and warehouse in Johor Bahru
• Connected to the Prai refinery by rail
Sugar Business
Sugar Assets Owned by FGVH 1
22 MSM Prai Refinery KGFP Refinery
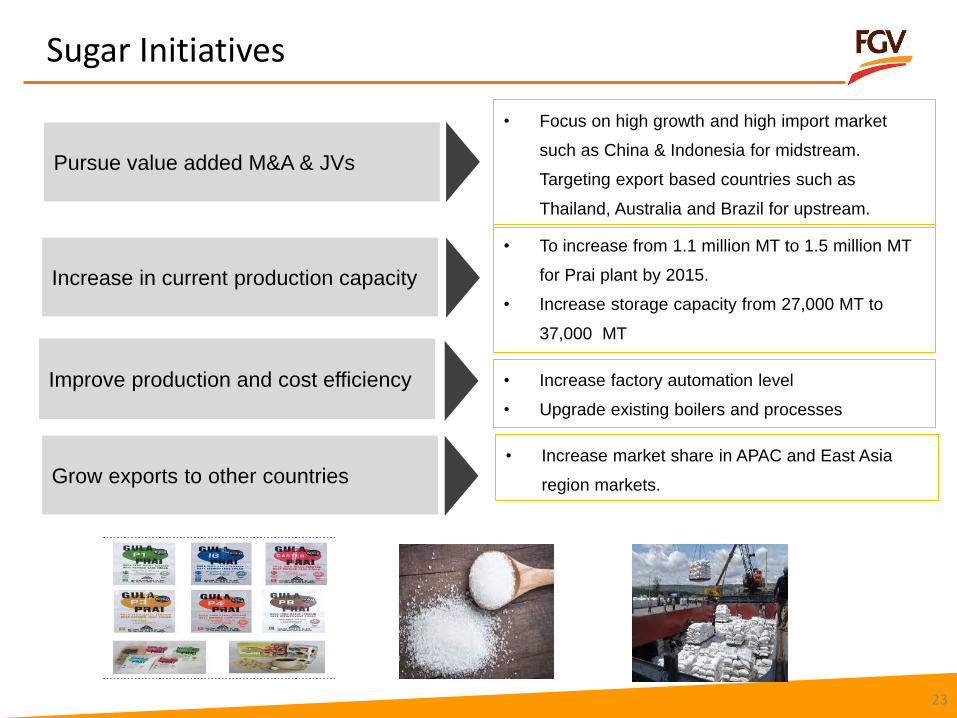
Sugar Initiatives
Increase in current production capacity
Improve production and cost efficiency
• To increase from 1.1 million MT to 1.5 million MT
for Prai plant by 2015.
• Increase storage capacity from 27,000 MT to
37,000 MT
• Increase factory automation level
• Upgrade existing boilers and processes
Grow exports to other countries • Increase market share in APAC and East Asia
region markets.
Pursue value added M&A & JVs
• Focus on high growth and high import market
such as China & Indonesia for midstream.
Targeting export based countries such as
Thailand, Australia and Brazil for upstream.
23

Globally expanding our excellence in R & D
Oil Palm Breeding & Selection
Biotechnology
Agronomy & Crop Protection
Programs
Applied Technology
Oils & Fats R&D
Activities Annual Production Capacity Percentage of sales to external parties
FFB Production from oil palm plantation land (11,723 hectares)
28 MT/hectare 0%
Oil Palm Seed Production 30,000,000 germinated seeds 92%
Oil Palm Seedlings Production 1,500,000 seedlings 95%
Tissues Culture Production
Oil Palm Ramets 2,500,000 ramets 0%
Banana Ramets 2,500,000 ramets 100%
Rat Baits 200,000 boxes 56%
Fertiliser, Foliar and Soil Analysis
50% Fertiliser Analysis 500,000 MT
Foliar Analysis 600,000 hectares
Soil Analysis 600,000 hectares
Increase yield and
efficiency
Reduce production costs
Ensure environmental
sustainability
Maximize profits in the
long run
• Active since 1968 via Tun Razak Agricultural Services
Center
• Germinated Seeds: Award-winning Felda Yangambi
brand
• Research center located in Enstek, Nilai
• Biomolecular marker research
• Filed patents for 2 types of markers
• Focus on four main pests(3) using integrated pest
management with emphasis on biological control
• Production and sale of rat bait
• Electronics and wireless sensor network technology
• Geographical information systems
• Focuses on food and non-food product development.
24
1. Global Strategic Blueprint

To be the leading globally
diversified & integrated
agribusiness
Rubber Industrial Fats
Global supply chain to defend upstream
M&A to build winning positions
High performance capabilities
Palm Oleo chemical
Palm
Consumer
Goods
R&D and Technology Incubator
Sugar
GLOBAL STRATEGIC BLUEPRINT
26
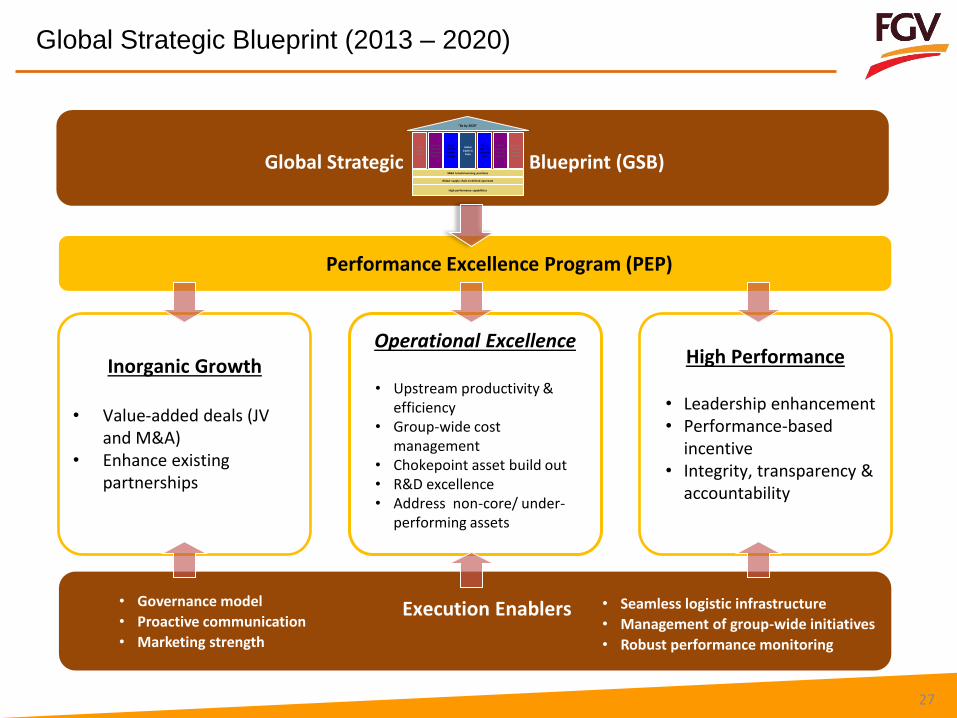
Global Strategic Blueprint (2013 – 2020)
High Performance
• Leadership enhancement • Performance-based
incentive • Integrity, transparency &
accountability
Operational Excellence
• Upstream productivity & efficiency
• Group-wide cost management
• Chokepoint asset build out • R&D excellence • Address non-core/ under-
performing assets
Inorganic Growth
• Value-added deals (JV
and M&A) • Enhance existing
partnerships
Performance Excellence Program (PEP)
Execution Enablers
• Governance model
• Proactive communication
• Marketing strength
• Seamless logistic infrastructure
• Management of group-wide initiatives
• Robust performance monitoring
Global Strategic Blueprint (GSB)
"8x by 2020"
Tech
Incuba-
tors1
SEA and
Africa as
Upstream
Anchor
Global
Top 3 in
Rubber
& Sugar
Global
Top 3 in
Industrial
Fats
Global supply chain to defend upstream
M&A to build winning positions
High performance capabilities
Global
leader in
Palm
Optimize
US Oleo-
chemical
position
SEA &
South Asia
Top 5 in
Palm CG
27
28
EQUATOR
TROPIC OF CANCER
TROPIC OF CAPRICORN
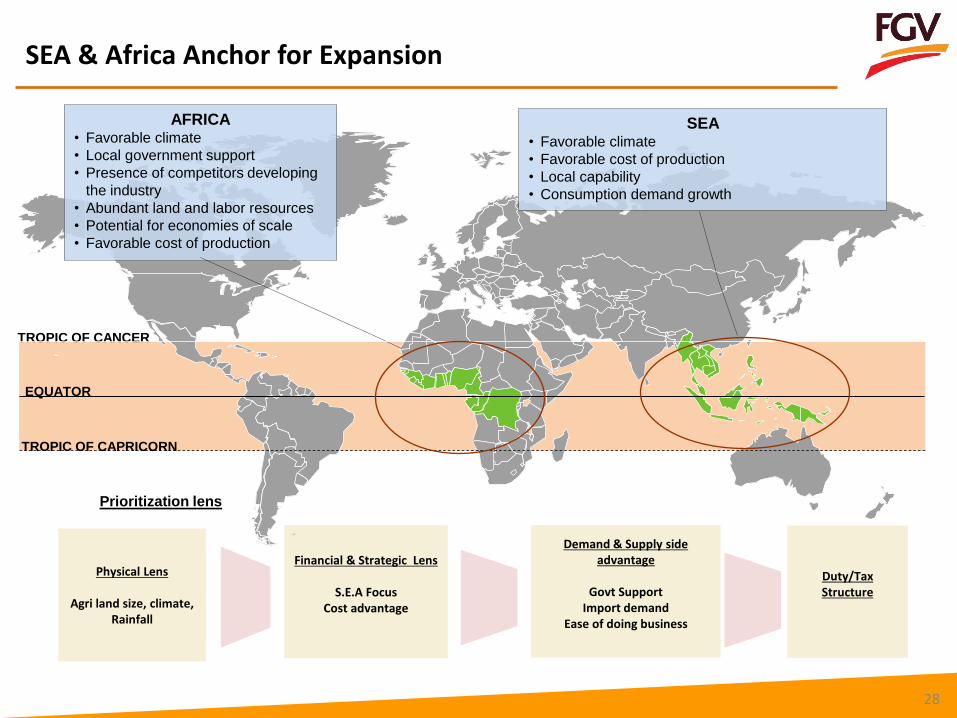
AFRICA • Favorable climate
• Local government support
• Presence of competitors developing
the industry
• Abundant land and labor resources
• Potential for economies of scale
• Favorable cost of production
SEA • Favorable climate
• Favorable cost of production
• Local capability
• Consumption demand growth
SEA & Africa Anchor for Expansion
Prioritization lens
Physical Lens
Agri land size, climate, Rainfall
Financial & Strategic Lens
S.E.A Focus Cost advantage
Demand & Supply side advantage
Govt Support
Import demand Ease of doing business
Duty/Tax Structure
1. Sustainability
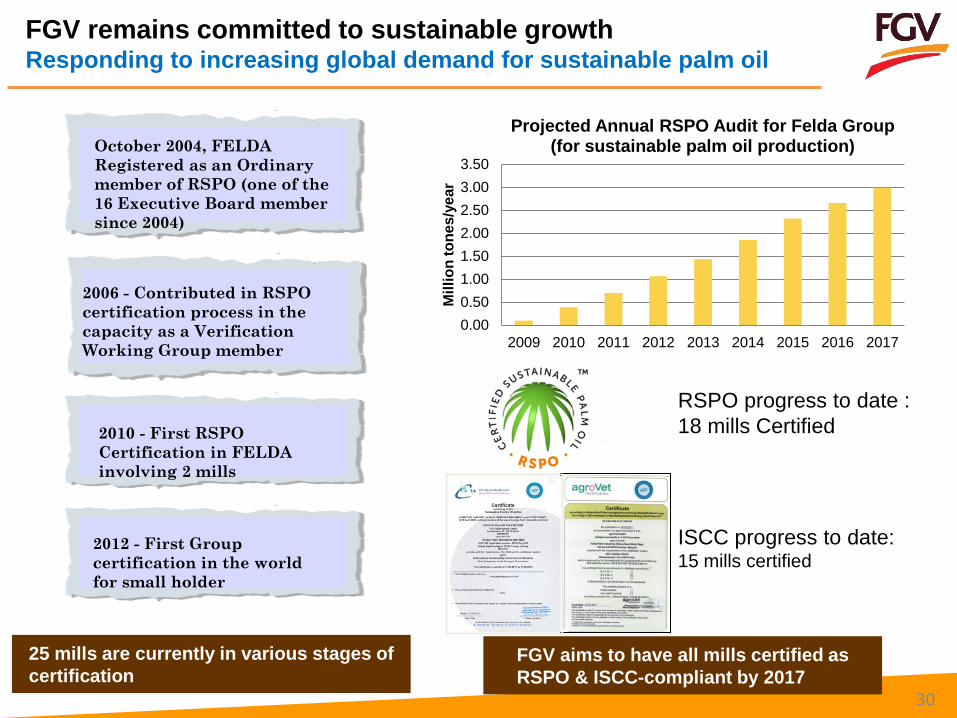
FGV remains committed to sustainable growth Responding to increasing global demand for sustainable palm oil
RSPO progress to date :
18 mills Certified
0.00
0.50
1.00
1.50
2.00
2.50
3.00
3.50
2009 2010 2011 2012 2013 2014 2015 2016 2017
Mil
lio
n t
on
es/y
ear
Projected Annual RSPO Audit for Felda Group (for sustainable palm oil production)
ISCC progress to date: 15 mills certified
2006 - Contributed in RSPO
certification process in the
capacity as a Verification
Working Group member
October 2004, FELDA
Registered as an Ordinary
member of RSPO (one of the
16 Executive Board member
since 2004)
2012 - First Group
certification in the world
for small holder
25 mills are currently in various stages of
certification FGV aims to have all mills certified as
RSPO & ISCC-compliant by 2017
2010 - First RSPO
Certification in FELDA
involving 2 mills
30

1. Financial Highlights and Utilisation of IPO Proceeds
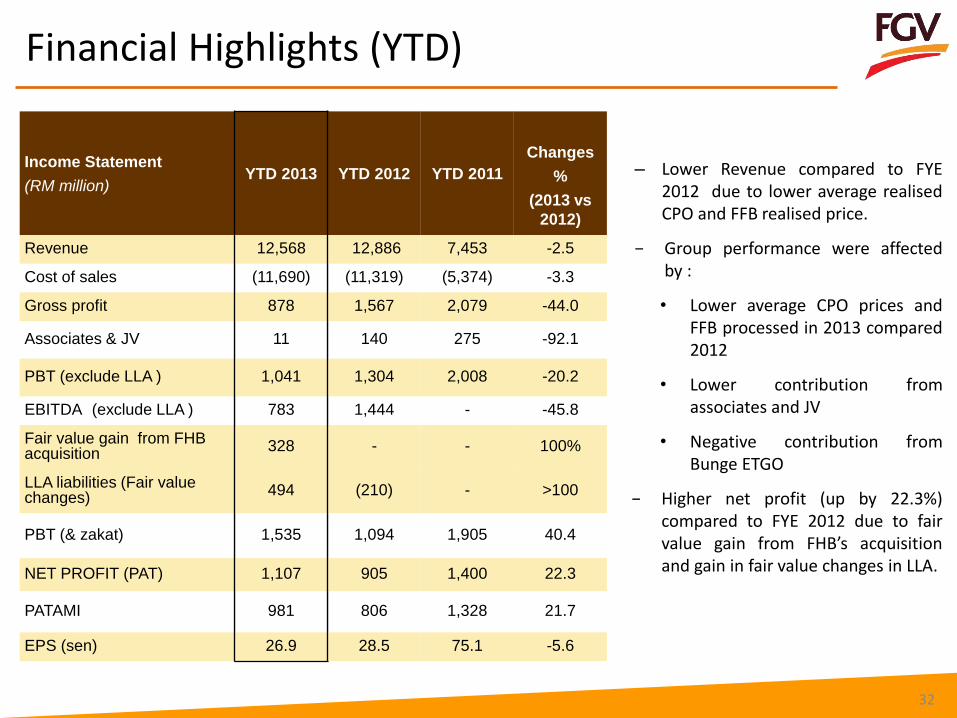
Income Statement
(RM million) YTD 2013 YTD 2012 YTD 2011
Changes
%
(2013 vs
2012)
Revenue 12,568 12,886 7,453 -2.5
Cost of sales (11,690) (11,319) (5,374) -3.3
Gross profit 878 1,567 2,079 -44.0
Associates & JV 11 140 275 -92.1
PBT (exclude LLA ) 1,041 1,304 2,008 -20.2
EBITDA (exclude LLA ) 783 1,444 - -45.8
Fair value gain from FHB acquisition
328 - - 100%
LLA liabilities (Fair value changes)
494 (210) - >100
PBT (& zakat) 1,535 1,094 1,905 40.4
NET PROFIT (PAT) 1,107 905 1,400 22.3
PATAMI 981 806 1,328 21.7
EPS (sen) 26.9 28.5 75.1 -5.6
– Lower Revenue compared to FYE 2012 due to lower average realised CPO and FFB realised price.
− Group performance were affected by :
• Lower average CPO prices and FFB processed in 2013 compared 2012
• Lower contribution from associates and JV
• Negative contribution from Bunge ETGO
− Higher net profit (up by 22.3%) compared to FYE 2012 due to fair value gain from FHB’s acquisition and gain in fair value changes in LLA.
Financial Highlights (YTD)
32
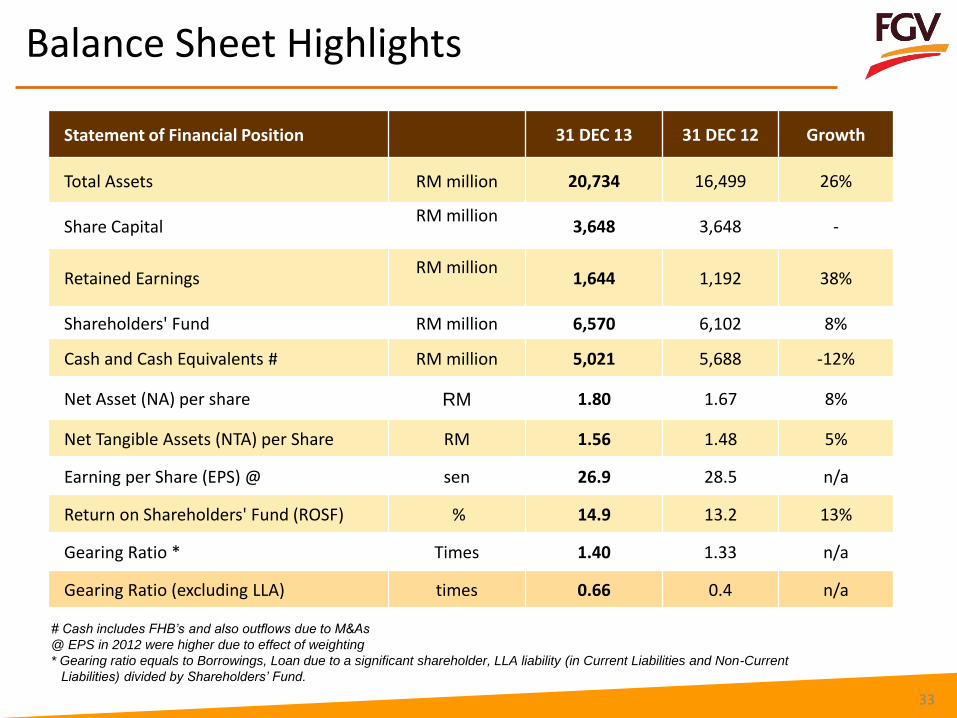
Balance Sheet Highlights
Statement of Financial Position 31 DEC 13 31 DEC 12 Growth
Total Assets RM million 20,734 16,499 26%
Share Capital RM million
3,648 3,648 -
Retained Earnings RM million
1,644 1,192 38%
Shareholders' Fund RM million 6,570 6,102 8%
Cash and Cash Equivalents # RM million 5,021 5,688 -12%
Net Asset (NA) per share RM 1.80 1.67 8%
Net Tangible Assets (NTA) per Share RM 1.56 1.48 5%
Earning per Share (EPS) @ sen 26.9 28.5 n/a
Return on Shareholders' Fund (ROSF) % 14.9 13.2 13%
Gearing Ratio * Times 1.40 1.33 n/a
Gearing Ratio (excluding LLA) times 0.66 0.4 n/a
# Cash includes FHB’s and also outflows due to M&As
@ EPS in 2012 were higher due to effect of weighting
* Gearing ratio equals to Borrowings, Loan due to a significant shareholder, LLA liability (in Current Liabilities and Non-Current
Liabilities) divided by Shareholders’ Fund.
33
Utilization of IPO Proceeds
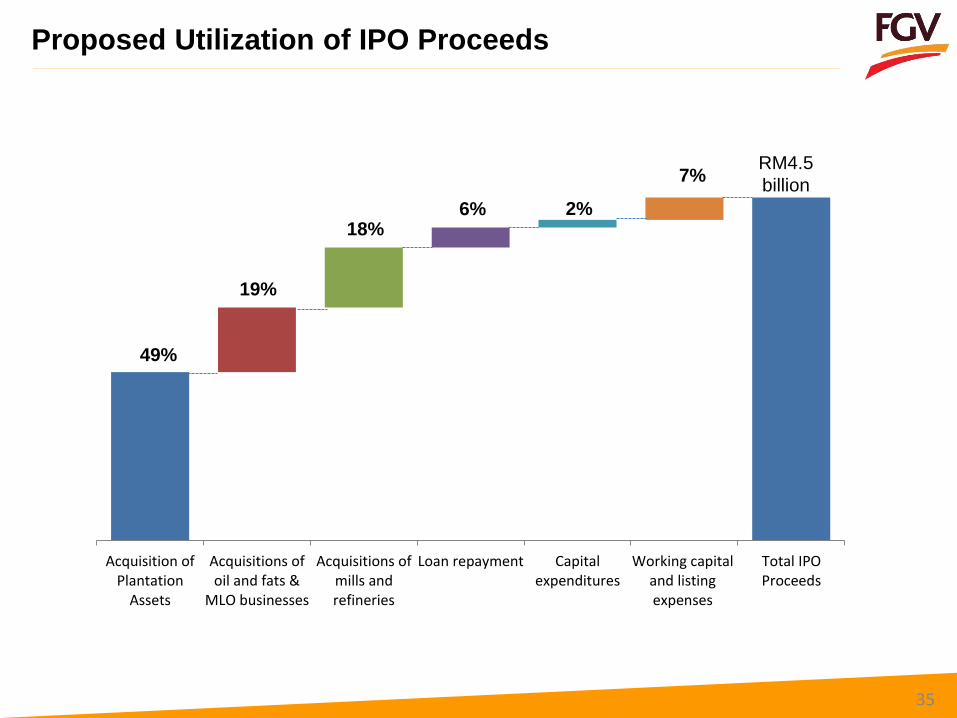
Proposed Utilization of IPO Proceeds
Acquisition ofPlantation
Assets
Acquisitions ofoil and fats &
MLO businesses
Acquisitions ofmills andrefineries
Loan repayment Capitalexpenditures
Working capitaland listingexpenses
Total IPOProceeds
RM4.5
billion
49%
19%
18% 6% 2%
7%
35
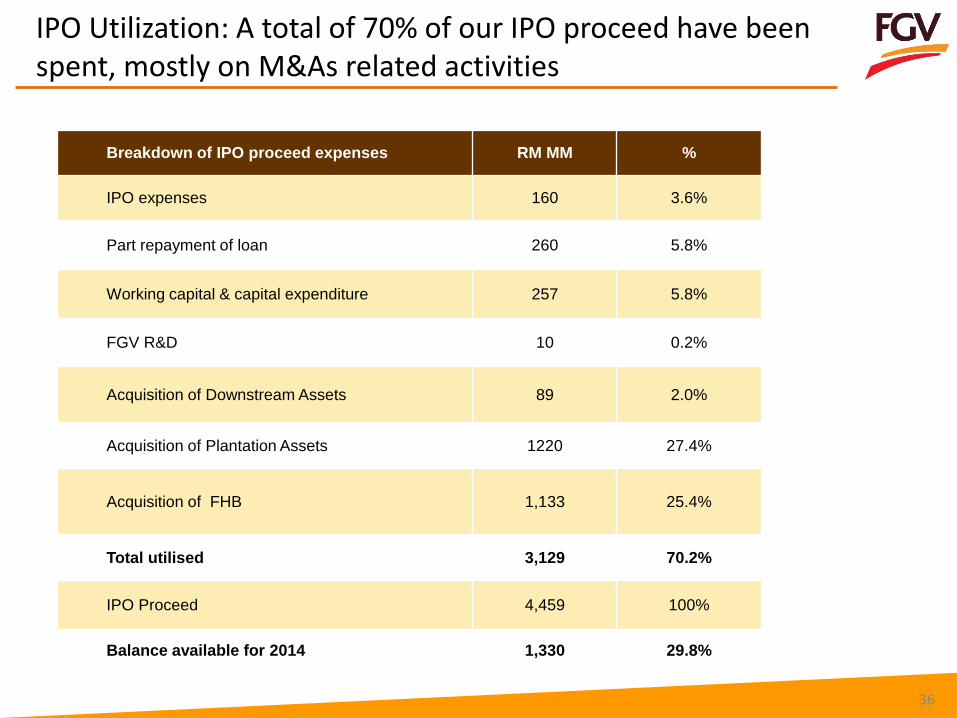
IPO Utilization: A total of 70% of our IPO proceed have been spent, mostly on M&As related activities
Breakdown of IPO proceed expenses RM MM %
IPO expenses 160 3.6%
Part repayment of loan 260 5.8%
Working capital & capital expenditure 257 5.8%
FGV R&D 10 0.2%
Acquisition of Downstream Assets 89 2.0%
Acquisition of Plantation Assets 1220 27.4%
Acquisition of FHB 1,133 25.4%
Total utilised 3,129 70.2%
IPO Proceed 4,459 100%
Balance available for 2014 1,330 29.8%
36
37
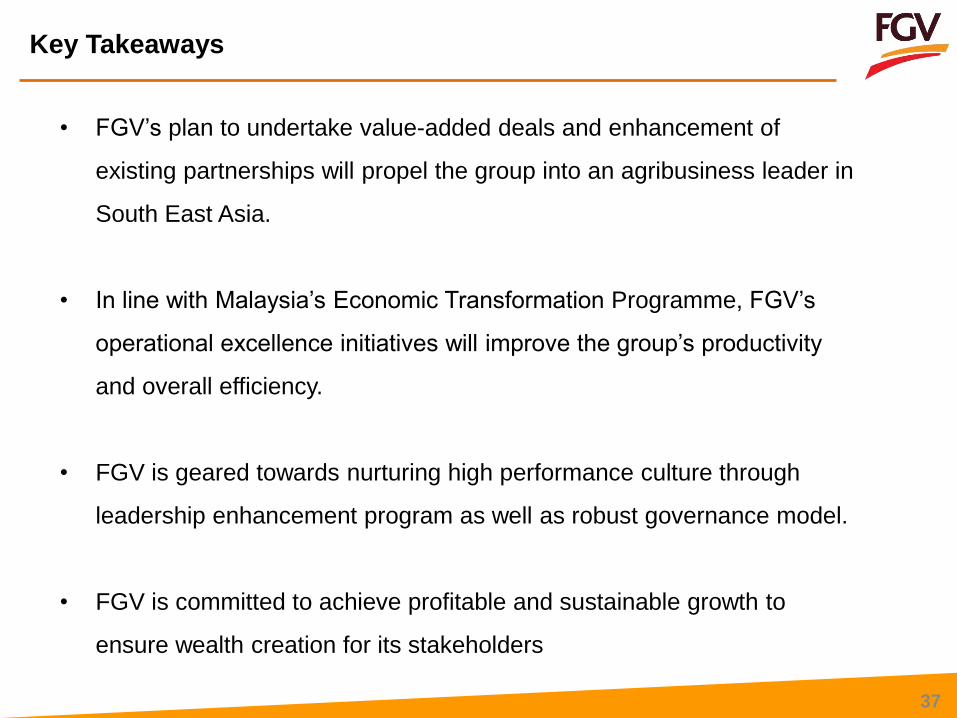
Key Takeaways
• FGV’s plan to undertake value-added deals and enhancement of
existing partnerships will propel the group into an agribusiness leader in
South East Asia.
• In line with Malaysia’s Economic Transformation Programme, FGV’s
operational excellence initiatives will improve the group’s productivity
and overall efficiency.
• FGV is geared towards nurturing high performance culture through
leadership enhancement program as well as robust governance model.
• FGV is committed to achieve profitable and sustainable growth to
ensure wealth creation for its stakeholders
Thank you
Contact Us
For further information, please contact:
http://www.feldaglobal.com
Felda Global Ventures Holdings Bhd
Level 6, Balai FELDA
Jalan Gurney 1
54000 Kuala Lumpur MALAYSIA
Telephone :+603 – 2692 8355
Fax :+603 – 2692 8385
Investor Relations contact person:
Ms Zaida Alia Shaari
FGV
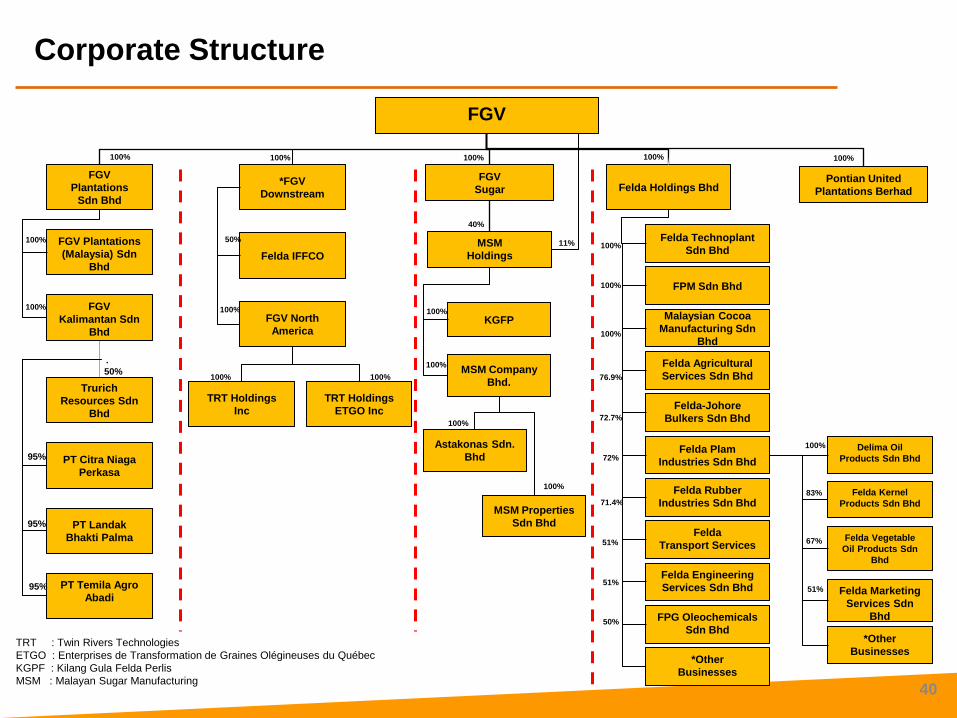
Corporate Structure
PT Citra Niaga
Perkasa
FGV Plantations
(Malaysia) Sdn
Bhd
FGV
Kalimantan Sdn
Bhd
100%
100%
95%
100%
FGV
Plantations
Sdn Bhd
Trurich
Resources Sdn
Bhd
40
TRT : Twin Rivers Technologies
ETGO : Enterprises de Transformation de Graines Olégineuses du Québec
KGPF : Kilang Gula Felda Perlis
MSM : Malayan Sugar Manufacturing
FGV
Sugar
MSM Company
Bhd.
KGFP
100%
100%
100%
11%
40%
MSM
Holdings
MSM Properties
Sdn Bhd
Astakonas Sdn.
Bhd
100%
100%
Felda Holdings Bhd
Felda Technoplant
Sdn Bhd
FPM Sdn Bhd
Malaysian Cocoa
Manufacturing Sdn
Bhd
Felda Agricultural
Services Sdn Bhd
Felda-Johore
Bulkers Sdn Bhd
Felda Plam
Industries Sdn Bhd
Felda Rubber
Industries Sdn Bhd
Felda
Transport Services
Felda Engineering
Services Sdn Bhd
72%
72.7%
100%
100%
100%
100%
76.9%
71.4%
51%
*Other
Businesses
FPG Oleochemicals
Sdn Bhd
51%
50%
100%
83%
67%
51%
Delima Oil
Products Sdn Bhd
Felda Kernel
Products Sdn Bhd
Felda Vegetable
Oil Products Sdn
Bhd
Felda Marketing
Services Sdn
Bhd
*Other
Businesses
*FGV
Downstream
100%
Felda IFFCO
100%
50%
FGV North
America
100% 100%
TRT Holdings
Inc
TRT Holdings
ETGO Inc
Pontian United
Plantations Berhad
100%
.
PT Landak
Bhakti Palma
PT Temila Agro
Abadi
95%
95%
50%