Embed Size (px)
Citation preview

International Civil Aviation Organization WORKING PAPER
ACP-WGS01/WP-xx
AERONAUTICAL COMMUNICATIONS PANEL (ACP)
1st MEETING OF WORKING GROUP S
Montreal, Canada 19-20 March 2012
Agenda Item 5: STATUS OF RELEVANT WORK PROGRAMME OF STATES & ORGANIZATIONS
STATUS OF AEROMACS PROTOTYPE MOBILITY TEST AND EVALUATION
(Presented by Ward Hall, ITT-Exelis)
(Prepared by Ward Hall and Natalie Zelkin, ITT-Exelis)
SUMMARY
This working paper summarizes the results of recent AeroMACS mobile performance evaluation tests using the prototype test bed installed at the NASA-Glenn and Cleveland, OH airport. The evaluation results support development of the AeroMACS Profile specification and Minimum Operational Performance Standards (MOPS) documents.
ACTION
The meeting is invited to take note of the information outlined in this report.
ACP-WGS01/WP-xx
- 2 -
1. Introduction This paper provides an overview of the Aeronautical Mobile Airport Communications System (AeroMACS) prototype test bed deployed at the Cleveland Hopkins (CLE) airport. The test bed is being used to conduct fixed and mobile tests of AeroMACS network performance in an airport environment to provide inputs to standards development and guide design and deployment of future systems. ITT Exelis and the NASA Glenn Research Center designed and installed the prototype network in 2009 with tests and evaluations occurring from 2010 through the present. Official NASA Contractor Reports for 2009 and 20101,2,3 are posted to the NASA Glenn Technical Reports Server http://www.sti.nasa.gov/STI-public-homepage.html. The final report for 2011 was submitted to the FAA in January 2012. This research is supported by system analyses, including interference, security and risk assessments completed by MITRE and NASA. AeroMACS, which is based on the WiMAX™ standard for local area networks, can potentially support a wide variety of data, video, and voice communications and information exchanges among mobile users at the airport. The airport Command, Navigation, and Surveillance (CNS) infrastructure that supports Air Traffic Management (ATM) and Air Traffic Control (ATC) on the airport surface can also benefit from secure wireless communications with improved availability and diversity. A wideband communications network can enable sharing of graphical data and near real-time video to significantly increase situational awareness, improve surface traffic movement to reduce congestion and delays, and help prevent runway incursions. AeroMACS can provide temporary communications capabilities during construction or outages, and reduce the cost of connectivity in comparison to underground cabling. A broadband wireless communications system like AeroMACS can enhance collaborative decision making, ease updating of large databases, provide up-to-date weather graphics and aeronautical information (Aeronautical Information and Meteorological Services), and enable aircraft access to System Wide Information Management (SWIM) services and delivery of time-critical advisory information to the cockpit. 2. Discussion – AeroMACS Prototype Test Bed Description
Network Description The AeroMACS prototype network was built in 2009 to support the development of a RTCA/EUROCAE specification profile document and a Minimum Operational Performance Standards (MOPS) document through evaluation of performance in an airport environment. Figure 1 shows the layout of the test bed installed at CLE airport and NASA Glenn. Two base stations (BSs), one on NASA Glenn property at Building 4, and another on airport property at the Aircraft Rescue and Fire Fighting (ARFF) building, provide overlapping coverage on the airport surface. Multiple base transceiver station (BTS) sectors are implemented at each BS to increase link sensitivity and data capacity.
1 Hall Ward, Isaacs, James, Zelkin, Natalie, and Henriksen, Stephen: C-band Airport Surface Communications System Standards Development, NASA/CR-201102169997/VOL1 2 Hall Ward, Isaacs, James: C-band Airport Surface Communications System Standards Development, NASA/CR-201102169997/VOL2. 3 Zelkin, Natalie and Henriksen, Stephen: C-Band Airport Surface Communications System Engineering – Initial High-Level Safety Risk Assessment and Mitigation Document, NASA/CR-2010-216325, 2010
ACP-WGS01/WP-xx
- 3 -
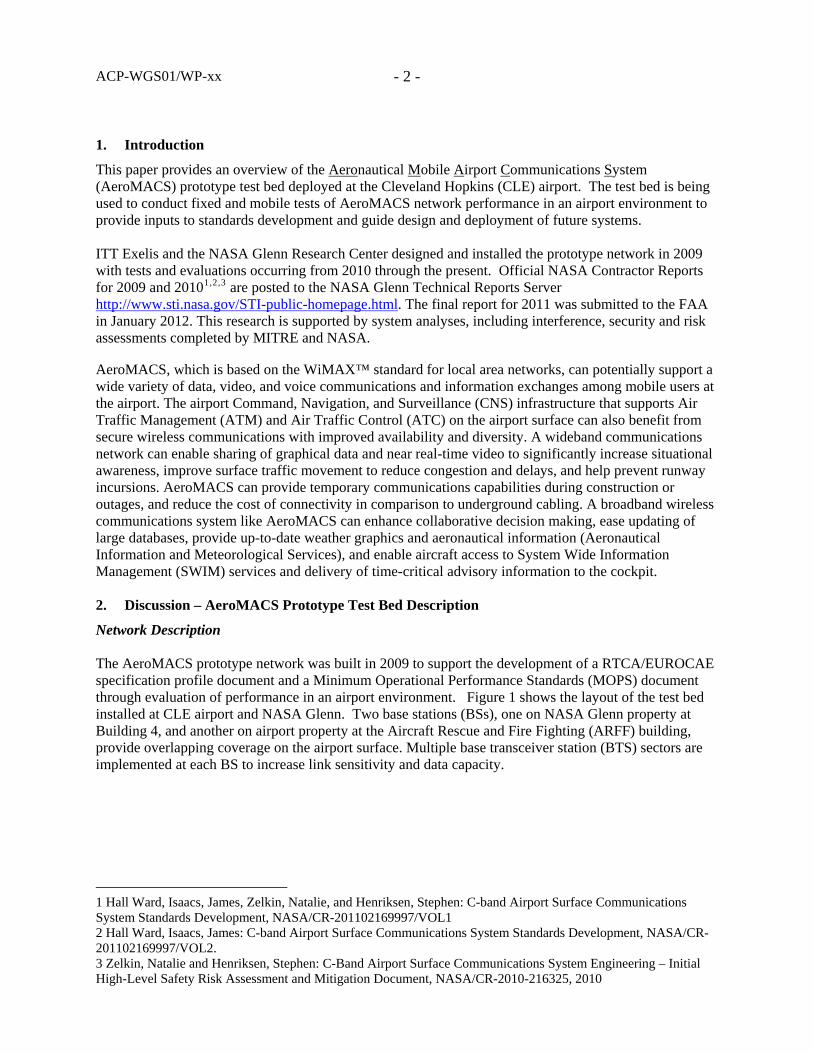
Figure 1. NASA-ITT Exelis AeroMACS Prototype Test Bed
The BS mounted on the tower adjacent to NASA Glenn’s Flight Research Building (Building 4) hangar office has two BTS sectors that are directed 55° and 200° azimuth from “true north.” The ARFF building located on CLE airport property has three BTS coverage sectors directed 45°, 185°, and 295° from true north. The coverage area of each sector is 90° in azimuth determined by the –3 dB pattern roll-off of the BTS sector antenna. These sector-coverage placements provide a high-degree of redundant coverage across the desired coverage area, including the runways, most of the taxiways, and much of the ramp areas. These BSs are linked to core servers located in NASA Glenn Building 110 (Space Experiments Lab) by microwave data backhaul radios operating outside of the AeroMACS spectrum. A pair of these microwave radios is used on the roof of NASA Glenn’s Building 110 in full duplex operation between each BS site and the core Connectivity Service Network (CSN) servers located in Building 110. Fixed-location subscriber stations (SSs) located at two positions on NASA Glenn property (Buildings 4 and 500) and six positions on airport property are used to evaluate fixed-link performance. The network includes Access Service Network - Gateway (ASN–GW) and CSN functions to provide Quality of Service (QoS) control, user authentication and authorization for security, and mobility handover between multiple BTS sectors. Mobility Test Vehicles Mobile station tests were conducted primarily using the NASA Aeronautical Research Vehicle (ARV) for drive tests on airport runways, taxi-ways, and service roads. In early 2012, mobility tests were conducted with AeroMACS equipment and antenna installed in a Boeing 737-700 aircraft provided by Boeing. AeroMACS operation was assessed while taxiing the aircraft on runways, taxi-ways, and in terminal areas.
ACP-WGS01/WP-xx
- 4 -
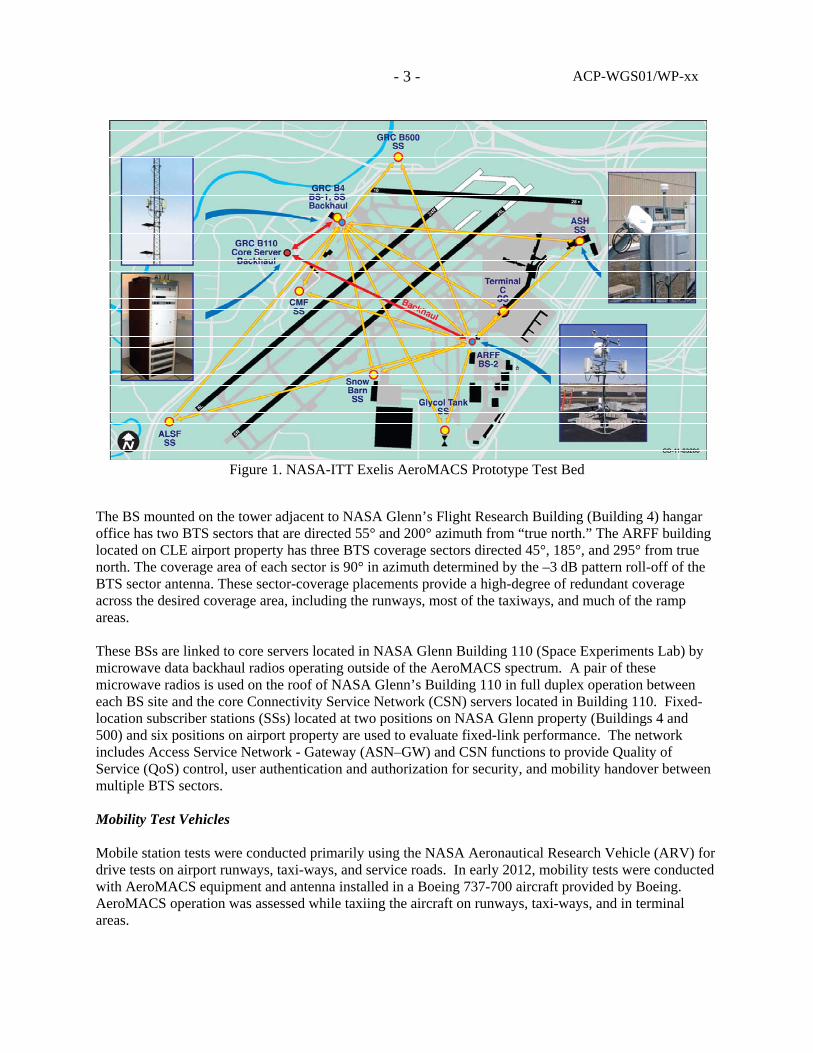
NASA Aeronautical Research Vehicle Drive tests were conducted using the NASA ARV to collect network performance data under a variety of conditions. Figure 2 shows the ARV and a photo of two omni test antennas mounted on top of the ARV on a 0.9 m x 1.5 m (3’ x 5’) metal plate. These antennas were used for single-antenna or 2-antenna Multiple Input, Multiple Output (MIMO) tests. A custom AeroMACS subscriber station with connectors for external antennas is mounted under the plate. Electronics instrumentation installed inside the van includes a network switch, a single-board computer with network test software, and a Power over Ethernet (PoE) power supply.
Figure 2. AeroMACS Installation in the NASA Aeronautical Research Vehicle
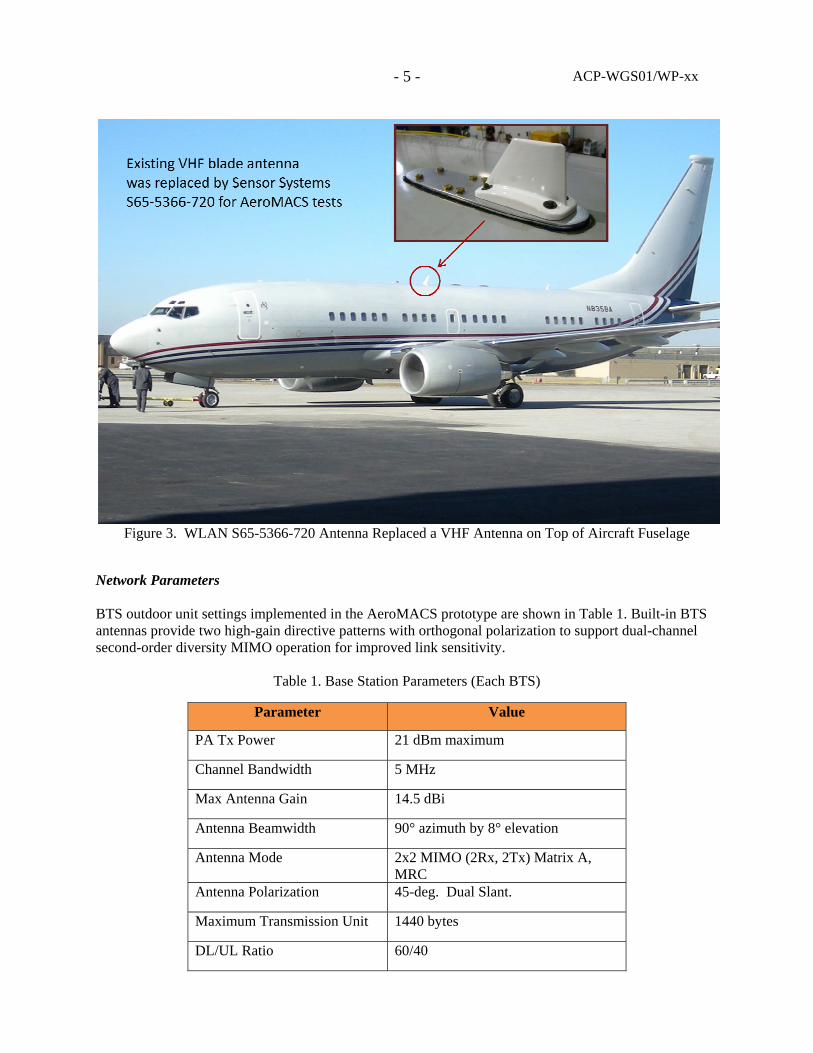
Aircraft Installation Aircraft taxi tests were conducted to model the Single Input Single Output (SISO) (single mobile antenna) test configuration option. This antenna mode was chosen because of physical and mounting constraints of installing multiple antennas on an aircraft for testing purposes, which requires temporary removal of an existing antenna and replacement with the test antenna and its custom mounting plate. The antenna selected for the tests was a Sensor Systems Model WLAN S65-5366-720 (“720”), which is a dual-band blade antenna designed for WiMAX 802.16, quad GSM, and Wireless Local Area Network (WLAN) communications with a single antenna form factor. For these tests, an existing VHF antenna installed on the top of the aircraft fuselage was temporarily replaced with the Model 720 antenna mounted on a plate specially constructed by Boeing to fit the existing position, shown in Figure 3. A United Airlines hangar and equipment were used to make the modification.
ACP-WGS01/WP-xx
- 5 -
Figure 3. WLAN S65-5366-720 Antenna Replaced a VHF Antenna on Top of Aircraft Fuselage
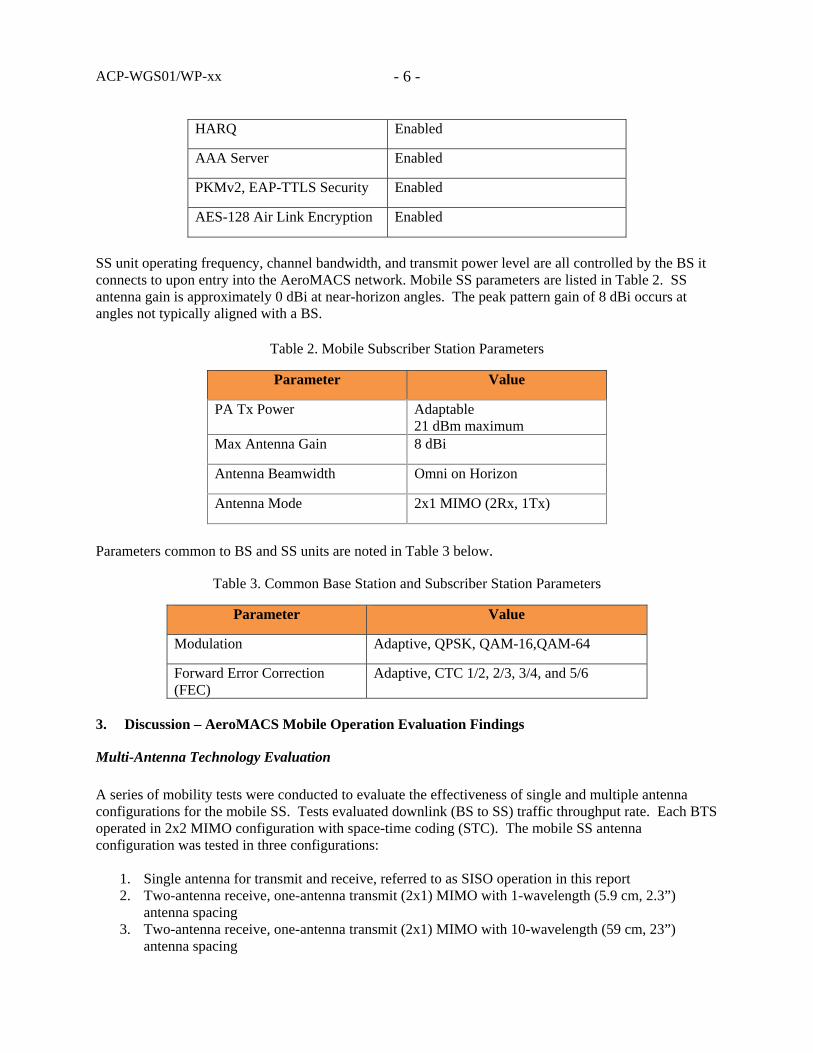
Network Parameters BTS outdoor unit settings implemented in the AeroMACS prototype are shown in Table 1. Built-in BTS antennas provide two high-gain directive patterns with orthogonal polarization to support dual-channel second-order diversity MIMO operation for improved link sensitivity.
Table 1. Base Station Parameters (Each BTS)
Parameter Value
PA Tx Power 21 dBm maximum
Channel Bandwidth 5 MHz
Max Antenna Gain 14.5 dBi
Antenna Beamwidth 90° azimuth by 8° elevation
Antenna Mode 2x2 MIMO (2Rx, 2Tx) Matrix A, MRC
Antenna Polarization 45-deg. Dual Slant.
Maximum Transmission Unit 1440 bytes
DL/UL Ratio 60/40
ACP-WGS01/WP-xx
- 6 -
HARQ Enabled
AAA Server Enabled
PKMv2, EAP-TTLS Security Enabled
AES-128 Air Link Encryption Enabled
SS unit operating frequency, channel bandwidth, and transmit power level are all controlled by the BS it connects to upon entry into the AeroMACS network. Mobile SS parameters are listed in Table 2. SS antenna gain is approximately 0 dBi at near-horizon angles. The peak pattern gain of 8 dBi occurs at angles not typically aligned with a BS.
Table 2. Mobile Subscriber Station Parameters
Parameter Value
PA Tx Power Adaptable 21 dBm maximum
Max Antenna Gain 8 dBi
Antenna Beamwidth Omni on Horizon
Antenna Mode 2x1 MIMO (2Rx, 1Tx)
Parameters common to BS and SS units are noted in Table 3 below.
Table 3. Common Base Station and Subscriber Station Parameters
Parameter Value
Modulation Adaptive, QPSK, QAM-16,QAM-64
Forward Error Correction (FEC)
Adaptive, CTC 1/2, 2/3, 3/4, and 5/6
3. Discussion – AeroMACS Mobile Operation Evaluation Findings
Multi-Antenna Technology Evaluation A series of mobility tests were conducted to evaluate the effectiveness of single and multiple antenna configurations for the mobile SS. Tests evaluated downlink (BS to SS) traffic throughput rate. Each BTS operated in 2x2 MIMO configuration with space-time coding (STC). The mobile SS antenna configuration was tested in three configurations:
1. Single antenna for transmit and receive, referred to as SISO operation in this report 2. Two-antenna receive, one-antenna transmit (2x1) MIMO with 1-wavelength (5.9 cm, 2.3”)
antenna spacing 3. Two-antenna receive, one-antenna transmit (2x1) MIMO with 10-wavelength (59 cm, 23”)
antenna spacing
ACP-WGS01/WP-xx
- 7 -
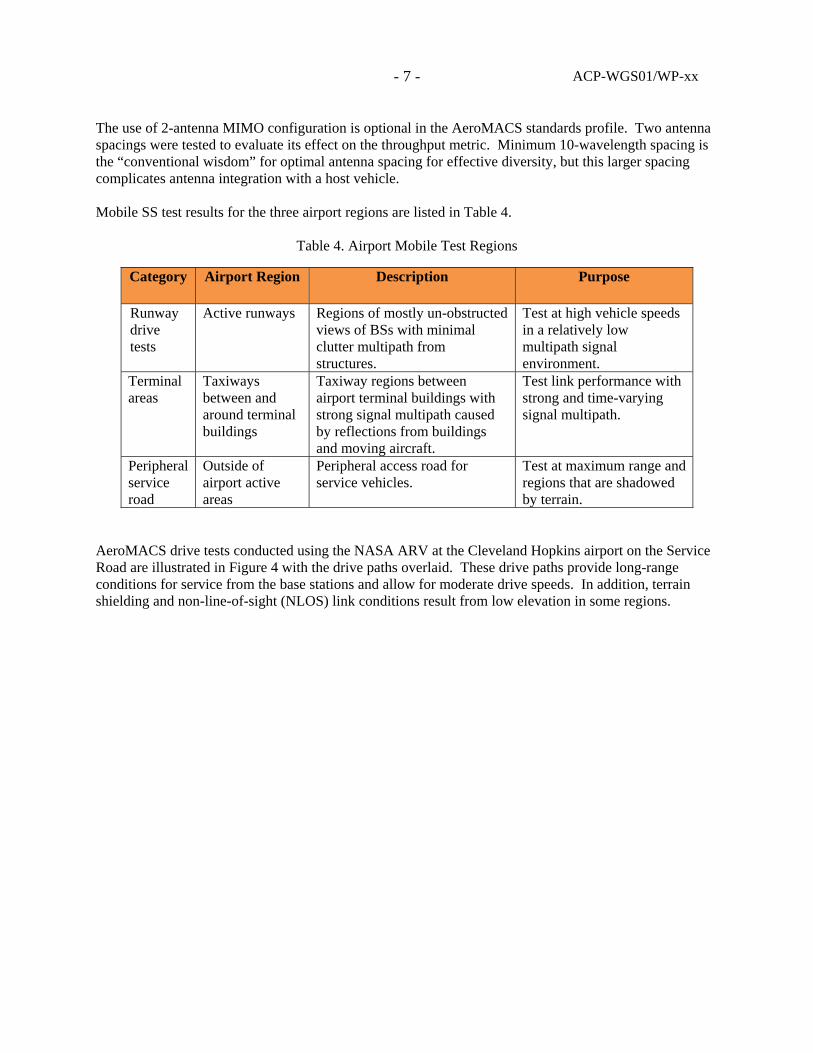
The use of 2-antenna MIMO configuration is optional in the AeroMACS standards profile. Two antenna spacings were tested to evaluate its effect on the throughput metric. Minimum 10-wavelength spacing is the “conventional wisdom” for optimal antenna spacing for effective diversity, but this larger spacing complicates antenna integration with a host vehicle. Mobile SS test results for the three airport regions are listed in Table 4.
Table 4. Airport Mobile Test Regions
Category Airport Region Description Purpose
Runway drive tests
Active runways Regions of mostly un-obstructed views of BSs with minimal clutter multipath from structures.
Test at high vehicle speeds in a relatively low multipath signal environment.
Terminal areas
Taxiways between and around terminal buildings
Taxiway regions between airport terminal buildings with strong signal multipath caused by reflections from buildings and moving aircraft.
Test link performance with strong and time-varying signal multipath.
Peripheral service road
Outside of airport active areas
Peripheral access road for service vehicles.
Test at maximum range and regions that are shadowed by terrain.
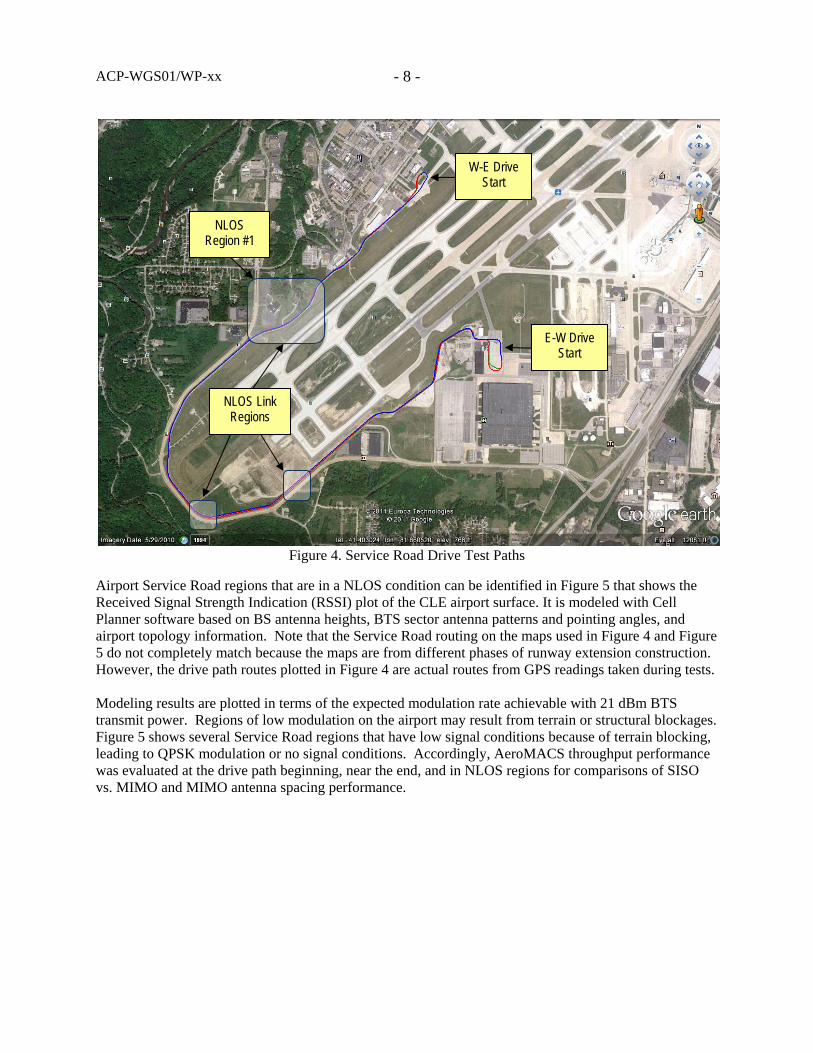
AeroMACS drive tests conducted using the NASA ARV at the Cleveland Hopkins airport on the Service Road are illustrated in Figure 4 with the drive paths overlaid. These drive paths provide long-range conditions for service from the base stations and allow for moderate drive speeds. In addition, terrain shielding and non-line-of-sight (NLOS) link conditions result from low elevation in some regions.
ACP-WGS01/WP-xx
- 8 -
Figure 4. Service Road Drive Test Paths
W-E Drive Start
NLOS Region #1
E-W Drive Start
NLOS Link Regions
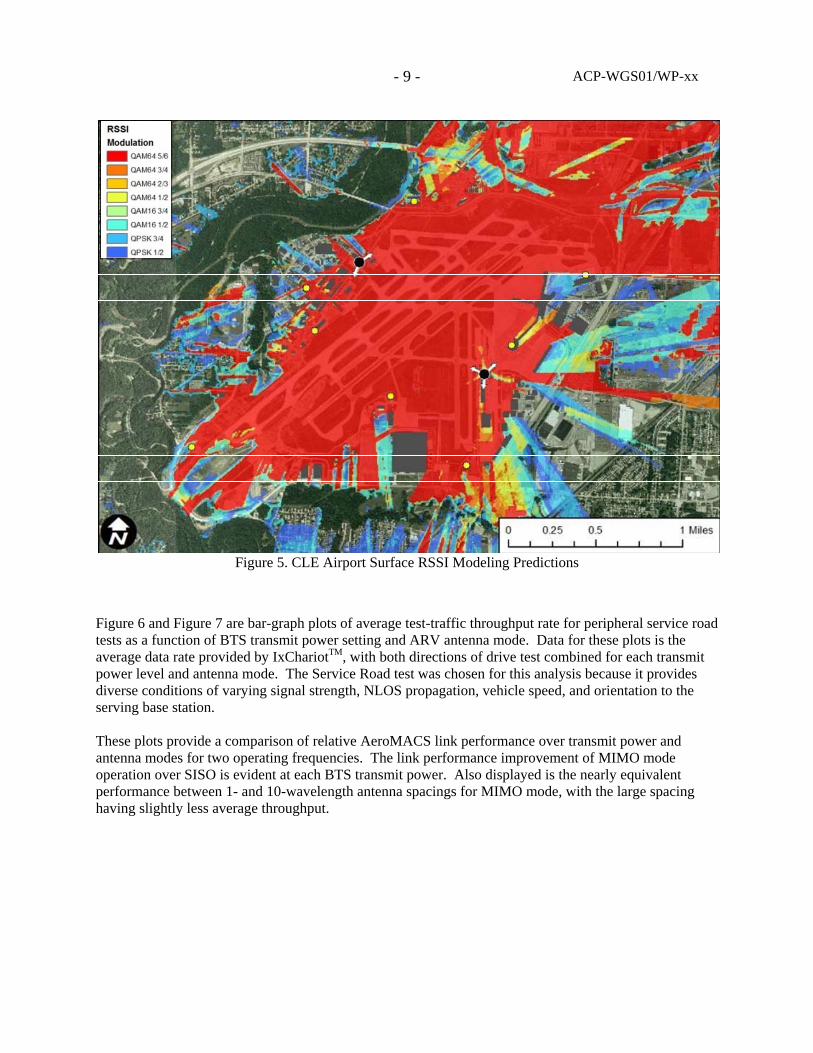
Airport Service Road regions that are in a NLOS condition can be identified in Figure 5 that shows the Received Signal Strength Indication (RSSI) plot of the CLE airport surface. It is modeled with Cell Planner software based on BS antenna heights, BTS sector antenna patterns and pointing angles, and airport topology information. Note that the Service Road routing on the maps used in Figure 4 and Figure 5 do not completely match because the maps are from different phases of runway extension construction. However, the drive path routes plotted in Figure 4 are actual routes from GPS readings taken during tests. Modeling results are plotted in terms of the expected modulation rate achievable with 21 dBm BTS transmit power. Regions of low modulation on the airport may result from terrain or structural blockages. Figure 5 shows several Service Road regions that have low signal conditions because of terrain blocking, leading to QPSK modulation or no signal conditions. Accordingly, AeroMACS throughput performance was evaluated at the drive path beginning, near the end, and in NLOS regions for comparisons of SISO vs. MIMO and MIMO antenna spacing performance.
ACP-WGS01/WP-xx
- 9 -
Figure 5. CLE Airport Surface RSSI Modeling Predictions
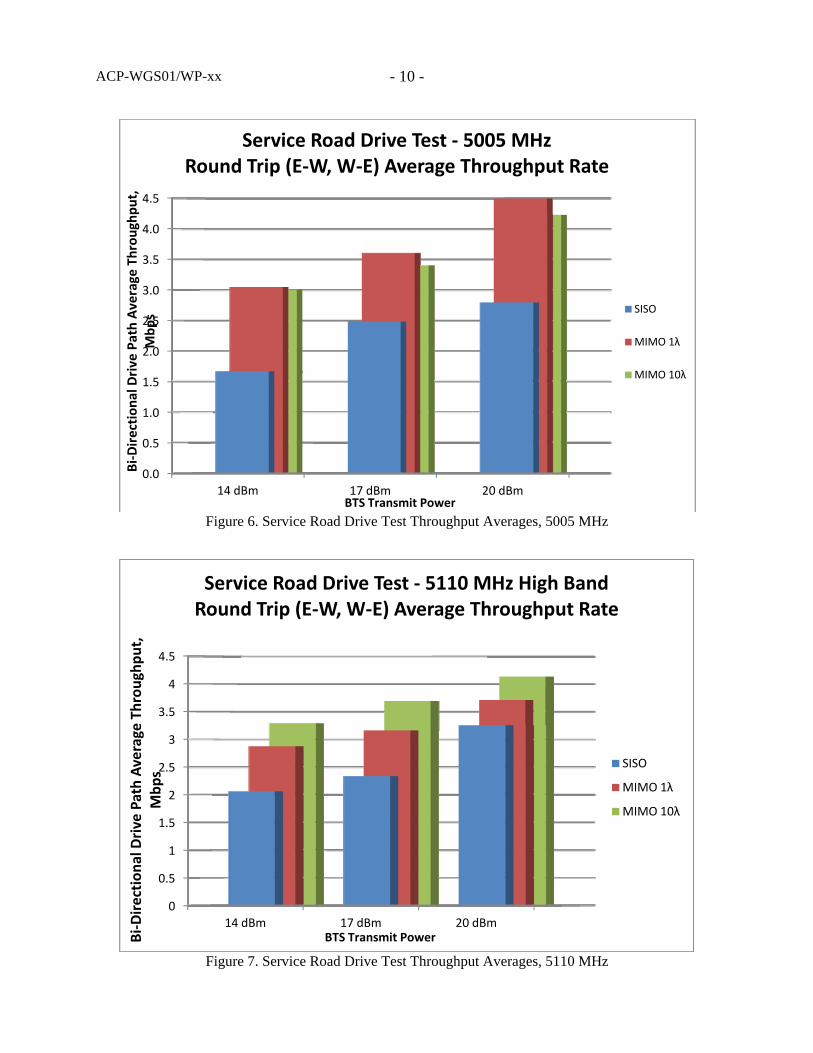
Figure 6 and Figure 7 are bar-graph plots of average test-traffic throughput rate for peripheral service road tests as a function of BTS transmit power setting and ARV antenna mode. Data for these plots is the average data rate provided by IxChariotTM, with both directions of drive test combined for each transmit power level and antenna mode. The Service Road test was chosen for this analysis because it provides diverse conditions of varying signal strength, NLOS propagation, vehicle speed, and orientation to the serving base station. These plots provide a comparison of relative AeroMACS link performance over transmit power and antenna modes for two operating frequencies. The link performance improvement of MIMO mode operation over SISO is evident at each BTS transmit power. Also displayed is the nearly equivalent performance between 1- and 10-wavelength antenna spacings for MIMO mode, with the large spacing having slightly less average throughput.
ACP-WGS01/WP-xx
- 10 -
Figure 6. Service Road Drive Test Throughput Averages, 5005 MHz
0.0
0.5
1.0
1.5
2.0
2.5
3.0
3.5
4.0
4.5
14 dBm 17 dBm 20 dBm
Bi‐Direction
al Drive
Path Average
Throu
ghpu
t,
Mbp
s
BTS Transmit Power
Service Road Drive Test ‐ 5005 MHzRound Trip (E‐W, W‐E) Average Throughput Rate
SISO
MIMO 1λ
MIMO 10λ
Figure 7. Service Road Drive Test Throughput Averages, 5110 MHz
0
0.5
1
1.5
2
2.5
3
3.5
4
4.5
14 dBm 17 dBm 20 dBm
Bi‐Direction
al Drive Path Average Throu
ghpu
t,
Mbp
s
BTS Transmit Power
Service Road Drive Test ‐ 5110 MHz High BandRound Trip (E‐W, W‐E) Average Throughput Rate
SISO
MIMO 1λ
MIMO 10λ
ACP-WGS01/WP-xx
- 11 -
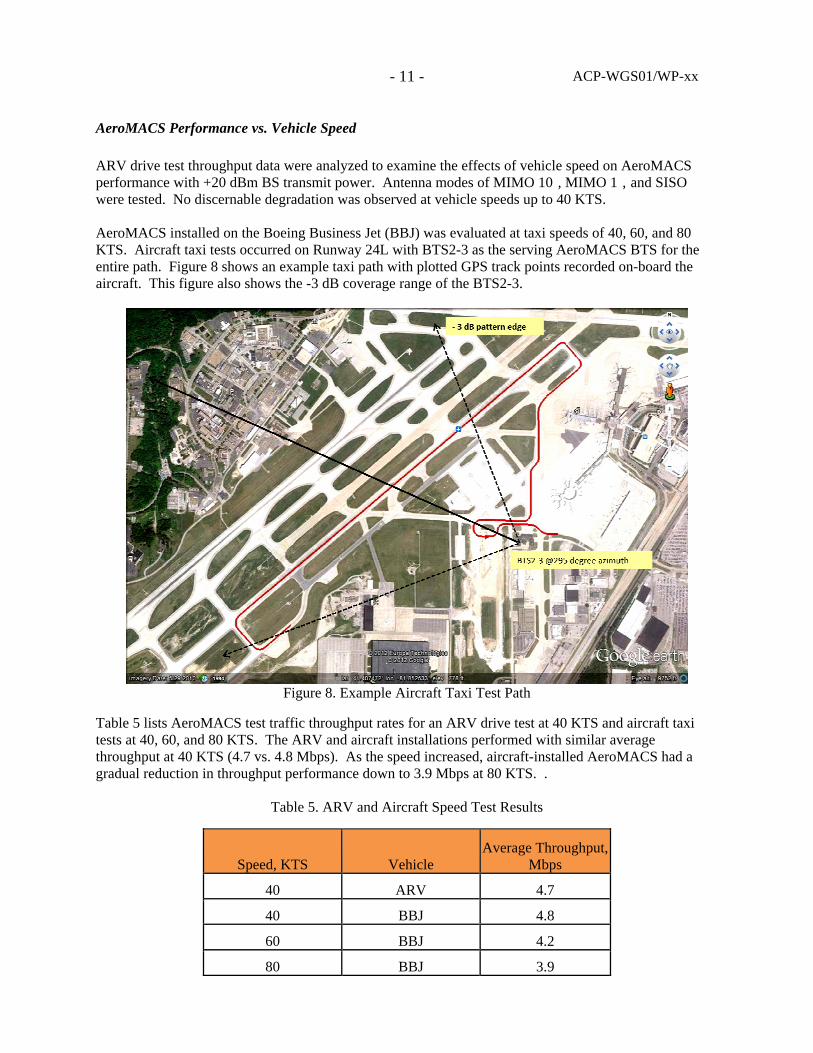
AeroMACS Performance vs. Vehicle Speed ARV drive test throughput data were analyzed to examine the effects of vehicle speed on AeroMACS performance with +20 dBm BS transmit power. Antenna modes of MIMO 10 , MIMO 1 , and SISO were tested. No discernable degradation was observed at vehicle speeds up to 40 KTS. AeroMACS installed on the Boeing Business Jet (BBJ) was evaluated at taxi speeds of 40, 60, and 80 KTS. Aircraft taxi tests occurred on Runway 24L with BTS2-3 as the serving AeroMACS BTS for the entire path. Figure 8 shows an example taxi path with plotted GPS track points recorded on-board the aircraft. This figure also shows the -3 dB coverage range of the BTS2-3.
Figure 8. Example Aircraft Taxi Test Path
Table 5 lists AeroMACS test traffic throughput rates for an ARV drive test at 40 KTS and aircraft taxi tests at 40, 60, and 80 KTS. The ARV and aircraft installations performed with similar average throughput at 40 KTS (4.7 vs. 4.8 Mbps). As the speed increased, aircraft-installed AeroMACS had a gradual reduction in throughput performance down to 3.9 Mbps at 80 KTS. .
Table 5. ARV and Aircraft Speed Test Results
Speed, KTS Vehicle Average Throughput,
Mbps
40 ARV 4.7
40 BBJ 4.8
60 BBJ 4.2
80 BBJ 3.9
ACP-WGS01/WP-xx
- 12 -
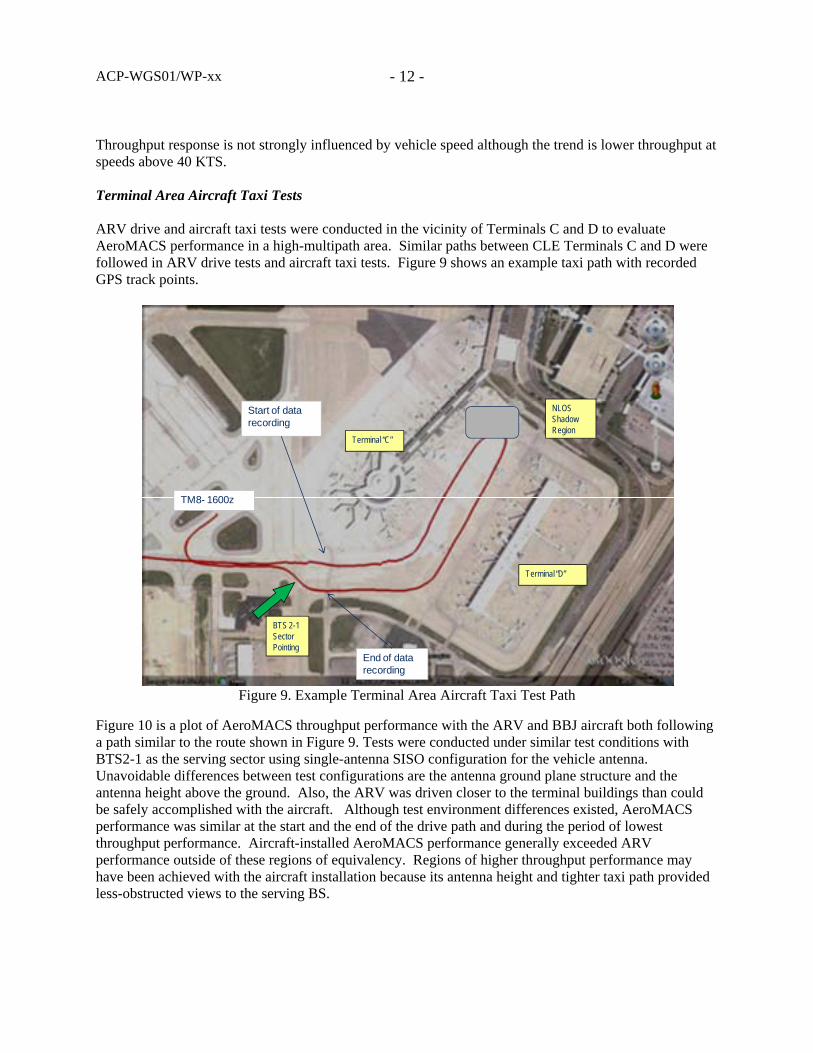
Throughput response is not strongly influenced by vehicle speed although the trend is lower throughput at speeds above 40 KTS. Terminal Area Aircraft Taxi Tests ARV drive and aircraft taxi tests were conducted in the vicinity of Terminals C and D to evaluate AeroMACS performance in a high-multipath area. Similar paths between CLE Terminals C and D were followed in ARV drive tests and aircraft taxi tests. Figure 9 shows an example taxi path with recorded GPS track points.
Figure 9. Example Terminal Area Aircraft Taxi Test Path
TM8- 1600z
Start of data recording
End of data recording
Terminal “D”
Terminal “C”
NLOS Shadow Region
BTS 2-1 Sector Pointing
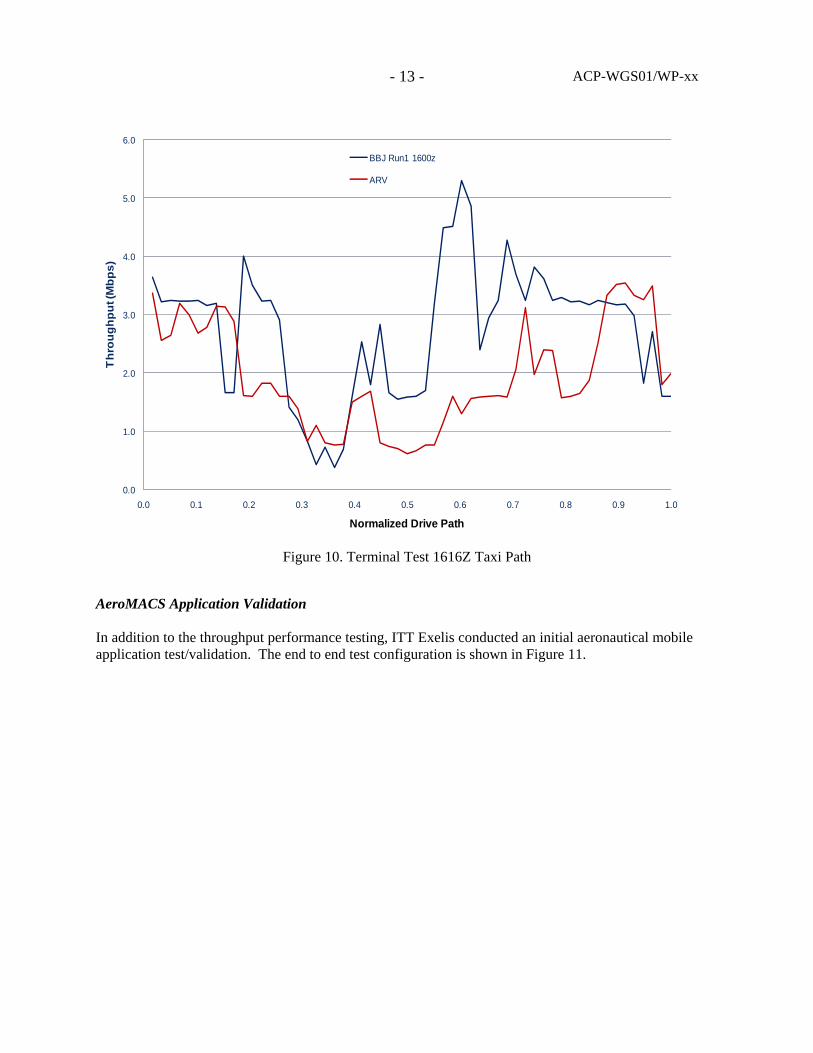
Figure 10 is a plot of AeroMACS throughput performance with the ARV and BBJ aircraft both following a path similar to the route shown in Figure 9. Tests were conducted under similar test conditions with BTS2-1 as the serving sector using single-antenna SISO configuration for the vehicle antenna. Unavoidable differences between test configurations are the antenna ground plane structure and the antenna height above the ground. Also, the ARV was driven closer to the terminal buildings than could be safely accomplished with the aircraft. Although test environment differences existed, AeroMACS performance was similar at the start and the end of the drive path and during the period of lowest throughput performance. Aircraft-installed AeroMACS performance generally exceeded ARV performance outside of these regions of equivalency. Regions of higher throughput performance may have been achieved with the aircraft installation because its antenna height and tighter taxi path provided less-obstructed views to the serving BS.
ACP-WGS01/WP-xx
- 13 -
0.0
1.0
2.0
3.0
4.0
5.0
6.0
0.0 0.1 0.2 0.3 0.4 0.5 0.6 0.7 0.8 0.9 1.0
Thr
ough
put (
Mbp
s)
Normalized Drive Path
BBJ Run1 1600z
ARV
Figure 10. Terminal Test 1616Z Taxi Path
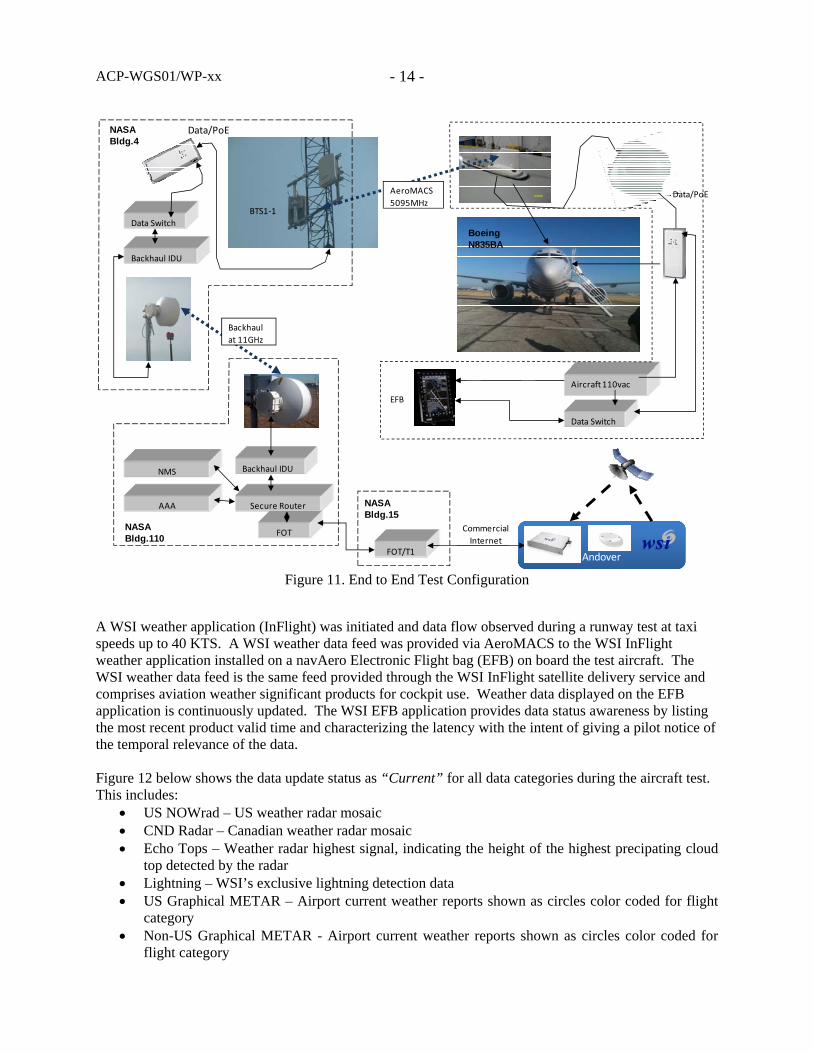
AeroMACS Application Validation In addition to the throughput performance testing, ITT Exelis conducted an initial aeronautical mobile application test/validation. The end to end test configuration is shown in Figure 11.
ACP-WGS01/WP-xx
- 14 -
Andover
Backhaul IDU
Data Switch
Aircraft 110vac
Data Switch
BTS1‐1
Data/PoE
Backhaul IDU
Secure RouterAAA
NMS
AeroMACS5095MHz
Backhaul at 11GHz
FOT/T1
NASA Bldg.4
FOT
EFB
NASA Bldg.110
NASA Bldg.15
Boeing N835BA
Commercial Internet
Data/PoE
Figure 11. End to End Test Configuration
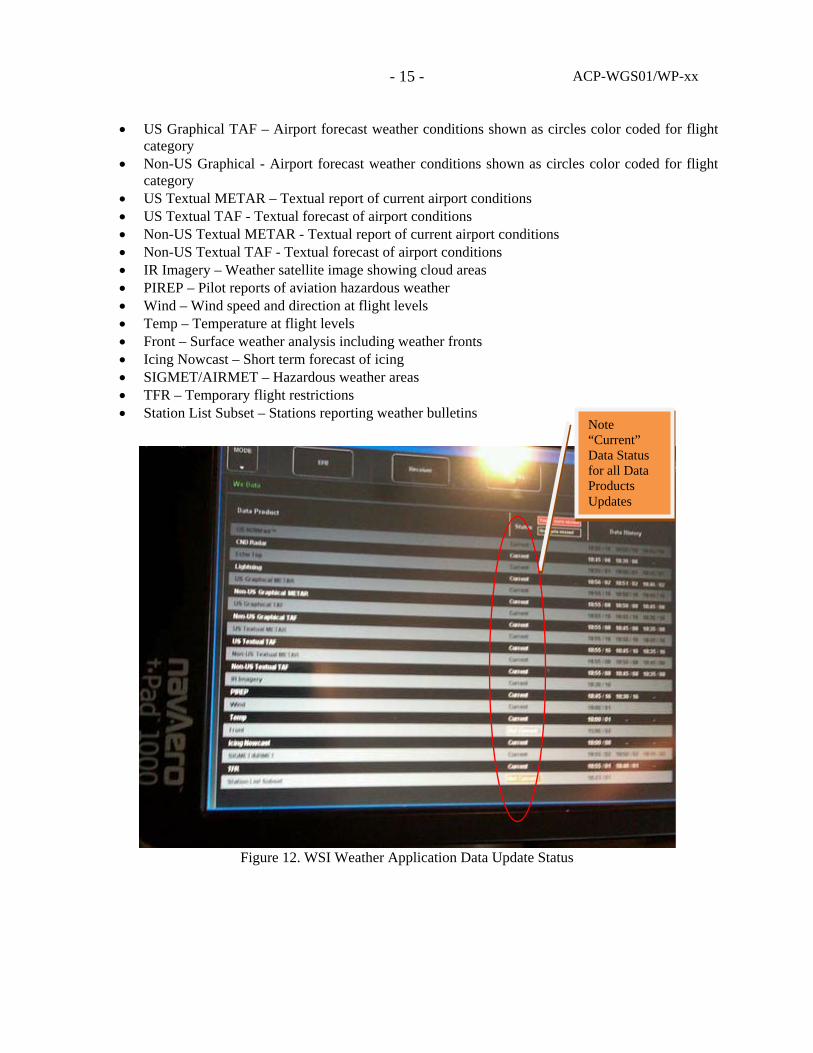
A WSI weather application (InFlight) was initiated and data flow observed during a runway test at taxi speeds up to 40 KTS. A WSI weather data feed was provided via AeroMACS to the WSI InFlight weather application installed on a navAero Electronic Flight bag (EFB) on board the test aircraft. The WSI weather data feed is the same feed provided through the WSI InFlight satellite delivery service and comprises aviation weather significant products for cockpit use. Weather data displayed on the EFB application is continuously updated. The WSI EFB application provides data status awareness by listing the most recent product valid time and characterizing the latency with the intent of giving a pilot notice of the temporal relevance of the data. Figure 12 below shows the data update status as “Current” for all data categories during the aircraft test. This includes:
• US NOWrad – US weather radar mosaic • CND Radar – Canadian weather radar mosaic • Echo Tops – Weather radar highest signal, indicating the height of the highest precipating cloud
top detected by the radar • Lightning – WSI’s exclusive lightning detection data • US Graphical METAR – Airport current weather reports shown as circles color coded for flight
category • Non-US Graphical METAR - Airport current weather reports shown as circles color coded for
flight category
ACP-WGS01/WP-xx
- 15 -
• US Graphical TAF – Airport forecast weather conditions shown as circles color coded for flight category
• Non-US Graphical - Airport forecast weather conditions shown as circles color coded for flight category
• US Textual METAR – Textual report of current airport conditions • US Textual TAF - Textual forecast of airport conditions • Non-US Textual METAR - Textual report of current airport conditions • Non-US Textual TAF - Textual forecast of airport conditions • IR Imagery – Weather satellite image showing cloud areas • PIREP – Pilot reports of aviation hazardous weather • Wind – Wind speed and direction at flight levels • Temp – Temperature at flight levels • Front – Surface weather analysis including weather fronts • Icing Nowcast – Short term forecast of icing • SIGMET/AIRMET – Hazardous weather areas • TFR – Temporary flight restrictions • Station List Subset – Stations reporting weather bulletins
Figure 12. WSI Weather Application Data Update Status
Note “Current” Data Status for all Data Products Updates
ACP-WGS01/WP-xx
- 16 -
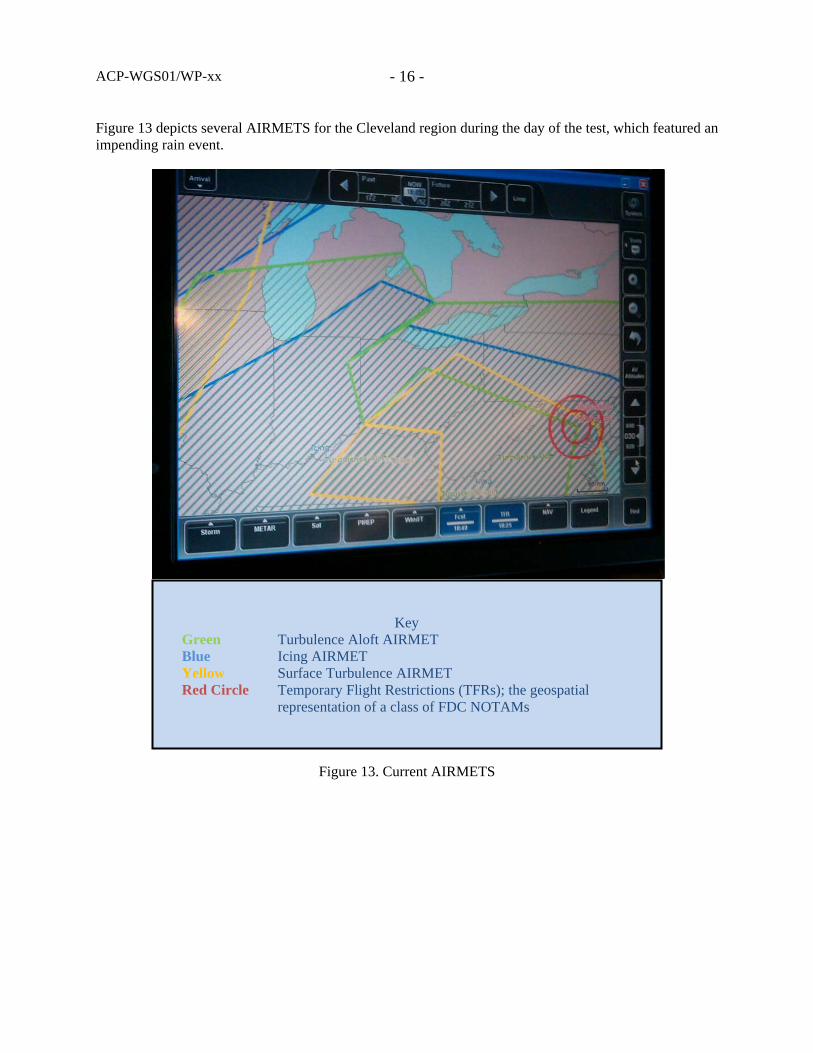
Figure 13 depicts several AIRMETS for the Cleveland region during the day of the test, which featured an impending rain event.
Key Green Turbulence Aloft AIRMET Blue Icing AIRMET Yellow Surface Turbulence AIRMET Red Circle Temporary Flight Restrictions (TFRs); the geospatial representation of a class of FDC NOTAMs
Figure 13. Current AIRMETS
ACP-WGS01/WP-xx
- 17 -
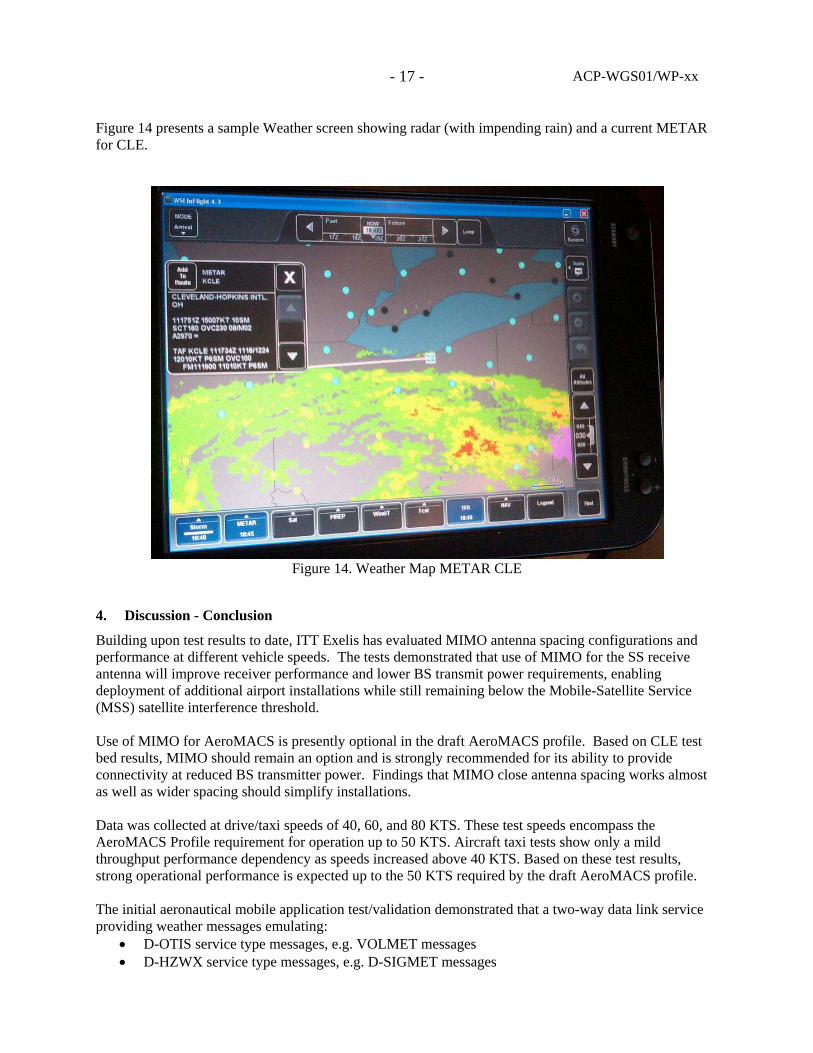
Figure 14 presents a sample Weather screen showing radar (with impending rain) and a current METAR for CLE.
Figure 14. Weather Map METAR CLE
4. Discussion - Conclusion
Building upon test results to date, ITT Exelis has evaluated MIMO antenna spacing configurations and performance at different vehicle speeds. The tests demonstrated that use of MIMO for the SS receive antenna will improve receiver performance and lower BS transmit power requirements, enabling deployment of additional airport installations while still remaining below the Mobile-Satellite Service (MSS) satellite interference threshold. Use of MIMO for AeroMACS is presently optional in the draft AeroMACS profile. Based on CLE test bed results, MIMO should remain an option and is strongly recommended for its ability to provide connectivity at reduced BS transmitter power. Findings that MIMO close antenna spacing works almost as well as wider spacing should simplify installations. Data was collected at drive/taxi speeds of 40, 60, and 80 KTS. These test speeds encompass the AeroMACS Profile requirement for operation up to 50 KTS. Aircraft taxi tests show only a mild throughput performance dependency as speeds increased above 40 KTS. Based on these test results, strong operational performance is expected up to the 50 KTS required by the draft AeroMACS profile. The initial aeronautical mobile application test/validation demonstrated that a two-way data link service providing weather messages emulating:
• D-OTIS service type messages, e.g. VOLMET messages • D-HZWX service type messages, e.g. D-SIGMET messages

ACP-WGS01/WP-xx
- 18 -
could be reliably provided over the AeroMACS Test Bed. ITT Exelis is continuing support of the FAA in AeroMACS standards development work. Additional tests are being planned for this year. 5. ACTION BY THE MEETING
The meeting is invited to take note of the information of this working paper.