Embed Size (px)
Citation preview

Aerodynamic Drag of a Two-DimensionalExternal Compression Inlet
at Supersonic Speed
J C Esterhuyse

DECLARATION
The contents of this dissertation represent my own work and the opinions contained herein are
my own and not necessarily those of the Technikon.
A thesis submitted in fulfilment of the requirements for the DOCTORES TECHNOLOGIAE
(Engineering Mechanical) in the School of Mechanical and Process Engineering at the Cape
Technikon.
Cape Town, South Africa March 1997

ACKNOWLEDGEMENTS
I would like to express my sincere gratitude to the following:
• My supervisors, Drs Rob HurIin and Les Rencontre for their advice and guidance
• Mr Frans Joubert for his support and motivation
• Gavin Ratner for his invaluable assistance during wind-tunnel testing and
designing oftest equipment
• Mauro Morelli for believing in the project and making wind-tunnel testing possible
• Aneen Koch for typing and editing the manuscript
• The Cape Technikon for giving me time off to complete this project
• My parents for their keen interest
• My wife, Barbara, for her encouragement and moral support.
I would also like to thank the Council for Scientific and Industrial Research for the use ofth~L
facilities as well as the Foundation for Research Development for their financial support.
I am grateful to the Lord, without Whom, nothing could have been accomplished.
11

SYNOPSIS
This study forms the basis from which the aerodynamic drag of a practical supersonic inlet can
be predicted. In air-breathing propulsion systems, as used in high performance flight vehicles, the
fuel is carried onboard and the oxygen required for combustion is ingested from the ambient
atmosphere. The main function ofthe inlet is to compress the air from supersonic to subsonic
conditions with as little flow distortion as possible.
When the velocity of the vehicle approaches or exceeds sonic velocity (M = 1,0) a number of
considerations apply to the induction system. The reason for this is that the velocity of the
ingested air has to be reduced to appreciably less than sonic velocity, typically to M = 0,3. Failure
to do so will cause the propulsion system to be inoperative and cause damage.
In the process of compressing the air from supersonic to subsonic conditions a drag penalty is
paid. The drag characteristics are a function ofthe external geometry and internal flow control
system ofthe inlet. The problem which was investigated dealt with drag ofa specific type ofinlet,
namely a two-dimensional external compression inlet.
This study is directed at formulating definitive relationships which can be used to design functional
inlet systems. To this effect the project was carried out over three phases, a theoretical
investigation where a fluid-flo,:" analysis was done of the factors influencing drag. The second
phase . vered a comprehensive experimental study where intensive wind-tunnel tests were
condu i for flight Mach numbers ofM = 1,8; M = 2,0; M = 2,2; M = 2,3 and M = 2,4. During
the third phase a comparison, between the theoretical values and experimental data was done, for
validating the predicted aerodynamic drag figures. The following findings are worth recording:
• the increase in total drag below the full flow conditions is more severe than predicted due
to the contribution ofspillage drag;
• the range for subcritical mode ofoperation is smaller than expected due to boundary layer
effects.
The study has shown that reasonably good correlation could be achieved between the theoretical
analysis and empirical test at low subcritical modes of operation. This suggests that the study has
achieved its primary objective.
ill

TABLE OF CONTENTS
Page
DECLARATION
ACKNOWLEDGEMENTS u
SYNOPSIS ID
LIST OF TABLES VlU
LIST OF FIGURES IX
NOMENCLATURE XI
CHAPTER!
Introduction
CHAPTER 2
Literature Survey
2.1 INTRODUCTION
2.2 TYPES OF INLETS
2.2.1 Pitot Inlet
2.2.2 External Compression Inlet
2.2.3 Internal Compression Inlet
2.2.4 Mixed Compression Inlet
2.3 PERFORMANCE CHARACTERISTICS
2.3.1 Pressure Recovery
IV
1
3
5
7
7
9
10
10
10

2.3.2 Mass Flow Ratio
2.3.3 Boundary Layer Bleed
2.4 MODES OF OPERATION
2.5 DESIGN PARAMETERS
2.5.1 Inlet Geometry
2.5.2 Design Mach Number
2.5.3 Diverter Height
2.5.4 Subsonic Diffusor
2.5.5 Cowl Lip
2.5.6 Side Plates
2.6 REVIEW OF DRAG CONTRIBUTING COMPONENTS
2.6.1 Pre-entry Drag
2.6.2 Spillage Drag
2.6.3 Cowl Drag
2.6.4 Bleed Drag
2.6.5 Diverter Drag
2.7 SUMMARY
CHAPTER 3
Theoretical Considerations
3.1 INTRODUCTION
3.2 DRAG COMPONENTS
3.2.1 Spillage Drag
Il
14
15
17
18
19
19
20
21
21
22
22
23
23
24
24
25
26
27
27
3.2.1.1
3.2.1.2
Pre-entry Drag at Supersonic Spillage
Subsonic Spillage
v
28
32

3.2.2 Cowl Drag 37
3.2.3 Bleed Drag 41
3.2.4 Diverter Drag 46
3.3 DETERMINATION OF CO-EFFICIENT 53
3.3.1 Pre-entry or Additive Drag 54
3.3.2 Spillage Drag 59
3.3.3 Cowl Drag 62
3.3.3.1 Wave Pressure Drag 62
3.3.3.2 Skin Friction Drag 69
3.3.4 Bleed Drag 72
3.3.5 Diverter Drag 76
3.3.5.1 Skin Friction Drag 76
3.3.5.2 Wave Pressure Drag 78
3.4 DISCUSSION OF CALCULATIONS 79
3.5 SUMMARY 85
CHAPTER 4
Wind-tunnel Tests
4.1 INTRODUCTION
4.2 EXPERIMENTAL EQUIPMENT
4.2.1 Wmd-tunnel Layout
4.2.2 Inlet Drag Model
4.2.3 Force Balance
4.3 TESTING PROCEDURE
VI
86
87
87
91
94
97

4.3.1 Test Matrix 97
4.3.2 Tunnel Mach Number 98
4.3.3 Mass Flow Regulation and Measurement 99
4.3.4 Bleed Flow Measurement 99
4.4 RESULTS AND DISCUSSION 101
4.4.1 Data Processing 101
4.4.2 Drag Coefficient 102
4.4.3 Flow Visualisation 108
4.4.4 Bleed Flow 116
4.5 SUMMARY 116
CHAPTERS
Conclusion and Recommendations
REFERENCES
117
119
APPENDIXA:
APPENDIXB:
APPENDIXC:
Mass Flow Calculations at Different Mach Numbers
Maximum Model Size
Aerodynamic Drag Data for Wmd-tunnel Tests
vii
A-I
B-1
C-1

LIST OF TABLES
Page
3.1 Air Flow Properties at Different Free Stream Mach Number for
Atmospheric Conditions at Sea Level 58
3.2 Predicted Pre-entry Drag at Different Flight Mach Numbers 58
3.3 Predicted Spillage Drag at Different Operating Modes 62
3.4 Air Flow Properties in Front of Cowl Lip for Atmospheric Conditions
at Sea Level 67
3.5 Predicted Cowl Drag at Different Operating Modes 71
3.6 Predicted Bleed Drag for a Bleed Ratio of8 % at Different Flight
Mach Numbers 75
3.7 Predicted Diverter Drag at Different Flight Mach Numbers 79
3.8 Theoretical Drag Analysis for Inlet Operating Critically and Subcritically
at M = 2,0 with a Bleed Flow Rate of8 % 80
3.9 Theoretical Drag Analysis for Inlet Operating Critically and Subcritically,at M = 1,8 with a Bleed Flow Rate of8 % 80
3.10 Theoretical Drag Analysis for Inlet Operating Critically and Subcritically
at M = 2,2 with a Bleed Flow Rate of8 % 80
3.11 Theoretical Drag Analysis for Inlet Operating Critically and Subcritically
at M = 2,3 with a Bleed Flow Rate of8 % 81
3.12 Theoretical Drag Analysis for Inlet Operating Critically and Subcritically
at M = 2,4 with a Bleed Flow Rate of8 % 81
3.13 Theoretical Drag Coefficients for Different Operating Modes at Various
Flight Mach Numbers where Bleed = 8 % 82
4.1 Critical Model Dimensions 93
4.2 Axial and Normal Force with Bow Shock 95
4.3 Axial Force without Bow Shock 95
4.4 Balance Specifications 96
4.5 Full-scale Errors ofthe Balance Accuracy 96
4.6 Test Matrix 97
4.7 Mean Values and Standard Deviations for Axial Force Measurements at 102
Various Test Mach Numbers
Vll1

LIST OF FIGURES
Page
2.1 Supersonic Inlet Duct 4
2.2 Main Features ofInlet System 5
2.3 General Configurations for Supersonic Inlets 6
2.4 Types ofSupersonic Inlets with Normal Shock at Throat 8
2.5 Geometrical Shape ofInlet Opening with Control Volume Defined 12
2.6 Typical Performance Characteristic Curve for External Compression Inlet 13
2.7 Concorde-type Slot Bleed 14
2.8 Modes ofOperation for SupersonicInlets 16
2.9 Inlet Geometrical Layout 18
2.10 Flow Separation on Diffuser Wall 20
3.1 Cowl Wave Drag and Spillage Drag Components for an External
Compression Inlet 29
3.2 Supersonic Spillage for a Single-Wedge External Compression Surface 30
3.3 Maximum Flow Ratio with Oblique Shock in Front ofLip 33
3.4 Streamtube Areas for a Double-Wedge Compression Surface with
Supersonic Spill 34
3.5 Subsonic Spill at Different Oblique Shock Positions 36
3.6 Cowl Pressure Distribution by Shock-Expansion Method 38
3.7 Bleed Flow Terminology 43
3.8 Boundary Layer Momentum Ratios (Velocity Profile Parameter n = 7) 45
3.9 Channel Diverter for Supersonic Inlet 47
3.10 Mean-total Laminar Skin Friction Parameters in Terms of
Reynolds Number 49
3.11 WaveDragofa Wedge Diverter 52
3.12 Geometric Shape ofFull-scale Porous Inlet 55
3.13 Strearntube Areas at Below Design Mach Number 57
3.14 Predicted Pre-entry Drag for Full-scale Porous Model 59
3.15 Inlet Operating Subcritically Below Design Mach Number 60
3.16 Predicted Spillage Drag for Full-scale Porous Model 62
IX

3.17 Cowl Pressure Distribution 63
3.18 Geometry ofCowl Lip External Surface for Full-scale Porous Model 65
3.19 Side View ofCowl Lip for Full-scale Porous Model 70
3.20 Predicted Cowl Drag for Full-scale Porous Model 72
3.21 Predicted Bleed Drag for Full-scale Porous Model 75
3.22 Geometry ofWedge Channel Diverter for Full-scale Porous Model 77
3.23 Predicted Diverter Drag for Full-scale Porous Model 79
3.24 Theoretical Total Drag Coefficient at Various Mach Numbers 83
3.25 Effect ofMach Number at Subcritical Operation 84
3.26 Effect ofMach Number at Critical Operation 85
4.1 Inlet Cart with Inlet Installed in Isolated Configuration 88
4.2 Test Section ofHigh Speed Wmd-tunnel 88
4.3 Interface between Model and Measuring Station 89
4.4 Mass Flow Control Plug 90
4.5 Strain Gauge Balance Installation 91
4.6 Full-scale Porous Model 92
4.7 Frontal View ofModel Showing Bleed Holes 92
4.8 Strain Gauge Balance 94
4.9 Comparison between Theoretical and Experimental Values at M = 1,8 105
4.10 Comparison between Theoretical and Experimental Values at M = 2,0 105
4.11 Comparison between Theoretical and Experimental Values at M = 2,2 106
4.12 Comparison between Theoretical and Experimental Values at M = 2,3 106
4.13 Comparison between Theoretical and Experimental Values at M = 2,4 107
4.14 External Flow Field Showing Shock Patterns for M.. = 1,8 110
4.15 External Flow Field Showing Shock Patterns for M.. = 2,0 III
4.16 External Flow Field Showing Shock Patterns for M.. = 2,2 112
4.17 External Flow Field Showing Shock Patterns for M.. = 2,3 113
4.18 External Flow Field Showing Shock Patterns for M.. = 2,4 114
4.19 External Flow Field Showing "Buzz" Condition 115
x

•a
Cd
C_
C.."
C",
Cr
Cd,
Cd2
db,db2
d",D
NOMENCLATURE
Denotes conditions for supersonic spillage at maximum flow
Speed of sound
Cross-sectional area
Free streamtube area captured by the bleed duct
Capture area
Bleed entry area normal to the flow
Bleed duct exit area
Cross-sectional area at maximum section of cowl
Area enclosed by the maximum-flow streamtube at its intersection with the
second oblique shock
Streamtube area
New or actual streamtube area
Drag coefficient
Drag coefficient for diverter
Drag coefficient for inlet, excluding diverter drag component
Total drag coefficient for inlet and diverter
Skin friction coefficient
Drag coefficient for element dQ,
Drag coefficient for element dQ2
Height offirst element perpendicular to free stream flow
Height ofsecond element perpendicular to free stream flow
Maximum model diameter
Dimension based on diameter
Diverter drag, including wave pressure and friction drag
Friction drag
Internal drag caused by bleeding offboundary layer air
Cowl drag, including wave pressure and friction drag
Wave pressure drag on cowl section
Pre-entry drag
xi

ex
M
M'Mda
n
p
Spillage drag
Total drag force
Cowl drag on element dql
Cowl drag on element dq2
Denotes conditions at bleed duct exit
Axial force
External drag forces
Nett thrust due to momentum change between free stream conditions and engine
exit
Nett propulsive thrust
Stream thrust
Diverter height
Height ofinlet opening
Height oflip at maximum section •
Height offirst lip section perpendicular to free stream flow
Height ofcaptured streamtube
Horizontal dimensions
Bleed mass flow rate
Air mass flow ratio
Actual mass flow or mass flow entering inlet
Maximum possible mass flow or mass flow at free stream conditions
Mass flow
Spill mass flow
Mach number
Normalvcloci~componem
Design Mach number
Veloci~ profile parameter
Static pressure
XII

Palm Atmospheric pressure
Pbe Bleed chamber static pressure
POB Stagnation pressure at exit plane inside the bleed chamber
Pof Stagnation pressure at engine face
p... Stagnation pressure in free steam
PR Total or Stagnation pressure recovery
p. Static pressure in tunnel test section
Po Stagnation pressure
P1 Static pressure behind first oblique shock
P2 Static pressure behind second oblique shock
P3 Static pressure behind normal shock
Pi Static pressure behind first oblique shock oflip
Pii Static pressure behind expansion wave oflip
P_ Free stream static pressure
q Dynamic pressure
R Gas constant
Re Reynolds number
R, Reynolds number based on a body length dimension
S Distance ofdiverter leading edge behind ramp leading edge
Sf Projected frontal area
SD Standard deviation
Sw« Wetted area
T Static temperature
T_ Ambient temperature
To Stagnation temperature
U Streamwise velocity in boundary layer at a distancey from the surface
VI Streamwise velocity at the edge ofthe boundary layer
V Air velocity
Vc Control volume
w Width of inlet opening or lip section
Z Percentage data points which fall within two standard deviations on either side of
mean value
XIll

~
o01
Ow0,€
€o
1]0
1],
P<I>/<I>,v
*
Yawangle
Wedge angle or flow deflection angle
Boundary layer thickness
Wedge angle
Sweep back angle oframp leading edge
Shock wave angle
Shock wave angle between lip and horizontal plane ofwedge at design point
External angle of cowl lip at first section
External angle of cowl lip at second section
Air density
Boundary layer momentum ratio
Prandtl - Meyer angle
Pitch angle or angle ofattack
Denotes free stream conditions
Specific heat ratio
Denotes critical flow properties where the flow is sonic, M = 1,0
XlV

CHAPTER
1
INTRODUCTION
Some advanced aircraft and flight vehicles, such as the Concorde supersonic aircraft and
Advanced Medium Range Air to Air Missile (AMRAAM), make use of air-breathing
propulsion systems. One ofthe primary components ofthis propulsion system is the air inlet
which compresses air from supersonic to subsonic conditions. It supplies atmospheric air to
the combustion chamber and when fuel and heat are added, the combustion process takes
place.
The integration ofthe air inlet with the total propulsion system results in certain penalties such
as in increase in aerodynamic drag. The problem associated with the drag ofa specific type
of inlet namely, a two-dimensional external compression inlet was investigated. It is of the
greatest importance to evaluate and quantifY this drag penalty to ensure that each and every
component of the inlet systemis designed for good flow properties with as little drag as
possible.
The need for this study arose because no useful figures are available to determine the
aerodynamic drag ofa two-dimensional external compression inlet with fixed geometry. The
originality ofthis work is based on the independent critical discernment ofknown facts where
information and equations are combined in a unique miuuJer for determining drag figures.
The project was carried out in three phases, namely a theoretical investigation, where a flow
analysis of the multiple factors influencing aerodynamic drag, was done. A full-scale inlet
model, with the correct geometry and offlight-weight construction, was evaluated during an
intensive wind-tunnel test program. In the last phase, a comparison between the theoretical
values and experimental data, was done for validating the predicted aerodynamic drag figures.

2
The main objective ofthe research carried out, is to establish over which range ofmass flow ratios
the theoretical equations can be used to calculate the· drag of a two-dimensional external
compression inlet, with confidence. A major cost saving can be obtained when expensive wind
tunnel and field tests are scaled down due to the availability ofinformation from which drag values
can be calculated.
This study should make a significant contribution to technology since theoretical equations have
been compiled into techniques which were extensively evaluated during wind-tunnel tests.

CHAPTER
2LITERATURE SURVEY
2.1 INTRODUCTION
The physical layout ofan air inlet consists of the complete ducting system upstream of the
combustion chamber as shown inFigure 2.1. The purpose and requirements of an air inlet are
as follows (Jet Engines 1980:1) :
• To compress supersonic air flow to subsonic flow and diffuse it to conditions which
are acceptable for combustion to take place;
• to allow the reqnired amount ofair to enter the engine;
• to ensure a stable floW;
• to keep the loss in total pressure to a minimum;
• to provide air to the engine face with a uniform velocity across the duet;
• the inlet must have as little sensitivity as possible to angle ofattack and yaw;
• the inlet must satisfy the system reqnirement over a range offlight speeds and engine
demands;
• all inlet drag components must be kept to a minimum.
In supersonic applications inlets are often called inlet diffusers. For a better understanding of
terminology it is worth mentioning that the term "Intake" is used in the United States of
America while the term "Inlet" is used by the British (Seddon 1988).
SupersonicCompression
Shock wave
4
SubsonicCompression
Combustion chamber/compressor face
(a) Layout ofSupersonic Inlet Duct
Oblique shocks;'
Cowl lip
Subsonic Diffuser
Throat
Normal shock
(b) Shock distribution
FIGURE 2.1: Supersonic Inlet Duct
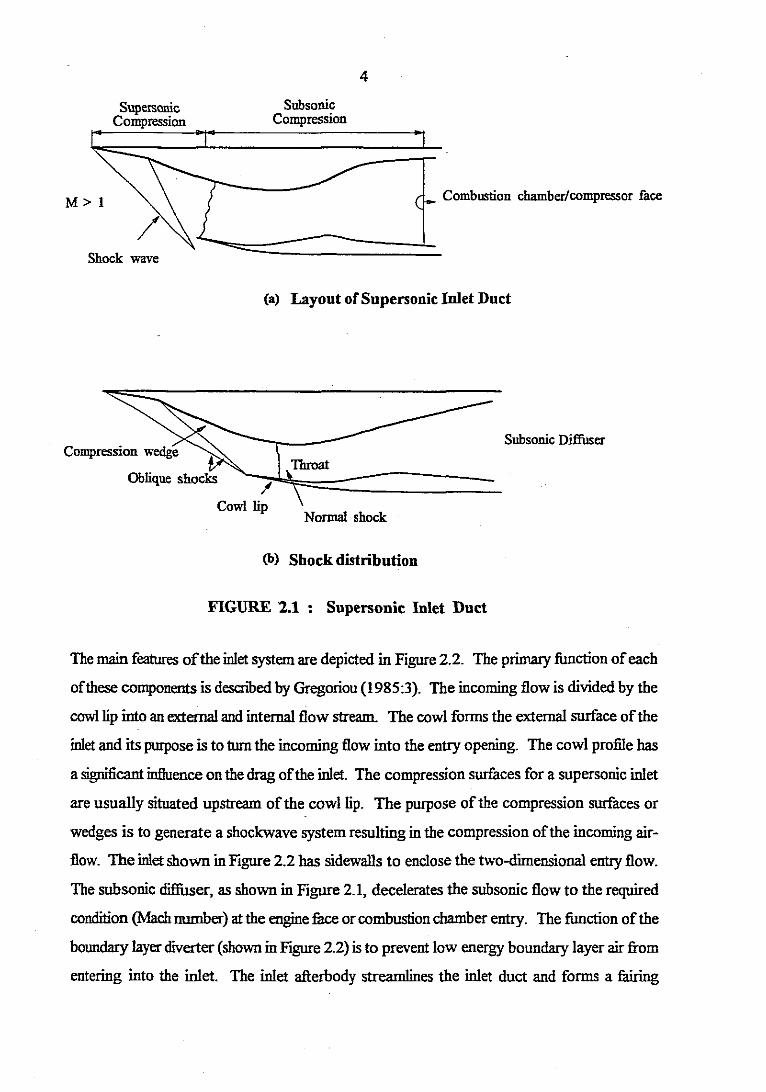
The main features ofthe inlet system are depicted in Figure 2.2. The primary function ofeach
ofthese components is described by Gregoriou (1985:3). The incoming flow is divided by the
cowl lip into an extemal and internal flow stream. The cowl forms the external surface ofthe
inlet and its purpose is to turn the incoming flow into the entry opening. The cowl profile has
a significant influence on the drag ofthe inlet. The compression surfaces for a supersonic inlet
are usually situated upstream ofthe cowl lip. The purpose ofthe compression surfaces or
wedges is to generate a shockwave system resulting in the compression ofthe incoming air
flow. The inlet shown in Figure 2.2 has sidewalls to enclose the two-dimensional entry flow.
The subsonic diffuser, as shown in Figure 2.1, decelerates the subsonic flow to the required
condition (Mach number) at the engine face or combustion chamber entry. The function ofthe
boundary layer diverter (shown in Figure 2.2) is to prevent low energy boundary layer air from
entering into the inlet. The inlet afterbody streamlines the inlet duct and forms a fairing
5
between the inlet and the fuselage. The main purpose ofthis fairing is to prevent base drag
caused by the rear blunt end ofthe inlet duet.
Afterbody
SidewaI1
Subsonic Diffuser
~ Boundary layer diverter
FIGURE 2,2 : Main Features of Inlet System
The inlet type is defined by the shape of the entry section. Part of the incoming flow is
compressed in front ofthe inlet entry and part ofthe flow is further compressed within the inlet
duet in the diffuser section.
2.2 TYPES OF INLETS
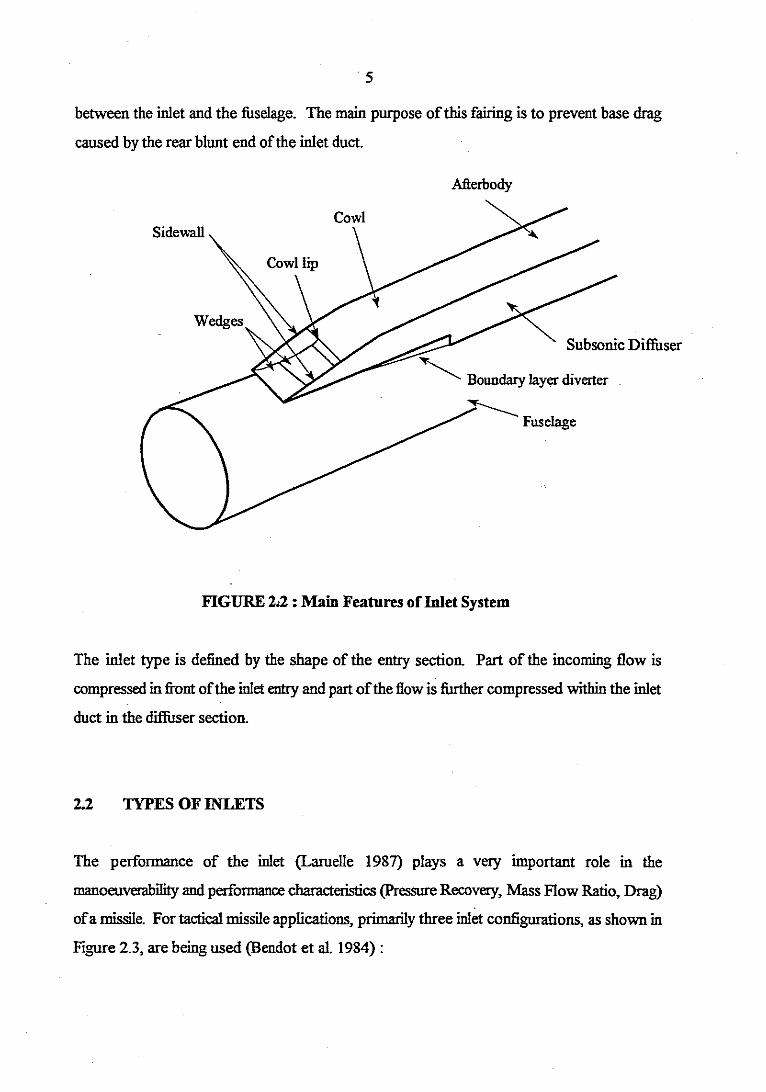
The performance of the inlet (LarueIle 1987) plays a very important role in the
manoeuverability and performance characteristics (Pressure Recovery, Mass Flow Ratio, Drag)
ofa missile. For tactical missile applications, primarily three inlet configurations, as shown in
Figure 2.3, are being used (Bendot et al. 1984) :
(a) Aicisymmetric Inlet
6
Cb) Two-dimensional Inlet
(c) Chin Inlet
View A (Chin Inlet)
FIGURE 2.3 : General Configurations for Supersonic Inlets

7
The three inlet configurations have the following names :
• Axisymmetric
• Two-dimensionallrectanguIar
• Chin.
According to Bendot et al. (1984) the performance of an axisymmetric inlet deteriorates
rapidly with an increase in angles ofattack For two-dimensional and chin inlet configurations
an improvement in performance with increasing positive (nose-up) angles of attack is
encountered.
Two-dimensional and chin inlets are being incorporated in the design of modem high
performance missiles which use air-breathing (ramjet) propulsion systems.
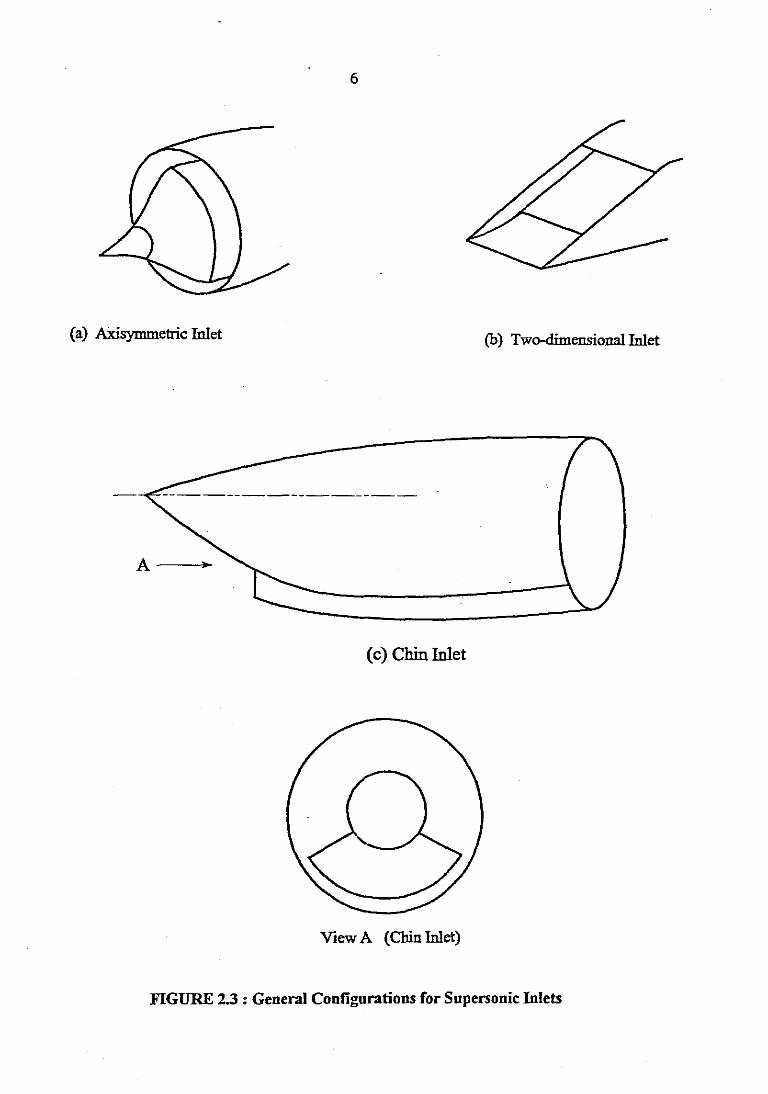
The performance modes ofthe following types of supersonic inlets, as shown in Figure 2.4,
will be discussed in more detail :
• Pitot inlet
• External compression inlet
• Internal compression inlet
• Mixed compression inlet.
2.2.1 Pitot Inlet
This is the most simple type ofinlet where the air-flow is retarded through a single normal
shock to subsonic conditions. This inlet is normally used up to a flight Mach number of
M. = 1,8 (Surber & Numbers 1988). The stagnation pressure recovery ofthis inlet rapidly
deteriorates with higher Mach numbers and is consequently not suitable for modem high speed,
high performance missile applications.
2.2.2 External Compression Inlet
This type ofinlet makes use ofa number ofoblique shocks to retard the air-flow before the
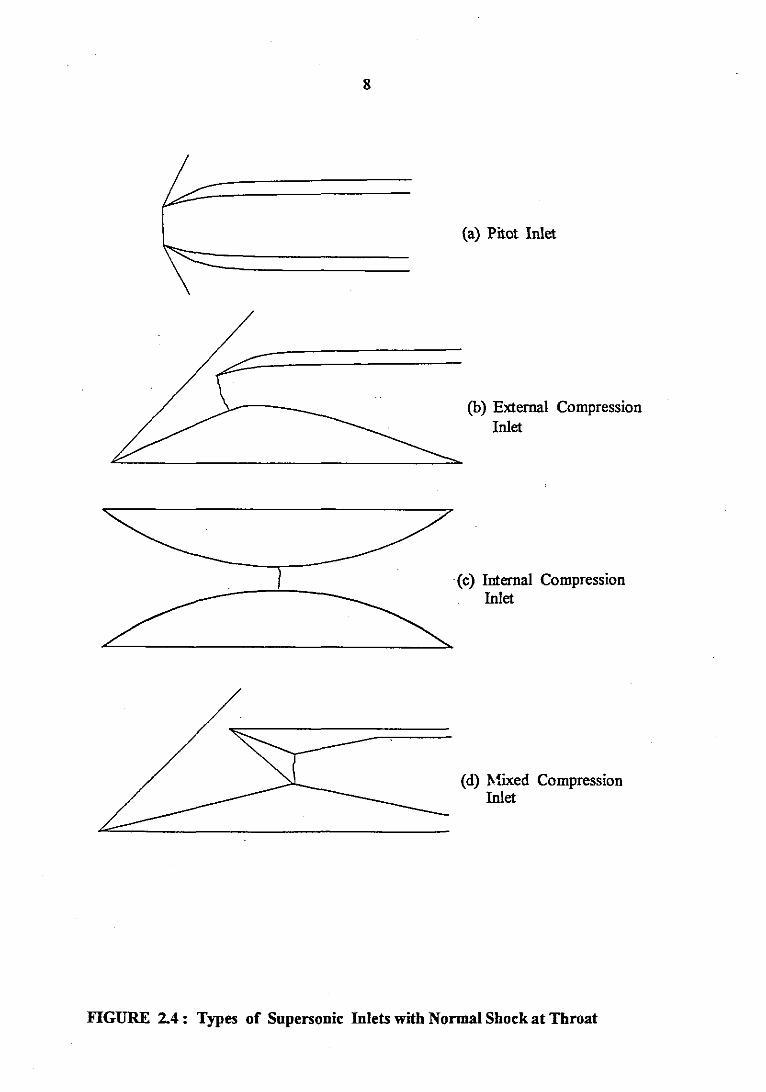
8
(a) Pitot Inlet
(b) External CompressionInlet
(c) Internal Compression
~ hllet
(d) Mixed Compressionhllet
FIGURE 2.4: Types of Supersonic Inlets with Normal Shock at Throat

9
tenninal or nonnal shock is encountered as shown in Figure 2.4 (b). The oblique shock(s) are
generated with the aid ofwedge shaped surface(s) situated in front ofthe cowl lip. Although
a better stagnation pressure recovery can be achieved by increasing the number of oblique
shocks, it was found (Jet Engines 1980) that it is not practical to use more than two external
wedge surfaces due to complications in the flow. The stagnation pressure recovery of this
two-wedge inlet is less satisfactory than an isentropic compression inlet. The concept of
"isentropic" compression is explained by Seddon (1988:9) where the air-flow is compressed
by a multi-shock system on a smoothly contoured compression surface (Oswatitsch 1947).
This produces an infinitely large number of weak oblique shocks which compress the
supersonic air-stream with theoretically no loss in stagnation pressure. With an isentropic
compression inlet very high drag is encountered due to the big angle through which the flow
is turned on the curved compression surface before it enters the inlet opening. The advantage
ofhigh stagnation pressure recovery achieved with this inlet is to a great extent cancelled out
by the much higher drag encountered on the steeply curved cowl lip (Conners & Lovell 1957).
An advantage ofa two-wedge external compression inlet is that the construction is relatively
simple and the optimum configuration is normally determined experimentally in a wind-tunnel.
2.2.3 Internal Compression Inlet
After the supersonic air-stream has entered the inlet, it is retarded by an internal contraction
in the inlet duct as shown in Figure 2.4 (c). This type of inlet has a Iow drag value because
external deflection and disturbance of the entering flow are prevented. A disadvantage ofthis
type of inlet is that a stable shock system with normal shock swallowed (inlet started) is not
easily established because of the instability of a normal shock in a converging channel (Jet
Engines 1980). It is furthermore difficult to start this inlet and a complex variable geometry
inlet is required to achieve this.
A method to start this type of inlet is to raise the air-speed to a value higher than the design
condition (Jet Engines 1980). Once a stable shock system is established the air-speed is
lowered to the design condition. This is however a very uneconomical method to start the inlet
and a real danger exists that the inlet can become unstarted during flight as a result of an

10
and a real danger exists that the inlet can become unstarted during flight as a result of an
increase in back pressure from the combustion chamber.
2.2.4 Mixed Compression Inlet
Of all the inlets discussed, this inlet as shown in Figure 2.4(d), delivers the best results with
reference to stagnation pressure recovery (Jet Engines 1980). The advantage of a better
stagnation pressure recovery is cancelled out to a great extent by the need to control Bow
separation in the inlet duct. The flow separation is caused by the interaction ofthe internal
shock systems (oblique and normal shocks) with the boundary layer. This instability in Bow
conditions can result in the normal shock moving upstream, jumping out ofthe inlet opening
and causing the inlet to become unstarted.
It is ofsignificant importance to understand how the performance ofan inlet system influences
the drag.
2.3 PERFORMANCE CHARACTERISTICS
The performance ofan inlet is characterized by three important parameters, namely pressure
recovery, mass flow ratio and boundary layer bleed. Each one ofthe above-mentioned has an
effect on the overall or total drag figure ofan inlet.
2.3.1 Pressure Recovery
The inlet total pressure recovery is defined by Seddon (1988:5) as the ratio ofthe mean total
pressure at the engine face to the total pressure available in the free stream, infinitely far
upstream ofthe inlet.

11
Where:
pof = Stagnation pressure at engine face
P(loo = Stagnation pressure in free stream
The total pressure recovery is an indication of the maximum pressure available in the
combustion chamber and resultant thrust that can be developed.
With an increase in free stream (flight) Mach numbers, high shock losses and shock wave
boundary layer interactions cause a decrease in total pressure recovery. Methods to remedy
these high shock losses, ego variable compression surface where oblique shocks are prevented
from entering into the inlet, can result in an increase in drag. This is as a result ofthe greater
angle through which the flow is turned before it enters the inlet opening.
2.3.2 Mass Flow Ratio
The mass flow ratio is defined by Gregoriou (1985:7}as the ratio ofair mass flow at inlet entry
to air mass flow at free stream conditions.
me Actual mass flowm = - = -:-::_-'--'-.c:.....:.c..:.::~.:.::-_-=-_
R m. Maximum possible mass flow
Where:
me = mass flow entering inlet
m. = mass flaw at free stream conditions.
This mass flow ratio, mR, can also be expressed as an area ratio since the equation for mass
flow (Hall 1977:12) can be written as follows:
m = p A V

Supersonic flow
12
Where:
P = air density
A = cross-sectional area
v = air velocity
With reference to free stream conditions, the values for P~ and V_can be readily calculated
from steady one-dimensional isentropic equations (Zucrow & Hoffinan 1976) for a perfect gas.
The area, A.. = (b...w), defines the area ofthe stream tube entering the inlet. See geometrical
layout in Figure 2.5. For the purpose of obtaining the properties of the air the control volume
is defined in Figure 2.5. Therefore the equation becomes mc = P. A. V•.
Similarly the maximum mass flow that can enter the inlet opening with a height, h" as shown
in Figure 2.5, can now be calculated
liz. = P. Vjhc·w)
Streamtubeseparation line
Oblique shock~
Control vOlUJn7 y Unbounded streamtube
r----- ---I --- .--J---Normal shock
--+--- ---II
w = width of inlet openinghe = height of inlet openingh oo = height of captured streamtube
FIGURE 2.5: Geometrical Shape of Inlet Opening
with Control Volume Defined
13
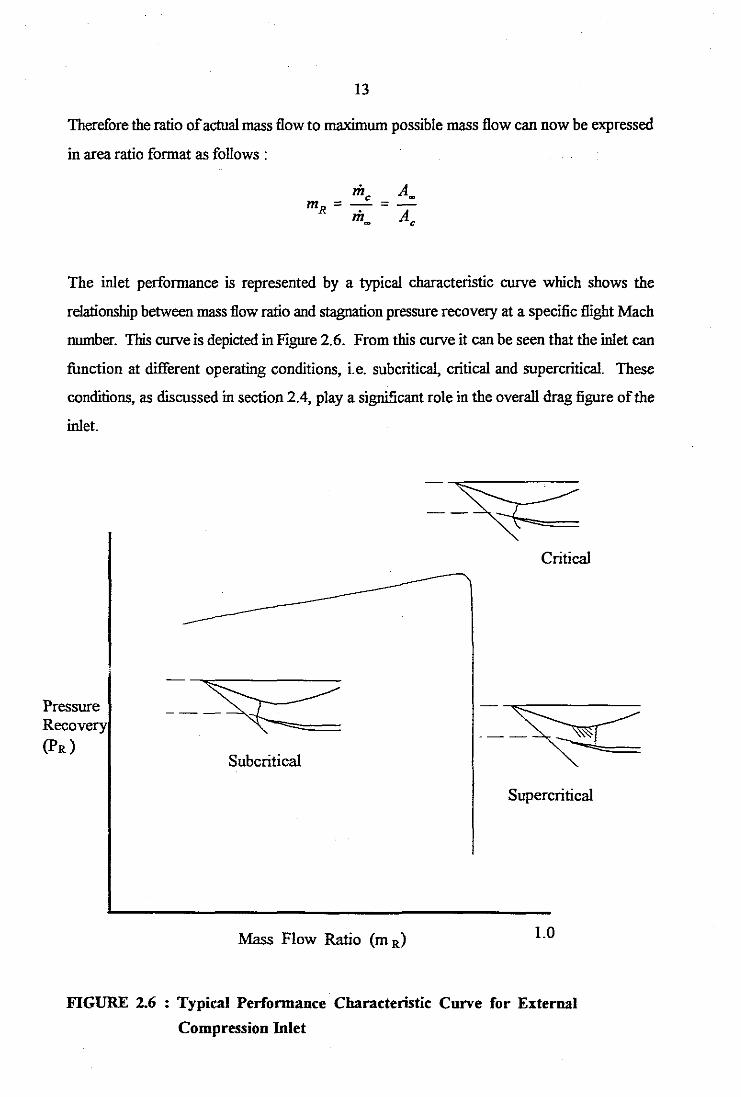
Therefore the ratio ofactual mass flow to maximum possible mass flow can now be expressed
in area ratio format as follows:
riz Ac -m =-=-R . Am_ c
The inlet performance is represented by a typical characteristic curve which shows the
relationship between mass flow ratio and stagnation pressure recovery at a specific flight Mach
number. This curve is depicted in Figure 2.6. From this curve it can be seen that the inlet can
function at different operating conditions, i.e. subcritical, critical and supercritical. These
conditions, as discussed in section 2.4, play a significant role in the overall drag figure of the
inlet.
Critical
PressureRecovery(PR)
Subcritical
Mass Flow Ratio (m R)
Supercritical
1.0
FIGURE 2.6 : Typical Performance Characteristic Curve for External
Compression Inlet

14
2.3.3 Boundary Layer Bleed
The formation ofa boundaty layer on the compression surfaces ofthe inlet and the interaction
ofshocks with the boundaty layer cause detrimental pressure gradients and the flow separates
from the diffUser walls (Seddon 1988). It will result in an unsteady non-uniform distribution
offlow at the engine face, a loss in stagnation pressure recovery, increased internal drag and
too highMach numbers due to the reduced flow area at the separation region. This is one of
the most difficult problems to solve when designing supersonic air-inlet systems.
One of the more elegant designs for solving this problem is the Concorde-type slot bleed
system as described by Leynaert (1988). A schematic layout ofthis design is shown in Figure
2.7 where a wide internal bleed slot is used. The flow from the internal cowl surface
CowlPartial NormalShock
First Fixed Wedge
Isentropicr-- Compression
(Oblique shocks)
Second Wedge
Bleed chamber
.--- Lip Oblique Shock
Shock BoundaryLayer Interaction(Supersonic Expansion)
BleedExit Area, A ex
Slot ~
~
FIGURE 2.7: Concorde-type Slot Bleed (Leynaert 1988)
15
is deflected internally through an oblique shock towards the throat slot where it is deflected
onto the boundary layer which is initiated on the compression surfaces. This interaction causes
a limited supersonic expansion which is terminated in a partial normal shock at the foot ofthe
lip oblique shock. The pressure rise behind the normal shock causes the flow to turn into the
bleed slot from where it is channelled to the atmosphere (for flight conditions) or tunnel test
section (for experimental purposes). Typical bleed ratios used during inlet testing are,
according to Seddon and Goldsmith (1985), between 4% and 12% ofthe captured mass flow.
2.4 MODES OF OPERATION
The three different modes ofoperation are characterized by the position of the normal shock
in the inlet diffuser. Each one ofthese modes can occur at both design and off-design Mach
numbers and is primarily a function ofengine demand. Design and off-design Machnumbers
can be explained as follows:
• At the design Mach number the oblique shock falls on the cowl lip;
• below the design Mach number the oblique shock falls in front ofthe cowl lip;
• above the designMach number the oblique shock falls inside the cowl lip and this is a
condition that is avoided because serious flow instabilities will occur.
The different modes ofoperation, as depicted in Figure 2.8, have an imrortant influence on the
performance and drag characteristics ofthe inlet. An inlet should ideally be operated at the
critical condition, with normal shock at the cowl lip, (Figure 2.8(a») where the inlet and the
engine is matched. This means that the captured mass flow provides the exact amount ofair
required by the engine. At this operating point the stagnation pressure recovery is a maximum
at a constant capture area ratio (pearce 1959). This condition is also clearly depicted in
Figure 2.6.

16
--- 1---Normal Shock
/____ ....e.=-- _
(a) Critical
____ ...e:::.~ _
(b) SupercriticaI
----~=------------------
(c) Subcritical
FIGURE 2.8 : Modes of Operation for Supersonic Inlets

17
The supercritical operating condition (Figure 2.8(b)) occurs when the engine demands more
air than the inlet can deliver. To compensate the normal shock moves downstream of the
throat into the diverging section ofthe diffuser. The Mach number behind the normal shock
increases and a resultant loss in stagnation pressure recovery is encountered at the engine face.
At this condition the capture area ratio is the same as for the critical condition since the
external shock system is unchanged.
When the engine mass flow demand is reduced below the critical requirement the excess air
cannot enter the combustion chamber and the normal shock is pushed upstream out ofthe inlet
opening. The normal shock is now situated in front ofthe cowl lip, as shown in Figure 2.8(c),
and the excess air is spilled around the cowl lip. An unstable condition, known as "buzz", (Jet
Engines 1980) occurs which is a very undesirable condition. This pulsating air-flow can set
up large Vibrations in the inlet structure and cause mechanical failure. Some inlets are however
designed to operate in the subcritical mode with a margin of stable operation. Stagnation
pressure recovery is normally equal to or less than the value for critical operation. The capture
area ratio is less than one, since air is expelled from the inlet opening, with a resulting increase
in drag due to the subsonic air-stream passing over the cowl lip.
It is ofsignificant importance to consider the influence ofdrag on the performance ofa "flying
engine" (vehicle in flight) when discussing the design parameters.
2.5 DESIGN PARAMETERS
In designing inlet systems it is noted by Surber and Numbers (1988) that a compromise must
be reached between performance and stability versus complexity and weight, keeping overall
mission requirements in mind. Maximum pressure recovery, minimum drag, uniform and
steady flow are the most significant design considerations mentioned for an inlet system.

18
2.5.1 Inlet Geometry
An inlet generally consists ofthe following main components as depicted in Figure 2.9:
• Compression surface
• Throat
• Cowl
• Subsonic diffusor.
The specific geometric shape ofeach component depends primarily on the application (missile
or aircraft) and the mission requirements, ie. maximum flight Mach number, angle ofincidence
and yawangle.
For this study an external compression inlet was selected because ofits stable operation and
the fact (SUIber & Numbers 1988) that it is customarily used in aircraft with supersonic flight
capabilities ofMach number 2,5+.
Cowl
Subsonic Diffusor
tThroat
~__-- Side Plate
~-eo---------'",----,CompressionSurfaces
Diverter
Fuselage
FIGURE 2.9 : Inlet Geometrical Layout
19
Although an isentropic compression inlet, as discussed in section 2.2.2, theoretically renders
the most efficient stagnation pressure recovery, it has been found (Jet Engines 1980:3) that it
is not feasible to use a compression surface with more than two oblique shocks because of
greater flow complications.
2.5.2 Design Mach Number
At the design Mach number the oblique shocks, generated by the external compression surface,
are focused on the cowl lip and at this operating point (critical and supercritical operation)
there is no external interference ofair-flow around the cowl lip. With the oblique shock on the
cowl lip there is no unbounded streamtube because all the air-flow is captured by the inlet.
Pre-entry drag, (section 3.2), is zero at the shock-on-lip operating condition. Ifthe inlet is
operating at below design Mach number the oblique shock is focused in front ofthe cowl lip
with the supersonic flow ofthe unbounded streamtube around the cowl lip as shown in Figure
2.5. The pre-entry or additive drag is a function of the pressure force of the unbounded
streamtube acting on the cowl external surface (Hawkins et al. 1976).
2.5.3 Diverter Height
A method to prevent the boundary layer from the fuselage entering the inlet and cause flow
instabilities, is to make use of a diverter. This is a device which is mounted between the
fuselage or missile body and the inlet as is shown in Figure 2.9.. The purpose ofthe diverter
is to scoop offthe low energy boundary layer air. A significant increase in stagnation pressure
recovery and flow stability is achieved with a diverter height which :s just greater than the
thickness ofthe boundary layer (Bendot et al.1984).
It is indicated by Laruelle (1988) that a big improvement in the stagnation pressure recovery
of a rectangular (two-dimensional) inlet, at different angels of attack, can be achieved by
increasing the height ofthe diverter to 10% ofthe missile diameter. Although the increase in
the diverter height causes an increase in the total drag ofthe missile, the gain in stagnation
pressure recovery achieved is ofgreat importance to the performance ofthe inlet.

20 .
2.5.4 Subsonic Diffuser
The stability of the air-flow in the subsonic diffuser has a great influence on the overall .
performance of the inlet. Flow separation, depicted in Figure 2.10, as a result of drastic
changes in the contour ofthe diffuser wall should be avoided at all times. Loss in momentum
due to flow separation and turbulence has a negative effect on drag caused by the internal flow
ofthe inlet.
_____________~-- Cowl Lip
Flow Separation~
J"')Diffuser Wall
Compression Wedge
FIGURE 2.10: Flow Separation OD Diffuser Wall
Experimental work done by Tindell (1987) indicates that longer diffuser ducts with small
expansion (diverging) angles render better limits for flow attachment. This means that higIier
flow limits are achieved before flow will separate from the diffuser walls and cause boundary
layer blockage. For safe operation without any flow separation, diffuser expansion angles of
20 to 9" are generally recommended for area ratios of1,7 to 2,9 (Surber & Numbers 1988).

21
Surber (1975) found that the length of the diffuser duct has very little influence on the
stagnation pressure recovery ofa realistic two-dimensional inlet. It is indicated by Lee and
Boedicker (1985) that a subsonic diffuser with a gradual curvature and rapid expansion at the
diffuser entrance is favourable for high stagnation pressure recovery and low boundary layer
disturbances.
2.5.5 Cowl lip
At an external compression inlet the flow is turned away from the inlet centre line by the wedge
surfaces. It is therefore necessary to turn the flow back to the axial direction at the inlet entry
to allow the flow to enter the inlet. For efficient compression, relatively large angles for the
cowl lip are required to turn the flow back into the inlet opening. Care must be taken to ensure
that the external cowl lip angle does not exceed the maximum value specified for the flow
turning angle (Zucrow & Hoffinan 1976:744) where shock attaclunent will take place for a
specific Machnumber. It is important to note that a smaller value for the external cowl angle
will result in a lower drag value for the cowl because the flow is turned through a smaller
angle. It is therefore essential to find a compromise between stagnation pressure recovery and
drag. The optimum cowl lip dimensions for the highest possible stagnation pressure recovery
and lowest possible drag are generally determined through wind-tunnel tests.
2.5.6 Side Plates
Side plates, with cut-outs as shown in Figure 2.9, are used for rectangular inlets to improve
performance at different angles ofyaw (Laruelle 1988). Although an improvement in the
stagnation pressure recovery is achieved with cut-outs in the side plates a loss in captured mass
flow is experienced. This loss in mass flow has a negative effect on the performance of a
"flying engine" which makes use ofthe air-breathing propulsion system. It is recommended
that modifications, such as cut-outs on the side plates, should only be introduced if final
adjustments to the inlet geometry are required for the improvement of stagnation pressure
recovery. It is stated by Hall (1977) that the introduction of side plates may increase or
decrease the pre-entry or additive drag ofthe inlet. Their effect is in all cases small when
22
compared to the force ofthe upper surface ofthe streamtube acting across the inlet opening
on an area given by (!J. - h..,)w, as depicted in Figure 2.5.
2.6 REVIEW OF DRAG CONlRlBUTING COMPONENTS
The designers of air-breathing propulsion systems need tools to predict the behaviour and
performance ofa "flying engine" very accurately. The drag caused by the inlet has a significant
influence on the amount ofnett thrust available to fu1fil the flight requirements. The total drag
of the inlet consists of different drag contributing components characterised by a specific
geometric shape and flight requirements. It is stated by Krieger and Vukelich (1986:414) that
an in-depth survey of experimental data bases renders figures that are fragmented and
incomplete for establishing the aerodynamic effects of inlet systems on the external
aerodynamics of air-breathing missiles. It is therefore ofcrucial importanet; to establish an
accurate figure for the drag ofthe inlet under discussion, namely a two-dimensional external
compression inlet..
2.6.1 Pre-entry drag
The terminology for this major drag contributing component is described by Seddon (1988:13)
where it is called pre-entry drag in the United Kingdom and additive drag in the United States
ofAmerica. Hall (1977:18) considers the change in momentum between free stream conditions
and the inlet entrance to cause an additional drag force, called pre-entry or additive drag. It
is best represented by the following equation:
Where:
Fp = Nett propulsive thrust
F" - Nett trust due to momentum change between free stream conditions and engine
exit
Fd = External drag forces

23
Dl"" = Pre-entry drag
Pre-entry drag is encountered during the following two situations:
(i) Inlet is operating critically or supercritically below the design Mach number as shown
in Figure 2.8.
(ii) Inlet is operating critically or supercritically at the design Mach number.
In the first case the inlet is operating with the oblique shock in front of the cowl lip with the
unbounded streamtube acting over the entrance ofthe inlet. The static pressures behind the
oblique shock act across an area defined by <he - h,.)w, as depicted in Figure 2.5.
In the second case the inlet is operating with the oblique shock at the cowl lip. The flow is
supersonic up to the cowl lip, undisturbed with no loss in momentum. At this operating
condition the pre-entry drag is zero.
The calculation ofpre-entry drag (supersonic spillage) is fully described in sections 3.2.1. and
3.3.1.
2.6.2 Spillage drag
With the inlet operating at or below the design Mach number, a condition may occur where
the normal shock is pushed out in front of the inlet with subsonic fbw behind the normal
shock. This form of pre-entry drag atsubcritical operation is called subsonic spillage. The
drag force is based on pressures behind the valious shocks and the calculations are fully
descnlled in sections 3.2.1 and 3.3.2.
2.6.3 Cowl drag
The cowl forms the external surface ofthe inlet duct as depicted in Figure 2.2. The cowl lip
turns the oncoming flow into the inlet opening and divides the flow into an internal and

24
external component. The external shock system causes a pressure force on the outer cowl
surfuce and lip. The shape ofthe cowl profile and static pressures behind the various shocks
determine the magnitude ofthe cowl drag force. This drag force is based on the wave pressure
(shock - expansion method) and skin friction drag as discussed in sections 3.2.2 and 3.3.3.
The inlet cowl is a component with a significant contnoution (Gregoriou 1985) to the total
drag of the inlet.. It is therefore important to make use of cowls with slender profiles (small
external angles) for application in "flight vehicles" with supersonic capabilities to reduce wave
pressure drag.
2.6.4 Bleed drag
It is noted by Gregoriou (1985) that neither vortices from the forebody ofthe fuselage, nor the
boundary layer from the compression surface, should enter the inlet. This low energy air will
have an adverse effect on stagnation pressure recovery with a resultant loss in performance.
The low energy air (boundary layer) is removed by means ofa boundary layer trap or slot at
the throat section, as depicted in Figure 2.7, and dumped overboard to atmospheric conditions.
The bleed mass flow loses momentum, when turned away from the main captured mass flow
into a bleed chamber, with the resultant drag penalty. The bleed drag is not a major drag
contnOuting component and the increase in stagnation pressure recovery achieved outweighs
the drag penalty (Surber & Numbers 1988).
The theoretical determination ofthis drag component is fully descnoed in sections 3.2.3 and
3.3.4.
2.6.5 Diverter drag
The diverter, as shown in Figure 2.9, can be defined as a scoop situated between the inlet and
the fuselage with the purpose ofpreventing lower energy or turbulent air from entering the
inlet. The drag associated with this component is caused by wave pressure (static pressures

25
behind shock waves) and skin friction. Although this is not a major drag contributing
component, the shape and the height ofthe diverter should be optimised to find a trade-off
between good stagnation pressure recovery and drag (Hall 1977).
2.7 SUMMARY
From the literature it is clear that no usable drag coefficient, characterising the overall drag of
a standard two-dimensional external compression inlet, could be found. In combining the
general information, found from the work ofthe previous authors, equations are presented in
a manner unique to this specific type of inlet. Theoretical drag figures, based on these
equations, are fully descnoed for actual flight conditions in section 3.3 ofthe next chapter.

CHAPfER
3
THEORETICAL CONSIDERATIONS
3.1 INTRODUCTION
This subject is not discussed in sufficient detail in the literature and an attempt is made to
.describe the different types of drag forces acting on the inlet system. The terminology used
by different authors does not always correlate properly and therefore care is taken to give
descriptions of the different types of drag using common terminology.
For an inlet with a specific geometric shape and location on the airframe, the drag as
defined in section 3.2, is caused by skin friction and flow conditions through the inlet
system. The two flow conditions which contribute to this drag are firstly, when the inlet
is operating at maximum mass flow conditions without any spilling of external air around
the cowl; secondly, when the entry airflow is reduced from the maximum value, resulting
in excessive air-spillage around the cowl lip.
According to Leyland (1988) spillage drag is the main contributing factor when assessing
drag. The methods given for estimating inlet drag are only adequate for initial system
design PllIpOses and accurate results can only be obtained through experimental force
measurements.
Thrust is required to overcome total drag and to maintain or accelerate a body in flight. It
is therefore important to look at the definition given by Seddon and Goldsmith (1985),
where the thrust of a ramjet is defined as the resultant force in the direction of flight
produced on the aerodyuamic duct system by the internal flow.
The main design objective is to produce an inlet system with good pressure recovery and

27
qualities because these factors have an effect on the combustion process and resulting engine
thrust.
3.2 DRAG COMPONENTS
The inlet drag is defined as the resultant force, opposing the direction offlight, produced on
the aerodynamic duct system by external and internal flow (Seddon & Goldsmith 1985), i.e.
the total additional drag on the missile as caused by the inlet.
The external drag is consists mainly ofspillage drag (dumping excessive air overboard), pre
entry drag (with oblique shock: in front ofthe cowl lip at a Mach number below design value),
cowl drag (wave pressure drag), friction drag and boundary layer diverter drag. Internal drag
is primarily caused by bleeding off the boundary layer through ramp and throat bleeding
systems. The significance ofbleed drag is much less than the drag caused by the external flow
conditions mentioned above. It is therefore important to consider each drag contnDuting
component separately.
3.2.1 Spillage Drag
The drag caused by a reduction in the entry flow from a maximum value, defined by the inlet
capture area ~ is called the spillage drag. Great consideration is given to this drag
component because it makes a significant contribution to the total inlet drag. In general the
calculations for spillage drag are based on the pre-entry streamtube force caused by a mass
flow ratio less than unity.
Procedures for determining spillage drag also depend on the inlet geometry such as the shape
ofsidewalls and whether the inlet uses external compression or not.
For the purpose of this report only two-dimensional inlets with external compression at
supersonic speeds are dealt with. Two types ofspillage drag are mentioned in the literature
(Seddon & Goldsmith 1985) namely:

28
i). Supersonic spillage where the flow remains supersonic up to the inlet opening, which
means that the normal shock falls on or inside the cowl lip. In this case the spillage
drag is equivalent to the pre-entry drag where the inlet is operating critically or super
critically below the design Mach number. When the inlet is operating at or above the
design Mach number with the normal shock at or inside the cowl lip, the additive or
pre-entry drag is zero (Hall 1977).
ii). When the mass flow is reduced to a point where the inlet is operating subcritically, i.e.
with the normal shock in front ofthe inlet entry, the oblique shock is pushed away from
the cowl lip causing the excess flow to spill around the lip. The mass flow ratio is
reduced below the maximum value with subsonic flow behind the normal shock in front
of the inlet entry. This condition is called subsonic spillage and the drag component
consists ofpre-entry as well as spillage drag.
These two conditions are illustrated in Figure 3.1.
3.2.I.l Pre-entry Drag at Supersonic Spillage
In the case where only supersonic spillage is encountered, the pre-entry drag for a singIe
wedge external compression surface can be derived from the following equation taken from
Seddon and Goldsmith (1985) :
Where:
Pre-entry drag = Pressure differential x projected area as shown in Figure 3.2.
(1)
Where:
a = Conditions for supersonic spillage at maximum flow.
P_ = Free stream static pressure
PI = Static pressure behind oblique shock

29
--- A A = CriticalSubsonic forespill oo.ly
B = SubcriticalCombined subsonic andsupersonic forespill
Supersonic forespill
Drag
Spilldrag I
IA
I----I
I
Pre-entry drag due tosupersonic forespill
Cowl wave drag
Aa, lAc
C
•1.0A .. = A..maxIA.. < (A.. )
max
FIGURE 3.1 : Cowl Wave Drag and Spillage Drag Components
for an External Compression Inlet (Leyland 1988:20)

30
/'/'
/'
---- ----------- -- ~----------------"'-
Projected Area = Ac - A~
Pressure Differential = PI - P~
Where: ( ~) < 1.0Ac max
FIGURE 3.2 : Supersonic Spillage for a Single-wedge
External Compression Surface

31
A. = Capture area
A. = Streamtube area
Maximum flow ratio can be defined as the condition where the oblique shock lies in front of
the cowl lip with the nonnal shock at or inside the lip (critical or supercritical operation). The
mass flow ratio A.! A c is less than one because there is a deflection in the flow through the
oblique shock where the flow is turned parallel to the compression surface.
With:
(AJAJ.... = 1,0 Full flow with oblique shock on lip.
And
(AJAJ.... < 1,0 with oblique shock in front of lip.
Equation 1 can now be written in coefficient form:
(C ) = Dragd_a A
q~ c
Where:
q~ = Free stream dynamic pressure.
(2)
The value for the maximum flow ratio which is equivalent to the area ratio, AJA., as discussed
in section 2.3.2 for a single-wedge compression surface with the oblique shock in front ofthe
lip, can be derived from the following equation taken from Seddon and Goldsmith (1985) :

32
(3)
Where all the relevant dimensions are shown in Figure 3.3.
Horizontal dimensions
Wedge angle
Shock wave angle
Shock wave angle between lip and horizontal plane ofwedge
at design point.
4iand~. =
0 =
E =
Eo =
For an inlet with a double-wedge compression surface the pre-entry drag at maximum flow
conditions can be determined from the equation obtained from Seddon and Goldsmith (1985):
(4)
Where: P2 = Static pressure behind second oblique shock
Al = Area enclosed by the maximum-flow strearntube at its intersection
with the second oblique shock.
The stream-tube areas are shown in Figure 3.4.
In coefficient form equation 4 is reduced to the following equation:
3.2.1.2 Subsonic Spillage
Subsonic spillage is encountered when the normal shock is pushed out in front ofthe inlet

33
/
.1
/7
//
//
//
E
FIGURE 3.3 : Maximum Flow Ratio with Oblique Shock in Front of Lip

34
Oblique shocks -~~---f--t
A",
Normal shock
FIGURE 3.4 : Streamtube Areas for a Double-wedge Compression
Surface with Supersonic Spill

35
entry causing the flow behind the nonnal shock to be subsonic. The flow is now reduced from
its maximum value. At this condition the total spillage drag consists of two components
namely: (a) pre-entry drag due to the oblique shock in front of the cowl lip and (b) spillage
drag due to the dumping of excess air through the nonnal shock in front of the cowl lip as
depicted in Figure 3.1 condition B.
A method for determining the subsonic forespill drag is given by Seddon and Goldsmith (1985)
where the Fraenkel method for pitot intakes is used to determine the spillage drag for different
positions ofthe compression surface with respect to the cowl lip. This method is adjusted to
give the spillage drag for a bluff solid body with a bow shock wave where the external
geometry is the same as that ofthe inlet.
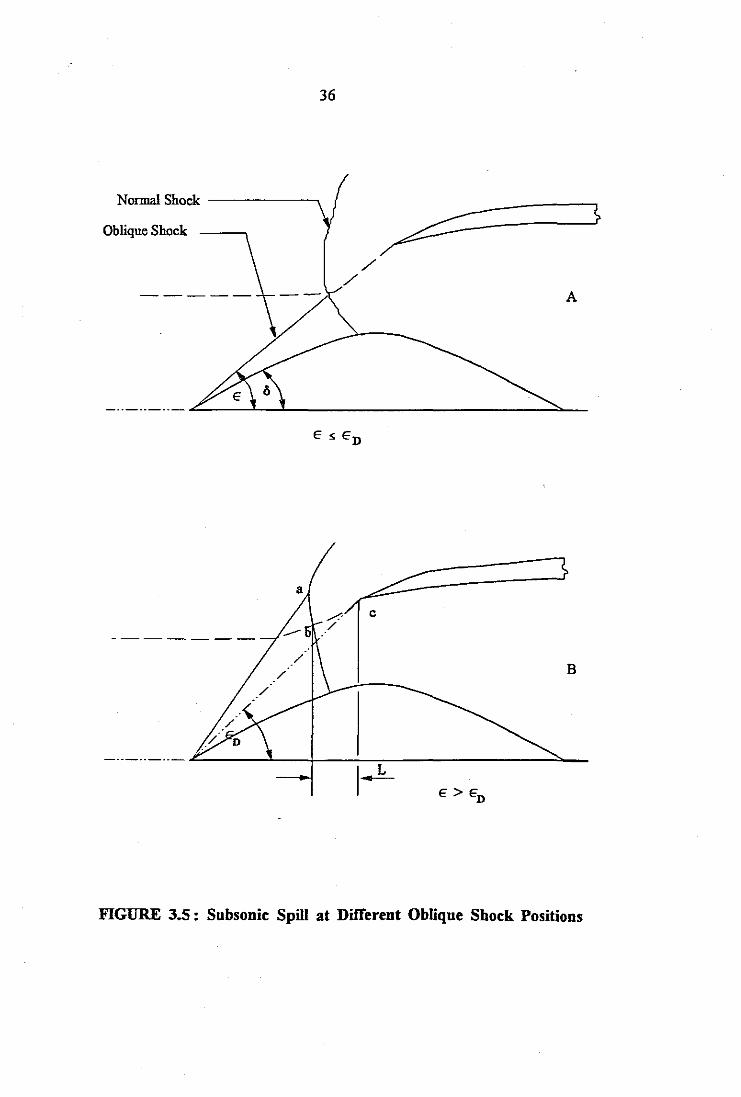
The projected area, At" at point b in Figure 3.5 is determined by the linear movement ofthe
normal shock from L = 0 to L = L_ where L.... is the distance in front ofthe lip fora bow
shock on a solid bluff-body with the same external geometry as that ofthe inlet. When L = 0
the normal shock is located at or inside the cowl lip and A. = (A.)...., but with L = L.... the
normal shock is far upstream ofthe entry and the inlet becomes unstarted with a bow shock
in front ofthe inlet, resulting in A. = o.
At some stage the normal shock intersects with the dividing streamline of the streamtube as
shown at point b in Figure 3.5. At this point the inlet is operating subcritically and for other
reduced flow ratios the spill drag can be detennined (Seddon & Goldsmith 1985) for case B
in Figure 3.5 for which E > ED ' and
(6)
Where:
P3 = Static pressure behind normal shock
(D...). = Pre-entry drag at maximum flow conditions
36
Normal Shock -----___.
Oblique Shock ~---~/
/A
_ .. _ .. _ .. _ .L....._----l'--.l..- ---=::......-
/
/
c
B
_ .._ .._ .._ ..t::::..._----:!...--1--_~-=-- ___=::,,_
I~
FIGURE 3.5: Subsonic Spill at Different Oblique Shock Positions

37
When the inlet is operating with E ~ En ' as shown in case A ofFigure 3.5, the pre-entry
drag, (D~" becomes zero resulting in a spillage drag for this case:
(7)
For the purpose oftheoretical calculations the values ofP. and P3 can be determined from the
isentropic relations and shock tables (Zucrow & Hoffinan 1976) for given free stream Mach
numbers and inlet geometries. Values for AlA.. are obtained from mass flow measurements
during wind-tunnel tests with the inlet operating at different flow conditions.
3.2.2 Cowl Drag
One ofthe main components ofinlet drag is the cowl-pressure drag. For the purpose ofthis
report only two-dimensional inlets with sharp-lipped cowls are considered.
The prediction ofcowl-pressure drag is achieved by means ofthe shock-expansion method as
discussed by Seddon and Goldsmith (1985).
The drag ofthe first element with length, d2» taken from the first inclined section at an angle
T]o to the free stream flow, as shown in Figure 3.6, can be expressed in the form:
DJ = (Pi - p.) d2! sin T]o
= (P,- p.) db! (8)
Where:
. dhJsmT]=o tiP.
1
T]o
=
=
=
Static pressure behind first oblique shock oflip.
Height offrrst element perpendicular to free stream flow.
External angle ofcowl lip at first section.

38
Outer Cowl Surface
...
Inne:c Cowl Smface
dbI'1 1
I /I I I II I I I\ I I II I I II 1 I I\ 1 III M3\ I\I ~ II V3-v;- J~==:;:::=-::!--
_\1-'1=--+ ----1.'-,-_ _ __-~
Pi
t = Cowl length from lip to section where height is a maximumt = t1 + t:z + t 3
hm = Height of lip at maximum section
w = Width of lip section
FIGURE 3.6: Cowl Pressure Distribution by Shock-Expansion Method
(Seddon & Goldsmith 1985:257)

39
The drag on this element with a height, dh" can be expressed as a coefficient based on a
vertical dimension, b"" to obtain the non-dimensional form:
(9)
Where:
h.., = Height ofelement at maximum lip section.
It follows that the drag coefficient for the first element can be derived from equations 8
and 9:
(10)
The drag coefficient for the first inclined section of the cowl lip based on a projected area can
be expressed in the form:
(ll)
Where:
A". = h.., x w = Cross-sectional area at maximum section ofcowl.
w = Width oflip section.
hI = Height offirst section perpendicular to free stream flow.
Using this equation the different inclined sections ofthe cowl lip must be approximated by flat
surfaces in order to allow for real physical dimensions to be used.
The process can be repeated to determine the coefficient ofdrag for the second element with
a length, cUb and an angle, Tl" taken from the second inclined surface as shown in Figure 3.6
resulting in:
D2
Where:
= (Pi - P_) d22 sin Th
= (Pi-P_)dh,
40
(12)
. dh2srn 1'] =-1 d2
2
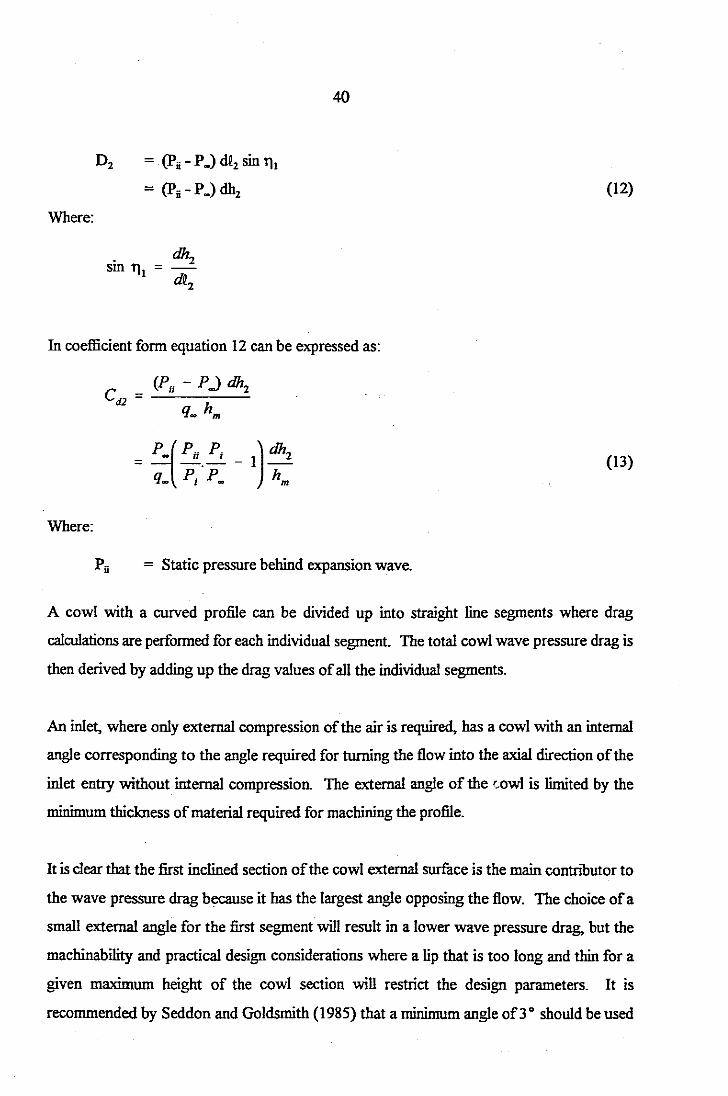
In coefficient fonn equation 12 can be expressed as:
c = (PH - P..) dh,d2 h
q- m
Where:
Pi = Static pressure behind expansion wave.
(13)
A cowl with a curved profile can be divided up into straight line segments where drag
calculations are perfonned for each individual segment. The total cowl wave pressure drag is
then derived by adding up the drag values ofall the individual segments.
An inlet, where only external compression of the air is required, has a cowl with an internal
angle corresponding to the angle required for turning the flow into the axial direction ofthe
inlet entry without internal compression. The external angle of the (;Owl is limited by the
minimum thickness ofmaterial required for machining the profile.
It is clear that the first inclined section ofthe cowl external surface is the main contnllUtor to
the wave pressure drag because it has the largest angle opposing the flow. The choice ofa
small external angle for the first segment will result in a lower wave pressure drag, but the
machinabiIity and practical design considerations where a lip that is too long and thin for a
given maximum height of the cowl section will restrict the design parameters. It is
recommended by Seddon and Goldsmith (1985) that a minimum angle of3 0 should be used
41
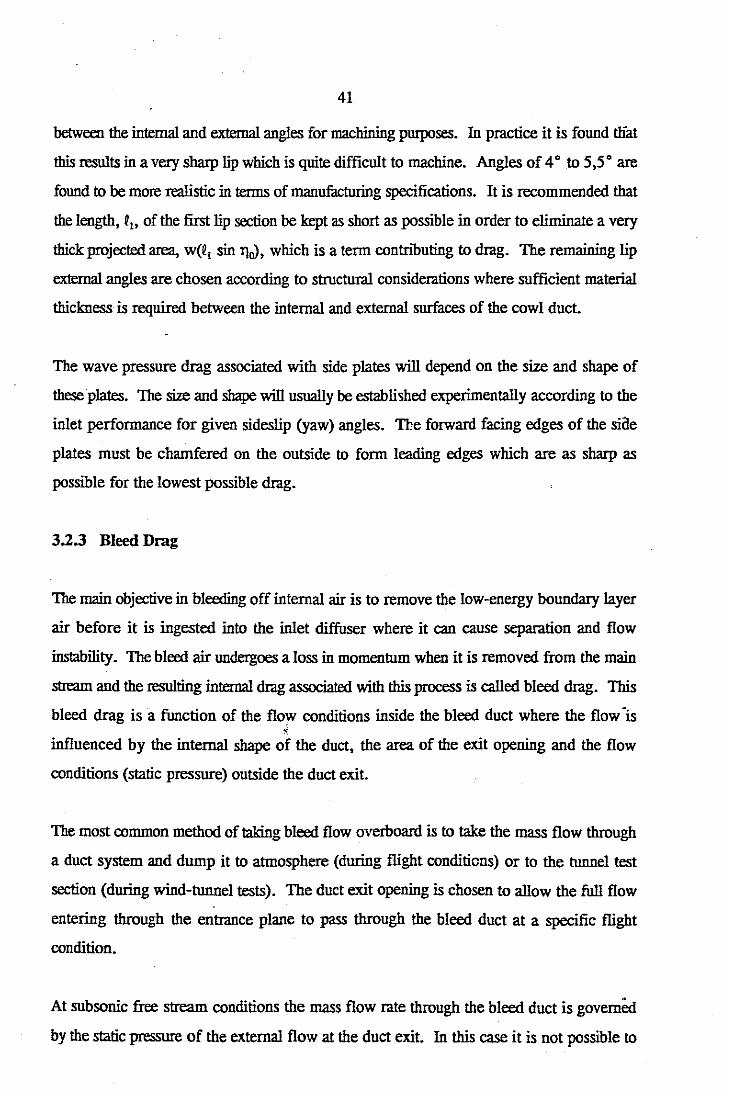
between the internal and external angles for machining pUIpOses. In practice it is found tliat
this results in a very sharp lip which is quite difficult to machine. Angles of 4 0 to 5,5 0 are
found to be more realistic in terms of manufacturing specifications. It is recommended that
the length, ~h of the first lip section be kept as short as possible in order to eliminate a very
thick projected area, W(~l sin TJtJ, which is a term contributing to drag. The remaining lip
external angles are chosen according to structural considerations where sufficient material
thickness is required between the internal and external surfaces of the cowl duct.
The wave pressure drag associated with side plates will depend on the size and shape of
theseplates. The size and shape will usually be established experimentally according to the
inlet performance for given sideslip (yaw) angles. The forward facing edges of the siae
plates must be chamfered on the outside to form leading edges which are as sharp as
possible for the lowest possible drag.
3.2.3 Bleed Drag
The main objective in bleeding off internal air is to remove the low-energy boundary layer
air before it is ingested into the inlet diffuser where it can cause separation and flow
instability. The bleed air undergoes a loss in momentum when it is removed from the main
stream and the resulting internal drag associated with this process is called bleed drag. This
bleed drag is a function of the flo}\' conditions inside the bleed duct where the flow "is:-:
influenced by the internal shape of the duet, the area of the exit opening and the flow
conditions (static pressure) outside the duet exit.
The most common method of taking bleed flow overboard is to take the mass flow through
a duet system and dump it to atmosphere (during flight conditions) or to the tunnel test
section (during wind-tunnel tests). The duet exit opening is chosen to allow the full flow
entering through the entrance plane to pass through the bleed duet at a specific flight
condition.
At subsonic free stream conditions the mass flow rate through the bleed duct is governfd
by the static pressure of the external flow at the duct exit. In this case it is not possible to

42
choke the exit due to an inadequate pressure ratio. A ratio ofPJP ~ 1,893 is required for
choking ofthe exit.
At supersonic flight speeds the exit will be choked with sufficient stagnation pressure recovery
ofthe bleed air to achieve the required pressure ratio mentioned above.
The calculation ofinlet bleed drag is based on the application ofthe momentum equation as
discussed by Seddon and Goldsmith (1985). This is a general equation for different flow
conditions through the bleed duct. The change in momentum between the entrance and exit
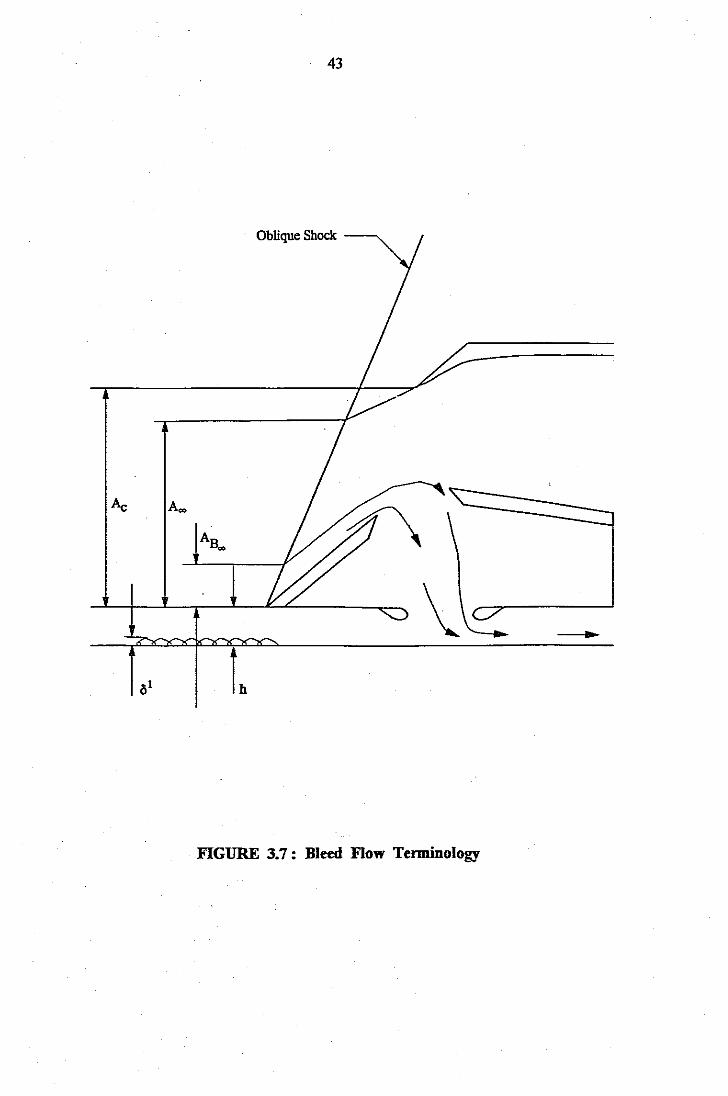
stations of the bleed duct is expressed in momentum theorem form refering to Figure 3.7:
Momentum flux at entry = Momentum flux at exit + momentum loss due to internal flow
distortions (drag component).
But ~ = 2qP
Substitution ofequation 15 into equation 14 results in:
Where:
A.,. = Bleed duct exit area
1\... = Free strearntube area captured by the bleed duct as shown in
Figure 3.7
q = Dynamic pressure
(14)
(15)
(16)
43
Oblique Shock -~
L
FIGURE 3.7: Bleed Flow Tenninology

44
P = Static pressure
00 = Denotes free stream conditions
p = Air density
ex = Denotes conditions at duct exit
The above equation takes account ofthe pressure losses as well as the change in momentum
caused by friction on the internal "wetted" surfaces ofthe duct.
From a system point ofview it is more practical to define the bleed drag in terms of local
conditions at the bleed entry plane resulting in the following expression:
Where:
Dim = [(PI - Pj + 2q, tJen - [(Pa - Pj + 2qa)jAa
~ = Local conditions at the bleed entry
A." = The bleed entry area normal to the flow
cI>/cI>, = Boundary layer momentum ratio
(17)
Different values ofcI>/cI>, for a boundary layer with a standard velocity profile parameter n =
7 are obtained from Figure 3.8.
Where:
M, = Local Mach number at bleed entry
hlo) = Inlet height ratio = Inlet diverter heightBoundary layer thickness
The velocity profile parameter, n, can be obtained from a power-law velocity distribution
through the boundary layer from equation 4.1 (Seddon & Goldsmith 1985) :

45
1.0
0.9
0.8
0.7
0.6
0.5
0.4
0.3
02
0.1
o
~-Local Mach ~
no. MQ
l0~~ t::::: t:::-. 02 / L,....---'
0.80~E9VV V
~1:d~ ~~<,.2.~1.6 ~/~~
/J,~ '/0 K " .. 2.4/ 32
~~~/ I' 4.0
? //
/'
02 0.6 1.0
Inlet height ratio, hili1
1.4 1.8
FIGURE 3.8: Boundary Layer Momentum Ratios (Seddon & Goldsmith 1985:210)(Velocity Profile Parameter n = 7)

46
(18)
Where:
U = Streamwise velocity in boundary layer at a distance y from the surface.
U, = Streamwise velocity at the edge ofthe boundary layer
51 = Boundary layer thickness
Aerodynamic drag is normally expressed in coefficient form by dividing the drag force by the
free stream dynamic pressure and a reference frontal area. From equation 16 it follows that:
(19)
Where:
Ac = Main inlet capture area.
It should be noted that for a value ofhl5 l greater than one, some of the flow outside the
boundary layer is diverted into the bleed duet. This is uneconomical with a resulting increase
in bleed drag without any improvement in the quality offlow entering the inlet.
3.2.4 Diverter Drag
A diverter can be described as an intermediate section between the inlet and the missile
airframe allowing the inlet to stand off from a specific surface. The boundary layer
approaching the inlet is diverted sideways and backwards into a channel away from the inlet
opening. Wedge-shaped channel diverters, as shown in Figure 3.9, are commonly used on
supersonic inlets for this purpose.

47
-------
FIGURE 3.9: Channel Diverter for Supersonic Inlet

48
Boundary layer problems generaIIy increase with higher flight speeds. At supersonic speeds
shock waves are encountered which drastically increase the boundary layer problem where it
interacts with the flow on the surface of the missile airframe up-stream ofthe inlet entry. It
is therefore recommended that provision must be made for a diverter under these flight
conditions.
Careful consideration must be given to the desirability of installing a diverter, which is an
additional piece ofhardware on the missile airframe, to achieve a gain in pressure recovery.
This gain, due to the scooping offofboundary layer air, is associated with a drag and mass
penalty.
According to Jell and Ballinger (Seddon & Goldsmith 1985) the friction drag of a channel
diverter can be derived from the flat plate skin fiction for compressible flow based on the total
wetted area inside the diverter channel.
The skin fiction drag is derived by Hoemer (1965) and is based on the momentum loss ofthe
boundary layer per unit time. The skin friction drag coefficient is found to be:
Where:
DC = f
f qS_
Dc = Friction drag
q = Dynamic pressure = 1/2 P V2
S_ = Wetted area of surface under consideration
(20)
Values for the skin fiction drag coefficient as a function of Mach number are shown in
Figure 3.10 for a laminar boundary layer in compressible fluid flow (Hoemer 1965:17-3).
Skin friction is a function ofviscosity due to the change in temperature within the boundary
layer. This is a result ofdifferent streamwise velocities from the body surface to the edge
ofthe boundary layer. The skin friction coefficient in Figure 3.10 is therefore expressed in
terms ofReynolds number, R" based on a body length dimension. The coefficient, Ct>

49
TestedCooled so that Twall = TAmb
•
•
Without heat transfer (Twall = TRee)1
. /.. J . ._&-.-...~--:---.. .--.. -.----.-.-. ---._---£-I -.-. -
(18,e) ! _.-:--1.2
1.0
1.4
0.6
. 0.8
0.4
0.2
OL- ---
1 2 3
MachNwnber
4 5
R r = Reynolds nwnber based on a body length dimension
FIGURE 3.10: Mean-total Laminar Skin Friction Parameters inTerms ofReynolds Number (Hoemer 1965:11-3)

50
can now be calculated for a known Mach number and corresponding Reynolds number.
In a practical case, whether the boundary layer is laminar or not, depends on the conditions
upstream of the diverter. In a missile application, where the inletldiverter is normally
situated a few diameters aft of the missile nose and where shock waves are encountered
when flying at supersonic speeds, it is most likely to have turbulent flow approaching the
diverter. This will cause a much higher friction drag than laminar flow because in the case
of turbulent flow, fluctuating velocity components transversely and parallel to the main
stream are encountered, causing a change in momentum with a resulting increase in friction
drag.
Tests canied out by Schultz-Grunow (Hoerner 1965) on velocity distributions on a flat wall
resulted in the following equation for turbulent skin friction drag coefficient in compressible
flow:
. (21)
Tests on smooth plates in wind-tunnels and towed water tanks show that the above
theoretical equation renders adequate values for the drag coefficient, Cv over a wide range
ofReynolds numbers, R, = 10' to 109, which comes close to Schoenherr's line as shown by
Hoerner (1965:2-5). Since the Reynolds number Re, is a function of the Mach number the
effect ofMach number is explained by the Sutherland formula (Hattingh 1977) :
Re = 47772 [P M D / T 2] (T + 114)
i + 1
P = P I (1 + i-I M 2) 2{i - 1)o 2
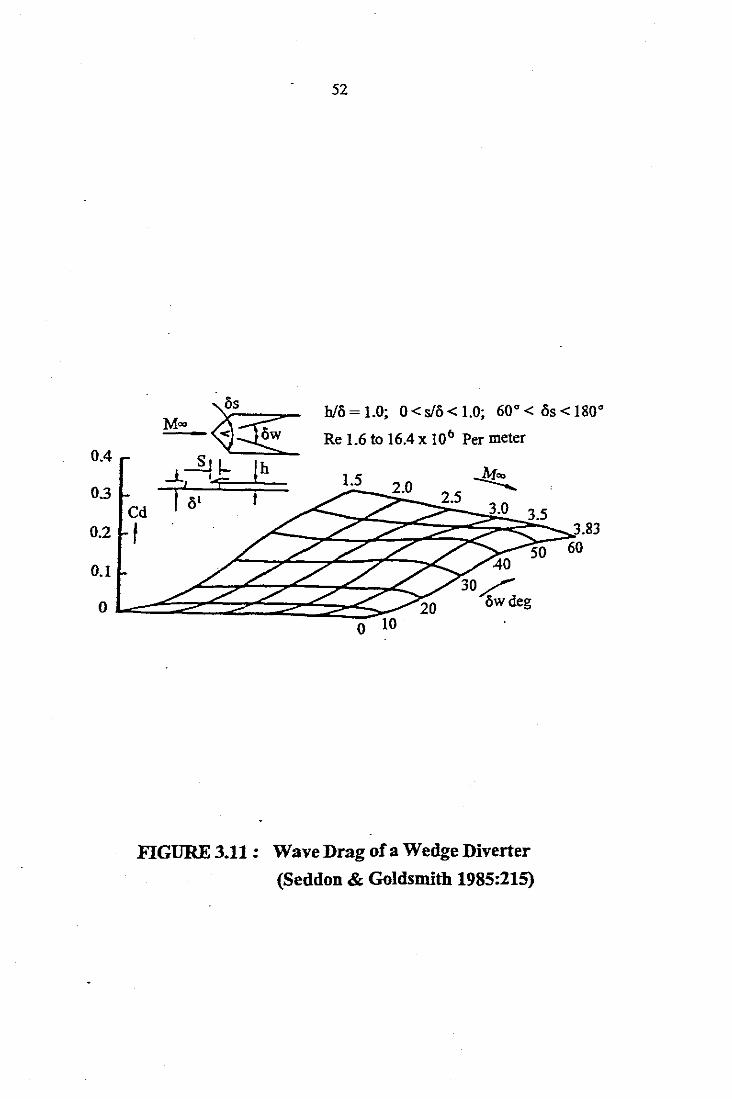
52
hlo = 1.0; 0 < slo < 1.0; 60 0 < os < 1800
Re 1.6 to 16.4 x lOb Per meter0.4
Ma> ~~
-l.~£ ~ 1.5 ~03 Cd I 0' -:--::~2~.0~~2=.5~30
..c::::::::2:::2::;~~:2;·S::~3:.5~I;, 3.8350 60
40
30/'owdeg
0.1
0.2
FIGURE 3.11: Wave Drag ofa Wedge Diverter
(Seddon & Goldsmith 1985:215)

53
The wave drag for a diverter with a specific geometrical shape and drag coefficient
corresponding to a selected Mach number from Figure 3.11 can now be calculated.
During the integration ofthe inlet with the "flight vehicle" it is very important to establish the
boundary layer thickness of the flow on the vehicle airframe at the inlet entry plane very
accurately.
The diverter height must be set to a value which is fractionally more than that required to
remove only the low energy boundary layer flow. Bendot, Heins and Piercy (1984) state that
a significant improvement in stagnation pressure recovery and flow stability can be achieved
with a diverter height which is just greater than the boundary layer thickness.
Scooping offtoo much ofthe high energy free stream flow will result in a drag penalty without
improvement in the stagnation pressure recovery. It is therefore generally accepted that the
optimum height for a specific diverter has to be experimentally determined in a wind-tunnel and
not only taken as deSCIibed above by Bendot, Heins and Piercy (1984) because inlet location,
yaw and side slip angles have a significant influence on the boundary layer thickness.
3.3 DETERMINATION OF COEFFICIENT
A better understanding of the inlet drag phenomenon is obtained when Calculations are
performed for actual flight conditions. The drag of each inlet component, including the
boundary layer diverter, is calculated separately and added up t:> give the total drag
experienced by the inlet in flight.
Atwo-dimeosional supersonic inlet with two external compression wedges, on a missile flying
at M = 2,0 at sea level, is used as an example in the calculations. The aim ofthis study is to
obtain an overall drag coefficient for this specific inlet based on frontal projected area (61,02
mm x 56,4 mm) and free stream dynamic pressure. The coefficient ofdrag for the diverter is
also given as a separate figure because it is seen as an intermediate section between the inlet

54
diverter is also given as a separate figure because it is seen as an intermediate section
between the inlet and airframe and can vary in size and shape for a particular inlet with a
specific geometric shape.
The geometrical shape of the full-scale porous inlet is shown in Figure 3.12. Drag
calculations based on control volume, Vc. are conducted as follows for each individual
component.
3.3.1 Pre-entry or Additive Drag
It is assumed that the inlet operates at a Mach number ofM = 2,0 which is below the design
point where Mda = 2,2. At this condition the inlet is operating with the oblique shock in
front ofthe cowl lip and pre-entry drag is encountered. For maximum flow conditions, as
defined in section 3.2.1.1, the pre-entry drag for a double-wedge compression surface can
be determined from equation 4:
(23)
Where:
PI = Static pressure behind first oblique shock .
p 2 = Static pressure behind second oblique shock
P_ = Free stream static pressure
A.. = Streamtube area
A. = Capture area
Al = Area enclosed by the maximum-flow streamtube at its intersection with
the second oblique shock.
The values ofP_ = 101,33 kPa (static pressure at sea level), PI = 164,88 kPa and P2 =244,91 kPa are obtained from Table 3.1 for M = 2,0.

55
Control volume, Vc
'---------~~f~·~I-~I.~+-+~
II
-::=f---
Sectioral View
53,3
++
/' "56,4
Frontal View
·1
FIGURE 3.12: Geometric Shape of Full-scale Porous Inlet

56
A graphical display of the streamtube areas is shown in Figure 3.13. The values of Al =
48,36 mm, A" = 52,9 mm and A.. = 47,36 mm are found from Table 3.1 and the width of
the capture opening = 53,3 mm from Figure 3.12.
Substituting all the relevant information into equation 23 yields the value ofthe pre-entry
drag:
{D..".l. = {164,88 - 101,33)1cP [{48,36 - 47,36)53,3] 10-6
+ {Z44,91 - 10t,33)1cP [{52,9 - 48,36)53,3] 10-6
= 38,13 N
The pre-entry drag for flight Mach numbers = 1,8; 2,2; 2,3 and 2,4 are calculated in a similar
manner and the results are depicted in Table 3.2. For a better understanding ofthese values,
a graph depicting the results are shown in Figure 3.14, where a decrease in drag with an
increase in Mach number is clearly evident. This is caused by the fact that a decrease in pre
entry drag is encountered with the oblique shocks focussing closer and closer to the cowl
lip as the Mach number increases to a point where the shocks faIl at or inside the cowl lip.

57
~----------------.'C/---/'--.,~---/'
®
Full-scale Porous Model
FIGURE 3.13: Streamtube Areas at below Design Mach Number
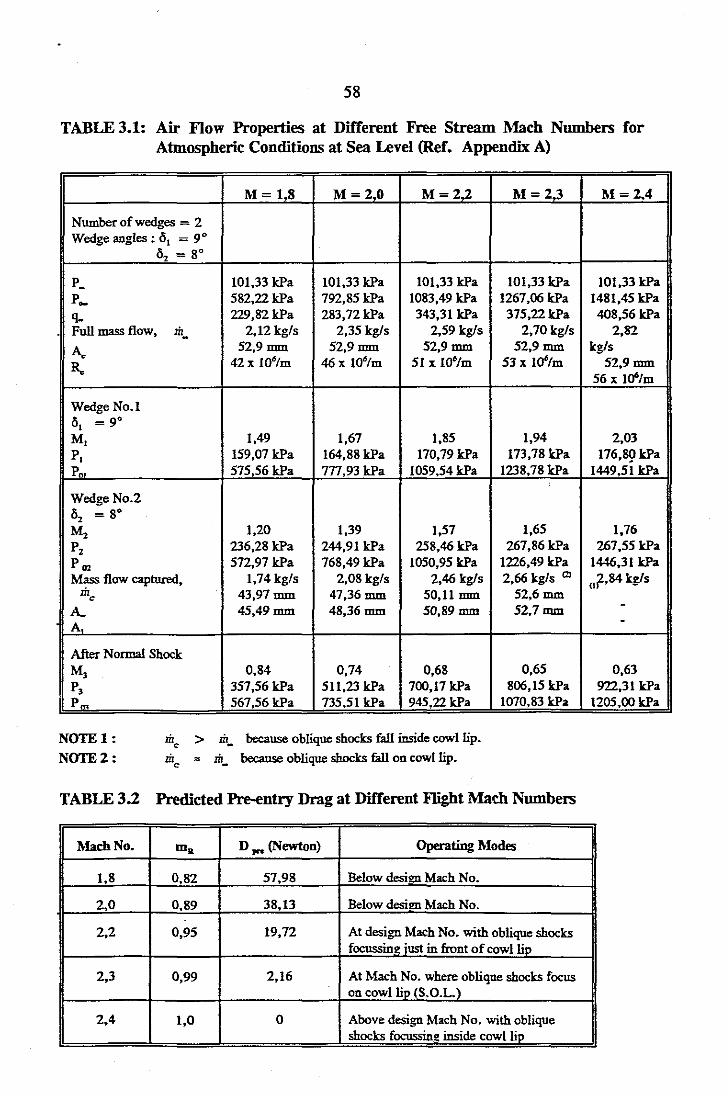
58
TABLE 3.1: Air Flow Properties at Different Free Stream Mach Numbers forAtmospheric Conditions at Sea Level (Ref. Appendix A)
M= 1.8 M=2.0 M=2.2 M =2.3 M=2.4
Number of wedges = 2Wedge angles: <5, = 9°
<5, - 8°
P- 101,33 kPa 101,33 kPa 101,33 kPa 101,33 kPa 101,33 kPa
P- 582,22kPa 792,85 kPa 1083,49 kPa 1267,06 kPa 1481,45kPa
q- 229,82kPa 283,72kPa 343,31 kPa 375,22kPa 408,56 kPaFull mass flow, m_ 2,12 kg/s 2,35kg/s 2,59 kg/s 2,70kg/s 2,82
A. 52,9 mm 52,9 mm 52,9 mm 52,9 mm kg/s
R" 42 x 106/m 46 x lo'/m 51 x Io'/m 53 x 106/m 52,9 mm56 x 1000/m
Wedge No. I<5, = 9°M, 1,49 1,67 1,85 1,94 2,03P, 159,07 kPa 164,88 kPa 170,79 kPa 173,78kPa 176,8gkPaPm 575,56 kPa 777,93 kPa 1059,54kPa 1238,78 kPa 1449,51 kPa
Wedge No.2<5, = go
M, 1,20 1,39 1,57 1,65 1,76P, 236,28 kPa 244,91 kPa 258,46 kPa 267,86 kPa 267,55 kPa
Pm 572,97 kPa 768,49 kPa 1050,95 kPa 1226,49 kPa 1446,31 kPaMass flow captured, 1,74 kg/s 2,08 kg/s 2,46 kgls 2,66 kgls Cl oil,84 kg/s
me 43,97 mm 47,36 mm 50,11 mm 52,6 mm
A.. 45,49 mm 48,36 mm 50,89 mm 52,7 mm -A -After Normal ShockM3 0,84 0,74 0,68 0,65 0,63P3 357,56 kPa 511,23 kPa 700,17 kPa 806,15 kPa 922,31 kPaP~ 567,56 kPa 735,51 kPa 945,22 kPa 1070,83 kPa 1205,ookPa
NOTE! :NOTE 2 :
me > m_ because oblique shocks faIl inside CQw1lip.
me = m_ because oblique shocks fall on cowl lip.
TABLE 3.2 Predicted Pre-entry Drag at Different Flight Mach Numbers
Mach No. ma D PR (Newton) Operating Modes
1,8 0,82 57,98 Below desi>m Mach No.
2,0 0,89 38,13 Below desi>m Mach No.
2,2 0,95 19,72 At design Mach No. with oblique shocksfocussinl! iust in front of cowllio
2,3 0,99 2,16 At Mach No. where oblique shocks focuson cowllio tS.O.L)
2,4 1,0 0 Above design Mach No. with obliqueshocks focussina inside cowllio

59
"'"~~
--
8lJ
20
o1.4 1.6 1.6 2 22 24 2.6 2.6
nGURE 3.14: fudirted Pre-entry Drag Cor Fun-stolel'orous Model
3.3.2 Spillage Drag
The spillage drag for an inlet operating subcritically is determined from equation 6:
DopiD = (P3 - p.) (A. - A..) - (D~.
Where:
P3 - Static pressure behind normal shock as shown in Figure 3.15.
Due to a lack of tunnel test data at subcritical flow conditions, the data required is taken
from the theoretical flow dynamic calculations given in Table 3.1.
For M = 2,0 the following data is obtained from this table:
ID. - 2,35 kg/s = Mass flow based on capture area, A. (Le. full mass
flow)
ID - 2,08 kg/s = Mass flow based on streamtube area, A.. (Le. actual massc
flow captured)
p. - 101,33 kPa
P3 - 511,23 kPa
A. - 52,9 mm
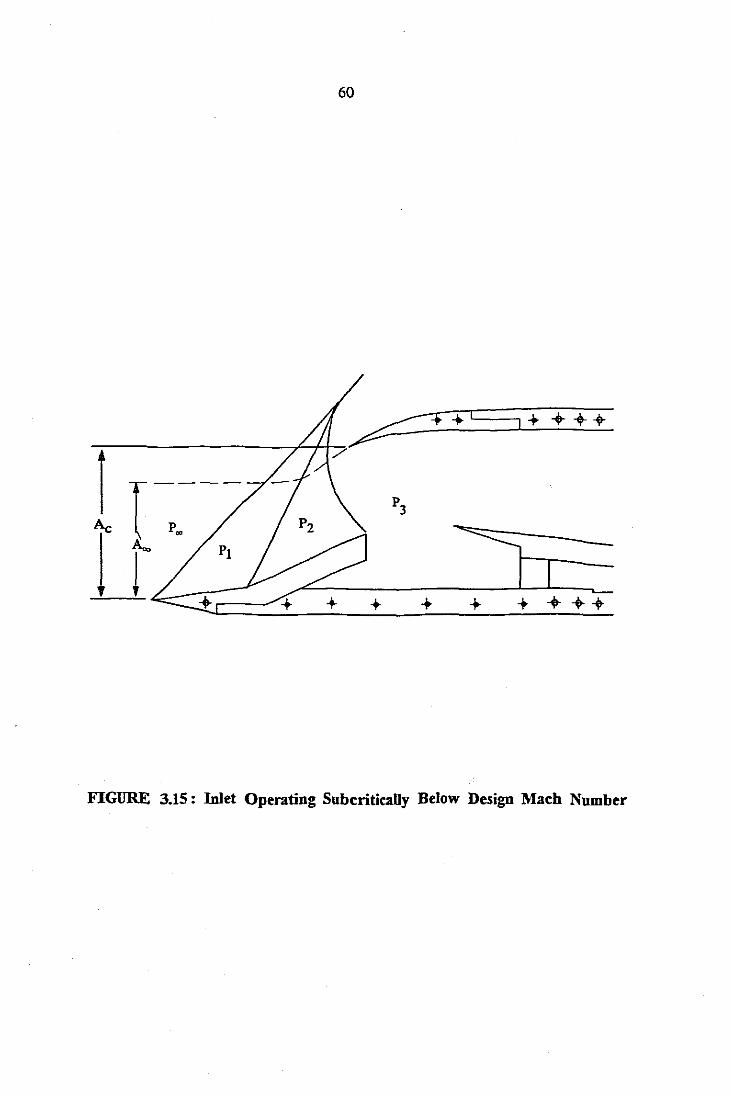
60
FIGURE 3.15: Inlet Operating Subcritically Below Design Mach Number

61
Spillage drag is based on mass flow entering the inlet before bleed mass flow is dumped. By
closing the exit opening to obtain subcriticaI operation, the excess air is spilled around the
cowl lip resulting in different percentages ofspillage, ego 5% , 10% , 20% , 30% , and 40%.
Assuming a 5 % spillage results in:
Iilspn
and m.'
= 2,08 x 5/100 = 0,10 kgls
= 2,08-0,10
= 1,98 = actual mass flow entering inlet duct with inlet spilling.
The new or actual streamtube area, as shown in Figure 3. 15, becomes:
A ' = 52 9 JC 1,98- , 235,
= 44,57 mm per unit width
for m = 1,98.R 2,35
= 0,84
Substituting all the relevant values into equation 6 results in the value of the spillage drag
for a 5 % spillage:
D..,m - (511,23 - 101,33) IcY [(52,9 - 44,57) 53,3] 1O~ - 38,13
- 143,86 N
The results of the spillage drag for other spillage ratios are C2lculated in a similar manner
and depicted in Table 3.3.

62
TABLE 3.3 Predicted Spillage Drag at Different Operating Modes
% M=I,8 M=2,O M=2,2 M=2,3 1\1=2,4
Spillage
mg D... mg D... mg D.... mg D... mg D...
5 0,78 102,22 N 0,84 143,86N 0,90 143,38 N 0,94 122,94N 0,95 114,21 N
10 0,74 129,39N 0,80 197,82N 0,85 227,97N 0,89 225,87N 0,91 213,54 N
20 0,66 190,85 N 0,71 301,16N 0,76 384,36 N 0,79 417,46 N 0,80 45l.58 N
30 0,58 248,76 N 0,62 399,48N 0,66 547,47N 0,69 616,19N 0,71 681,32 N
40 0,49 310,08 N 0,53 502,82N 0,57 703,86 N 0,59 807,41 N 0,60 919,36 N
The above-mentioned results are graphically displayed in Figure 3.16. An increase in spillage
drag with an increase in spill rate as well as an increase in Mach number is clearly shown. A
.high Mach number before the normal shock causes a big drop in the value ofthe Mach number
behind the normal shock with inlet spilling, resulting in a high static pressure acting across the
projected area.
,j,
4O%SpiD.,
/,i
./V./ 30 ""Spill i/ !
./ -- 20 %sp;n ,,~--- ,
1'0 %S_ll i~ ~ %sp;n ~
,:!Xl
'000
~fIX)
a
J 600:..!!CO 400
200
o1.4 1.8 1.8 2 2.2 2.4 2.8 2.8
3.3.3 Cowl Drag
--FIGURE 3.16 : Predicted Spillage Drag for FaR-nale
Porous Model
3.3.3.1 Wave Pressure Drag
The cowl lip is divided into two inclined flat surfaces or sections as shown in Figure 3.17.
The drag for each section is calculated individually because the flow conditions differ from
the one surface to the other.

63
Oblique Shocks ---______
at 11..=2,0
Po>
'---- COMPRESSION RAMP
r--- COWL LIP
I /I 11I I
I II I
1;1
J 1I 1I 1( 1liPS
P4 I1 MSII~
FIGURE 3.17 : Cowl Pressure Distribution

64
(i) Without Inlet Spilling
Equation 8 is used in calculating the wave pressure drag of the first section:
Where:
Pi - Refers to static pressure, P4, behind first oblique shock of cowl lip as
shown in Figure 3.17
d~l - Length of first element.
tJ. = External angle of cowl lip at first section.
For a free stream Mach number of 2,0 the static pressure and Mach number behind the
second oblique shock of the compression ramp is obtained from Table 3.1 where P2 =
244,91 kPa and M2 = 1,39 respectively.
An oblique shock wave is formed at the leading edge of the cowl lip and a Prandtl - Meyer
expansion fan at the top corner as shown in Figure 3.18.
From Table C.12 (Zucrow & Hoffinan 1976:744) for M2 = 1,39, 0 = 5° and y = 1,4 the
shock wave angle is found to be E = 53,65·. Equation 7.99 (Zucrow & Hoffman
1976:368) yields the value for:
Where M; refers to the n011llll1 velocity component in front of the oblique shock wave.
M; = 1,39 sin (53,65°)= 1,12
From Table C.Il (ZUCfOW & Hoffman 1976:736) for M; = 1,12 and y = 1,4 the
values of M4' = 0,89656 and PiP2 = 1,2968 are obtained resulting in:
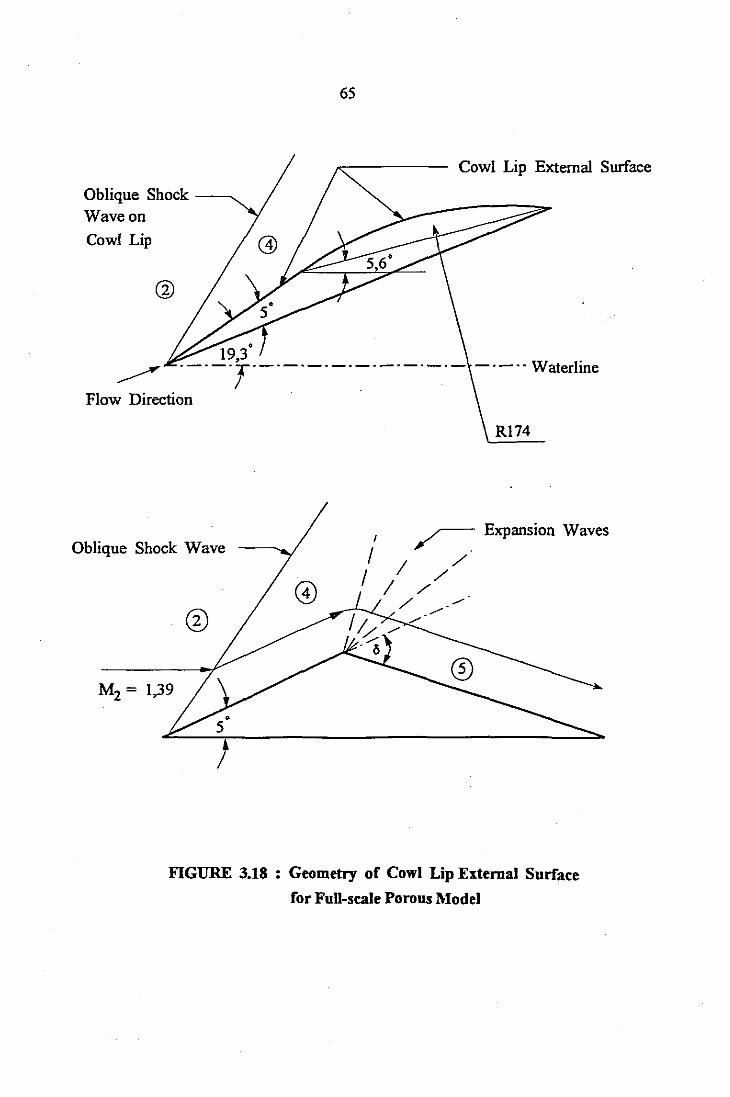
65
Oblique Shock -----....Wave on
Cowl Lip
~
Flow Direction
Oblique Shock Wave
M2 = 1,39
Cowl Lip External Surface
~ Expansion Waves
/ / /././ /.
/. ../..//// ./ ./
./. a
FIGURE 3.18 : Geometry of Cowl Lip External Surface
for Full-scale Porous Model

66
P4 - 1,2968 x 244,91
- 317,60 kPa
Where M 4' refers to the normal velocity component behind the oblique shock wave.
Equation 7.100 (Zucrow & Hoffman 1976:368) yields the value for:
M4 = M4fsin (E - 0)= O,89656/sin (53,65° - 5°)= 1,19
The flow deflection angle, 0, for the Prandtl-Meyer expansion fan, as shown in Figure
3.18, is a 13,7· convex corner. From Table C.B (Zucrow & Hoffman 1976:749) for
M.t = 1,19 and y = 1,4 the Prandtl-Meyer angle v4 = 3,32°.
- v4 + 0
- 332" + 137°, ,_ 17,02°
Table C.13 (Zucrow & Hoffman 1976:749) yields the value for the Mach number behind
the expansion fan, Ms = 1,67, for values of Vs = 17,02° and y = 1,4.
From Table C.6 (Zucrow & Hoffman 1976:709) for M 4 = 1,19 and Ms = 1,67 the
corresponding values of PPo< = 0,41778 and P/Pos = 0,21195 are found.
Where Po denotes stagnation pressure and Ps = static pressure behind the expansion fan.
Since the expansion is taken to be isentropic Po< = Pos and:
= .=..3:..:.172::,6~O--,(::..!.O,.:.:21~1:..:.95~)
0,41778
= 161,13 kPa

67
The flow properties of air for atmospheric conditions at sea level are shown in Table 3.4
for different Mach numbers. The drag on the first inclined section can now be calculated
from equation 8 :
D 1 = (P4 - P~) dQ1 sin TJo
TABLE 3.4 : Air Flow Properties in Front of Cowl Lip for Abnospheric Conditionsat Sea Level
M=1,8 M=2,O M=2,2 M=2,3 M=2,4
M, 1,20 1,39 1,57 1,65 1,76
P, 236,28 kPa 244,91 kPa 258,46 kPa 267,86 kPa 267,55 kPa
M 0,84 (I) 1,19 1,40 1,47 1,58
p, 357,56kPa 317,60 kPa 328,45 kPa 347,36 kPa 346,96 kPa
M. 0,84 1,67 1,87 1,94 2,06
p, 357,56 kPa(7} 161,13 kPa 163,38kPa 171,30kPa 166,66 kPa
R. 42 x 10'/m 46x lOO/m 51 x 10'/m 53 x 10'/m 56 x 10'/m
4 0,0040 0,0039 0,0038 0,0038 0,0037
Note 1: Fora flow deflection angle ofa= 5°, the oblique shock wave becomes detached from the cowl lip and
acts like a normal shock wave (Zncrow & Hoffinann 1976:364).
Note 2: 1be flow is subsonic behind the detached shock and is turned through a smooth convex corner "ithout
any losses or change in pressure.
Where:
P4 - 317,60 kPa
P~ - 101,33 kPa
f l - 14,9 mm (Ref. Table A,1 Appendix A)
TJo - 19,3°
Substituting the relevant values in the above equation yields the value for wave pressure
drag per unit width:
D1 = (317,60 - 101,33) 14,9 sin 19,3°
= (216,27 kPa) 4,92 mm per unit width.
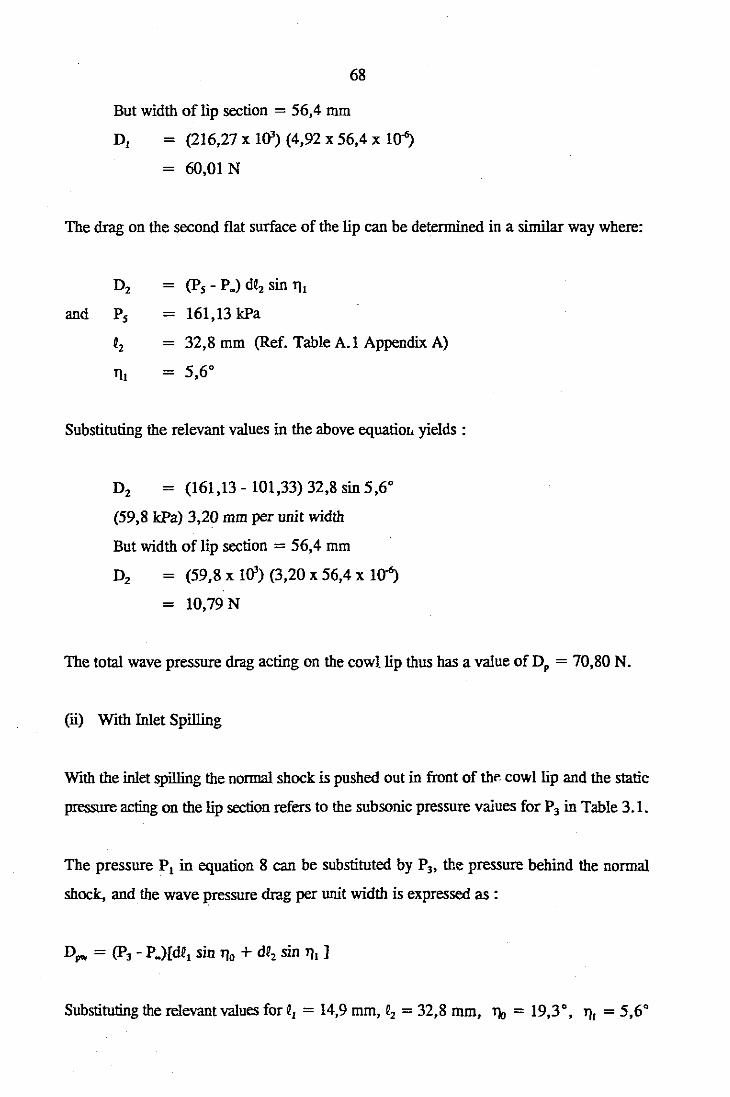
68
But width of lip section = 56,4 mm
D, - (216,27 x 1(3) (4,92 x 56,4 x 1O~
- 60,01 N
The drag on the second flat surface of the lip can be determined in a similar way where:
Dz - (Ps - p.) dez sin 111
and Ps - 161,13 kPa
ez - 32,8 mm (Ref. Table A.1 Appendix A)
111 - 5,60
Substituting the relevant values in the above equatiOl' yields:
Dz = (161,13 - 101,33) 32,8 sin 5,60
(59,8 kPa) 3,20 mm per unit width
But width of lip section = 56,4 mm
Dz - (59,8 x 1(3) (3,20 x 56,4 x 1~
- 10,79 N
The total wave pressure drag acting on the cowl. lip thus has a value of Dp = 70,80 N.
(ii) With Inlet Spilling
With the inlet spilling the normal shock is pushed out in front of thP, cowl lip and the static
pressure acting on the lip section refers to the subsonic pressure values for P3 in Table 3.1.
The pressure PI in equation 8 can be substituted by P3, the pressure behind the normal
shock, and the wave pressure drag per unit width is expressed as :
Substituting the relevant values for e, = 14,9 mm, ez = 32,8 mm, TJo = 19,30, Tlr = 5,60
69
and PJ = 511,23 kPa at a free stream Mach number = 2,0 yields:
Dpw = (511,23 - 101,33) 1<Y [14,9 sin 19,3' + 32,8 sin 5,6']
= (409,90 kPa) 8,12 mm per unit width
Width of lip section =56,4 mm
Dp = (409,90 x 1<Y)(8,12 x 56,4)10-0
= 187,72 N
In a similar manner the wave pressure drag can be calculated for different flight Mach
numbers and the predicted results are shown in Table 3.5.
3.3.3.2 Skin Friction Drag
The Reynolds number for sea level conditions (height = 0) at M = 2,0 is. found from Table
3.1 where Re = 46 x l<f/m. The Reyno1ds number, based on a body length dimension,
is determined for a cowl lip with a length of 0,047 m resulting in:
- 0,047 (46,7 x IQ'\)
- 2,16 X 10⁶
Assuming compressible flow in the turbulent region, the skin friction drag coefficient can
be determined from equation 21:
er - 0,427/(log R, - 0,407)2.64
- O,427/(log 2,16 x 1<f - 0,407)2.64
- 0,0039
From the dimensions shown in Figure 3.19 the wetted area of the cowl lip can be calculated
for a lip section with internal width = 53,3 mm and external width = 56,4 mm:

70
M-00
R 172,4'---
46,7
FIGURE 3.19 : Side View of Cowl Lip for
Full-scale Porous Model

71
Swet.in - 53,3 x 46,7 x 10-6 m2
- 2489 x 10-6 m2
Swet.ex - 56,4 (14,9 + 32,8) 10-"
- 2690 x 10-6 m2
Swet - (2489 + 2690) 10-6 m2
- 5179 x 10-6 m2
The skin friction drag, based on free stream dynamic pressure, can now be calculated from
equation 20 where q~ = 283,72 kPa for M = 2,0 (RefTable 3.1).
Df - Cf SW" q~
- 0,0039 x 5179 x 10-6 x 283,72 x 1<r- 5,73 N
The value is not very significant when compared to a value of 70,80 N for the wave
pressure drag. The predicted values for the different drag components acting on the cowl
lip at different Mach numbers are depicted in Table 3.5 and Figure 3.20.
TABLE 3.5 Predicted Cowl Drag at Different Operating Modes
WITHOUT SPILLAGE (CRITICAL)
1\>1- I 8 1\>1-20 1\>1-22 1\1 - 2.3 1\1 - 2.4
m. 0,82 0,89 0,95 0,99 1,0
D, 71,10 N 60,01 N 63,02 N 68,27 N 68,16 N
D, 46,24N 10,79 N 11,20 N 12,63 N 11,79 N
D 117,34 N" 70,80N 74,22 N 80,90N 79,95 N
D, 4,76 N" 5,73 N 6,76N 7,38N 7,83 N
D,- 122,10 N" 75,65N 80,98 N 88,28 N 87,78N
WITH SPILLAGE (Subaitical)
m. 0,49 to 0,78 0,53100,84 0,57 to 0,90 0,59 to 0,94 0,60 10 0,95
D 117,34 N" 187,72 N 274,25 N 322,79 N 375,98 N
D, 4,76 N" 5,73 N 6,76 N 7,38N 7,83 N
D,. 122,10 N· 193,45 N 281,01 N 330,17 N 383,81 N
See note 2 below Table 3.4.

/' WilkS.",
./
.//'
k'"i W'-'l~
500
450
400
350
53001250~200
" 150
100
50
o1.4 I.£; 1.8
72
2 22 2.4 2.£; 2.8
_Number
FIGUIlE 3.20 : Predicted CowlDrag for FuJl.scale PorousModel
3.3.4 Bleed Drag
The melhod applied in this particular case is to bleed low energy boundary layer air from
lhe compression surface through a throat bleeding system wilh lhe flow in lhe exit opening
of lhe bleed duct choked.
The internal drag C'A!usffl by bleeding off boundary layer air is represented by equation 16:
Where:
Aa. - Bleed duct exit area
AJj,. - Free streamtube area captured by lhe bleed duct per unit widlh
q_ - Free stream dynamic pressure

73
lIe. - Dynamic pressure at bleed duct exit
p.. - Static pressure at duct exit
Width of bleed entry opening = 90 mm
From wind-tunnel test results of an inlet model with similar geometry (Stockenstrom 1990),
a bleed flow ratio of 8 % based on the mass flow entering through the streamtube area A..,
was measured. The value for Afj,o can now be determined for a free stream.
Mach number = 2,0 where:
A% Bleed = B· X 100
p.
and bleed mass flow is expressed as a percentage of captured mass flow.
A.. = 47,36 mm (Ref. Table 3.1), resulting in
AB- - A.. x 8/100
- 47,36 x 0,08
- 3,79 mm per unit width.
The bleed duet exit area is obtained from Table A.1 (Appendix A) where:
Aa = 268 mm x 1~ m2 for the exit flow to be choked.
The stagnation pressure recovery measured at the bleed duet exit during wind-tunnel testing
is typically 33 % (Stockenstrom 1990). From Table 3.1 for M = 2,0 the free stream
stagnation pressure is obtained giving P~ = 792,85 kPa.
Taking the above-mentioned pressure recovery into account the stagnation pressure at the
bleed duet exit is determined.
P0eJ< - 792,85 x 0,33
- 261,64 kPa

14
From the isentropic relations for y = 1,4 the static pressure at the bleed duct exit can be
determined (ZUCfOW & Hoffman 1916) where M = 1,0:
p = p If1 + (y - 1) M2]r ~ 1
er """ / t 2
= 138,22 kPa
The free stream dynamic pressure at M = 2,0 can be derived from equation 1:13 (pope
& Goin 1965) where:
and P = static pressure
14q = -'- x 10133 x 22
• 2 '
= 283,72 kPa
In a similar way the dynamic pressure at the bleed duct exit is determined where M =
1,0:
14q = -'- x 13822 x 12
er 2 '= 96,15 kPa
Substituting all the relevant values into equation 16, where the width of the bleed
streamtube area = 53,3 mm, yields:
Du>< = 2 x 283,12 x IcY (3,19 x 53,3 x 1<r)-
[(138,22 - 101,33)lcY + 2 (96,75 x 1()l)] 268 x 10-6
= 52,89 N
The above equation, as derived from equation 14, takes account of the pressure losses as
well as the change in momentum caused by the friction on the internal wetted surfaces of
the boundary layer bleed duct.
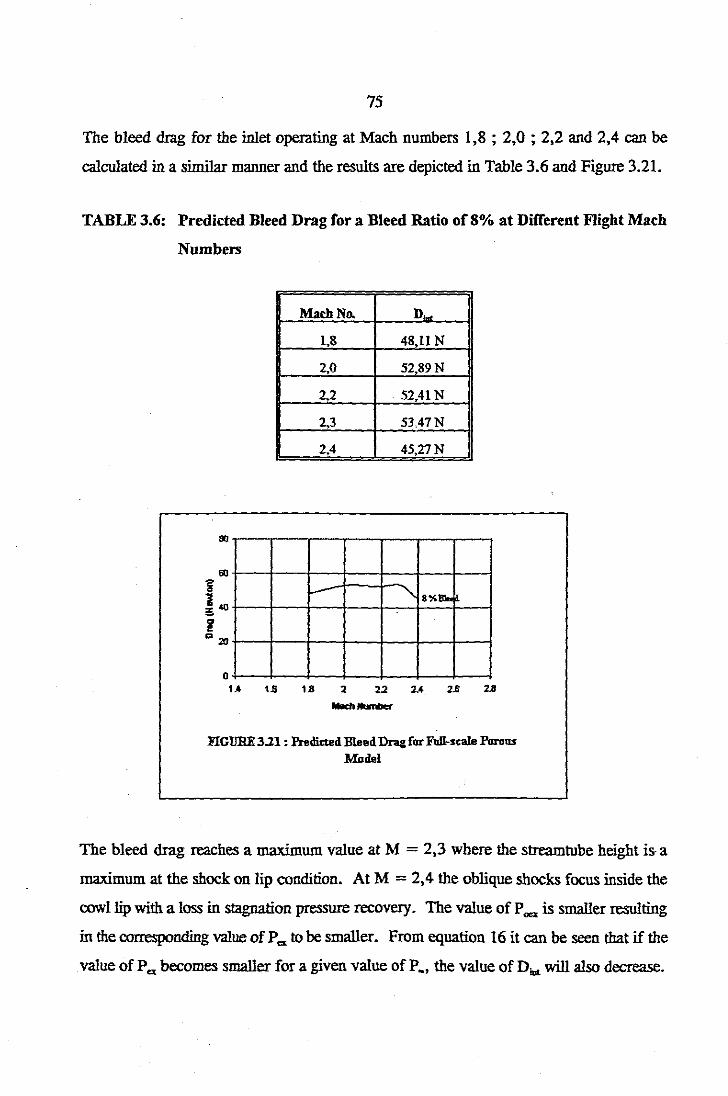
75
The bleed drag for the inlet operating at Mach numbers 1,8 ; 2,0 ; 2,2 and 2,4 can be
calculated in a similar manner and the results are depicted in Table 3.6 and Figure 3.21.
TABLE 3.6: Predicted Bleed Drag for a Bleed Ratio of 8% at Different Flight Mach
Numbers
Mach No. D~
1,8 48,11 N
2,0 52,89N
2,2 52,41 N
2,3 5H7N
2,4 45,27N
I--- " 8%1l!o
o1.4 1.6 1B 2 22 2.4 2.6 2.8--
FIGllRE 3.21 : Predicted BleedDra& for FuR-scale PunmsModel
The bleed drag reaches a maximum value at M = 2,3 where the streamtube height is- a
maximum at the shock on lip condition. At M = 2,4 the oblique shocks focus inside the
cowl lip with a loss in stagnation pressure recovery. The value of p.... is smaller resulting
in the corresponding value of P.. 1O be smaller. From equation 16 it can be seen that if the
value of p.. becomes smaller for a given value of P_, the value of Du will also decrease.

76
3.3.5 Diverter Drag
3.3.5.1 Skin Friction Drag
The Reynolds number from Table 3.1 at M = 2,0 at sea level (height = 0) is found to be
Re = 46 x 106/m. The Reynolds number based on a body length dimension is found for
a diverter length 0,564 m resulting in :
R, - 0,564 (46 x 101
= 26x 106
Assuming tuIbulent compressible flow the skin friction drag coefficient can be determined
from equation 21:
er - 0,4271 (log R,- 0,401)2.64
- 0,4271 (log 26 x 106- 0,407)2.64
- 0,0025
The diverter height, h, is taken as:
h - 0,1 x missile diameter (Laruelle 1988)
- 0,1 x 180 mm (typical missile calibre = 180 mm)
- 18 mm.
From the plan view of the diverter, shown in Figure 3.22, the wetted area of the wedge can
be calculated from:
Sw.. = 2[(28,21sin 18,75°) x l4,4J l~ + (481 x 14,4)1~
= 9453 x 1~ m2
The skin friction drag of the diverter wedge can now be determined from equation 20 where
q_ = 283,72 kPa for M = 2,0:
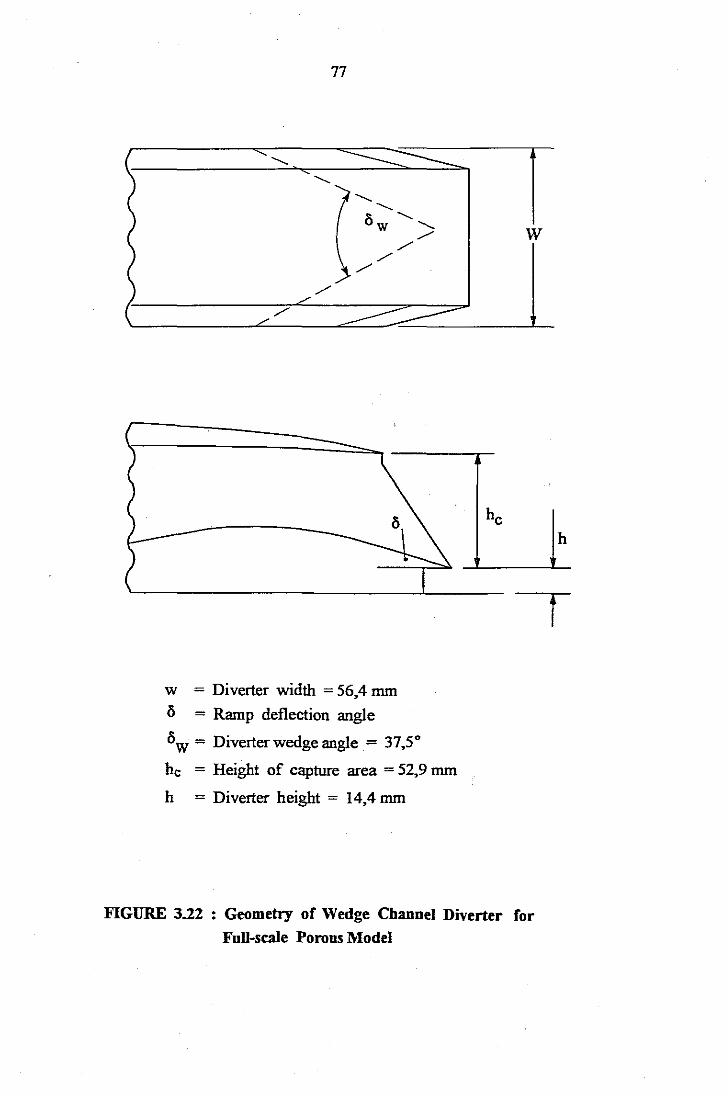
77
'- ~ r'-'-
'-
°w '-'-/' W
/'/'
/'
/'
/'
w = Diverter width = 56,4 mm° = Ramp deflection angle
0w = Diverterwedge angle = 37,5°
he = Height of capture area = 52,9 mm
h = Diverter height = 14,4 mm
h
FIGURE 3.22 : Geometry of Wedge Channel Diverter for
FuU-scale Porous Model

78
Df - Cf Swot q.
- 0,0025 x 9453 x Ilr x 283,72 x lcr
- 6,71 N
3.3.5.2 Wave Pressure Drag
The wave pressure drag, which is based on the projected frontal area of the diverter, has
a much greater value than the skin friction drag. A value for the drag coefficient, Cd =
0,20, for a wedge diverter with a wedge angle of 37,5° operating at M = 2,0 is obtained
from Figure 3.11. The Reynolds numbers covered by this curve, Re = 1,6 to 16,4 x Hr/m
are just below the range for flight conditions, where Re = 46 x 106/m.
The drag can now be calculated from equation 22:
Dp = Cd q. Sf
Where:
and q.
- 14,4 x 56,4 x Ilr m2 (Ref. Figure 3.22)
- 812,16 x Ilr m2
- 283,72 kPa
Substituting the relevant values in the above equation yields the value for:
Dp - 0,20 x 283,72 x Icr x 812,16 x Ilr
- 46,09 N
The total drag encountered by the diverter is determined as follows:
Ddiv = 6,71 + 46,09
= 52,80N
The diverterdrag for the inlet operating at M = 1,8; 2,2; 2,3 and 2,4 can be calculated in
a similar manner and the results are depicted in Table 3.7 and Figure 3.23.

79
TABLE 3.7: Predicted Diverter Drag at Different Flight Mach Numbers
Mach No. D...
1,8 42,76N
2,0 52,80N
2,2 63,87N
2,3 69,82N
2,4 76,02N
,00
so v~
.-/
20
o1.4 1.6 1B 2 22-- 24 2.6 2.6
FIGURE 3.23 : Pcedicted DiYerterDngr....Full-scalel'OrutlS Model
3.4 DISCUSSION OF CALCULATIONS
The results of the theoretical drag analysis for a specific operating mode, Le. below the
design Mach number where M = 2,0 and M = 1,8, each with a bleed flow rate of8 %,
are depicted in Tables 3.8 and 3.9 respectively. Results for the inlet operating at the design
Mach number of M = 2,2 is depicted in Table 3.10. The inlet operating at M = 2,3, just
above the design Mach number, the oblique shocks focus on the cowl lip, and the results
for this operating mode are depicted in Table 3.11. At a flight Mach number of M = 2,4
the oblique shocks fall inside the cowl lip and no pre-entry drag is encountered. These
results are depicted in Table 3.12.

80
TABLE 3.8: Theoretical Drag Analysis for Inlet Operating Critically and Sub
critically at M = 2,0 with a Bleed Flow Rate of 8 %
mR PR Spill Cowl Cowl Bleed D... C...critical subcritical
0,89 38,13 N 0 75,65N - 52,89N 166,67N 0,17
0,84 - 143,86 N - 193,45 N 52,89N 390,20N 0,40
0,80 - 197,82 N - 193,45 N 52,89N 444,16N 0,45
0,71 - 301,16 N - 193,45 N 52,89N 547,50 N 0,56
0,62 - 399,48 N - 193,45 N 52,89N 645,82 N 0,66
0,53 - 502,82N - 193,45 N 52,89N 749,16 N 0,77
TABLE 3.9: Theoretical Drag Analysis for Inlet Operating Critically and Subcritically
at M = 1,8 with a Bleed Flow Rate of 8 %
mR PR Spill Cowl Cowl Bleed D... C"""critical subcritical
0,82 57,98N 0 122,10 N * - 48,1I N 228)9N 0,29
0,78 - 102,22 N · 122,10 N 48,1I N 272,43 N 0,34
0,74 - 129,39 N · 122,lO N 48,1I N 299,60 N 0,38
0,66 - 190,85 N - 122,10 N 48,1I N 361,06 N 0,46
0,58 - 248,76 N - 122,10 N 48,1l N 418,97 N 0,53
0,49 - 310,08 N - 122,10 N 48,1I N 480,29N 0,61
• See Note I ofTable 3.4
TABLE 3.10: Theoretical Drag Analysis for Inlet Operating Critirally and Subcritically
at M = 2,2 with a Bleed Flow Rate of 8 %
mR PR Spill Cowl Cowl Bleed D", C"""critical subcritical
0,95 19,72 N 0 80,98N - 52,41 N 153)1 N 0,13
0,90 - 143,38 N - 281,01 N 52,41 N 476,80N 0,40
0,85 - 227,97N · 281,01 N 52,41 N 561)9 N 0,48
0,76 - 384,36 N · 281,01 N 52,41 N 717,78 N 0,61
0,66 - 547,47N - 281,01 N 52,41 N 880,89N 0,75
0,57 - 703,86N - 281,01 N 52,41 N 1037,28 N 0,88
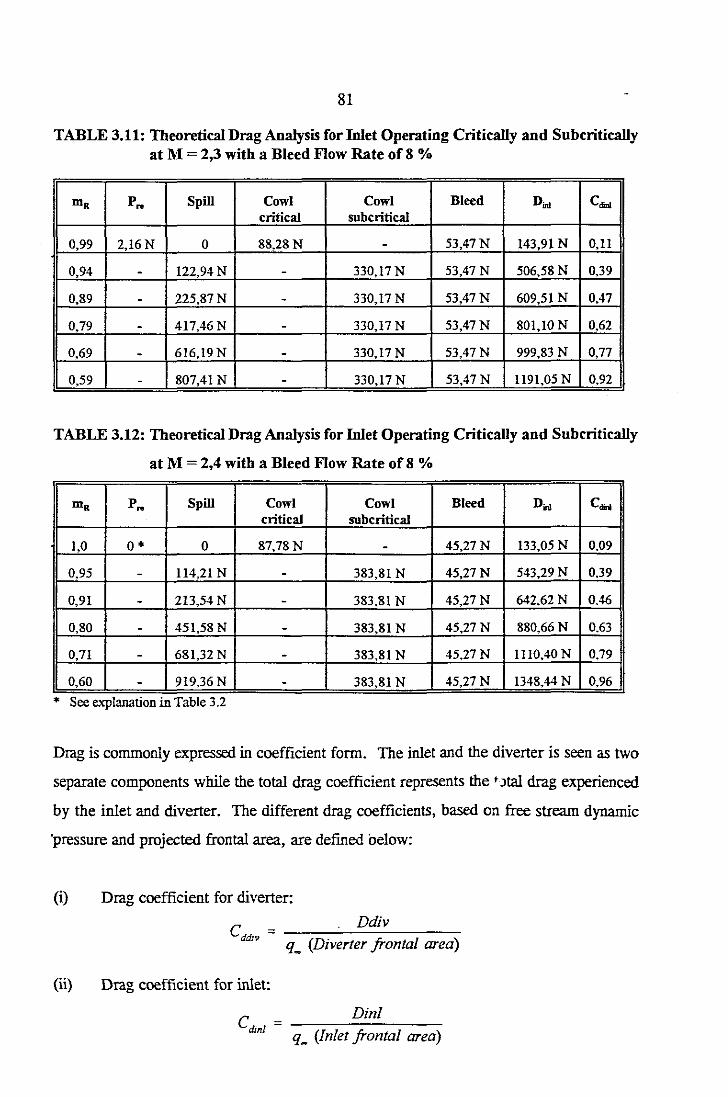
81
TABLE 3.11: Theoretical Drag Analysis for Inlet Operating Critically and Subcriticallyat M = 2,3 with a Bleed Flow Rate of 8 %
mg Pn Spill Cowl Cowl Bleed D"" C....critical subcritical
0,99 2,16N 0 88,28N - 53,47N 143,91 N 0,11
0,94 - 122,94 N - 330,17N 53,47N 506,58N 0,39
0,89 - 225,87N - 330,17 N 53,47N 609.51 N 0.47
0,79 - 417,46N - 330,17 N 53,47N 801,10 N 0,62
0,69 - 616,19N - 330,17 N 53,47N 999,83 N 0,77
0,59 - 807,41 N - 330,17 N 53,47N 1191,05 N 0,92
TABLE 3.12: Theoretical Drag Analysis for Inlet Operating Critically and Subcritically
at M = 2,4 with a Bleed Flow Rate of 8 %
mg Pn Spill Cowl Cowl Bleed D"" C....critical subcritical
1,0 0* 0 87,78 N - 45,27N 133,05 N 0,09
0,95 - 114,21 N - 383,81 N 45,27 N 543,29N 0,39
0,91 - 213,54 N - 383,81 N 45,27N 642,62 N 0,46
0,80 - 451,58 N - 383,81 N 45,27 N 880,66 N 0,63
0,71 - 681,32 N - 383,81 N 45,27 N 1110,40 N 0,79
0,60 - 919,36 N - 383,81 N 45,27N 1348,44 N 0,96
* See explanauon ill Table 3.2
Drag is commonly expressed in coefficient form. The inlet and the diverter is seen as two
separate components while the total drag coefficient represents the 'Jtal drag experienced
by the inlet and diverter. The different drag coefficients, based on free stream dynamic
'pressure and projected frontal area, are defined below:
(i) Drag coefficient for diverter.
C.= . Ddivdillv q_ (Diverter frontal area)
(ii) Drag coefficient for inlet:
DinlCd,"I = -.....,.,.--=-.....,.,.---
q_ (Inlet frontal area)
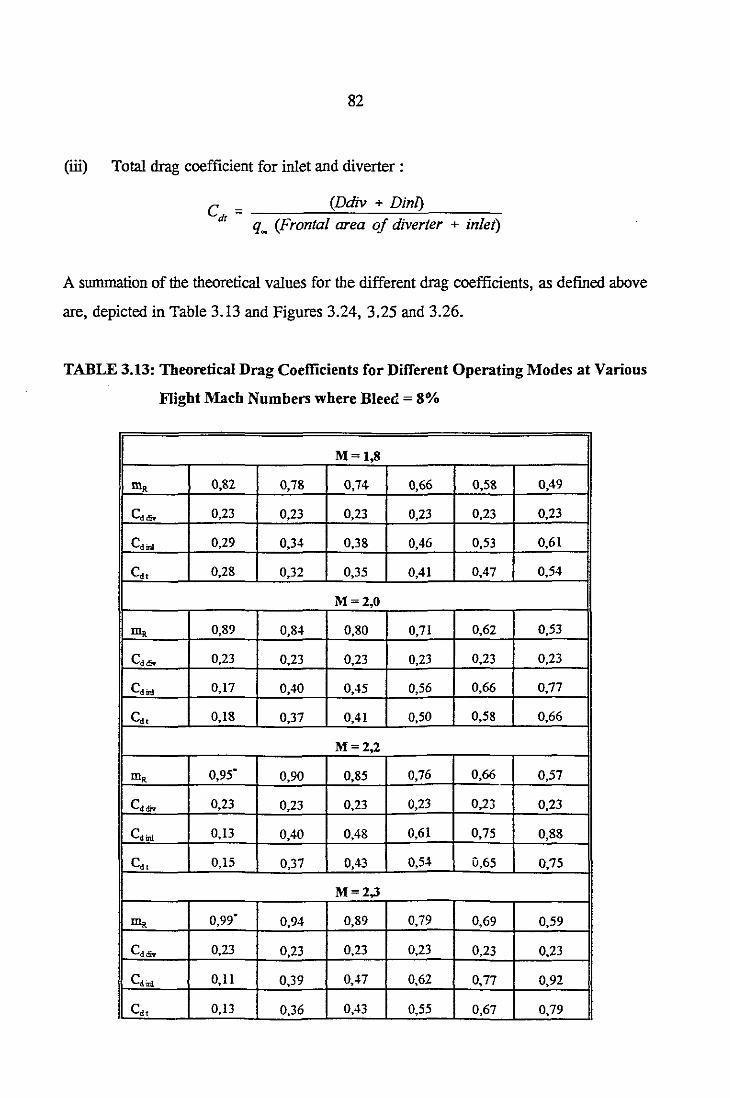
82
(ill) Total drag coefficient for inlet and diverter :
c = (Ddiv + Din!)dt q~ (Frontal area of diverter + inlet)
A summation of the theoretical values for the different drag coefficients, as defined above
are, depicted in Table 3.13 and Figures 3.24,3.25 and 3.26.
TABLE 3.13: Theoretical Drag Coefficients for Different Operating Modes at Various
Flight Mach Numbers where Bleerl = 8%
M=l,8
m. 0,82 0,78 0,74 0,66 0,58 0,49
Cd... 0,23 0,23 0,23 0,23 0,23 0,23
Cd in! 0,29 0,34 0,38 0,46 0,53 0.61
COt 0,28 0,32 0,35 0,41 0,47 0,54
M=2,O
rn. 0,89 0,84 0,80 0,71 0,62 0,53
Cd... 0,23 0,23 0,23 0,23 0,23 0,23
Cd in! 0,17 0,40 0,45 0,56 0,66 0,77
COt 0,18 0,37 0,41 0,50 0,58 0,66
M=2,2
rn. 0,95' 0,90 0,85 0,76 0,66 0,57
Cd... 0,23 0,23 0,23 0,23 0,23 0,23
Cd in! 0,13 0,40 0,4& 0,61 0,75 0,88
Cd' 0,15 0,37 0,43 0,54 0,65 0,75
M=2,J
m. 0,99' 0,94 0,89 0,79 0,69 0,59
Cd... 0,23 0,23 0,23 0,23 0,23 0,23
Cd"" 0,11 0,39 0,47 0,62 0,77 0,92
COt 0,13 0.36 0,43 0,55 0,67 0,79
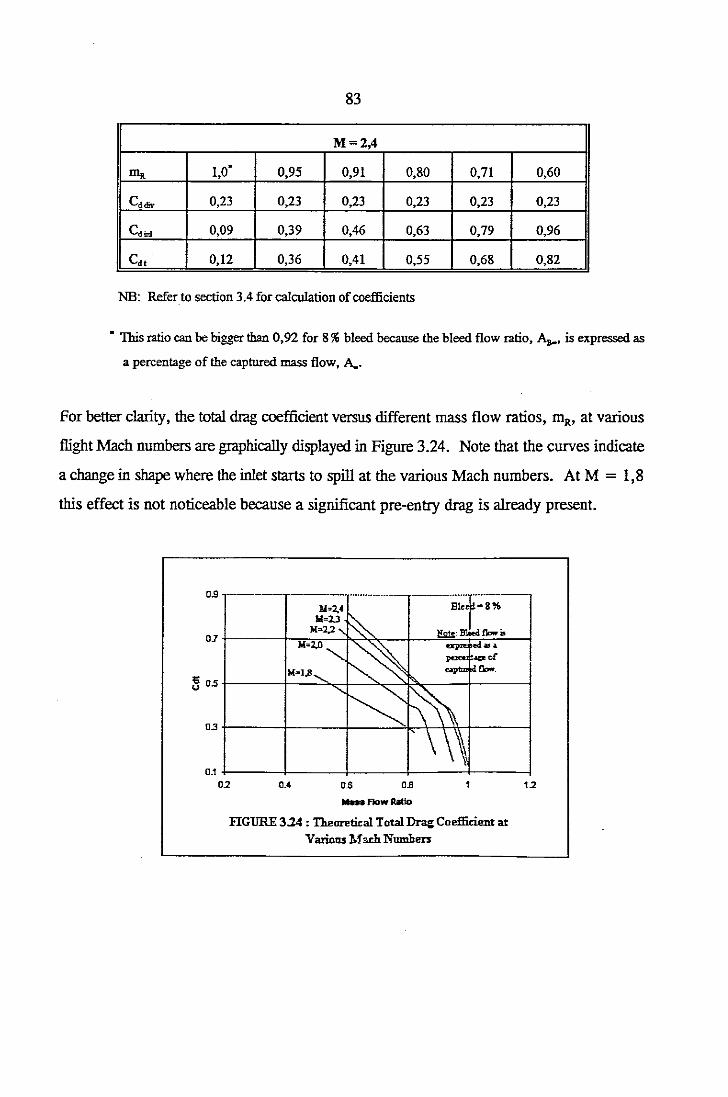
83
M=2,4
IlIa 1,0· 0,95 0,91 0,80 0,71 0,60
Cd... 0,23 0,23 0,23 0,23 0,23 0,23
Cd.. 0,09 0,39 0,46 0,63 0,79 0,96
Cd. 0,12 0,36 0,41 0,55 0,68 0,82
NB: Refer to section 3.4 for calculation ofcoefficients
• This ratio can be bigger than 0,92 for 8%bleed because the bleed flow ratio, A.., is expressed as
a percentage of the captured mass flow, A..
For better clarity, the total drag coefficient versus different mass flow ratios, mR, at various
flight Mach numbers are graphically displayed in Figure 3.24. Note that the curves indicate
a change in shape where the inlet starts to spill at the various Mach numbers. At M = 1,8
this effect is not noticeable because a significant pre-entry drag is already present.
0.9 ---
W,.I.8~ 05 -l-----1--:....:::,""--+---=::,...,......::>.j;::....---1------J
0.3 -l-----1------+---~.,--l~~-1------J
121OB0.50_40.1 -l---~------J----__l:..----+-----1
02
FIGURE 3.24 : Th.aorotit:al Total~ Coefficient atVarious Mach Numbe...

84
In Figures 3.25 and 3.26 the characteristics of the inlet are displayed when operating
subcritically at a mass flow ratio = 0,8 and critically at maximum mass flow rate
respectively. It is clear from these graphs that the slope of each curve is opposite to each
other. With reference to Figure 3.25, it is shown that there is an increase in the value of
Cdt with an increase in the Mach number. This is a result of a lower value for the Mach
number behind the normal shock with an increase in free stream Mach number. This lower
Mach number behind the normal shock, with the inlet spilling, causes an increase in static
pressure which acts on the cowl lip to cause a higher cowl drag.
0.9
0.7
1i 05
0.3
~- --
r.lo' pinmc.m .... no. Rmo_Q,l
~
/~
0.11.4 11> 1.8 2 22
......- 2.4 21> 2.8
FIGURE 3.25 : mect ofMach Nomher at SuhcriticalOperation
With reference to Figure 3.26 it is clear that there is a decrease in tte value of Cdt with an
increase in the Mach number at full flow conditions, Le. no spillage. This is as a result of
a reduction in pre-entry drag because at higher Mach numbers the oblique shocks are
focussed closer to the cowl lip until a situation occurs at M = 2,3 where the oblique shocks
are focussed on the cowl lip and the pre-entry drag becomes insignificant.

85
0.5
0.4
0.3
02
0.1
No iIIi><.t ~ _Id ,n..
~ ---r--o
1.4 1.6 1B 2 2.2......-.-2.4 2.6 2.8
3.5 SUMMARY
FIGURE 3.26 : Effect .fMach Number at CriticalOperation
From the values obtained for the drag calculations (Ref. Tables 3.8 to 3.12) it is clear that
the cowl lip is a major drag contributing component of a two-dimensional external
compression supersonic inlet. This high cowl wave pressure drag is a result of the big
turning angle required to turn the incoming flow from the compression surface into the axial
airection of the inlet duct.
It is essential to establish the drag as accurately as possible in order to optimise the inlet
design with as little as possible drag working unfavourably on th~ system performance.
From a systems point of view the design of the propulsion system cannot be done
effectively if the magnitude of the drag peru:Ity is not known. A lack of information can
lead to a complete mission failure, especially in an application where constant fuel flow rate
is used.
Wind-tunnel tests are recommended to establish the value of the total drag for a specific
geometric shape as accurately as possible, to optimize the shape of the inlet and to correlate
the validity of the results obtained by means of theoretical calculations.

CHAPTER
4
WIND-TUNNEL TESTS
4.1 INTRODUCTION
A very comprehensive experimental test program was required to verifY the predicted drag
figures discussed in section 3.4. It was further of crucial importance to set up the test matrix
in such a way that it satisfies all the requirements in terms ofmodel geometry, Mach numbers,
Reynolds numbers and modes ofoperation.
The model selected was a full-scale light flight model, with geometric shape, size and surface
finish representative of an inlet used in an actual flight mission application.
Aerodynamic drag tests were carried out on this full-scale model installed in the test section
of the High Speed Wind-Tunnel (HSWT) ofthe CSIR. The inlet is provided with boundary
layer bleed holes and the geometry ofthis "full-scale porous model" is fully described in section
4.2.2. The objective of these tests was to provide data, from which the aerodynamic drag
coefficient at different flight conditions and various operating modes, could be established for
a two-dimensional external compression inlet with fixed geometry.
It is further shown in section 4.4.2 how this inlet configuration is characterised in terms of drag
coefficient versus mass flow ratio at different test Mach numbers, i.e. at design point, at shock
on the lip position, below and above the design point. The mass flow ratios spanned critical,
subcritical and supercritical flow regimes. The measurement of the drag of a supersonic inlet
is a complex operation where model geometric layout and method ofinstallation play a very
important role. The reason for using an isolated inlet configuration (without fuselage) is to
keep the experimental set-up simple and to eliminate as many external effects as possible. The
emphasis is on a high level ofdata integrity and a model with realistic dimensions from which
drag forces of measurable magnitude can be obtained. This isolated inlet configuration, with

87
a blockage of the order of 2, I%, falls within the maximum size specified in Appendix B for
model testing in a high speed wind-tunnel.
Shock patterns for different flow regimes were investigated visually by taking Schlieren
photographs of the inlet operating at different modes and the results for test runs at various
Mach numbers are discussed in section 4.4.3 .
In solving this fluid-flow problem the emphasis was placed on the dimensional analysis
technique or experimental study since it is mentioned by White (1994:33) that: "A properly
planned experiment is very often the best way to study a practical engineering flow problem".
4.2 EXPERIMENTAL EQUIPMENT
4.2.1 Wind-tunnel layout
Wmd-tunnel tests were carried out in the High Speed Wmd-Tunnel (HSWT) ofthe Aerotek
Division of the CSIR in Pretoria. The layout of this tunnel consists of compressed air tanks,
a flow control valve, a settling chamber, a nozzle with sonic throat and adjustable diverging
waIls to obtain the required test r,,1ach number, test section with cross-sectional dimensions of
450 mm x 450 mm and exit duct to atmosphere.
The inlet model was fitted to a purpose made rig, specially made up for inlet testing. This rig
forms part of an inlet cart, shown in Figure 4.1, and when this cart ;s moved into position,
downstream ofthe test section, it becomes an integral part of the wind-tunnel.
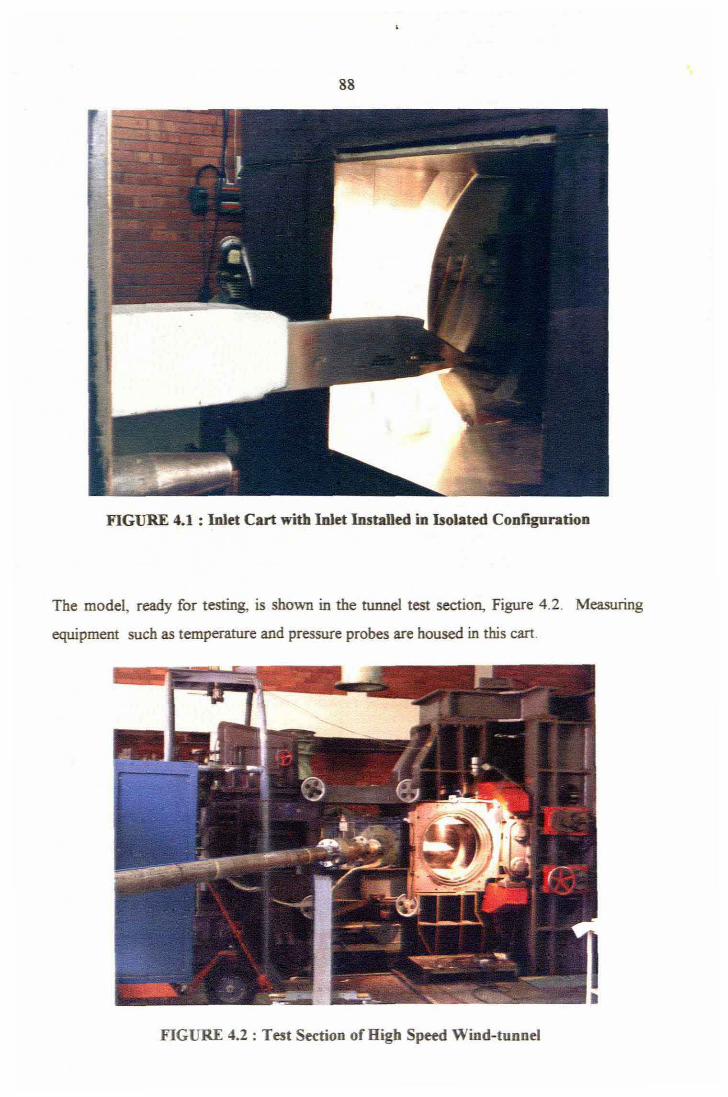
88
FIGURE 4.1 : Inlet Cart with Inlet Installed in Isolated Configuration
The model, ready for testing, is shown in the tunnel test section, Figure 4.2. Measuring
equipment such as temperature and pressure probes are housed in this cart.
FIGURE 4.2 : Test Section ofHigb Speed Wind-tuDnel

89
The exit duct of the model is connected via a fleXIble steel bellows (Figure 4.3) to the mass
flow control and measuring system on the outside of the test section.
FIGURE 4.3: Interface Between Modd and Measuring Station
The exit of the model diffiJser is connected to the bellows on the side of the cart. Moving
downstream from the bellows the system comprises a flow straightener, .. settling pipe, a flange
housing the orifice plate, followed by a further length of settling pipe and finally the mass flow
control plug.
The mass flow control plug, as shown in Figure 4.4, is moved forwards and backwards via a
worm drive which is in turn connected to a stepper motor. The stepper motor is controlled by
a personal computer in the control room to adjust the internal flow of the model for different
operating modes, i.e. critical, subcritical and supercriticaJ operation.
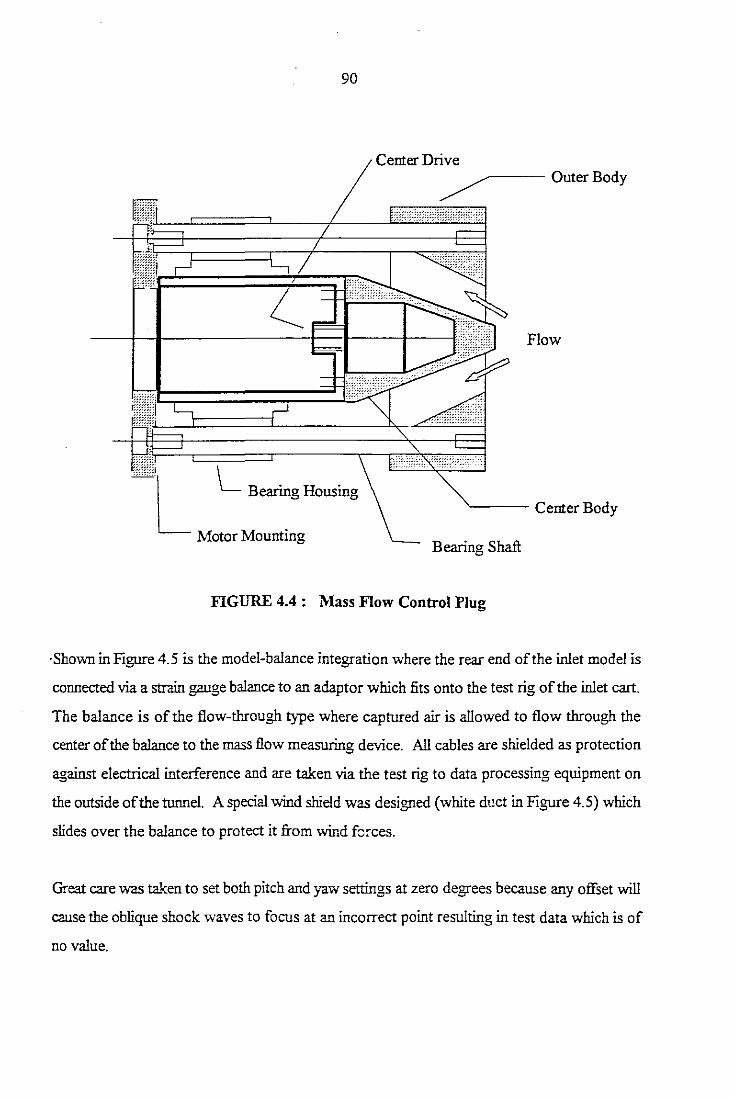
90
Flow
'---- Center Body
Bearing Shaft
Center Drive~OuterBodY
L-e==~-J-~
:mm:, LL Bearing Housing
Motor Mounting
FIGURE 4.4: Mass Flow Control Plug
'Shown in Figure 4.5 is the model-balance integration where the rear end of the inlet model is
connected via a strain gauge balance to an adaptor which fits onto the test rig of the inlet cart.
The balance is of the flow-through type where captured air is allowed to flow through the
center ofthe balance to the mass flow measuring device. All cables are shielded as protection
against electrical interference and are taken via the test rig to data processing equipment on
the outside ofthe tunnel. A special wind shield was designed (white duct in Figure 4.5) which
slides over the balance to protect it from wind forces.
Great care was taken to set both pitch and yaw settings at zero degrees because any offset will
cause the oblique shock waves to focus at an incorrect point resulting in test data which is of
no value.

91
FIGURE 4.5 : Strain Gauge Balance Installation
4.2.2 Inlet Drag Model
The model used during this test program was a full-scale light flight model manufactured from
316 stainless steel. This resulted in a very representative model in terms of geometric
tolerances, component dimensions and surface finishes. The model shown in Figure 4.6 is a
two-dimensional, extemaI compression inlet with double wedges and side plates An important
feature ofthis inlet model is the boundary layer bleed holes located on the compression surface
of the second wedge and on the curved surface ofthe throat section as shown in Figure 4.7
It must be noted that the bleed holes on the second wedge were closed off during the test
program due to excessive bleed mass flow ratios. This boundary layer bleed flow is dumped
to atmosphere through the bleed exit holes in the side plates of the model as shown in
Figure 4.6.

92
••••..,•••••••.,
FIGURE 4.6: Full-scale Porous Model
FIGURE 4.7: Frontal View of Model Showing Bleed Holes

93
The model was also fitted with a diverter or splitter plate, starting at the edge of the first
compression wedge and ending below the first row ofbleed holes on the side of the inlet, as
shown in Figure 4.6. The top section of the inlet duct consists of a cowl which turns the
incoming flow into the axial direction ofthe inlet. The effective internal and external angles
of the cowl lip are 5° and 19,3° respectively. It is very important to take these values,
together with a value of 9° for the angle of the first compression wedge, into consideration
when setting up the inlet model.
Experimental data processing required the following critical model dimensions, shown in
Table 4.1, as input data:
TABLE 4.1: Critical Model Dimensions
Capture height 52,9 mm
Capture width 53,3 mm
Throat height 31,7mm
Total inlet height 61,02 mm
Total inlet width 56,4 mm
Inlet and diverter height 75,42 mm
Total frontal area for calculation of Cd 4253,69 x 10'<;m2
Diverter height 14,4 mm
Diverter v.idth 56.'~mm
Number of exit bleed holes open 32
Note: 16 holes on each side
Size of exit bleed holes e 3,8 mm
All the detailed dimensions of the model are depicted in Table A-I ofAppendix A and were
checked in the metrology laboratory of the Cape Technikon.

95
The axial load oftbis six component (three moment and three force units) strain-gauge balance
is directly proportional to the drag force. Strain caused by the axial load on the deflection
beams was detected by strain-gauges glued onto the surfaces ofthese beams. Strain-gauges,
connected in a Wheatstone bridge configuration, converted strain into electrical signals which
were amplified and supplied to a computer in the control room ofthe tunnel.
The design of the balance was based on a tunnel stagnation pressure of 363 kPa, a typical
pressure for testing over this Mach number range. The following values for expected axial and
normal forces were determined at different inlet operating modes. The values shown in Tab~es
4.2 and 4.3 are for the inlet operating with and without bow shock respectively.
Table 4.2: Axial and Normal force with bow shock
MACH No. AXIAL FORCE NORMAL FORCE(Newton) (Newton)
1,8 568 1281
2,0 554 1250
2,2 523 U80
2,3 499 U26
2,4 478 1079
Table 4.3: Axial force without bow shock
Mach No. AXIAL FORCE (NEWTON)
Min (No Soillal!:e) Mu (40% Spillaee)
1,8 170 328
2,0 99 362
2,2 73 367
2,3 59 360
2,4 52 352
Note: No side force component is expected at yaw and pitch angels of zero degrees.
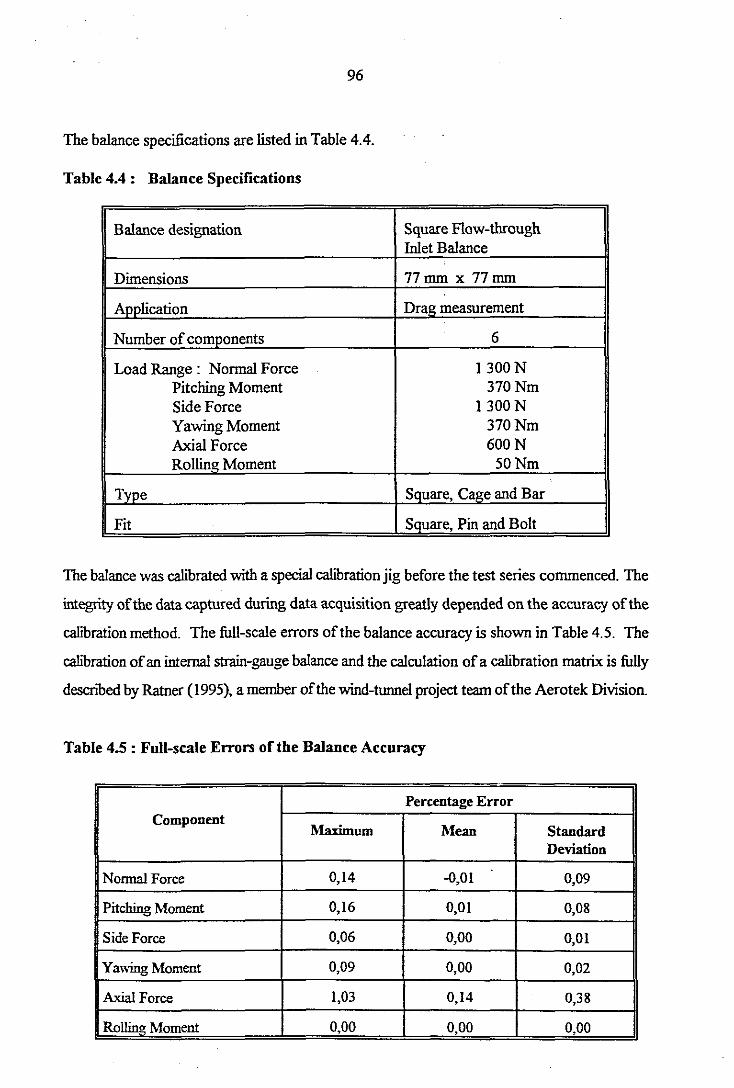
96
The balance specifications are listed in Table 4.4.
Table 4.4: Balance Specifications
Balance designation Square Flow-throughInlet Balance
Dimensions 77 mm x 77mm
Application Drag measurement
Number of components 6
Load Range: Normal Force 1300NPitching Moment 370NmSide Force 1300NYawing Moment 370NmAxial Force 600NRolling Moment 50Nm
Type Square, Cage and Bar
Fit Square, Pin and Bolt
The balance was cahbrated with a special cabbration jig before the test series commenced. The
integrity ofthe data captured during data acquisition greatly depended on the accuracy ofthe
calIbration method. The full-scale errors of the balance accuracy is shown in Table 4.5. The
calIbration ofan internal strain-gauge balance and the calculation ofa calibration matrix is fully
descnbed by Ramer (1995), a member ofthe wind-tunnel project team ofthe Aerotek Division.
Table 4.5 : Full-scale Errors of the Balance Accuracy
Percentage ErrorComponent
Maximum Mean StandardDeviation
NonnaI Force 0,14 -0,01 0,09
Pitching Moment 0,16 0,01 0,08
Side Force 0,06 0,00 0,01
Yawing Moment 0,09 0,00 0,02
Axial Force 1,03 0,14 0,38
Rolling Moment 0,00 0,00 0,00
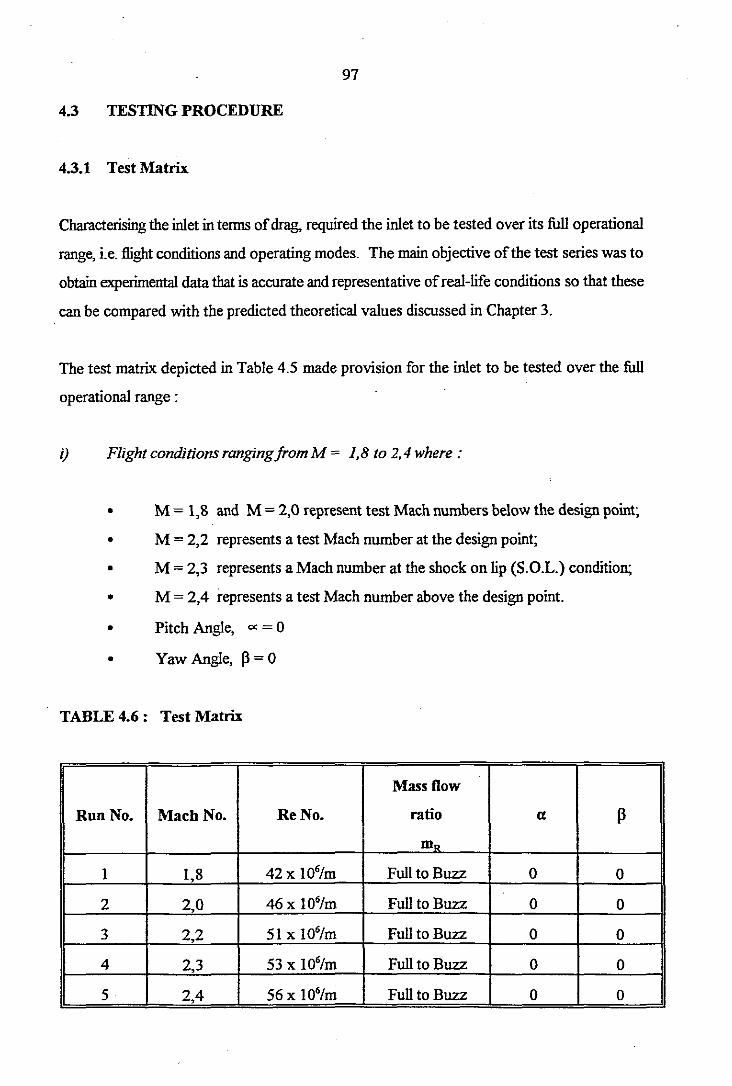
97
4.3 TESTING PROCEDURE
4.3.1 Test Matrix
Characterising the inlet in terms ofdrag, required the inlet to be tested over its full operational
range, i.e. flight conditions and operating modes. The main objective ofthe test series was to
obtain experimental data that is accurate and representative ofreal-life conditions so that these
can be compared with the predicted theoretical values discussed in Chapter 3.
The test matrix depicted in Table 4.5 made provision for the inlet to be tested over the full
operational range :
i) Flight conditions rangingjrom M = 1,8 to 2,4 where:
• M = 1,8 and M =2,0 represent test Mach numbers below the design point;
• M = 2,2 represents a test Mach number at the design point;
• M = 2,3 represents a Mach number at the shock on lip (S.O.L.) condition;
• M = 2,4 represents a test Mach number above the design point.
• Pitch Angle, cc = 0
• Yaw Angle, P= 0
TABLE 4.6: Test Matrix
Mass flow
RuuNo. Mach No. ReNo. ratio a PI
m"
1 1,8 42x 106/m Full to Buzz 0 0
2 2,0 46x 106/m Full to Buzz 0 0
3 2,2 51 x 106/m Full to Buzz 0 0
4 2,3 53 x 106/m Full to Buzz 0 0
5 2,4 56x 106/m Full to Buzz 0 0

98
ii} Operating modes, rangingfromfullflow conditions to buzz (Re! section 2.4) with
critical, subcritical andsuperCTitical modes, were fully investigated
For a ground to air launch at sea level the flight vehicle will experience Reynolds numbers
ranging from Re = 42 x IQ6/m at M.. = 1,8 to Re = 56 x IQ6/m at M.. = 2,4 (Ref. Tables A2
to A6 ofAppendix A). The Reynolds numbers that could be supplied by the high speed wind
tunnel fall within his range.
It is however mentioned by White (1994:425) that for body drag at high Mach numbers, the
Reynolds number effect for spheres and cylinders becomes unimportant above M " 1,0. The
effect of the Reynolds number for airfoils and projectiles is small and it is further stated that
at M > 1,0 the Reynolds number is unimportant and the Mach number important for
detc"tining drag coefficients.
It is further shown in section 4.4.2 how the theoretical drag coefficients were compared with
the experimental values obtained from this test series.
4.3.2 Tunnel Mach Number
The size and shape ofthe supersonic nozzle was adjusted to obtain the desired Mach number
in the test section. For each blow ofthe tunnel, stagnation and static pressure readings were
recorded. The test Mach number was calculated by substituting the relevant values into the
following equation (Zucrow & Hoffinan 1976:156) for steady one-dimensional flow ofa
perfect gas:
y2
where 0 denotes stagnation conditions.
Pressures were recorded using the Hyscan 2000 pressure measuring system ofthe High Speed
Wmd-tunnel (HSWT). Corresponding pressure points in the tunnel were connected via thin
bore PVC tubing, to the measuring instrument. The accuracy ofthe 15 psi modules, on which
pressures were measured, is 0,083 kPa.

99
4.3.3 Mass Flow Regulation and Measurement
The test matrix required the inlet to be tested through its full range ofoperational modes, i.e.
from full flow to "buzz" (Rei section 2.4). The flow through the inlet was regulated by a mass
flow control plug (valve), shown in Figure 4.4. The axial movement of this plug was
controlled by a Compumotor controller, in turn controlled by a program from a personal
computer in the control room ofthe tunnel.
During each test run (tunnel blow) the position ofthe control plug was varied in steps from an
open to a closed position. The control parameters that were required for each blow were the
start and end positions, the number ofsteps and the total movement time. These parameters
were selected in such a way that for each test run a portion ofthe data captured, covered the
supercritical, critical and subcritical operating modes. The control parameters were established
through a trial and error process for each test configuration.
Mass flow through the inlet was based on a method using an orifice plate, situated upstream
ofthe mass flow control plug and downstream ofthe inlet cart. The orifice plate was designed
according to British Standards (BS 1042: Section 1.1: 1981). An accuracy of 1 part in 600,
i.e. 0,17 % is specified for the discharge coefficient ifall the requirements, as stated in above
mentioned standard, are adhered to. Static pressure measurements across the orifice plate
(required for mass flow calculations) were performed using a Scanivalve Hyscan 2000 system.
Readings were recorded on the 15 psi modules with an accuracy of0,083 kPa
4.3.4 Bleed Flow Measurement
The formation ofa boundary layer on the compression surfaces of the inlet and the interaction
of shocks with the boundary layer cause detrimental pressure gradients and flow separation.
In an attempt to solve this very difficult flow problem a boundary layer bleed system was
incorporated in the full-scale model shown in Figure 4.7. The boundary layer air was bled off
through the bleed holes in the throat area, to a bleed chamber below the throat region. From
this chamber it was dumped through holes in the side ofthe inlet duct (Figure 4.6) to the tunnel
test section.
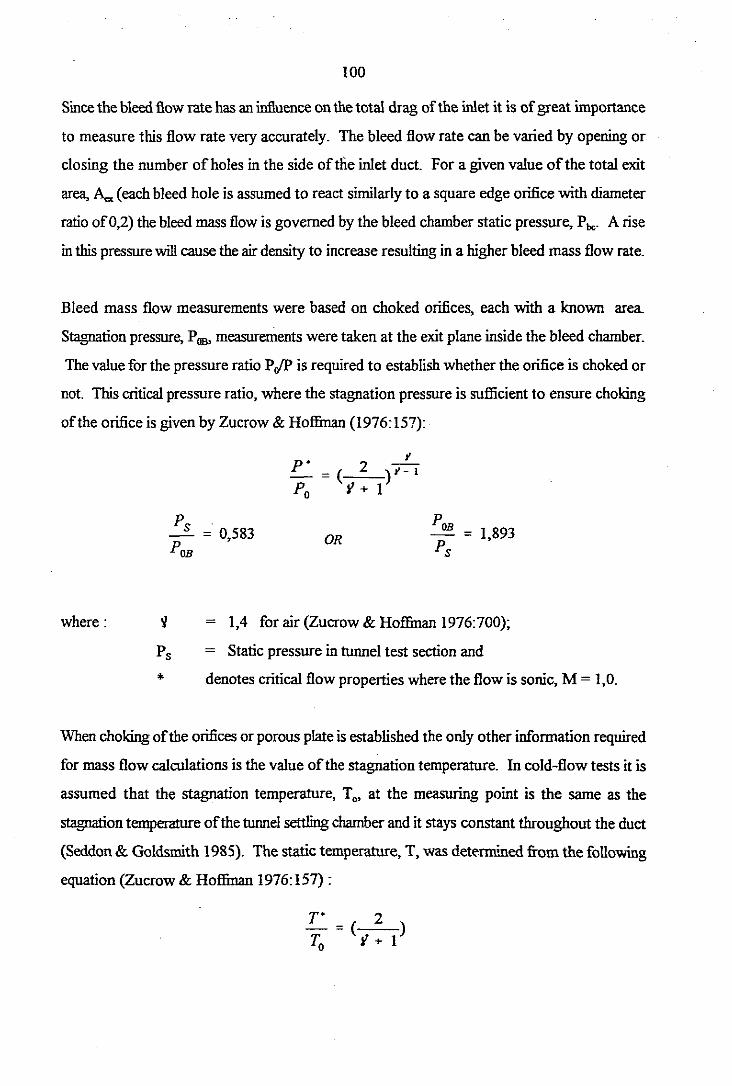
100
Since the bleed flow rate has an influence on the total drag of the inlet it is ofgreat importance
to measure this flow rate very accurately. The bleed flow rate can be varied by opening or
closing the number ofholes in the side oftIie inlet duct. For a given value ofthe total exit
area,~ (each bleed hole is assumed to react similarly to a square edge orifice with diameter
ratio of0,2) the bleed mass flow is governed by the bleed chamber static pressure, Pbc- A rise
in this pressure will cause the air density to increase resulting in a higher bleed mass flow rate.
Bleed mass flow measurements were based on choked orifices, each with a known area.
Stagnation pressure, POB' measurelllents were taken at the exit plane inside the bleed chamber.
The value for the pressure ratio PrIP is required to establish whether the orifice is choked or
not. This critical pressure ratio, where the stagnation pressure is sufficient to ensure choking
ofthe orifice is given by Zucrow & Hoffinan (1976:157):
P• i
_ = ( 2 )T=lPo Y + I
Ps .- = 0583P ,
OBOR = 1,893
where:
*
= 1,4 for air (Zucrow & Hoffinan 1976:700);
= Static pressure in tunnel test section and
denotes critical flow properties where the flow is sonic, M = 1,0.
When choking ofthe orifices or porous plate is established the only other information required
for mass flow calculations is the value ofthe stagnation temperature. In cold-flow tests it is
assumed that the stagnation temperature, To, at the measuring point is the same as the
stagnation temperature ofthe tunnel settling chamber and it stays constant throughout the duct
(Seddon & Goldsmith 1985). The static temperature, T, was determined from the following
equation (Zucrow & Hoffinan 1976:157):

101
It follows that the density ofthe air at the orifice exit was detennined from:
• pp =
RT
Where:
P = static pressure at orifice exit
R = 287,06 Jlkg K (Zucrow & Hoffinan 1976:700).
The velocity ofthe air at the orifice exit, which is also required in the mass flow calculation,
was found from the equation:
V' = M../Y RT
From the continuity equation the maximum mass flow is (White 1994:525) :
riz = p'AV'
By substituting the relevant values into the above equation the bleed mass flow rates, discussed
in section 4.4.4, were detennined.
4.4 RESULTS AND DISCUSSION
4.4.1 Data Processing
The capturing ofdata was performed using the Hyscan 2000 system ofthe High Speed Wmd
tunnel. Once the data was captured it was copied to the personal computer ofthe test engineer
where it was processed.
Records ofthe data logged represent the chronological sequence ofthe tests performed on the
full-scale porous model. Other important information such as tunnel stagnation pressure,
atmospheric pressure, the names ofdata files, model configuration and blow numbers are listed
in Appendix C.

102
4.4.2 Drag Coefficient
From the onset in the analysis ofthe raw data, correctionS had to be made to compensate for .
external and internal factors influencing the balance readings. The important question that had
to be answered was: what are the sizes and directions of the axial forces affecting the balance
readings?
After careful consideration ofthe test set up and model configuration, it was concluded that
the primary factors influencing the axial force readings were:
i) the thrust generated by the internal duct, which passes through the internal section of
the balance, and ejected air into the ducting of the inlet rig;
ii) the build up ofpressure in the chamber between the balance and the wind shield.
All relevant data were recorded for different control plug positions (Ref. section 4.3.3) and
mean values and standard deviations for the axial force measurements were calculated as
shown in Table 4.7.
T 4.7: Mean values and standard deviations for axial force measurements at
various test Mach numbers
J\.I = 1,8 M=2,O M=2,2 J\.I = 2,3 M=2,..
FA Z FA Z FA Z FA Z FA Z
(N) SD 0/0 (N)SD 0/0 (N)
SD 0/0 (N) SD 0/0 (N) SD0/0
-1l9 21 93 -139 23 86 -100 15 93 -91 17 93 -S9 13 100
-129 10 100 -212 14 100 -101 3 100 -92 S 100 -S" 9 93
-134 8 100 -218 5 93 -103 Is 93 -101 8 100 -62 7 100
-123 8 100 -201 23 100 -91 5 93 -102 6 100 -61 5 100
-103 16 100 -178 15 100 -90 S 93 -100 5 100 -S9 6 100
N Nrn10n
FA Mean Axial Force Readings
SD Standard De...iation
Z Percentage data points which fall within two standard deviations on either side ofmean value.

103
A statistical analysis of this data shows that for a total of25 test positions, constituted by five
Mach numbers times five different mass flow ratios, in one case only did 14% of the data
points fall outside two standard deviations on either side of the mean value. In the other 24
cases did between 93% and 100% ofthe data points fall within these above-mentioned limits.
In these cases a reasonably sma1l distribution of data points about the mean is achieved. It can
be said with confidence that the scatter of measured data points lies within acceptable limits.
The reduction ofthis mean axial force data is based on the following analysis and the corrected
values were married to the recorded mass flow ratios as shown in Table C3.
With reference to the geometric layout of the inlet model, it is clear that the installation ofan
internal duct (Rei Figure 4.5) caused the internal geometry of the inlet model to deviate from
that used in an actual inlet, as installed on an air-breathing engine. This internal duct can be
described as a converging section, passing in an axial direction through the inside of the
balance, connecting the subsonic diffuser with the dueting ofthe inlet rig.
The correction to the axial force measurements is based on Newton's second law of motion
(ZUCfOW & Hoflinan 1976:87) for fluid flowing through a control volume. The internal duct
defined as the control volume is depicted in Figure C.I of Appendix Co The momentum
equation defines that the sum ofthe external forces acting on the control volume is equal to
the change in momentum through the control volume.
With reference to the control volume in Figure C.I :
FT + PIAl - P:zA2= me (V2 - VI)
Where:
A Cross-sectional area
FT Stream thrust, NP Static pressure, kPa
V Velocity, m1sme Captured mass flow, kgls
I denotes entrance plane conditions
2 denotes exit plane conditions.
Stream thrust calculations were conducted for different mass flow ratios, mR, and stagnation
pressure recovery ratios, PR. From wind-tunnel test data (Stokenstrom 1991) of an inlet model
with the same geometric shape, corrected values for the stagnation pressure recovery were
derived so as to obtain the representative values for the stagnation pressure, P", at the entrance
plane ofthe control volume (RefTable Co3).

104
The wind-tunnel supplied a specific stagnation pressure to the model at each test Mach
number. This pressure caused the model to get "started" and ensured testing at the correct
Reynolds number. The model was operated at a specific mass £low rate at each setting ofthe
mass £low control valve. From the continuity equation for stagnation conditions (Zucrow &
Hoffinan 1976:144)
Y _ 1 ) -(I + 1)12(1 - 1)+ M 2
2
the velocity at the exit plane, station 2 in Figure C.I, was calculated for different values of
me and Po. The velocity at the entrance plane, station 1, was based on the velocity behind
the normal shock in the subsonic diffuser, and on a change in area ratio.
Substituting the relevant values for stagnation conditions into the equations for steady one
dimensional £low, yielded the corresponding values for static conditions at the entrance and
exit planes of the control volume. From this information for static pressure and velocity the
stream thrust for different captured mass £low rates was calculated for each Mach number.
The results are listed in Table C.3.
The thrust component opposed the drag component and was subtracted from the measured
axial force, FA+ resulting in a corrected drag force. The effect of the chamber pressure on the
axial force was another correction that had to be considered. This pressure was measured in
the cavity or chamber between the balance and the wind shield. When applied on an effective
projected area an unbalanced force, Fcl>omb= was created which pushed the inlet model
downstream, adding to the drag component. It must be noted that a negative sign denotes a
force acting in an upstream direction. The net drag is therefore defined as follows:
D"" = (FA - FT) -F_
From the results given in Table C.3 the following graphs were generated:

105
Figure 4.9 depicts the relationship between the theoretical and experimental drag coefficients
at a free stream Mach number of1,8.
1
0.8
0.8
02
Re' .a,ol .1o"lm 81.. =8%
hperimemol
-~"\-----t- Thoomicol
o0.5 o.s 0.7 0.8 0.9
..... fJowbUo
FIGURE 4.9: Comparison between Theoretical andRqlerimental Value. at M=1,8
Figure 4.10 depicts the relationship between the theoretical and experimental drag coefficients
at a free stream Mach number of2,O.
0.80.80.70.8
R. ~,99.lo"lm Blo.d -8%
1"IloaI.tX01_____..--4
~ .. ~E:f ""Zllal
1o0.5
02
0.8
0.4
o.s
_Aow_FIGURE 4.10 : Comparison between Theoretical and
Rqlerimental Value. at M=2,0
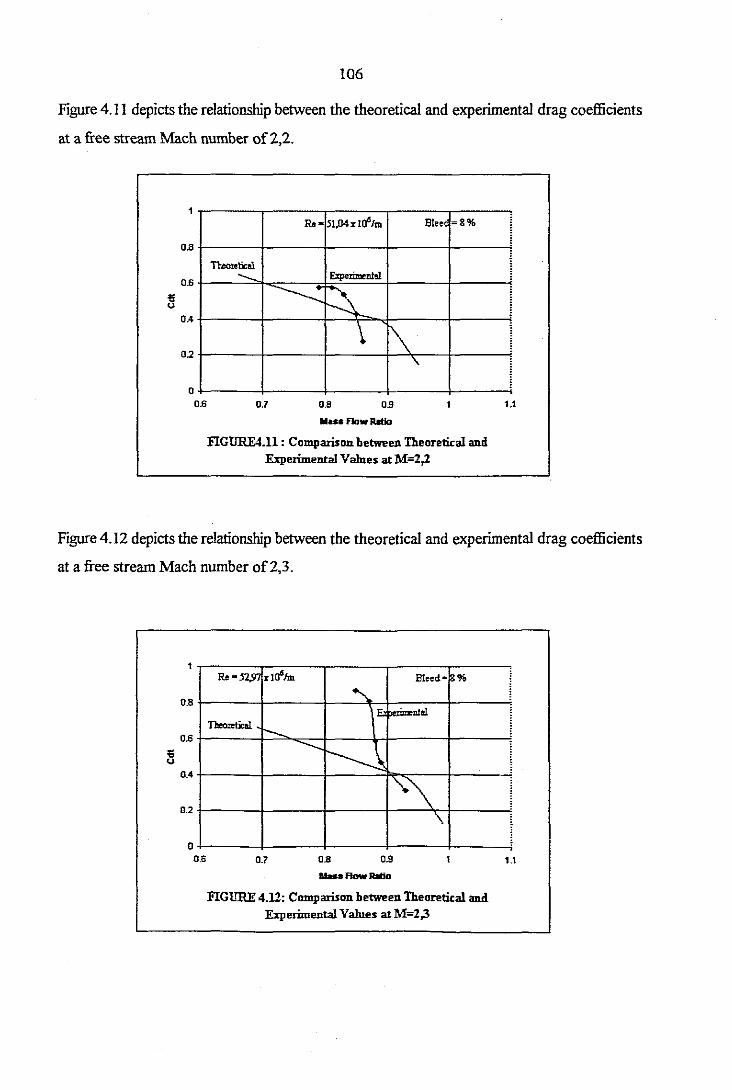
106
Figure 4.11 depicts the relationship between the theoretical and experimental drag coefficients
at a free stream Mach number of2,2.
1.10.90.60.1
Re· 51.04% lO"!m 81" =8%
,n.m.tical
--- E:<perimenlol
-----.:~ ,,\ ~\ ,
"o
0.6
0.4
0.8
02
0.6
~<J
..... Flow Ratio
EIGURE4.11 : Comparison between Theoretical andExperimental Valoes at M=2,2
Figure 4.12 depicts the relationship between the theoretical and experimental drag coefficients
at a free stream Mach number of2,3.
1.10.8 0.9
.....AowRltio
0.7
Re-52,91 • 10"1m Bteed=~%
.........Eo p.,;m.nlol
Tlooretical
--- ............~
".\"\
o0.6
0.'
D.B
02
0.6
~<J
EIGURE 4.12: Comparison between Theoretical andExperimental VaIoes at M=2,3
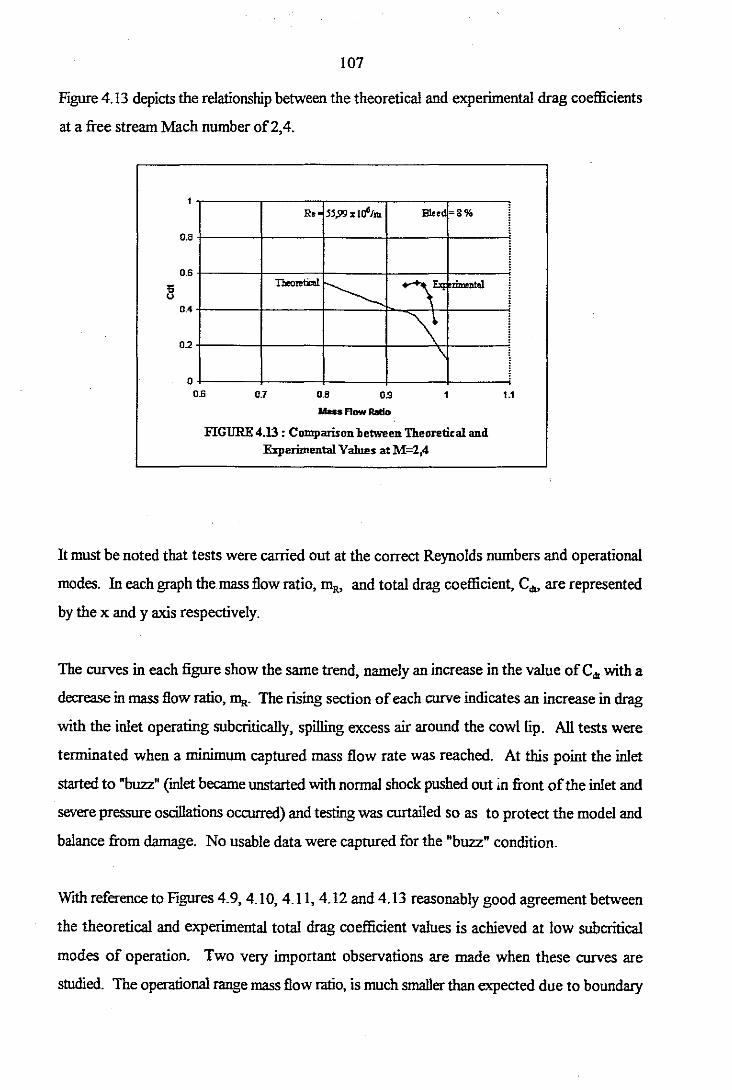
107
Figure 4.13 depicts the relationship between the theoretical and experimental drag coefficients
at a free stream Mach number of2,4.
R. 55.99 % 10"/.. BIo.d =8%
l!,!
Thoomicol
~ ~~ rimonW
~
~. I\
0.8
0.6
0.4
0.2
o0.6 0.7 OB 0.9 1 1.1
Mass Row Ratio
FIGURE 4.13 : Comparison between Theoretical andExperimental VaInes at M;2,4
It must be noted that tests were carried out at the correct Reynolds numbers and operational
modes. In each graph the mass flow ratio, mlb and total drag coefficient, Cd!> are represented
by the x and y axis respectively.
The curves in each figure show the same trend, namely an increase in the value ofCd! with a
decrease in mass flow ratio, II\<. The rising section ofeach curve indicates an increase in drag
with the inlet operating subcritical1y, spilling excess air around the cowl lip. All tests were
terminated when a minimum captured mass flow rate was reached. At this point the inlet
started to "buzz" (mlet became unstarted with normal shock pushed out in front ofthe inlet and
severe pressure oscillations occurred) and testing was curtailed so as to protect the model and
balance from damage. No usable data were captured for the "buzz" condition.
Wrthreferenceto Figures 4.9, 4.10, 4.11, 4.12 and 4.13 reasonably good agreement between
the theoretical and experimental total drag coefficient values is achieved at low subcritical
modes of operation. Two very important observations are made when these curves are
studied. The operational range mass flow ratio, is much smaller than expected due to boundary

108
layer effects. It is clear from the test data and the visual material that the subcritical margin
of operation was greatly reduced due to a lack ofboundary layer bleed on the surface ofthe
compression ramp. (Note bleed holes were closed off to achieve a realistic bleed rate of8%,
as used during theoretical calculations). A second observation is that the slopes of the
experimental curves are much steeper than that of the theoretical curves because the margin
of subcritical operation is much smaller and spill has a more drastic effect on the drag as
expected. This steeper rise in drag with the inlet spilling can be attnouted to serious flow
distwbances when the normal shock and oblique shocks interacted. The interaction of the root
ofthe normal shock with the boundary layer on the compression ramp, also contributed to a
higher drag penalty than expected.
An analysis of the data in Figures 4.9 to 4.13 for maximum flow conditions shows that there
is a variation in the drag coefficient with a change in Mach number. The following data is of
significance :
• atM= 1,8 Cdt =0,22
• atM=2,0 Cdt = 0,23
• atM=2,2 Cdt = 0,28
• atM=2,3 Cdt = 0,31
• atM=2,4 Cdt = 0,33.
This data indicates that there is an increase of50"10 in the value of Cd! with an increase in Mach
number. This needs for further investigation because the higher average drag figures measured
atM=2,3 and M = 2,4, where the oblique shocks were focussed on or inside the cowl lip at
M = 2,3 and M = 2,4 respectively, were presumably caused by significant flow distortions in
the air entering the inlet. These distortions are caused by the interaction ofthe oblique shocks
with the boundary layer on the inside of the cowl lip resulting in flow separation with an
eventual drag penalty.
4.4.3 Flow Visualisation
Shock patterns were recorded for all test runs using Schlieren equipment. Video recordings,
as shown in Figures 4.14 to 4.19, were made for test Mach numbers ranging from M = 1,8 to
2,4, over the full operating range as specified in the test matrix (Table 4.5).

109
With reference to the following figures, the following observations can be made:
• Figure 4.14: shows that at critical and supercritical operation the oblique shocks from
the compression wedges were focussed at some distance in front of the cowl lip at M
= 1,8. An oblique shock, generated by the inclined leading edge ofthe lip, is clearly
shown with an expansion fan at the top corner of the lip rounding offthe picture. At
the subcritical mode of operation the inlet was spilling excess air while the normal
shock was situated in front ofthe lip. At this Mach number the inlet has very good
subcriticaI operational characteristics.
• Figure 4.15 shows the external flow field with shock patterns for the inlet operating
at M = 2,0. The oblique shocks were focussed closer to the cowl lip at the Mach
number below the design point with a good margin for stable subcriticaI operation.
• Figure 4.16 depicts the inlet during operation at the design Mach number, M = 2,2,
where the oblique shocks were focussed just in front of the cowl lip. The inlet was
reasonably stable during subcritical operation and the vortex generated by the
intersection of the oblique shocks just missed the inlet opening.
• Figure 4. 11 shows the inlet operating with the oblique shocks focussed on the cowl
lip at M = 2,3. This is not a desirable situation, since the intersection (focus) of the
oblique shocks caused flow separation where it interfered with the boundary layer of
the cowl lip. The inlet became unstable during subcriticaI operation as is shown in
Figure 4.11 (b).
• Figure 4. I 8 depicts the inlet operating at M = 2,4 with the oblique shocks focussed
inside the cowl lip. This situation should be avoided since the vortex generated by the
intersection of the two oblique shocks was ingested into the inlet and caused the
internal flow to become unstable. The inlet has a very limited margin of subcriticaI
operation at this Mach number and "buzz" was initiated soon after the normal shock
started to appear in front ofthe inlet opening.
"Buzz" is initiated when the normal shock is pushed out ofthe inlet causing the shock pattern
to break: up and the flow to become separated, resulting in large pressure oscillations. These
pressure gradients in the external flow field can be seen in Figure 4.19.
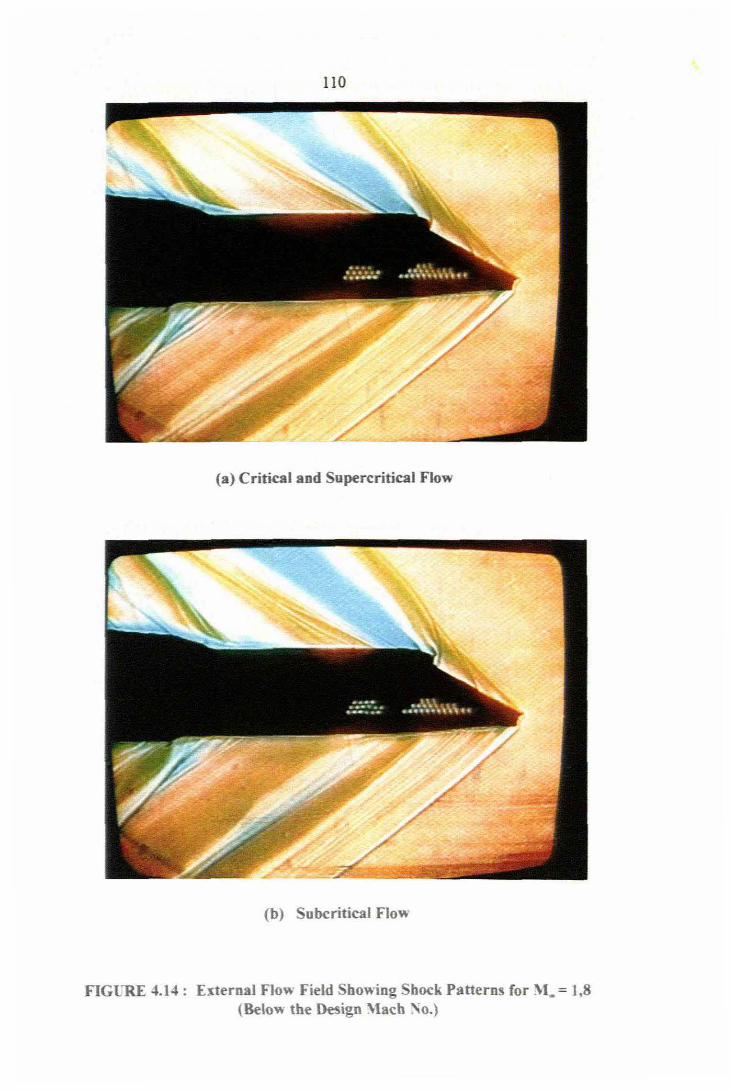
110
(a) Critical and Supercritical Flow
(b) Subcritical Flow
FIGL'R£ 4.14: External Flow Field Sbowing Shock Patterns for M. = 1,8(Below the Design 'tacb :"\0.)
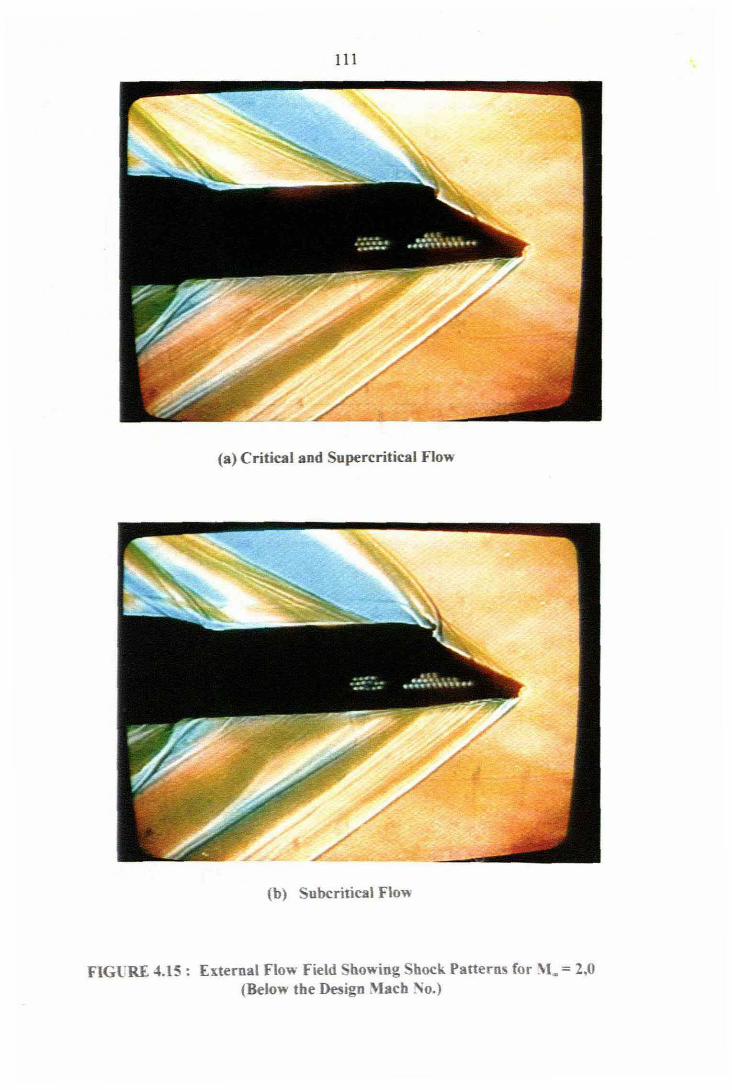
111
(a) Critical and Supercritical Flow
(b) Subcritical Flow
FIGURE 4.15: External Flow field Showing Shock Patterns for :\1. = 2,0(Below the Design Mach No.)

112
(a) Critical and Supercritical Flow
(b) Subcritical Flow
FIGURE 4.16; External Flow Field Showing Shock Patterns for '1. = 2,2(At the Design Mach ~o.)

113
(a) Critical aDd Supercritical Flow
(b) Subcritical Flow
FIGURE 4.17: External Flow field Showing Shock Patteros for M. =2,3(At the Shock OD Lip Mach ~o.)
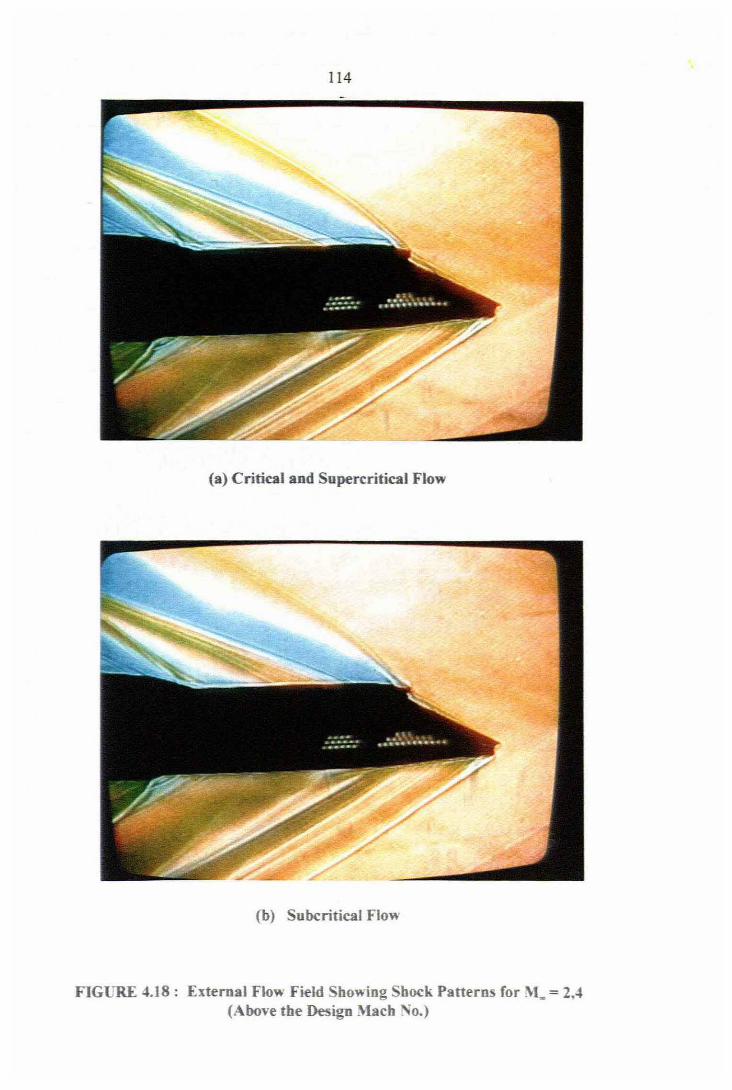
114
(a) Critical and Supercritical Flow
(b) Subcritical Flow
FIGURE 4.18: External Flow Field Sbowing Sbock Patterns for \1. = 2.4(Above tbe Design .lacb No.)

115
FlGl'RE ~.19: External Flo~ Field Showing ~Buzz" Condition

116
4.4.4 Bleed Flow
For theoreticaldrag predictions, as discussed in section 3.3.4 for bleed drag, a typical bleed
flow ratio of 8 % was assumed. The full-scale porous model made provision for the low
energy boundary layer air to be bled offat the throat section. The bleed air was accumulated
in a plemun chamber below the throat section and dumped overboard through holes in the side
plates to the test section ofthe tunnel. Stagnation pressures were recorded during testing at
M=2,0.
Bleed flow measurement is fully described in section 4.3.4. From the test results, for critical
mode of operation, it was established that a value for the pressure ratio of
8660 kPa .POB / Ps =' = 2,06 was adequate to ensure choking ofthe flow through
41,94 kPa
the bleed holes. From the isentropic relations for critical flow the air density and velocity
through each bleed hole were calculated. Substituting the relevant information into the
relationship for conservation-of-mass, me = pVA , yielded a value of 0,074 kgls for the
bleed flow rate. Based on a captured mass flow ratio, mR = 0,78 (RefTable C.3) a value of
0,894 kgls was established for the captured mass flow. The bleed flow ratio, as described in
section 3.3.4, is expressed as a percentage of the mass flow entering the inlet. Based on these
flow rates a bleed flow ratio of 8,3 % was established which correlates very well with the
assumed value of8 %, as used in theoretical drag calculations.
4.5 SUMMARY
Despite very difficult logistical problems the test program was successful!y concluded with the
help ofthe wind-tunnel personnel ofthe Aerotek Division ofthe CSIR. Great care was taken
to ensure proper set up of the model, accurate calibration of equipment and application of
scientific methods for capturing ofdata.
The main objective of the experimental phase was achieved where the necessary data was
recorded from which drag coefficients, mass flow ratios and bleed flow rates could be
determined. A bonus was the recording Schlieren material which could be used to visually
study and thus analyse the external flow fields over the full operational range ofthe inlet.

CHAPTER
5
CONCLUSION AND RECOMMENDATIONS
A complex fluid-dynamic problem was solved satisfactorily by applying theoretical equations to
a practical situation where a realistic two-dimensional external compression inlet was tested over
its full operational range during an intensive wind-tunnel test program. Reasonably good
correlation was achieved between experimental data and theoretical values at low subcritical mode
ofoperation and the following conclusions can be made.
• a srnalIer mass flow range, typically 0,63 to 0,98, achieved during the test program
indicates that the inlet can only be operated over a much smaller subcritical mode than that
which was expected;
• the mass flow ratio or mode ofoperation has a significant effect on drag; ego at M = 1,8;
2,0; 2,2; 2,3 and 2,4 the drag increases by 164%; 96%; 107%; 180% and 64%
respectively with an associated reduction in mass flow rate;
• variation in Mach number, from below to above the design point (M = 1,8 to 2,4), caused
a 50% increase in drag at maximum flow conditions;
• the steep slope of the curve for the experimental drag coefficient indicates that at
subcritical mode ofoperation the increase in drag with a decrease in captured mass flow
rate is much more severe than expected. This indicates a major drag penalty associated
with spill.
It is finally concluded that by comparing the theoretical values with the experimental data, the
primary objective has been achieved by providing realistic drag coefficient values, for the
following mass flow ranges, over which theoretical equations can be used to calculate the drag
ofa two-dimensional external compression inlet:

ll8
• mR =0,69 to 0,65 at M= 1,8;
• mR =0,78 to 0,75 at M=2,0;
• mR =0,85 to 0,79 at M=2,2;
• mR =0,93 to 0,88 at M=2,3;
• mR =0,98 to 0,97 at M =2,4.
The experimental procedure showed shortcomings in fine tuning the captured mass flow rate
during subcritica1 mode of operation. It is recommended that for future tests the mass flow
control device must be able to move forward in very small steps to ensure capturing of data over
the full subcritica1 mode ofoperation.
This study opened up the field for further research where specific attention should be given to the
,",ce that main components, such as the cowl lip, has on the aerodynamic drag characteristics
oft,"C, type of inlet. It is finally recommended that further research should be carried out on an
installed inlet and that drag coefficient values should be obtained for different angles ofpitch and
yaw.

119
REFERENCES
Anon. 1980. Intakes for Pure Jet Engines. Short Course Handouts, Cranfield Institute of
Technology, UK.
Anon. 1981. British Standard. Methods of Measurement of Fluid flows in closed
conduits. BS 1042: Section 1.1: 1981. British Standards Institution, London.
Backeberg, P.M. 1989. Experimental Determination of Maximum AIIowable Blockage
for an Intake Model in the DAST High Speed Wind Tunnel. Report DAST 89/37.
CSIR, Pretoria.
Bendot, I.G., Hems Jr, AE. & Piercy, T.G. 1984. Ramjet Air Induction System Design for
Tactical Missile Application. AGARD Lecture Series No. 136, Ramjet and Rarnrocket
Propulsion Systems for Missiles.
Connors, J.E & Lovell, I.C. 1957. Investigation ofTranslating - Double-Cone
Axisymmetric Inlets with Cowl Projected Areas 40 and 70 Percent of Maximum at
Mach Numbers from 3,0 to 7,0. NACA RM E57 C06.
Gregoriou, G. 1985. Introduction to Inlet Aerodynamics. (Unpublished).
Hall, R.B. 1977. Additive Drag of Two-dimensional Inlets. Naval Weapons Centre China
Lake, California.
Hattingh, H.V. 1977. Gasdinamika A K1asnotas. Eerste Urtgawe. University ofStellenbosch.
Hawkins, J.E., Kirkland, EP. & Turner, R.L. 1976. Inlet Spillage Drag Tests and
Numerical Flow-Field Analysis at Subsonic and Transonic Speeds of a lh-scale,

120
Two-Dimensional, External-Compression, Variable-Geometry, Supersonic Inlet
Configuration. National Aeronautics and Space Administration Washington, DC, USA
Hoemer, S.F. 1965. Fluid - Dynamic Drag. New York City, USA
Krieger, RI. & Vukelich, S.R 1986. Tactical Missile Drag. Progress in Astronautics and
Aeronautics. Volume 1. American Institute ofAeronautics and Astronautics, New York.
Laruelle, G. 1987. Air intakes for Supersonic Missiles: Design Criteria and
Development. ONERA, BP 7.2 F-92322, Chatillon Cedex, France.
Laruelle, G. 1988. Missile Intakes. Lecture Series 1988-04. Intake Aerodynamics, Van
Karman Institute, Belgium.
Lee, C.C. & Boedicker. 1985. Subsonic Diffusor Design and Performance for Advanced
Fighter Aircraft. AlAA-85-3073.
Leyland, D.C. 1988. Intake Drag. Lecture Series 1988-04. Intake Aerodynamics, Van
Karman Institute, Belgium.
Leynaert, J. 1988. Transport Aircraft Intake Desigu. Lecture Series 1988-04. Intake
Aerodynamics, Van Karman Institute, Belgium.
Oswatitsch, K. 1947. The Efficiency ofShock Diffusers. NACA TM 1140.
Pearce, Jr. RH. 1959. Supersonic Ramjet Diffuser Design. Missile Division, North
America Aviation, Downey, California.
Pope, A & Gain, K.L. 1965. High-speed Wind Tunnel Testing. John Wiley and Sons,
Inc. New York.
121
Ratner,G.C. 1995. Calibration ofan Internal Strain Gauge Balance. Technical Report No.2.
CSlR, Pretoria.
Ratner, G.C. 1995. 6 Compnent Strain Gauge Balance Calibration Matrix Calculation.
Technical Report No. 5. CSlR, Pretoria.
Seddon, J. & Goldsmith, E.L. 1985. Intake Aerodynamics. AIAA Educational Series, Air
Force Institute ofTechnology, Ohio, USA
Seddon, J. 1988. Introduction to Intake Aerodynamics. Lecture Series: Intake
Aerodynamics, Von Karman Institute, Belgium.
Stockenstrom, A 1990. Supersonic Inlet: Phase Three Test Report. Somchem Report
No. 03982-000000-725017.
Stockenstrom, A 1991. Phase Four Supersonic Inlet Test. Somchem Report
No. 03982-000000-725030.
Surber, L.E. 1975. Effect ofForebody Shape and Shielding Techinique on 2-D
Supersonic Inlet Performance. AIAA-75-1183.
Surber, L.E. & Numbers, K.E. 1988. Tactical Fighter Inlets. Lecture Series 1988-04.
Intake Aerodynamics, Von Karman Institute, Belgium.
TmdeIl, R.H. 1987. Highly Compact Inlet Diffusor Technology. AlAA-87-1747.
White, F.M 1994. Fluid Mechanics. McGraw-HilI Inc., New York.
ZUCfOW, MJ. & Hoffinan, J.D. 1976. Gas Dynamics Volume 1. John WI1ey and Sons.,
New York.

APPENDIX
A
MASS FLOW CALCULATIONS AT DIFFERENT MACH NUMBERS
In calculating the aerodynamic drag ofan inlet it is important to consider the different conditions
under which the inlet is operating, ego height above sea level and mass flow captured.
For the theoretical determination of the drag coefficient, as fully described in section 3.3 of
Chapter 3, it is important to analyse the mass flow captured by the inlet at different flight Mach
numbers.
In a very general application, a ground launch at sea level is considered, based on ·Properties of
the U.S. Standard Atmosphere" (Zucrow & Hoflinan 1976:708) where:
Static pressure, P = 101,33 kPa;
Static temperature, T = 288,15 K;
and the thermodynamic constants for air are (Zucrow & Hoflinan 1976:700):
Specific heat ratio, 'i = 1,4;
Gas constant, R = 287,06 J/kg.K.
Referring to Table A 1 all the relevant information, of the full-scale porous modeL can be found
for conducting the following calculations based on the governing equations for steady one
dimensional flow ofa perfect gas (Zucrow & Hoflinan 1976:154-156):
Po- = (tP
(A.t)
(A.I)

Where:
pp =
RI
a =-li R T
V= M.a
m= p VA
A-2
(A.3)
(A.4)
(A.5)
(A.6)
Po = Stagnation pressure
P = Static pressure
To = Stagnation temperature
T = Staticternperature
p = Density
ID = Mass flow
a = Speed ofsound
V = Velocity
M = Mach number.
From the above information the data as shown in Table A2 can be calculated.
For the purpose ofexercise a Mach number of2,0, which is just below the design Mach number
of2,2, is selected because it is a very common Mach number for vehicles in flight.
Mass flow values are calculated for (i) full flow at free stream conditions and (ii) flow captured

A-3
at throat section behind second oblique shock.
i) Fullmassflaw
Substituting the relevant infonnation into:
eqn.Al
eqn. A2
eqn.A3
eqn.A4
eqn. A5
yields a value of
yields a value of
yields a value of
yields a value of
yields a value of
Po = 792,85 kPa;
T = 51867K;o ,
p = 1,225 kg/m3;
a = 340,30 mls;
V = 680,60 mls.
At free stream conditions the mass flow is based on the dimensions ofthe capture area ofthe inlet
opening, i.e. height = 52,9 mm and width = 53,3 mm.
Substituting the relevant information into eqn. A6 yields a value of m. = 2,351 kg!s for the
full mass flow.
ii) Capturedmassflaw
The actual mass flow captured by the inlet is based on conditions behind the second oblique shock
where the streamtube enters the throat section. The conditions behind the oblique shocks can be
calculated from shock wave theory.
For a given free stream Mach number of 2,0 and a deflection angl-::, al = 9° for the first
compression wedge, the shock wave angle El = 38,26 0 can be found from Table C.12 (ZUCfOW
& Hoffinan 1976:744).
From eqn 7.99 (ZUCfOW & Hoffinan 1976:368) :
M=Msin€ (A7)
A-4
Where M' is the component ofthe Mach number normal to an oblique shock wave.
Substituting the relevant information into the above equation yields a value ofM = 1,24. From
Table C.1I (Zucrow & Hoflinan 1976:737) the normal component ofthe Mach number after the
shock and static pressure ratio over the shock can be read olfas M'I = 0,8183 and P:Il'i = 1,6272
respectively.
The Mach number after the first oblique shock can now be calculated from eqn. 7.100 (Zucrow
& Hoffinan 1976:368) where:
M'M = -'s,':-in-'(':-E--"":(5::-)
(A.B)
Substituting the relevant information into the above equation yields a value for MI = 1,67.
From the static pressure ratio ofP/P. = 1,6272 the value for PI = 101,33 x 1,6272 = 164,88 kPa
can be found.
From the governing equations for one dimensional flow the stagnation pressure behind the first
oblique shock yields a value ofP.1 = 777,92 kPa.
Since for a perfect gas, the stagnation pressure remains constant across shock waves (Zucrow &
Hoflinan 1976:336), the static temperature behind the first oblique shock wave can be calculated.
Substituting values ofT.1= 518,67 K and M 1= 1,674 into eqn. A2 yields a value
ofT I = 332,95K
From equations A3, A4 and A.5 the values for p = 1,725 kg/m3;
a =365,80 m1s and V = 610,88 are calculated respectively.
In a similar manner the conditions behind the second oblique shock can be calculated. The results
ofthe flow analysis for different flow areas, i.e. free stream, after first oblique shock, after second
oblique shock and after normal shock are depicted in Table A.2.

A-5
The actual mass flow captured by the inlet is a function ofconditions behind the second oblique
shock and the throat area, AT' Substituting the values of P2 = 2,281 kg/m3, V2 = 539,007 m1s
and AT = (31,7 x 53,3) 10 -6 m2 into eqn. A.6 yields a value of me = 2,08 kg/s .
Results offlow analyses done at Mach numbers of 1,8, 2,2, 2,3 and 2,4 are depicted in Tables
A.3, A.4, A.5 and A.6 respectively.
TABLEA.l: Critical Dimensions of Full-Scale Porous Model
.Number ofwedges 2
Wedge Angles 01 9,00
0, 8,00
,\ Height ofthroat 31,7 mmWidth ofthroat 53,3 mm
Height ofcapture area: 52,9 mmWidth ofcapture area: 53,3 mm ..
Lip effective external angles 1]0 19,3 0
T]1 5,60
Lip expansion angle 0 13,70
Wetted surface oflip:
(i) Internal: width 53,3 mmlength 46,7 mm
(ii) External: Width 56,4 mmLength, ~1 14,9 mm
~, 32,8 mm
Bleed duct exit area for choked flow atM,. =2,4 Aex 268x 10-6 m2
Diverter width 56,4 mmDiverter height 14,4 mmDiverter wedge angle 37,5 0
Inlet Frontal dimensions:
(i) Total Height 61,02 mm
Cri) External Width 56,40 mm

A-6
TABLE A.2: One Dimensional Flow Analysis at Mach Number = 2,0 for AtmosphericConditions at Sea Level
FREE STREAM CONDmONS
Static pressure p. = 101,33 kPaStagnation pressure P_ = 792,85 kPaDynamic pressure Cl- = 283,72 kPaReynolcls nnmber R. = 46 x 10'/mStatic tempezalUIe T. =288,15KStagnation temperature T_=518,67KDensity P = 1,225 kg/m'Speed ofsound a = 340,30 mlsVelocity V = 680,60 mlsFull mass flow m.=2,351kg/s
CONDmONS AFI'ER FIRST OBUQUE SHOCK
Wedge angle ~, =9"Shock wave angle C, = 38,260
Machnumber M, = 1,67Static pressure P, = 164,88 kPaStagnation pressure Pot = 777,93 kPaStatic tempezalUIe T, =332,95KStagnation tempezature To, = 518,67 KDensity P = 1,725 kg/m'Speed ofsound a = 365,80 mlsVelocitv V = 610,88 mls
CONDmONS AFl'ER SECOND OBUQUE SHOCK
Wedge angle 6, =80
Shock wave angle e. =45,5"Machnumber M, = 1,39Static pressure P, = 244,91 kPaStagnation pressure P., = 768,49 kPaStatic tempezatUIe T, = 374,1l KStagnation temperature T., = 518,67 KDensity P = 2,281 kg/m'Speed ofsound a = 387,78 mlsVelocity V = 539,01 mlsMass flow captnred me = 2,08 kg/s
CONDmONS AF'fERNORMAL SHOCK
Machnumber M, =0,74Static pressure P, = 51I,23 kPaStagnation pttSSille Po) = 735,51 kPaStatic tempezalUIe T, = 467,47KStagnation tempezature To) = 518,67 KDensity P =3,81 kg/m'Speed ofsound a = 433,44 mlsVelocity V = 320.74 mls
Mass flow ratio m. =0,89
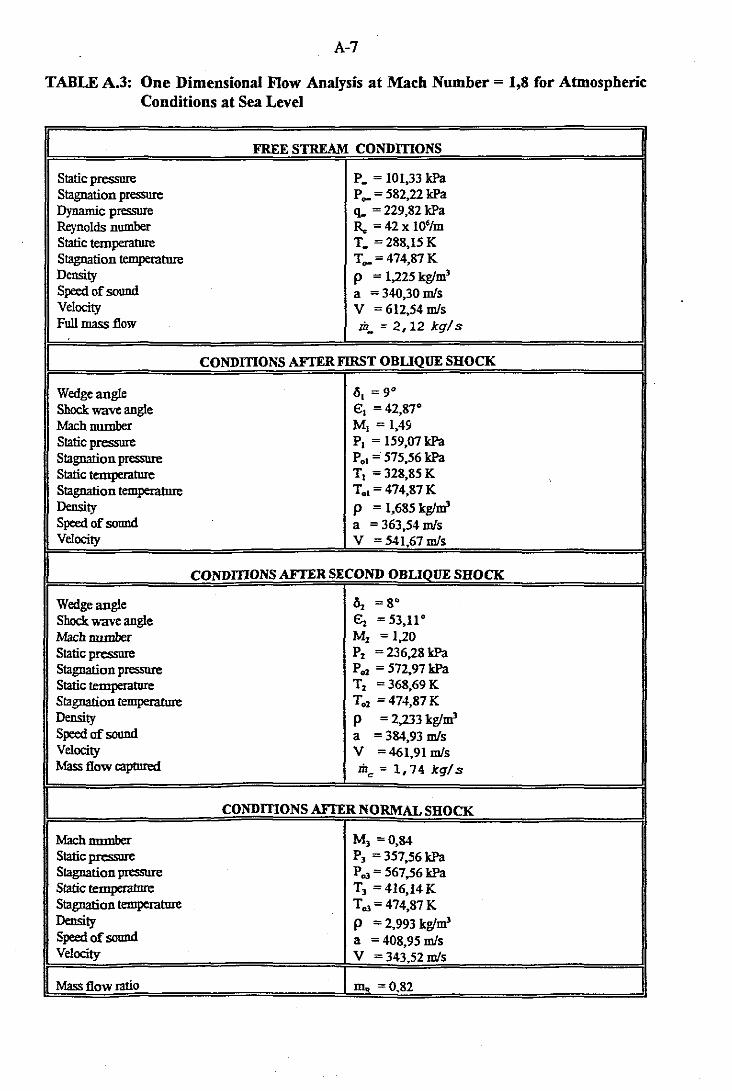
A-7
TABLE A.3: One Dimensional Flow Analysis at Mach Number = 1,8 for AtmosphericConditions at Sea Level
FREE STREAM CONDmONS
Static pressure p. = 101,33 kPaStagnation pressure P_ = 582,22 kPa
Dynamic pressure ~ = 229,82 kPaReynolds number R. = 42 x 10'/mStatic temperature T. =288,15 KStagnation temperature T_=474,87KDensity p = 1,225 kg/m'Speed ofsound a = 340,30 mlsVelocity V = 612,54 mlsFull mass flow m. = 2,12 kg!s
CONDmONS AFfER FIRST OBLIQUE SHOCK
Wedge angle 6, = 90
Shock wave angle e, = 42,870
Machnumber M, = 1,49Static pressure P, = 159,07 kPaStagnation pressure Pal = 575,56 kPaStatic temperature T, =328,85KStagnation temperature To, = 474,87 KDensity P = 1,685 kg/m'Speed of sound a = 363,54 mlsVelocity V = 541,67 mls
CONDmONS AFfER SECOND OBLIOUE SHOCK
Wedge angle c5, =8"Shock wave angle E; = 53,11"Machnumber Mz = 1,20Static pressure Pz = 236,28 kPaStagnation pressure Poz = 572,97 kPaStatic temperature Tz = 368,69KStagnation temperature Toz = 474,87 KDensity P = 2,233 kg/m'Speed ofsound a = 384,93 mlsVelocity V =461,91 mlsMass flow captured me = 1,74 kg! s
CONDmONS AFfER NORMAL SHOCK
Machnmnber M, =0,84Static plesswc P, = 357,56 kPaStagnation pressure Po> = 567,56 kPaStatic temperature T, =416,14KStagnation temperature To> = 474,87 KDensity P = 2,993 kg/m'Speed of sound a = 408,95 mlsVelocity V = 343,52 mls
Mass flow ratio m. = 0,82

A-8
TABLE AA: One Dimensional Flow Analysis at Mach Number = 2,2 for AtmosphericConditions at Sea Level
FREE STREAM CONDmONS
Static pressure p. = 101,33 kPaStagnation pressure p.. = 1083,49 kPaDynamic pressure q. = 343,31 kPaReynolds number ,R.. = 51 x 10'/mStatic temperature T. =288,15 KStagnation temperature T.. = 567,08 KDensity P = 1,225 kg/m'Speed ofsound a = 340,30 mlsVelocity V = 748,66 mlsFull mass flow m. = 2,59 kg!s
I CONDmONS AFTER FIRST OBUQUE SHOCK IWedge angle 6, =9"Shock wave angle €, =34,81 0
Machnumber M, = 1,85Static pressure P, = 170,79 kPaStagnation pressure Pot = 1059,54 kPaStatic temperature T! = 336,65KStagnation temperature To! = 567,08 KDensity P = 1,767 kg/m'Speed of sound a = 367,82 mlsVelocity V = 680,47 mls
CONDmONS AFTER SECOND OBUOUE SHOCK
Wedge angle 6, =80
Shock wave angle E; =4O,4ZOMach number M, = 1,57Static pressure P, = 258,46 kPaStagnation pressure P02 = 1050,95 kPaStatictemperature T, =379,83 KStagnation temperature T02 = 567,08 KDensity P = 2,370 kg/m'Speed ofsound a = 390,70 mlsVelocity V = 613,4OmlsMass flow captnred me = 2,46 kg! s
CONDmONSAFTERNO~1ALSHOCK
Machnumber M, =0,68Static pressure P, = 700,17 kPaStagnation pressure Po) = 954,22 kPaStatic temperature T, = 519,08KStagnation temperature To) = 567,08 KDensity P = 4,699 kg/m'Speed of sound a = 456,74 mlsVelocity V = 310,58 mls
Mass flow ratio m. = 0,95

A-9
TABLE A.S: One Dimensional Flow Analysis at Mach Number = 2,3 for AtmosphericConditions at Sea Level
I FREE STREAM CONDmONS IStatic pressure p. = 101,33 kPaStagnation pressure p.. = 1267,06kPaDynamic pressure ~ = 375,22 kPaReynolds number R" = 53 x 10'/mStatic temperature T. = 288,15 KStagnation temperature T.. =593,OI KDensity P = 1,225 kg/m'Speed of sound a = 340,30 mlsVelocity V = 782,69 mlsFull mass flow m. = 2,70 kgls
I CONDmONS AFIER FIRST OBLIQUE SHOCK IWedge angle 6, =9°
Shock wave angle e, = 33,380
Machnumber M, = 1,94Static pressure P, = 173,78 kPaStagnation pressure Po' = 1238,78 kPa
;. Static temperature T, = 338,34K, S . To, = 593,01 K'","'Uon temperature
Density p = 1,789 kg/m'Speed ofsound a = 368,75 mlsVelocity V = 715,38 mls
CONDmONS AFTER SECOND OBLIOUE SHOCK
Wedge angle 6-, = 8°
Shock wave angle E:, = 38,41 0
Machnumber M, = 1,65
Static pressure P, = 267,86 kPa
Stagnation pressure Po, = 1226,49 kPaStatic temperature T, = 383,95KStagnation temperature T02 = 593,01 K
Density P = 2,430 kg/m'Speed ofsound a = 392,81 mlsVelocity V = 648,14 mlsMass flow captured me = 2,66 kgls
COND1TlONSAFTERNO~MLSHOCK
Mach IIIIIIlber M, =0,65
Static presswe P, = 806,15 kPaStagnation pressure Po> = 1070,83 kPaStatic temperature T, = 546,80K
To> = 593,01 KStagnation tenJpeIatme p = 5,136 kg/m'Density a = 468,78 mlsSpeed ofsound V = 304,71 mlsVelocitv
Mass flow ratio m. = 0,99

A-IQ
TABLE A.6: One Dimensional Flow Analysis at Mach Number = 2,4 for AtmosphericConditions at Sea Level
FREE STREAM CONDmONS
Static pressure P_ = 101,33 kPaStagnation pressure P_ = 1481,45 kPa
Dynamic pressure q. = 408,56 kPaReynolds number R. = 56 x 10'/mStatic temperature T_ =288,15KStagnation temperature T_= 620,10 KDensity P = 1,225 kg/m'Speed ofsound a = 340,30 m1sVelocity V =816,72m1sFull mass flow m_ = 2,82 kg/ s
CONDmONS AYfER FIRST OBUQUE SHOCK
,: Wedge angle 6, =9·+; Shxkwaveangle e. = 32,09·
Machnnmber M, =2,03Static pressure p. = 176,80 kPaStagnationpressure Pol = 1449,51 kPaStatic temperature T. = 339,93 KStagnation temperature TOI = 620,10 K
Density P = 1,812 kg/m'Speed of sound a = 369,61 m1sVelocity V = 750,31 m1s
CONDmONS AYfER SECOND OBLIQUE SHOCK
Wedge angle 6, =80
Shock wave angle e, =36,65 0
Machnumber M, = 1,76Static pressure P, = 267,55 kPa
Stagnation pressure Po> = 1446,31kPaStatic temperature T, = 382,89 KStagnation temperature To, =620,10KDensity P = 2,434 kg/m'Speed of sound a =392,27 m1sVelocity V = 690,40 m1sMass flow captured me = 2,84 kg/s (I)
CONDmONS AFTER NORMAL SHOCK
Machnnmber M, =0,63Static pressure P, = 922,31 kPaStagnation pressure Po) = 1205,00 kPaStatic temperature T, = 574,50KStagnation temperature To) = 620,10 KDensity P = 5,593 kg/m'Speed ofsound a = 480,50 m1sVelocity V = 302,72 m1s
Mass flow ratio m. = 1,0

APPENDIX
B
MAXIMUM MODEL SIZE
The maximum model size had to be calculated to ensure proper starting of the tunnel at test
Mach numbers of M =2,0 to M =2,4.
As can be seen from Figure 1:27 (pope & Goin 1965:38) the biggest problem occurs at the
lower Mach numbers where a smaller area ratio is required than at a higher Mach numbers.
Therefore for a test Mach number ofM = 2,0 the size ofthe model can be calculated from the
following dimensionless ratios, read-offfrom Figure 1:27 (pope & Goin 1965:38):
i)
ii)
dm = 0,47 for a theoretical G3Se
.fA
dm = 0.355 for an actual G3Se.
.fA
Where:
dm = Maximum model diameter
A = Physical test section cross-sectional area less the product ofboundary layer
displacement thickness and test section perimeter.
Taking the dimensions offull-scale porous model. the frontal area induding diverter can be
calculated as follows :
A = (61,02 + 14,4) 56,4 x 10" m2
= 4253,69 x IQ" m2
Where:

Model dimensions =
Diverter dimensions =
B-2
61,02 mm x 56,4 mm x 564 mm long; and
14,4 mm x 56,4 mm x 564 mm long.
An equivalent diameter can be calculated as follows:
TT dm LA = _,.--c-
4
= 73,593 X 10-3 m
The size ofthe tunnel can now be calculated for a certain start based on :
i) a theoretical case;
ii) an actual case.
i) For a theoretical case:
dm = 0,47,fA
(dm)L
A = 0,47
= (73.593 X 10⁻³ )1. m 2
0.47
A = 24517.563 X 10-6 m L•
Assuming that the tunnel has a square test section the following dimensions are obtained :
156,580 mm x 156,580 mm.

B-3
ii) For an actual case:
dm = 0,355,fA
= ( 73.593 x 10⁻³) 2 m 2
0,355
= 42975.042 X 10-6 m 2•
Assuming that the tunnel has a square test section the following dimensions are obtained :
207,304 mm x 207,304 mm.
The High Speed Wmd-tunnel (HSWT) of the CSIR in Pretoria where these tests were
conducted has a test section with dimensions of450 mm x 450 mm, which is far greater than
the required dimensions mentioned above.
It was further proved by Backeberg (1989) that this tunnel was successfully started at M = 1,8
and M = 3,0 with a model, having dimensions of127 mm x 127 mm x 1320 mm long, installed
in the test section
It is therefore clear that the test model under consideration, "Full-scale Porous", has
dimensions which did not pose any blockage problems to the starting of this tunnel.
References
Backeberg, P.M 1989. Experimental Determination ofMaximum Allowable Blockage
for an Intake Model in the DAST High Speed Wind-tunnel. Report DAST 89/37.
CSIR, Pretoria.
Pope, A & Gain, KL. 1965. High Speed Wind-tunnel Testing. John Wiley and Sons,
Inc. New York.

APPENDIX
cAERODYNAMIC DRAG DATA FOR WIND-TUNNEL TESTS
TABLE C.l: Nomenclature
1. Total Drag Force D, (N)
2. Dynamic Pressure q. (kPa)
3. Mach No. M..4. Full Mass Flow rh.
5. Captured Mass Flow rhc
6. Stagnation Temperature To (K)
7. Stagnation Pressure Bleed Chamber POB (kPa)
8. Bleed Mass Flow Rate mB (%)
9. Reynolds Number Re
10. Ambient Temperature T_ (K)
11. Atmospheric Pressure p... (kPa)
12. Test Section Static Pressure Ps (kPa)
13. Mass Flow Ratio mR = Iiz !rhc -
14. Total Drag Coefficient DfCd(
q. x 4253,69 x 10-6

C-2
Data were captured using the data recording system of the Aerotek Division of the CSIR in
Pretoria. Tests were carried out according to the logging system mentioned in Table C.2.
TABLE C.2 Log-sheet for Recording Test Data
Blow Mach Stag. Atmos. File Inlet Pitch Yaw Date
No. No. Press. Press. name ComlgUJ'ation « 13(psi)
5241 2,2 25,0 648,1 MAT-OOI Porous Throat 0 0 6/11196
5242 2,0 42,5 647,7 MAT-002 • • • •
5243 2,0 • 647,3 MAT-003 • • • •
5244 2,0 • 652,1 MAT-004 • • • 11111196
5245 2,0 • 652,1 MAT-005 • • • •
5250 2,0 • 648,3 MAT-006 • • • 19/11196
5251 2,0 • 649,7 MAT-007 • • • •
5252 2,0 • 649,5 MAT-008 · • • •
5253 2,0 • 649,5 MAT-009 • • • 20111196
5254 2,0 · 648,9 MAT·Q10 · · • •
5255 1,8 33,8 648,5 MAT-{)II • · · ·5256 2,2 54,4 648,3 MAT-{)12 • • • ·5257 2,4 68,5 647,9 MAT-{)13 • • • ·5258 2,3 60,4 647,9 MAT-{)14 • • • •
5259 2,3 60,4 649,9 MAT-{)15 · • · •
5260 2,3 60,4 649,2 MAT-{)16 • · • 21111196
5261 2,0 42,5 649,2 MAT-{)17 • • · •

C-3
The recorded test results were analysed and reduced to the data points given for each test Mach
number in the table below.
TABLE C.3: Corrected Test Data for various Mach Numbers
Test Mach Number = 1,8
Axial Force Stream Thrust Net Drag DragCoeff. mR PRcor
Measured
N N N %
-119 -321 115 0,22 0,70 71,
-129 -384 168 0,31 0,69 79
-134 -430 209 0,39 0,67 85
-123 -466 256 0,48 0,65 91
. -103 -501 311 0,58 0,63 97
Re = 42,01 x 10⁶/m
Tunnel stagnation pressure =320,34 kPa (abs)
Test section dynamic pressure = 126,50 kPa
Axial force due to chamber pressure =87 N
PRco< Stagnation pressure recovery corrected for subsonic diffusor before abrupt expansion
into duct ofinlet rig (Stockenstrom 1991).
Net Drag =(Axial force measured - Stream thrust) - (Force due to chamber pressure)
Negative sign denotes forces acting in upstream direction.

C-4
Test Mach Number = 2,0
Axial Force Stream Thrust Net Drag DragCoeff. mR P-Measured
N N N %
-139 -369 134 0,23 0.81 67
-212 -477 169 0,29 0.79 80
-218 -563 249 0,43 0,78 91
-201 -583 286 0,49 0,77 94
-178 -537 263 0,45 0,75 87
Re = 45,99 x 10⁶/m
Tunnel stagnation pressure = 380,33 kPa (abs)
Test section dynamic pressure = 136,00 kPa
Axial force due to chamber pressure = 96 N
Bleed rate = 8 %
Test Mach Number = 2,2
Axial Force Stream Thrust Net Drag Drag Coeff. mR PRaor
Measured
N N N %
-100 -358 176 0,28 0,86 57
-101 -453 270 0,43 0,85 66
-103 -520 335 0,54 0,83 72
-91 -532 359 0,58 0,81 73
-90 -536 364 0,58 0,79 73
Re = 51,04 x 10⁶/m
Tunnel stagnation pressure = 462,37 kPa (abs)
Test section dynamic pressure = 146,50 kPa
Axial force due to chamber pressure = 82 N
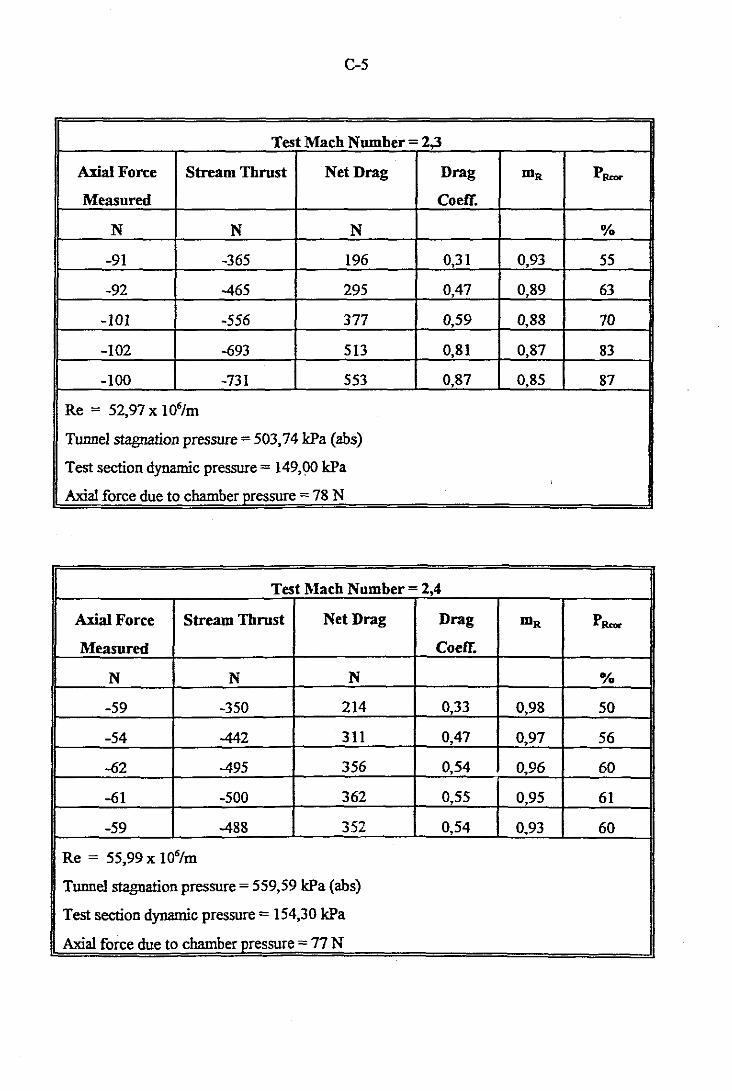
C-5
Test Mach Number = 2,3
Axial Foree Stream Thrust Net Drag Drag mR p-
Measured Coetr.
N N N %
-91 -365 196 0,31 0,93 55
-92 -465 295 0,47 0,89 63
-101 -556 377 0,59 0,88 70
-102 -693 513 0,81 0,87 83.
-100 -731 553 0,87 0,85 87
Re = 52,97 x 10⁶/m
Tunnel stagnation pressure = 503,74 kPa (ab5)
Test section dynamic pressure = 149,00 kPa
Axial force due to chamber pressure = 78 N
Test Mach Number = 2,4
Axial Foree Stream Thrust Net Drag Drag mR p-
Measured CoefT.
N N N %
-59 -350 214 0,33 0,98 50
-54 -442 31I 0,47 0,97 56
-62 -495 356 0,54 0,96 60
-61 -500 362 0,55 0,95 61
-59 -488 352 0,54 0,93 60
Re = 55,99 x 10⁶/m
Tunnell'tagnation pressure = 559,59 kPa (abs)
Test section dynamic pressure = 154,30 kPa
Axial force due to chamber pressure = 77 N

l -----
.- ---I --_
C-6
---I Control Volume, Vc - - - - - _
I II . I
-- ~----------------------_.-
I II I
-I --------
FlowDirection
----
Internal Duct, running through balance, and connecting subsonic diffuser to inlet rig
Figure C.I : Control Volume for Stream Thrust Calculations

C-7
Reference
Stockenstrom, A. 1991. Phase Four Supersonic Inlet Test. Somchem Report
No. 03982-000000-725030.