Embed Size (px)
Citation preview

1
advancing the pilbara
annual report 2013–2014

2 3
contents
Acknowledgement 3
Message from the Chairperson 5
The Pilbara Regional Council Governance Model 6
Appointed Representatives 8
Message from the Chief Executive Officer 10
Year in Review 12
Independent Audit Report 16
Statutory Reports 18
Financial Report 21
All photography by Paul Pichugin | paulpichugin.com

4 5
The Pilbara Regional Council (PRC) is certainly going from strength to strength, both in the range of services that it is offering to member local governments, and in the contribution that it is making to the Pilbara region.
Council has considered a diverse range of matters from a Pilbara regional perspective throughout the year. These matters have included population and workforce modeling, FIFO work practices and their impact on communities, regional defence, tourism and bureau services. With a stable and committed suite of Councillors in place, the PRC is well positioned to offer informed decision-making and to commit Council resources in areas of greatest need.
The year just past has seen the PRC taking a very active role in getting Pilbara issues into the press and onto the national political agenda. The CEO has developed relationships at senior levels on both sides of politics, and in both the House of Representatives and the Senate. These relationships have ensured that the views of the PRC have increasingly been sought for key issues, and resulted in at least one invitation to make submission to a Senate subcommittee inquiry.
At a State level, the PRC is now considered a trusted partner in all matters relating to Pilbara development; with regular interaction across a broad range of departments and other agencies. These relationships have driven a greater degree of consistency in messages coming from the Pilbara region, and the PRC has been active on the Pilbara Workforce Development Alliance and the Australia China Business Council.
The PRC executive team has excelled in delivering a challenging portfolio of projects on time and on budget, demonstrating that the investment of local governments in building the capacity of the PRC is now offering a commensurate return on that investment.
The coming year will come with its own challenges, however I am confident that the right team are now in place at both Council and executive levels to execute the PRC’s Strategic Community Plan successfully.
Cr Lynne Craigie Chairperson
message from the chairperson

6 7
The Councillors, Chief Executive Officer and staff, through a combined effort, are responsible for successfully leading and managing the PRC. The organisation is accountable to its member local governments, and regularly publishes detailed financial statements and project performance reports for the review of its members.
Councillors
The four local governments are represented by the eight-member Pilbara Regional Council. Two Councillors are nominated from each member local government, governing for the interests of their town or shire and for the broader Pilbara region.
CouncilThe Chairperson and seven Councillors establish the strategic context of the PRC and govern to ensure that key objectives are met. The Council monitors the activities of the CEO and management team and ensures that the PRC remains true to its Constitution, vision and mission.
Council MeetingsOrdinary meetings of the Council are held primarily at the State Library in Perth, as well as in the Pilbara. Members of the public are welcome to attend Council meetings and are able to pose questions on specific issues of concern.
Chief Executive OfficerA Chief Executive Officer is employed by the Council to deliver the functions of the local government, and to service the requirements of members. The CEO employs a staff to deliver services and carry out directions of the Council. The CEO is responsible for all operational aspects of the PRC, and is accountable to the Council for the performance of the organisation.
External AdvisorsThe PRC engages a number of specialist external advisors to assist in the management of its affairs. These advisors include auditors, legal counsel, project managers, financial advisors, information technology support, et al.
ContractorsAs a project-driven member services organisation, the PRC engages contractors to deliver components of most projects. All contractors work within the Council’s project governance framework, and under the specific direction of a nominated project manager.
governance model
Town of Port HedlandShire of Ashburton City of KarrathaShire of East Pilbara

8 9
appointed representatives
Cr K
elly Howlett (Mayor)
Cr G
loria Jacobs
Cr F
iona White-Hartig
Cr P
eter Long (Mayor)
Cr Ly
nne Craigie (Shire President)
Cr A
nita Grace
Cr Kerry White
Cr K
er
ry White (Shire President)
Cr Lo
rraine Thomas
2013/2014

10 11
2014 was an exciting year for the Pilbara Regional Council, with a raft of new projects and a significant maturing of the team in both capacity and capability.
With the new Federal Government establishing its policy platforms, significant effort has been devoted to establishing Ministerial and advisor level relationships to further our advocacy. The Chair, CEO and Deputy CEO have all spent time at Parliament seeking discussions with a variety of Ministers and their staff. These efforts have been reflected in the Pivot North report, with many PRC advocacy objectives receiving specific treatment in the document.
The PRC engaged a specialist social media manager during 2014 to begin exploring social media as an advocacy platform. The results have been stunning, with the PRC quickly establishing itself as an ‘influential’ Twitter user, able to reach both broad and targeted stakeholder communities extremely efficiently.
Advocacy work continues towards the implementation of two long-term development enablers for the Pilbara.
The Pilbara Enterprise Zone will be Australia’s first, driving additional diversified investment in the region.
The PEZ will seek to capture greater value-adding and high technology investment associated with the resources supply chain. It will enable fast-tracked/pre-approved development to target industries and activities, and generate greater investment security (particularly for foreign investors).
This will require federal support via a separate, defined legislative act.
The Pilbara Designated Area Migration Agreement will provide more flexibility to SME employers in times of peak economic activity, enabling them to source international staff on short-term visas as do large resource companies.
The 2014 Pilbara Kimberley Forum, held in Jakarta, featured an impressive program of more than sixty federal, state and local politicians, along with business leaders from Australia and Indonesia. Held over three days, the event included a broad spectrum of official and cultural opportunities. Special thanks to the Australian Ambassador to Indonesia for giving freely of his time and expertise to support the event, and for speaking with a special delegation of attendees on doing business in Indonesia.
These activities are, of course, in addition to the PRC’s day-to-day function of providing many regional projects and bureau services for our members – all of which were delivered on time and on budget. We are very proud of our project delivery record, based on good governance and a commitment to tangible results.
Our success is thanks to the dedication and expertise of our staff, contractors, service providers and media partners.
I would also like to acknowledge and thank the Councillors of the Pilbara Regional Council, and my fellow Chief Executive Officers. I look forward to continuing this collegiate relationship in the coming years, and to delivering clear and measurable value to Pilbara communities.
Tony Friday Chief Executive Officer
message from the cEO

12 13
The PRC delivers services that strengthen our member councils. As we grow, delivering valuable services to our member councils is our focus. We help them to improve their strategic and operational performance, through initiatives such as project and contract management, human resources strategies, workforce planning and improved asset management.
The Future
• Improved project and contract management
• Enhanced asset management
• More effective operational processes
• Means of measuring and monitoring performance
• Improved ability to attract, reward and retain quality staff
The PRC has an important role to play in championing the interests of the Pilbara at state, national and international levels. In FY13, we focused on developing positive partnerships with external stakeholders that would allow us to drive improvements on behalf of Pilbara communities. The PRC already has an active stakeholder engagement and advocacy model that provides a powerful voice to communicate the needs of the Pilbara. We have strengthened our reputation as an influential local government that engages constructively with government and industry. Over the next few years we will continue to develop our presence through an emphasis on stakeholder engagement, establishing and maintaining meaningful partnerships and providing a strong voice to policy-making processes.
The Future
• United and defined policy positions
• A recognised, credible PRC brand
• A defined tourism strategy
• Better relationships with our stakeholders
Challenges
• Competing resource demands influencing the success level of new operational practices
• Competing member council demands
• The need to obtain additional funding to underpin delivery of the strategies
During FY14
• Manufactured and installed 15 individual roadside rest stops with stunning Aboriginal artwork.
• Activated Wi-Fi Hotspots in 12 remote locations.
• Supported regional infrastructure with 10 sullage points and 20 public toilets.
• Manufactured and installed 22 Welcome signs featuring nearby attractions, native language groups and traditional land-owners associated with each area.
Challenges
• Securing a unified position on complex issues and within a changing political landscape
• Differentiating ourselves from other Pilbara regional bodies
• The need to obtain additional funding to underpin delivery of the strategies
During FY14
• Hosted a high-profile economic diversification and investment attraction event for the Pilbara and Kimberley regions in Jakarta.
• Prepared a submission and gave evidence to the Joint Select Committee on Northern Australia.
• Helped to develop the Pilbara Tourism Development Plan, and participated in community consultation and the tourism roadshow for the Plan.
• Participated in the Pilbara Workforce Development Alliance.
• Submitted the Designated Area Migration Agreement.
• Developed a Pilbara Research Online portal.
year in review
Key Result Area 1 | Regional Service Delivery Key Result Area 2 | A Voice for the Pilbara

14 15
The PRC strives to create and deliver funding for the Pilbara that is commensurate with the region’s contribution to Australia. This key result area recognises the pivotal role the Pilbara region plays in the national economy. It involves providing tangible benefits to Pilbara communities in the form of increased funding for high-quality, sustainable projects. To achieve this over the next three years the PRC will deliver a range of innovative projects, such as securing public/private partnerships and exploring new revenue streams that will allow us to become more flexible and responsive to our member councils and Pilbara communities.
The Future
• Increased funding for community projects
• Diverse and sustainable revenue streams for the PRC
The efficiency and effectiveness resulting from good governance is vital to the long-term success of the PRC and its member councils. We play a leadership role in driving the adoption of good practices across our member councils, in fostering effective knowledge-sharing to reduce costs, and in celebrating successes.
The Future
• More effective governance practices across member councils
• Ability to think strategically about the application of our finite resources
• The ability to measure and continually improve standards of governance
• Increased communication and leveraging of best practices
Challenges
• Establishing credibility with external stakeholders
• Securing funding in a challenging economic environment
• Developing a culture that acknowledges the strategic importance of industry alliances
During FY14
• Led the procurement cycle for Airport Screening Equipment and Management Services on behalf of the three Pilbara Airports.
• Secured $177,000 from the Department of Local Government to implement a regional business plan.
• Piloted the regionalisation of payroll management functions to reduce cost and complexity.
• Secured $4.1M in Country Local Government Funding under the Royalties for Regions program for the Land De-Constraint project.
year in review >>
Key Result Area 3 | Economic Value Key Result Area 4 | EFFICIENCY & EFFECTIVENESS
Challenges
• Growth whilst operating with constrained resources
• The need to enhance current levels of communication and information sharing between member councils
• Building capacity within member councils to adopt the governance frameworks
During FY14
• Delivered a set of risk-driven and tailored business continuity plans to all Pilbara LGAs.
• Investigated efficiencies to be gained aligning local laws and planning policies.
• Assessed and measured the likely benefits of changing to an online buildings and approvals system.
• Developed the Pilbara Coastal Access Toolkit for LGAs.
• Secured $142,000 from the Department of Transport for environmental, engineering and heritage impact assessments and the design of a boat access ramp at the Secret Creek PAR.

16 17
Independent Audit ReportFOR YEAR ENDED 30TH JUNE 2014
Level 1 10 Kings Park Road
West Perth WA 6005
Correspondence to: PO Box 570
West Perth WA 6872
T +61 8 9480 2000 F +61 8 9322 7787
E [email protected] www.grantthornton.com.au
We have audited the accompanying financial report of the Pilbara Regional Council (the “Council”), which comprises the statement of financial position as at 30 June 2014, the statement of comprehensive income by nature or type, statement of comprehensive income by program, statement of changes in equity and statement of cash flows for the year then ended, notes comprising a summary of significant accounting policies and other explanatory information to the financial report and the statement by the Chief Executive Officer.
Responsibility of the Council for the financial report
The Council of the Pilbara Regional Council is responsible for the preparation and fair presentation of the financial report in accordance with Australian Accounting Standards (including the Australian Accounting Interpretations) and the Local Government Act 1995 Part 6. This responsibility includes establishing and maintaining internal control relevant to the preparation and fair presentation of the financial report that is free from material misstatement, whether due to fraud or error; selecting and applying appropriate accounting policies; and making accounting estimates that are reasonable in the circumstances.
Auditor’s responsibility
Our responsibility is to express an opinion on the financial report based on our audit. We conducted our audit in accordance with Australian Auditing Standards. These Auditing Standards require that we comply with relevant ethical requirements relating to audit engagements and plan and perform the audit to obtain reasonable assurance whether the financial report is free from material misstatement.
An audit involves performing procedures to obtain audit evidence about the amounts and disclosures in the financial report. The procedures selected depend on the auditor’s judgement, including the assessment of the risks of material misstatement of the financial report, whether due to fraud or error. In making those risk assessments, the auditor considers internal control relevant to the entity’s preparation and fair presentation of the financial report in order to design audit procedures that are appropriate in the circumstances, but not for the purpose of expressing an opinion on the effectiveness of the entity’s internal control. An audit also includes evaluating the appropriateness of accounting policies used and the reasonableness of accounting estimates made by the Council, as well as evaluating the overall presentation of the financial report.
Grant Thornton Audit Pty Ltd ACN 130 913 594 a subsidiary or related entity of Grant Thornton Australia Ltd ABN 41 127 556 389‘Grant Thornton’ refers to the brand under which the Grant Thornton member firms provide assurance, tax and advisory services to their clients and/or refers to one or more member firms, as the context requires. Grant Thornton Australia Ltd is a member firm of Grant Thornton International Ltd (GTIL). GTIL and the member firms are not a worldwide partnership. GTIL and each member firm is a separate legal entity. Services are delivered by the member firms. GTIL does not provide services to clients. GTIL and its member firms are not agents of, and do not obligate one another and are not liable for one another’s acts or omissions. In the Australian context only, the use of the term ‘Grant Thornton’ may refer to Grant Thornton Australia Limited ABN 41 127 556 389 and its Australian subsidiaries and related entities. GTIL is not an Australian related entity to Grant Thornton Australia Limited.
Liability limited by a scheme approved under Professional Standards Legislation. Liability is limited in those States where a current scheme applies.
Independent Auditor’s Report To the Members of the Pilbara Regional Council
We performed the procedures to assess whether in all material respects the financial report presents fairly, in accordance with the Local Government Act 1995 Part 6 and Australian Accounting Standards (including the Australian Accounting Interpretations), a view which is consistent with our understanding of the Council’s financial position and of its performance.
We believe that the audit evidence we have obtained is sufficient and appropriate to provide a basis for our audit opinion.
Independence
In conducting our audit, we have complied with the applicable independence requirements of the Accounting Professional and Ethical Standards Board.
Auditor’s opinion
In our opinion, the financial report of the Pilbara Regional Council:
(i) gives a true and fair view of the Council’s financial position as at 30 June 2014 and of its performance for the financial year ended 30 June 2014;
(ii) complies with Australian Accounting Standards (including the Australian Accounting Interpretations); and
(iii) is prepared in accordance with the requirements of the Local Government Act 1995 Part 6 (as amended) and Regulations under that Act.
Statutory Compliance
I did not, during the course of my audit, become aware of any instance where the Council did not comply with the requirements of the Local Government Act 1995 and Local Government (Financial Management) Regulations 1996 as they relate to financial statements.
GRANT THORNTON AUDIT PTY LTD
Chartered Accountants
M A Petricevic
Partner - Audit & Assurance Perth, 14 October 2014

18 19
Freedom of Information
In accordance with Section 96 and 97 of the Freedom of Information Act 1992, Council is required to publish an Information Statement which details the process of applying for information under the Act, as well as information that the Council provides outside the Act. During 2013/14 the PRC received no applications under the Freedom of Information Act 1992.
Disability Access and Inclusion Plan
The Pilbara Regional Council has developed a Disability Access and Inclusion Plan to ensure that people with disabilities are included and can access and use facilities, services and functions provided by the PRC.
The plan is reviewed biennially, at which time it may be amended and extended as new strategies are identified and priorities change. For the purposes of this Plan, the World Health Organisation’s definition of disability is utilised: “Disability is a loss or reduction of functional ability which results from an impairment. An impairment is defined as an anatomical or functional abnormality or loss which may or may not result in a disability.”
The PRC DAIP includes:
1. Principles applicable to people with disabilities;
2. A disability anti-discrimination statement;
3. Functions, facilities and services provided by the PRC;
4. A statement of Outcomes relevant to this Plan; and
5. Strategies to improve access and inclusion in the PRC
The PRC DAIP can be accessed via Council¹s website at www.prc.wa.gov.au
National Competition Policy
Under the terms of the Competition Principles Agreement between the Commonwealth and the States, Local Governments, including Regional Councils, are required to report on their operations in relation to competition principles, in order to determine whether any inequities occur. In the event that there are any areas found where competition principles are not equitable, the Local Government is required to provide a plan for achieving competitive neutrality or determine why it is in the best interests of the community for the inequity to continue. The Pilbara Regional Council did not, during the 2013/2014 financial year, engage in any activities which affected competitive neutrality.
Legislation Review
The Pilbara Regional Council has no legislation in place that is subject to review.
statutory reports

20 21
financial report
Public Interest Disclosure Act
The Pilbara Regional Council did not have any reportable matters relating to the Public Interest Disclosure Act.
Payments to Employees
In accordance with the requirements of s19B of the Local Government (Administration) Regulations 1996 (as amended), there is one employee of the Pilbara Regional Council entitled to a salary of $100,000 or more.
Purchasing Policy
The Regional Council maintained compliance with the Local Government Act, for all purchases of goods and/or services ensuring consistency and value for money for all purchasing activities.
State Records Act
Being a very small authority, records are maintained in a paper format with some electronic records. The State Records Act 2000 states that an organisation must review its Plan within five years of the approval date. The PRC reviewed its Record Keeping Plan in 2011/2012 and received approval of its Record Keeping Plan from the State Records Commission in March 2012.
Conduct of Certain Officials – Local Government Act 1995
Section 5.53 of the Local Government Act states that the annual report is to contain details of entries made under section 5.121 during the financial year in the register of complaints. For the 2013-2014 financial year, there were no entries made in the Register of Complaints.
statutory reports >>

22 23
Statement by Chief Executive Officer 23
Statement of Comprehensive Income by Nature or Type 24
Statement of Comprehensive Income by Program 25
Statement of Financial Position 26
Statement of Changes in Equity 27
Statement of Cash Flows 28
Rate Setting Statement 29
Notes to and Forming Part of the Financial Report 30
statement by the ceocontents
The attached financial report of the Pilbara Regional Council being the annual financial report and other information for the financial year ended 30 June 2014 are in my opinion properly drawn up to present fairly the financial position of the Pilbara Regional Council at 30th June 2014 and the results of the operations for the financial year then ended in accordance with the Australian Accounting Standards and comply with the provisions of the Local Government Act 1995 and the regulations under that Act.
Signed on the 15th day of October 2014
Anthony Friday Chief Executive Officer

24 25
statement of comprehensive income by programFOR YEAR ENDED 30TH JUNE 2014
NOTE 2014 2014 2013$ Budget $
$
RevenueGovernance 4,651,068 1,023,000 1,159,469General Purpose Funding 96,781 55,000 79,337Economic Services 84,000 0 3,714,103
4,831,849 1,078,000 4,952,909
ExpensesGovernance (1,119,226) (1,584,823) (740,736)Economic Services (2,584,838) (4,269,719) (1,748,192)
(3,704,064) (5,854,542) (2,488,928)
Financial Costs 0 0 00 0 0
Non-Operating Grants, Subsidies and Contributions 0 0 00 0 0
Profit/(Loss) on Disposal of AssetsGovernance (2,897) 0 (8,712)
(2,897) 0 (8,712)
Net Result 1,124,888 (4,776,542) 2,455,269
Other Comprehensive IncomeChanges on revaluation of non-current assets 10 0 0 0Total Other Comprehensive Income 0 0 0
Total Comprehensive Income 1,124,888 (4,776,542) 2,455,269
This statement is to be read in conjunction with the accompanying notes.
statement of comprehensive income by nature or typeFOR YEAR ENDED 30TH JUNE 2014
NOTE 2014 2014 2013$ Budget $
$RevenueOperating Grants, Subsidies and Contributions 26 4,735,068 1,023,000 4,872,886Interest Earnings 2(a) 96,781 55,000 79,337Other Revenue 0 0 686
4,831,849 1,078,000 4,952,909
ExpensesEmployee Costs (443,074) (353,600) (248,040)Materials and Contracts (3,127,944) (5,341,242) (2,160,489)Utility Charges (739) (2,500) (6,104)Depreciation on Non-Current Assets 2(a) (4,571) (3,000) (4,104)Insurance Expenses (16,123) (20,000) (16,984)Other Expenditure (111,613) (134,200) (53,207)
(3,704,064) (5,854,542) (2,488,928)1,127,785 (4,776,542) 2,463,981
Loss on Asset Disposal 19 (2,897) 0 (8,712)
Net Result 1,124,888 (4,776,542) 2,455,269
Other Comprehensive Income
Changes on revaluation of non-current assets 10 0 0 0
Total Other Comprehensive Income 0 0 0
Total Comprehensive Income 1,124,888 (4,776,542) 2,455,269
This statement is to be read in conjunction with the accompanying notes.

26 27
statement of changes in equityFOR YEAR ENDED 30TH JUNE 2014
ReservesRetained Cash Revaluation Total
NOTE Surplus Backed Surplus Equity$ $ $ $
Balance as at 1 July 2012 3,099,632 0 0 3,099,632
Comprehensive IncomeNet Result 2,455,269 0 0 2,455,269Total Comprehensive Income 2,455,269 0 0 2,455,269
Balance as at 30 June 2013 5,554,901 0 0 5,554,901
Comprehensive IncomeNet Result 1,124,888 0 0 1,124,888Total Other Comprehensive Income 1,124,888 0 0 1,124,888
Balance as at 30 June 2014 6,679,789 0 0 6,679,789
This statement is to be read in conjunction with the accompanying notes.
NOTE 2014 2013$ $
Current AssetsCash and Cash Equivalents 3 6,999,735 6,307,346Trade and Other Receivables 4 31,044 163,125Total Current Assets 7,030,779 6,470,471
Non-Current AssetsProperty, Plant And Equipment 5 15,972 8,085Total Non-Current Assets 15,972 8,085
Total Assets 7,046,751 6,478,556
Current LiabilitiesTrade And Other Payables 6 344,299 920,843Provisions 8 11,750 1,302Total Current Liabilities 356,049 922,145
Non-Current LiabilitiesProvisions 8 10,913 1,510Total Non-Current Liabilities 10,913 1,510
Total Liabilities 366,962 923,6556,679,789 5,554,901
EquityRetained Surplus 6,679,789 5,554,901Total Equity 6,679,789 5,554,901
This statement is to be read in conjunction with the accompanying notes.
STATEMENT OF FINANCIAL POSITIONAS AT 30TH JUNE 2014

28 29
RATE SETTING STATEMENTFOR YEAR ENDED 30TH JUNE 2014
NOTE 2014 2014 2013Actual Budget Actual
$ $ $RevenueGovernance 4,651,068 1,023,000 1,159,470General Purpose Funding 96,781 55,000 79,337Economic Services 84,000 0 3,714,103
4,831,849 1,078,000 4,952,910ExpensesGovernance (1,122,123) (1,584,823) (749,448)Economic Services (2,584,838) (4,269,719) (1,748,193)
(3,706,961) (5,854,542) (2,497,641)
Net Result Excluding Rates 1,124,888 (4,776,542) 2,455,269
Adjustments for Cash Budget Requirements:(Profit)/Loss on Asset Disposals 19 2,897 0 8,712Movement in Employee Benefit Provisions (Non-Current) 9,403 1,000 662Depreciation and Amortisation on Assets 2(a) 4,571 3,000 4,104Capital Expenditure and RevenuePurchase Furniture and Equipment 5(a) (16,209) (3,746)Proceeds from Disposal of Fixed Assets 19 855 0 8,182
Estimated Surplus/(Deficit) July 1 B/Fwd 20(b) 5,548,325 5,635,576 3,075,142Estimated Surplus/(Deficit) June 30 C/Fwd 20(b) 6,674,730 863,034 5,548,325
Total Amount Raised from General Rate 20 0 0 0
This statement is to be read in conjunction with the accompanying notes.
ADDLESS
STATEMENT OF CASH FLOWSFOR YEAR ENDED 30TH JUNE 2014
NOTE 2014 2014 2013$ Budget $
$Cash Flows From Operating ActivitiesReceiptsOperating Grants, Subsidies and Contributions 4,867,149 1,273,525 4,737,447Interest Earnings 96,781 55,000 79,337Goods and Services Tax 0 330,000 770,541
4,963,930 1,658,525 5,587,325PaymentsEmployee Costs (404,978) (363,335) (259,481)Materials and Contracts (3,462,340) (5,991,690) (1,591,167)Utility Charges (739) (2,500) (5,100)Insurance Expenses (16,123) (20,000) (16,984)Goods and Services Tax (260,394) (591,112) (488,175)Other Expenditure (111,613) (134,200) (59,200)
(4,256,187) (7,102,837) (2,420,107)Net Cash Provided By (Used In)Operating Activities 12(b) 707,743 (5,444,312) 3,167,218
Cash Flows from Investing ActivitiesPayments for Purchase of Property, Plant & Equipment (16,209) 0 (3,746)Proceeds from Sale of Fixed Assets 855 0 8,182Net Cash Provided By (Used In)Investment Activities (15,354) 0 4,436
Net Cash Provided By (Used In)Financing Activities 0 0 0
Net Increase (Decrease) in Cash Held 692,389 (5,444,312) 3,171,654Cash at Beginning of Year 6,307,346 6,307,346 3,135,692Cash and Cash Equivalents at the End of the Year 12(a) 6,999,735 863,034 6,307,346
This statement is to be read in conjunction with the accompanying notes.

30 31
Cash flows are presented on a gross basis. The GST components of cash flows arising from investing or financing activities which are recoverable from, or payable to, the ATO are presented as operating cash flows.
(c) Cash and Cash Equivalents
Cash and cash equivalents include cash on hand, cash at bank, deposits available on demand with banks and other short term highly liquid investments that are readily convertible to known amounts of cash and which are subject to an insignificant risk of changes in value and bank overdrafts.
Bank overdrafts are reported as short term borrowings in current liabilities in the statement of financial position.
(d) Trade and Other Receivables
Trade and other receivables include amounts due from ratepayers for unpaid rates and service charges and other amounts due from third parties for goods sold and services performed in the ordinary course of business.
Receivables expected to be collected within 12 months of the end of the reporting period are classified as current assets. All other receivables are classified as non-current assets.
Collectability of trade and other receivables is reviewed on an ongoing basis. Debts that are known to be uncollectable are written off when identified. An allowance for doubtful debts is raised when there is objective evidence that they will not be collectable.
1. significant accounting policies
(a) Basis of Preparation
The financial report comprises general purpose financial statements which have been prepared in accordance with Australian Accounting Standards (as they apply to local governments and not-for-profit entities), Australian Accounting Interpretations, other authoritative pronouncements of the Australian Accounting Standards Board, the Local Government Act 1995 and accompanying regulations. Material accounting policies which have been adopted in the preparation of this financial report are presented below and have been consistently applied unless stated otherwise.
Except for cash flow and rate setting information, the report has also been prepared on the accrual basis and is based on historical costs, modified, where applicable, by the measurement at fair value of selected non-current assets, financial assets and liabilities.
Critical Accounting Estimates
The preparation of a financial report in conformity with Australian Accounting Standards requires management to make judgements, estimates and assumptions that effect the application of policies and reported amounts of assets and liabilities, income and expenses.
The estimates and associated assumptions are based on historical experience and various other factors that are believed to be reasonable under the circumstances; the results of which form the basis of making the judgements about carrying values of assets and liabilities that are not readily apparent from other sources. Actual results may differ from these estimates.
The Local Government Reporting Entity
All Funds through which the Council controls resources to carry on its functions have been included in the financial statements forming part of this financial report.
In the process of reporting on the local government as a single unit, all transactions and balances between those funds (for example, loans and transfers between Funds) have been eliminated.
The Pilbara Regional Council does not have any monies held in a Trust Fund.
(b) Goods and Services Tax (GST)
Revenues, expenses and assets are recognised net of the amount of GST, except where the amount of GST incurred is not recoverable from the Australian Taxation Office (ATO).
Receivables and payables are stated inclusive of GST receivable or payable. The net amount of GST recoverable from, or payable to, the ATO is included with receivables or payables in the statement of financial position.
notes to and forming part of the financial reportFOR YEAR ENDED 30TH JUNE 2014

32 33
Revaluation
Increases in the carrying amount arising on revaluation of assets are credited to a revaluation surplus in equity. Decreases that offset previous increases of the same asset are recognised against revaluation surplus directly in equity. All other decreases are recognised in profit or loss.
Transitional Arrangements
During the time it takes to transition the carrying value of non-current assets from the cost approach to the fair value approach, the Council may still be utilising both methods across differing asset classes.
Those assets carried at cost will be carried in accordance with the policy detailed in the Initial Recognition section as detailed above.
Those assets carried at fair value will be carried in accordance with the Revaluation Methodology section as detailed above.
Early Adoption of AASB 13 - Fair Value Measurement
Whilst the new accounting standard in relation to Fair Value, AASB 13 – Fair Value Measurement only became applicable for the year ended 30 June 2014 (in relation to Council), given the legislative need to commence using Fair Value methodology in the previous reporting period (year ended 30 June 2013) the Council chose to early adopt AASB 13
As a consequence, the principles embodied in AASB 13 - Fair Value Measurement have been applied to the previous reporting period (year ended 30 June 2013).
Land Under Roads
In Western Australia, all land under roads is Crown Land, the responsibility for managing which, is vested in the local government.
Effective as at 1 July 2008, Council elected not to recognise any value for land under roads acquired on or before 30 June 2008. This accords with the treatment available in Australian Accounting Standard AASB 1051 Land Under Roads and the fact Local Government (Financial Management) Regulation 16(a)(i) prohibits local governments from recognising such land as an asset.
In respect of land under roads acquired on or after 1 July 2008, as detailed above, Local Government (Financial Management) Regulation 16(a)(i) prohibits local governments from recognising such land as an asset.
Whilst such treatment is inconsistent with the requirements of AASB 1051, Local Government (Financial Management) Regulation 4(2) provides, in the event of such an inconsistency, the Local Government (Financial Management) Regulations prevail.
Consequently, any land under roads acquired on or after 1 July 2008 is not included as an asset of the Council.
Depreciation
The depreciable amount of all fixed assets including buildings but excluding freehold land, are depreciated on a straight-line basis over the individual asset’s useful life from the time the asset is held ready for use. Leasehold improvements are depreciated over the shorter of either the unexpired period of the lease or the estimated useful life of the improvements.
1. significant accounting policies >>
(e) Fixed Assets
Each class of fixed assets within either property, plant and equipment or infrastructure, is carried at cost or fair value as indicated less, where applicable, any accumulated depreciation and impairment losses.
Mandatory Requirement to Revalue Non-Current Assets
Effective from 1 July 2012, the Local Government (Financial Management) Regulations were amended and the measurement of non-current assets at Fair Value became mandatory.
The amendments allow for a phasing in of fair value in relation to fixed assets over three years as follows:
(a) for the financial year ending on 30 June 2013, the fair value of all of the assets of the local government that are plant and equipment; and
(b) for the financial year ending on 30 June 2014, the fair value of all of the assets of the local government -
(i) that are plant and equipment; and (ii) that are - (I) land and buildings; or (II) infrastructure; and
(c) for a financial year ending on or after 30 June 2015, the fair value of all of the assets of the local government.
Thereafter, in accordance with the regulations, each asset class must be revalued at least every 3 years.
In 2013, Council commenced the process of adopting Fair Value in accordance with the Regulations.
Relevant disclosures, in accordance with the requirements of Australian Accounting Standards, have been made in the financial report as necessary.
Initial Recognition and Measurement between Mandatory Revaluation Dates
All assets are initially recognised at cost and subsequently revalued in accordance with the mandatory measurement framework detailed above.
In relation to this initial measurement, cost is determined as the fair value of the assets given as consideration plus costs incidental to the acquisition. For assets acquired at no cost or for nominal consideration, cost is determined as fair value at the date of acquisition. The cost of non-current assets constructed by the Council includes the cost of all materials used in construction, direct labour on the project and an appropriate proportion of variable and fixed overheads.
Individual assets acquired between initial recognition and the next revaluation of the asset class in accordance with the mandatory measurement framework detailed above, are carried at cost less accumulated depreciation as management believes this approximates fair value. They will be subject to subsequent revaluation at the next anniversary date in accordance with the mandatory measurement framework detailed above.
notes to and forming part of the financial report >>FOR YEAR ENDED 30TH JUNE 2014

34 35
Fair Value Hierarchy
AASB 13 requires the disclosure of fair value information by level of the fair value hierarchy, which categorises fair value measurement into one of three possible levels based on the lowest level that an input that is significant to the measurement can be categorised into as follows:
Level 1
Measurements based on quoted prices (unadjusted) in active markets for identical assets or liabilities that the entity can access at the measurement date.
Level 2
Measurements based on inputs other than quoted prices included in Level 1 that are observable for the asset or liability, either directly or indirectly.
Level 3
Measurements based on unobservable inputs for the asset or liability.
The fair values of assets and liabilities that are not traded in an active market are determined using one or more valuation techniques. These valuation techniques maximise, to the extent possible, the use of observable market data. If all significant inputs required to measure fair value are observable, the asset or liability is included in Level 2. If one or more significant inputs are not based on observable market data, the asset or liability is included in Level 3.
Valuation techniques
The Council selects a valuation technique that is appropriate in the circumstances and for which sufficient data is available to measure fair value. The availability of sufficient and relevant data primarily depends on the specific characteristics of the asset or liability being measured. The valuation techniques selected by the Council are consistent with one or more of the following valuation approaches:
Market approach
Valuation techniques that use prices and other relevant information generated by market transactions for identical or similar assets or liabilities.
Income approach
Valuation techniques that convert estimated future cash flows or income and expenses into a single discounted present value.
Cost approach
Valuation techniques that reflect the current replacement cost of an asset at its current service capacity.
Each valuation technique requires inputs that reflect the assumptions that buyers and sellers would use when pricing the asset or liability, including assumptions about risks. When selecting a valuation technique, the Council gives priority to those techniques that maximise the use of observable inputs and minimise the
use of unobservable inputs. Inputs that are developed using market data (such as publicly available information on actual transactions) and reflect the assumptions that buyers and sellers would generally use when pricing the asset or liability are considered observable, whereas inputs for which market data is not available and therefore are developed using the best information available about such assumptions are considered unobservable.
As detailed above, the mandatory measurement framework imposed by the Local Government (Financial Management) Regulations requires, as a minimum, all assets carried at a revalued amount to be revalued at least every 3 years.
1. significant accounting policies >>
(e) Fixed Assets (Continued)
When an item of property, plant and equipment is revalued, any accumulated depreciation at the date of the revaluation is treated in one of the following ways:
a) Restated proportionately with the change in the gross carrying amount of the asset so that the carrying amount of the asset after revaluation equals its revalued amount; or
b) Eliminated against the gross carrying amount of the asset and the net amount restated to the revalued amount of the asset.
Major depreciation periods used for each class of depreciable asset are:
Furniture and (Internal) Equipment
- computers and peripherals 32% 4 to 10 years - other electronic equipment 18% 4 to 10 years - furniture 9% 4 to 10 years
The assets residual values and useful lives are reviewed, and adjusted if appropriate, at the end of each reporting period.
An asset’s carrying amount is written down immediately to its recoverable amount if the asset’s carrying amount is greater than its estimated recoverable amount.
Gains and losses on disposals are determined by comparing proceeds with the carrying amount. These gains and losses are included in the statement of comprehensive income in the period in which they arise.
When revalued assets are disposed of, amounts included in the revaluation surplus relating to that asset are transferred to retained surplus.
Capitalisation Threshold
Expenditure on items of equipment under $5,000 is not capitalised. Rather, it is recorded on an asset inventory listing.
(f) Fair Value of Assets and LiabilitiesWhen performing a revaluation, the Council uses a mix of both independent and management valuations using the following as a guide:
Fair Value is the price that Council would receive to sell the asset or would have to pay to transfer a liability, in an orderly (i.e. unforced) transaction between independent, knowledgeable and willing market participants at the measurement date.
As fair value is a market-based measure, the closest equivalent observable market pricing information is used to determine fair value. Adjustments to market values may be made having regard to the characteristics of the specific asset. The fair values of assets that are not traded in an active market are determined using one or more valuation techniques. These valuation techniques maximise, to the extent possible, the use of observable market data.
To the extent possible, market information is extracted from either the principal market for the asset
(i.e. the market with the greatest volume and level of activity for the asset or, in the absence of such a market, the most advantageous market available to the entity at the end of the reporting period (i.e. the market that maximises the receipts from the sale of the asset after taking into account transaction costs and transport costs).
For non-financial assets, the fair value measurement also takes into account a market participant’s ability to use the asset in its highest and best use or to sell it to another market participant that would use the asset in its highest and best use.
notes to and forming part of the financial report >>FOR YEAR ENDED 30TH JUNE 2014

36 37
1. significant accounting policies >>
(g) Financial Instruments
Initial Recognition and Measurement
Financial assets and financial liabilities are recognised when the Council becomes a party to the contractual provisions to the instrument. For financial assets, this is equivalent to the date that the Council commits itself to either the purchase or sale of the asset (i.e. trade date accounting is adopted).
Financial instruments are initially measured at fair value plus transaction costs, except where the instrument is classified ‘at fair value through profit or loss’, in which case transaction costs are expensed to profit or loss immediately.
Classification and Subsequent Measurement
Financial instruments are subsequently measured at fair value, amortised cost using the effective interest rate method, or at cost.
Amortised cost is calculated as:
(a) the amount in which the financial asset or financial liability is measured at initial recognition;
(b) less principal repayments and any reduction for impairment; and
(c) plus or minus the cumulative amortisation of the difference, if any, between the amount initially recognised and the maturity amount calculated using the effective interest rate method.
The effective interest method is used to allocate interest income or interest expense over the relevant period and is equivalent to the rate that discounts estimated future cash payments or receipts (including fees, transaction costs and other premiums or discounts) through the expected life (or when this cannot be reliably predicted, the contractual term) of the financial instrument to the net carrying amount of the financial asset or financial liability. Revisions to expected future net cash flows will necessitate an adjustment to the carrying value with a consequential recognition of an income or expense in profit or loss.
(i) Financial assets at fair value through profit and loss
Financial assets are classified at “fair value through profit or loss” when they are held for trading for the purpose of short-term profit taking. Such assets are subsequently measured at fair value with changes in carrying amount being included in profit or loss. Assets in this category are classified as current assets.
(ii) Loans and receivables
Loans and receivables are non-derivative financial assets with fixed or determinable payments that are not quoted in an active market and are subsequently measured at amortised cost. Gains or losses are recognised in profit or loss.
Loans and receivables are included in current assets where they are expected to mature within 12 months after the end of the reporting period.
(iii) Held-to-maturity investments
Held-to-maturity investments are non-derivative financial assets with fixed maturities and fixed or determinable payments that the Council has the positive intention and ability to hold to maturity. They are subsequently measured at amortised cost. Gains or losses are recognised in profit or loss.
Held-to-maturity investments are included in non-current assets, where they are expected to mature within 12 months after the end of the reporting period. All other investments are classified as non- current.
(iv) Available-for-sale financial assets
Available-for-sale financial assets are non-derivative financial assets that are either not suitable to be classified into other categories of financial assets due to their nature, or they are designated as such by management.
notes to and forming part of the financial report >>FOR YEAR ENDED 30TH JUNE 2014
They comprise investments in the equity of other entities where there is neither a fixed maturity nor fixed or determinable payments.
They are subsequently measured at fair value with changes in such fair value (i.e. gains or losses) recognised in other comprehensive income (except for impairment losses). When the financial asset is derecognised, the cumulative gain or loss pertaining to that asset previously recognised in other comprehensive income is reclassified into profit or loss.
Available-for-sale financial assets are included in current assets, where they are expected to be sold within 12 months after the end of the reporting period. All other available-for-sale financial assets are classified as non-current.
(v) Financial liabilities
Non-derivative financial liabilities (excluding financial guarantees) are subsequently measured at amortised cost. Gains or losses are recognised in profit or loss.
Impairment
A financial asset is deemed to be impaired if, and only if, there is objective evidence of impairment as
a result of one or more events (a “loss event”) having occurred, which will have an impact on the estimated future cash flows of the financial asset(s).
In the case of available-for-sale financial assets, a significant or prolonged decline in the market value of the instrument is considered a loss event. Impairment losses are recognised in profit or loss immediately. Also, any cumulative decline in fair value previously recognised in other comprehensive income is reclassified to profit or loss at this point.
In the case of financial assets carried at amortised cost, loss events may include: indications that the debtors or a group of debtors are experiencing significant financial difficulty, default or delinquency in interest or principal payments; indications that they will enter bankruptcy or other financial reorganisation; and changes in arrears or economic conditions that correlate with defaults.
For financial assets carried at amortised cost (including loans and receivables), a separate allowance account is used to reduce the carrying amount of financial assets impaired by credit losses. After having taken all possible measures of recovery, if management establishes that the carrying amount cannot be recovered by any means, at that point the written-off amounts are charged to the allowance account or the carrying amount of impaired financial assets is reduced directly if no impairment amount was previously recognised in the allowance account.
Derecognition
Financial assets are derecognised where the contractual rights to receipt of cash flows expire or the asset is transferred to another party whereby the Council no longer has any significant continual involvement in the risks and benefits associated with the asset.
Financial liabilities are derecognised where the related obligations are discharged, cancelled or expired. The difference between the carrying amount of the financial liability extinguished or transferred to another party and the fair value of the consideration paid, including the transfer of non-cash assets or liabilities assumed, is recognised in profit or loss.
(h) Impairment of AssetsIn accordance with Australian Accounting Standards the Council’s assets, other than inventories, are assessed at each reporting date to determine whether there is any indication they may be impaired.
Where such an indication exists, an impairment test is carried out on the asset by comparing the recoverable amount of the asset, being the higher of the asset’s fair value less costs to sell and value in use, to the asset’s carrying amount.

38 39
notes to and forming part of the financial report >>FOR YEAR ENDED 30TH JUNE 2014
1. significant accounting policies >>
(h) Impairment of Assets (Continued)
Any excess of the asset’s carrying amount over its recoverable amount is recognised immediately in profit or loss, unless the asset is carried at a revalued amount in accordance with another standard (e.g. AASB 116) whereby any impairment loss of a revalued asset is treated as a revaluation decrease in accordance with that other standard.
For non-cash generating assets such as roads, drains, public buildings and the like, value in use is represented by the depreciated replacement cost of the asset.
(i) Trade and Other PayablesTrade and other payables represent liabilities for goods and services provided to the Council prior to the
end of the financial year that are unpaid and arise when the Council becomes obliged to make future payments in respect of the purchase of these goods and services. The amounts are unsecured, are recognised as a current liability and are normally paid within 30 days of recognition.
(j) Employee BenefitsShort-Term Employee Benefits
Provision is made for the Council’s obligations for short-term employee benefits. Short-term employee benefits are benefits (other than termination benefits) that are expected to be settled wholly before 12 months after the end of the annual reporting period in which the employees render the related service, including wages, salaries and sick leave. Short-term employee benefits are measured at the (undiscounted) amounts expected to be paid when the obligation is settled.
The Council’s obligations for short-term employee benefits such as wages, salaries and sick leave are recognised as a part of current trade and other payables in the statement of financial position. The Council’s obligations for employees’ annual leave and long service leave entitlements are recognised as provisions in the statement of financial position.
Other Long-Term Employee Benefits
Provision is made for employees’ long service leave and annual leave entitlements not expected to be settled wholly within 12 months after the end of the annual reporting period in which the employees render the related service. Other long-term employee benefits are measured at the present value of the expected future payments to be made to employees. Expected future payments incorporate anticipated future wage and salary levels, durations or service and employee departures and are discounted at rates determined by reference to market yields at the end of the reporting period on government bonds that have maturity dates that approximate the terms of the obligations. Any remeasurements for changes in assumptions of obligations for other long-term employee benefits are recognised in profit or loss in the periods in which the changes occur.
The Council’s obligations for long-term employee benefits are presented as non-current provisions in its statement of financial position, except where the Council does not have an unconditional right to defer settlement for at least 12 months after the end of the reporting period, in which case the obligations are presented as current provisions.
(k) ProvisionsProvisions are recognised when the Council has a present legal or constructive obligation, as a result of past events, for which it is probable that an outflow of economic benefits will result and that outflow can be reliably measured.
Provisions are measured using the best estimate of the amounts required to settle the obligation at the end of the reporting period.
(l) LeasesLeases of fixed assets where substantially all the risks and benefits incidental to the ownership of the asset, but not legal ownership, are transferred to the Council, are classified as finance leases.
Finance leases are capitalised recording an asset and a liability at the lower amounts equal to the fair value of the leased property or the present value of the minimum lease payments, including any guaranteed residual values. Lease payments are allocated between the reduction of the lease liability and the lease interest expense for the period.
Leased assets are depreciated on a straight line basis over the shorter of their estimated useful lives or the lease term.
Lease payments for operating leases, where substantially all the risks and benefits remain with the lessor, are charged as expenses in the periods in which they are incurred.
Lease incentives under operating leases are recognised as a liability and amortised on a straight line basis over the life of the lease term.
(m) Rates, Grants, Donations and Other ContributionsRates, grants, donations and other contributions are recognised as revenues when the local government obtains control over the assets comprising the contributions.
Control over assets acquired from rates is obtained at the commencement of the rating period or, where earlier, upon receipt of the rates.
Where contributions recognised as revenues during the reporting period were obtained on the condition that they be expended in a particular manner or used over a particular period, and those conditions were undischarged as at the reporting date, the nature of and amounts pertaining to ‘those undischarged conditions are disclosed in Note 2(c). That note also discloses the amount of contributions recognised as revenues in a previous reporting period which were obtained in respect of the local government’s operations for the current reporting period.
(n) SuperannuationThe Council contributes to a number of Superannuation Funds on behalf of employees. All funds to which the Council contributes are defined contribution plans.
(o) Current and Non-Current ClassificationIn the determination of whether an asset or liability is current or non-current, consideration is given to the time when each asset or liability is expected to be settled. The asset or liability is classified as current if it is expected to be settled within the next 12 months, being the Council’s operational cycle. In the case of liabilities where the Council does not have the unconditional right to defer settlement beyond 12 months, such as vested long service leave, the liability is classified as current even if not expected to be settled within the next 12 months. Inventories held for trading are classified as current even if not expected to be realised in the next 12 months except for land held for sale where it is held as non-current based on the Council’s intentions to release for sale.
(p) Rounding Off FiguresAll figures shown in this annual financial report, other than a rate in the dollar, are rounded to the nearest dollar.
(q) Comparative FiguresWhere required, comparative figures have been adjusted to conform with changes in presentation for the current financial year.
When the Council applies an accounting policy retrospectively, makes a retrospective restatement or reclassifies items in its financial statement, an additional (third) statement of financial position as at the beginning of the preceding period in addition to the minimum comparative financial statements is presented.
(r) Budget Comparative FiguresUnless otherwise stated, the budget comparative figures shown in this annual financial report relate to the original budget estimate for the relevant item of disclosure.

40 41
1. significant accounting policies >>
(s) New Accounting Standards and Interpretations for Application in Future PeriodsThe AASB has issued a number of new and amended Accounting Standards and Interpretations that have mandatory application dates for future reporting periods, some of which are relevant to the Council.
Management’s assessment of the new and amended pronouncements that are relevant to the Council, applicable to future reporting periods and which have not yet been adopted are set out as follows:
Title Issued / Compiled
Applicable (1) Impact
(i) AASB 9 – Financial Instruments December 2013
1 January 2017
Nil – The objective of this Standard is to improve and simplify the approach for classification and measurement of financial assets compared with the requirements of AASB 139. Given the nature of the financial assets of the Council, it is not anticipated the standard will have any material effect.
(ii) AASB 2010 – 7 Amendments to Australian Accounting Standards arising from AASB 9 (December 2010)
December 2013
1 January 2017
Nil - The revisions embodied in this standard give effect to the consequential changes arising from the issuance of AASB 9 which is not anticipated to have any material effect on the Council (refer (i) above).
[AASB 1, 3, 4, 5, 7, 101, 102, 108, 112, 118, 121, 127, 128, 131, 132, 136, 139, 1023 & 1038 and Interpretations 2, 5, 10, 12, 19 & 127]
(iii) AASB 2010 – 7 Amendments to Australian Accounting Standards arising from the Consolidation and Joint Arrangement Standards [Not-For-Profit entities]
[AASB 1, 3, 5, 7, 9, 2009-11, 101, 107, 112, 118, 121, 124, 131, 132, 133, 138, 139, 1023 & 1038 and Interpretations 5, 9, 16 & 17]
December 2012
1 January 2014
Consequential changes to various standards arising from the issuance of AASB 10, 11, 12, 127 and 128.
It is not expected to have a significant impact on Council.
notes to and forming part of the financial report >>FOR YEAR ENDED 30TH JUNE 2014
Title Issued / Compiled
Applicable (1) Impact
(iv) AASB 2012-3: Amendments to Australian Accounting Standards - Offsetting Financial Assets and Financial Liabilities
[AASB 132]
June 2012 1 January 2014
This Standard adds application guidance to AASB 132: Financial Instruments: Presentation to address potential inconsistencies identified in applying some of the offsetting criteria of AASB 132, including clarifying the meaning of “currently has a legally enforceable right of set-off” and that some gross settlement systems may be considered equivalent to net settlement.
This Standard is not expected to significantly impact the Council’s financial statements.
(v) AASB 2013 - 3: Amendments to AASB 136 - Recoverable Amount Disclosures for Non-Financial Assets
June 2013 1 January 2014
This standard makes amendments to AASB 136 and includes requirements to disclose additional information when present value techniques are used to measure the recoverable amount of impaired assets.
It is not expected to have a significant impact on Council.
(vi) AASB 2013-8: Amendments to Australian Accounting Standards – Australian Implementation Guidance for Not-for-Profit Entities – Control and Structured Entities
[AASB 10, 12 & 1049]
October 2013
1 January 2014
This standard adds Appendix E to AASB 10 to provide implementation guidance for Not-for-Profit entities regarding control criteria from the perspective of not-for-profit entities.
It is not expected to have a significant impact on Council.

42 43
1. significant accounting policies >>
(s) New Accounting Standards and Interpretations for Application in Future Periods (Continued)
Title Issued / Compiled
Applicable (1) Impact
(vii) AASB 2013-9: Amendments to Australian Accounting Standards – Conceptual Framework, Materiality and Financial Instruments
[Operative dates: Part A Conceptual Framework – 20 December 2013; Part B Materiality – 1 January 2014; Part C Financial Instruments – 1 January 2015]
December 2013
Refer Title column
Part A of this standard makes various editorial corrections to Australian Accounting Standards.
Part B of this standard deletes references to AASB 1031 in various Australian Accounting Standards in advance of the withdrawal of AASB 1031.
Part C of this standard makes consequential amendments to AASB 9 and numerous other standards and amends the permissions around certain applications relating to financial liabilities reissued at fair value.
As the bulk of changes related either to editorial or reference changes it is not expected to have a significant impact on Council.
(1) Applicable to reporting periods commencing on or after the given date.
(t) Adoption of New and Revised Accounting StandardsDuring the current year, the Council adopted all of the new and revised Australian Accounting Standards and Interpretations which were compiled, became mandatory and which were applicable to its operations.
These new and revised standards were:
AASB 10 AASB 128 AASB 2012 - 2
AASB 11 AASB 2011 - 7 AASB 2012 - 3
AASB 12 AASB 2011 - 9 AASB 2012 - 5
AASB 119 AASB 2011 - 10 AASB 2012 - 10
AASB 127
Most of the standards adopted had a minimal effect on the accounting and reporting practices of the Council as they did not have a significant impact on the accounting or reporting practices or were either not applicable, largely editorial in nature, were revisions to help ensure consistency with presentation, recognition and measurement criteria of IFRSs or related to topics not relevant to operations.
notes to and forming part of the financial report >>FOR YEAR ENDED 30TH JUNE 2013
2. revenue and expenses
(a) Net Result2014 2013
$ $The Net Result includes:
(i) Charging as an Expense:
Significant ExpenseEconomic Services 2,538,925 1,748,193
This significant expense in both years relates to expenditure for the coastal locations and rest stops project that the Pilbara Regional Council is project managing on behalf of the member local governments. The receipt of the CLGF Regional grant funds in late June 2013, meant that the project could not be completed in the 2012/2013 financial year.
2014 2013$ $
Auditors Remuneration- Audit of the financial report 0 6,500
DepreciationFurniture and Equipment 4,571 4,104
4,571 4,104
(ii) Crediting as Revenue:
Significant RevenueGovernance 3,635,090 0Economic Services 0 3,714,103
3,635,090 3,714,103
The significant revenues in 2013 relate to a government grant received for coastal locations and rest stops project, and a government grant received for tourism short stay accommodation project.
The significant revenues in 2014 relate to a government grant received for the Land Deconstraint project.
Other Revenue
2014 2013$ $
Reimbursements and Recoveries 3,612 686Significant Revenue (Refer Above) 3,635,090 3,714,103
3,638,702 3,714,789
2014 2014 2013Actual Budget Actual
Interest Earnings $ $ $- Other Funds 96,781 55,000 79,337
96,781 55,000 79,337

44 45
Ope
ning
Clos
ing
Clos
ing
Bala
nce
(1)
Rece
ived
(2)Ex
pend
ed (3
)Ba
lanc
e (1
)Re
ceiv
ed (2
)Ex
pend
ed (3
)Ba
lanc
eFu
nctio
n/1-
Jul-1
220
12/1
320
12/1
330
-Jun
-13
2013
/14
2013
/14
30-J
un-1
4G
rant
/Con
trib
utio
nA
ctiv
ity$
$$
$$
$$
Was
te A
utho
rity
- Was
te M
gmt G
rant
60,0
000
60,0
000
060
,000
RDL
- Reg
iona
l Bus
ines
s Cas
e12
,387
0(1
2,38
7)0
00
0RD
L - C
LGF
Regi
onal
Gra
nt 1
0/11
- Co
asta
l Loc
2,09
5,34
145
,321
(1,7
05,0
98)
435,
564
0(4
35,5
64)
0PD
C - T
ouris
m S
hort
Stay
Acc
om P
roje
ct4,
244
0(4
,244
)0
00
0TW
A - T
ouris
m S
hort
Stay
Acc
om P
roje
ct25
,000
0(2
5,00
0)0
00
0RD
L - C
LGF
Regi
onal
Gra
nt 1
1/12
- Co
asta
l Loc
03,
714,
103
3,71
4,10
376
,385
(2,1
06,9
73)
1,68
3,51
5D
LG -
Regi
onal
Bus
ines
s Pla
n M
igra
tion
012
5,00
0(4
7,72
7)77
,273
0(3
0,24
7)47
,026
Mem
bers
- To
urism
Sho
rt St
ay A
ccom
Pro
ject
37,5
000
(1,4
64)
36,0
360
036
,036
PRC
Mem
ber P
roje
ct C
ontri
butio
ns33
3,12
130
3,57
0(1
85,6
62)
451,
029
00
451,
029
PRC
Mem
ber C
ontri
butio
ns L
and
Dec
onst
rain
t0
75,0
0075
,000
0(7
5,00
0)0
RDL
- Lan
d D
econ
stra
int G
over
nanc
e0
00
03,
643,
471
03,
643,
471
Tota
l2,
567,
593
4,26
2,99
4(1
,981
,582
)4,
849,
005
3,71
9,85
6(2
,647
,784
)5,
921,
077
Not
es:
(1) -
Gra
nts/
cont
ribut
ions
reco
gnise
d as
reve
nue
in a
pre
viou
s rep
ortin
g pe
riod
whi
ch w
ere
not e
xpen
ded
at th
e cl
ose
of th
e pr
evio
us re
porti
ng p
erio
d.
(2) -
New
gra
nts/
cont
ribut
ions
and
inte
rest
ear
ned
whi
ch w
ere
reco
gnise
d as
reve
nues
dur
ing
the
repo
rting
per
iod
and
whi
ch h
ad n
ot y
et b
een
fully
exp
ende
d in
the
m
anne
r spe
cifie
d by
the
cont
ribut
or.
(3) -
Gra
nts/
cont
ribut
ions
whi
ch h
ad b
een
reco
gnise
d as
reve
nues
in a
pre
viou
s rep
ortin
g pe
riod
or re
ceiv
ed in
the
curre
nt re
porti
ng p
erio
d an
d w
hich
wer
e
e
xpen
ded
in th
e cu
rrent
repo
rting
per
iod
in th
e m
anne
r spe
cifie
d by
the
cont
ribut
or.
The
Pilb
ara
Regi
onal
Cou
ncil
has r
ecei
ved
fund
s fro
m th
e D
epar
tmen
t of R
egio
nal D
evel
omen
t and
Lan
ds (R
DL)
, whi
ch a
re to
be
expe
nded
on
the
proj
ects
iden
tified
in
the
Fina
ncia
l Ass
istan
ce A
gree
men
ts.
The
Coun
cil h
as b
udge
ted
to e
xpen
d al
l fun
ds re
ceive
d in
acc
orda
nce
with
the
term
s of t
he A
gree
men
ts. S
houl
d th
is no
t be
the
case
, at t
he e
xpira
tion
of th
e Ag
reem
ents
or o
n co
mpl
etio
n of
the
proj
ects
, any
uns
pent
fund
s will
be re
mitt
ed to
the
Dep
artm
ent o
f Reg
iona
l Dev
elom
ent a
nd L
ands
.
2. revenue and expenses >>
(b) Statement of ObjectiveThe Pilbara Regional Council is dedicated to providing high quality services to the community through the various service orientated programs which it has established.
Council operations as disclosed in these financial statements encompass the following service orientated activities/programs.
Governance
Objective: To provide a decision making process for the efficient allocation of scarce resources.
Activities: Includes the activities of members of council and the administrative support available to the council for the provision of governance of the district. Other costs relate to the task of assisting elected members and ratepayers on matters which do not concern specific council services.
General Purpose Funding
Objective: To collect revenue to allow for the provision of services.
Activities: Rates, general purpose government grants and interest revenue.
Economic Services
Objective: To help promote the shire and its economic wellbeing.
Activities: Tourism and area promotion including the maintenance and operation of a caravan park. Provision of rural services including weed control, vermin control and standpipes. Building Control.
notes to and forming part of the financial report >>FOR YEAR ENDED 30TH JUNE 2014
(c) C
ondi
tions
Ove
r Gra
nts/
Cont
ribut
ions

46 47
6. trade and other payables2014 2013
$ $CurrentSundry Creditors 83,041 654,396Accrued Salaries and Wages 31,980 6,075ATO Liabilities 229,278 257,460Other Payables 0 2,912
344,299 920,843
7. LONG-TERM BORROWINGS
The Shire did not have any long term borrowings at the reporting date.
8. provisions
Analysis of Total ProvisionsCurrent 11,750 1,302Non-Current 10,913 1,510
22,663 2,812
Provision for Provision forAnnual Long ServiceLeave Leave Total
$ $ $
Opening balance as at 1 July 2013 1,302 1,510 2,812Additional provisions 10,448 9,403 19,851Balance at 30 June 2014 11,750 10,913 22,663
9. reserves - cash/investment backed
The Pilbara Regional Council has no cash backed reserves.
10. REVALUATION SURPLUS
Revaluation surpluses have arisen on revaluation of the following classes of non-current assets:
TOTAL ASSET REVALUATION SURPLUS 0 0
11. member council’s equity in pilbara regional council
Shire of Ashburton 25% 1,669,947.25 1,388,725Shire of East Pilbara 25% 1,669,947.25 1,388,725City of Karratha 25% 1,669,947.25 1,388,725Town of Port Hedland 25% 1,669,947.25 1,388,725Balance as at 30 June 6,679,789.00 5,554,901
notes to and forming part of the financial report >>FOR YEAR ENDED 30TH JUNE 2014
3. cash and cash equivalentsNote 2014 2013
$ $
Unrestricted 1,078,658 1,458,341Restricted 5,921,077 4,849,005
6,999,735 6,307,346The following restrictions have been imposed byregulations or other externally imposed requirements:
Unspent Grants and contributions 2(c) 5,921,077 4,286,940 5,921,077 4,849,005
4. trade and other receivables
CurrentSundry Debtors 31,044 163,125
31,044 163,1255. property, plant and equipment
Land and BuildingsFurniture and Equipment at:- Management Valuation 2013 13,418 8,443- Additions after Valuation - Cost 12,569 3,746Less Accumulated Depreciation (10,015) (4,104)
15,972 8,085 15,972 8,085
Furniture and Equipment Plant and Equipment:
The Council’s Furniture and Equipment was recorded at cost as at 30 June 2014 as all furniture was acquired new during 2013/2014.
(a) Movements in Carrying Amounts
Movement in the carrying amounts of each class of property, plant and equipment between the beginning and the end of the current financial year.
Balance Carryingat the Revaluation Impairment Amount
Beginning Increments/ (Losses)/ Depreciation at theof the Year Additions (Disposals) (Decrements) Reversals (Expense) End of Year
$ $ $ $ $ $ $Furniture and Equipment (Level 3) 8,085 16,209 (3,751) 0 0 (4,571) 15,972
Total Property, Plant and Equipment 8,085 16,209 (3,751) 0 0 (4,571) 15,972

48 49
16. total assets classified by function and activity
2014 2013$ $
Governance 3,659,444 8,085Economic Services 1,688,793 4,849,005Unallocated 1,688,793 1,621,466
7,046,751 6,478,55617. financial ratios
2014 2013 2012Current Ratio 3.12 1.81 5.29Asset Sustainability Ratio 0.61 0.28 0.00Debt Service Cover Ratio 0.00 0.00 0.00Operating Surplus Ratio 11.20 31.06 21.38Own Source Revenue Coverage Ratio 0.03 0.03 0.10
The above ratios are calculated as follows:
Current Ratio current assets minus restricted assetscurrent liabilities minus liabilities associated
with restricted assetsAsset Sustainability Ratio capital renewal and relacement expenditure
depreciation expenseDebt Service Cover Ratio annual operating surplus before interest and depreciation
principal and interestOperating Surplus Ratio operating revenue minus operating expense
own source operating revenueOwn Source Revenue Coverage Ratio own source operating revenue
operating expenseNotes:
Information relating to the Asset Consumption Ratio and the Asset Renewal Funding Ratio can be found at Supplementary Ratio Information on Page 36 of this document.
18. TRUST FUNDS
The Pilbara Regional Council had no monies held in Trust as at 30 June 2013 or 30 June 2014.
19. disposals of assets - 2013/14 financial year
The following assets were disposed of during the year.Net Book Value Sale Price Profit (Loss)
Actual Budget Actual Budget Actual Budget$ $ $ $ $ $
Plant and EquipmentGovernanceDesks 1,273 0 855 0 (419) 0Konica Minolta Photocopier 1,799 0 0 0 (1,799) 0Cannon MFD Printer 598 0 0 0 (598) 0HP Server 81 0 0 0 (81) 0
3,751 0 855 0 (2,897) 0
Profit 0 0Loss (2,897) 0
(2,897) 0
notes to and forming part of the financial report >>FOR YEAR ENDED 30TH JUNE 2014
12. notes to the statement of cash flows
(a) Reconciliation of CashFor the purposes of the Statement of Cash Flows, cash includes cash and cash equivalents, net of outstanding bank overdrafts. Cash at the end of the reporting period is reconciled to the related items in the Statement of Financial Position as follows:
2014 2014 2013$ Budget $
$
Cash and Cash Equivalents 6,999,735 863,034 6,307,346
(b) Reconciliation of Net Cash Provided By Operating Activities to Net Result
Net Result 1,124,888 (4,776,542) 2,455,269
Depreciation 4,571 3,000 4,104(Profit)/Loss on Sale of Asset 2,897 0 8,712(Increase)/Decrease in Receivables 132,080 250,525 (106,471)(Increase)/Decrease in Inventories 0 (925,295) 809,344Increase/(Decrease) in PayablesIncrease/(Decrease) in Employee (576,544) 0 (3,740)Provisions 19,851 4,000 0Net Cash from Operating Activities 707,743 (5,444,312) 3,167,218
(c) Undrawn Borrowing Facilities Credit Standby Arrangements
Credit Card limit 30,000 5,000Credit Card Balance at Balance Date 6,833 0Total Amount of Credit Unused 36,833 5,000
13. contingent liabilities
The Pilbara Regional Council had no known contingent liabilities as at 30 June 2014.
14. capital and leasing commitments
(a) Operating Lease Commitments2014 2013
$ $Non-cancellable operating leases contracted for but not capitalised in the accounts.
Payable:- not later than one year 21,771 21,210- later than one year but not later than five years 16,693 39,094
38,464 60,304
The Shire did not have any future capital expenditure commitments at the reporting date.
15. JOINT VENTURE ARRANGEMENTS
The Shire is not involved in any joint venture arrangements.
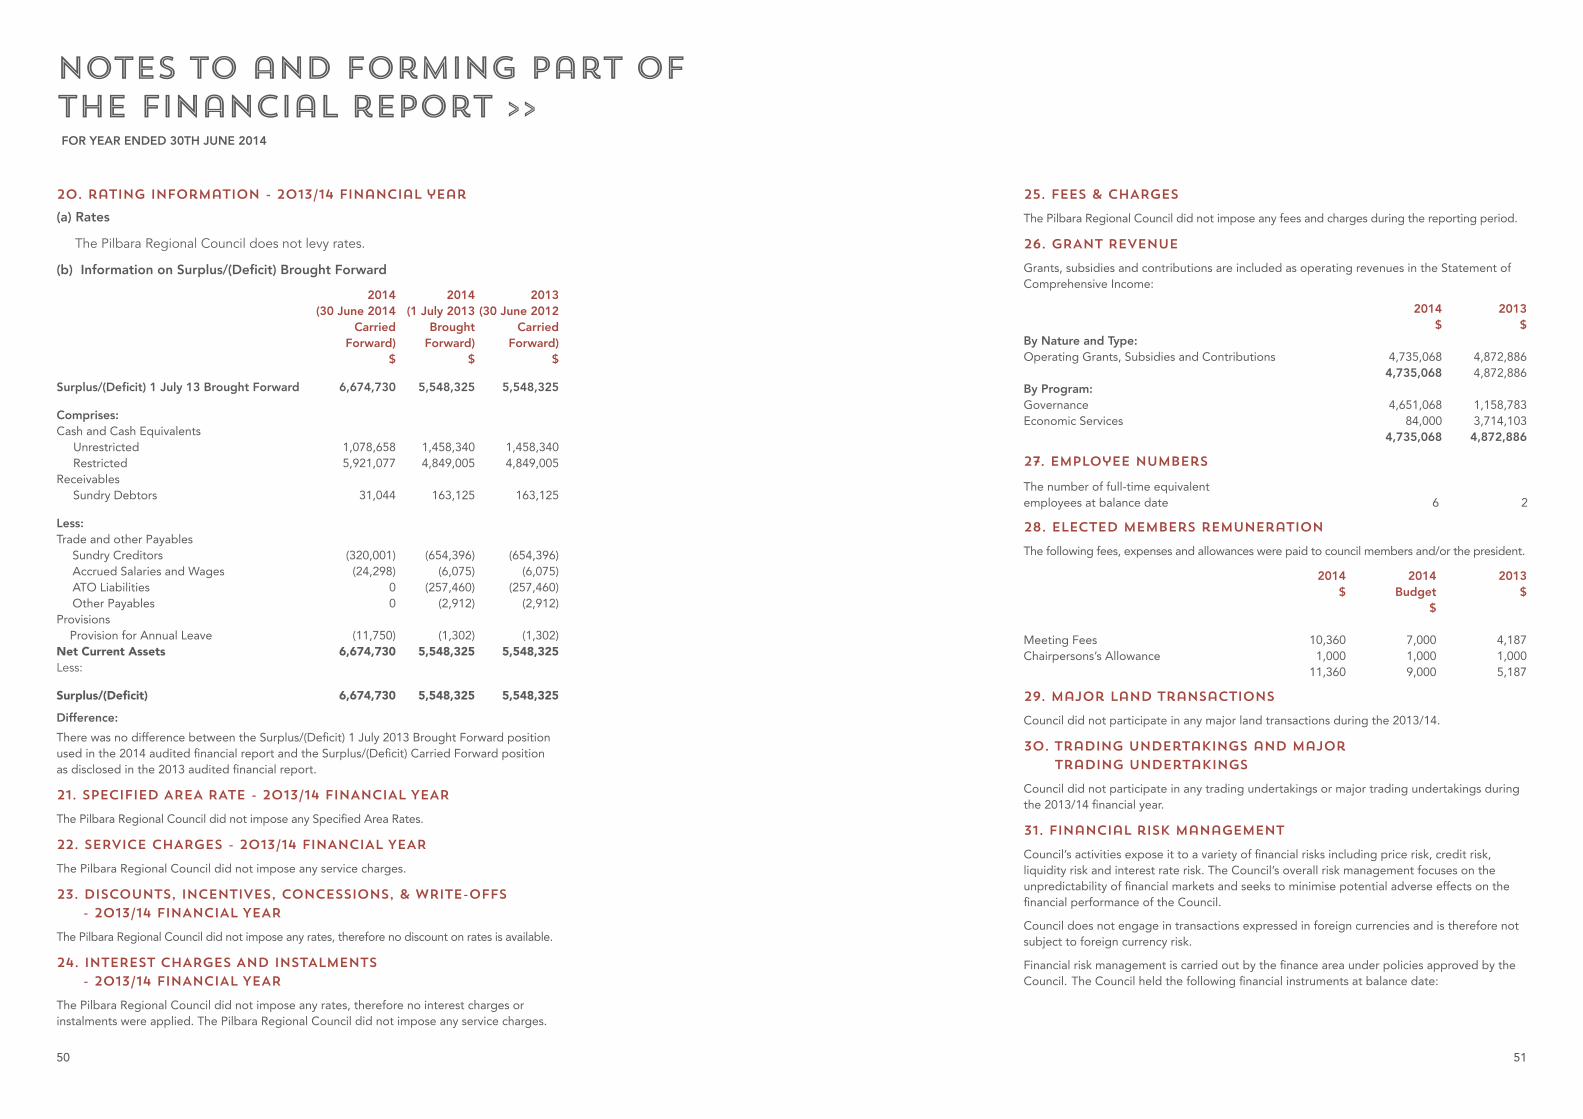
50 51
25. FEES & CHARGES
The Pilbara Regional Council did not impose any fees and charges during the reporting period.
26. GRANT REVENUE
Grants, subsidies and contributions are included as operating revenues in the Statement of Comprehensive Income:
2014 2013 $ $
By Nature and Type:Operating Grants, Subsidies and Contributions 4,735,068 4,872,886
4,735,068 4,872,886By Program:Governance 4,651,068 1,158,783Economic Services 84,000 3,714,103
4,735,068 4,872,886
27. employee numbers
The number of full-time equivalentemployees at balance date 6 2
28. elected members remuneration
The following fees, expenses and allowances were paid to council members and/or the president.
2014 2014 2013$ Budget $
$
Meeting Fees 10,360 7,000 4,187Chairpersons’s Allowance 1,000 1,000 1,000
11,360 9,000 5,187
29. major land transactions
Council did not participate in any major land transactions during the 2013/14.
30. trading undertakings and major trading undertakings
Council did not participate in any trading undertakings or major trading undertakings during the 2013/14 financial year.
31. financial risk management
Council’s activities expose it to a variety of financial risks including price risk, credit risk, liquidity risk and interest rate risk. The Council’s overall risk management focuses on the unpredictability of financial markets and seeks to minimise potential adverse effects on the financial performance of the Council.
Council does not engage in transactions expressed in foreign currencies and is therefore not subject to foreign currency risk.
Financial risk management is carried out by the finance area under policies approved by the Council. The Council held the following financial instruments at balance date:
20. rating information - 2013/14 financial year
(a) Rates
The Pilbara Regional Council does not levy rates.
(b) Information on Surplus/(Deficit) Brought Forward
2014 2014 2013(30 June 2014 (1 July 2013 (30 June 2012
Carried Brought CarriedForward) Forward) Forward)
$ $ $
Surplus/(Deficit) 1 July 13 Brought Forward 6,674,730 5,548,325 5,548,325
Comprises:Cash and Cash Equivalents Unrestricted 1,078,658 1,458,340 1,458,340 Restricted 5,921,077 4,849,005 4,849,005Receivables Sundry Debtors 31,044 163,125 163,125
Less:Trade and other Payables
Sundry Creditors (320,001) (654,396) (654,396)Accrued Salaries and Wages (24,298) (6,075) (6,075)ATO Liabilities 0 (257,460) (257,460)Other Payables 0 (2,912) (2,912)
ProvisionsProvision for Annual Leave (11,750) (1,302) (1,302)
Net Current Assets 6,674,730 5,548,325 5,548,325Less:
Surplus/(Deficit) 6,674,730 5,548,325 5,548,325
Difference:There was no difference between the Surplus/(Deficit) 1 July 2013 Brought Forward position used in the 2014 audited financial report and the Surplus/(Deficit) Carried Forward position as disclosed in the 2013 audited financial report.
21. SPECIFIED AREA RATE - 2013/14 FINANCIAL YEAR
The Pilbara Regional Council did not impose any Specified Area Rates.
22. SERVICE CHARGES - 2013/14 FINANCIAL YEAR
The Pilbara Regional Council did not impose any service charges.
23. DISCOUNTS, INCENTIVES, CONCESSIONS, & WRITE-OFFS - 2013/14 FINANCIAL YEAR
The Pilbara Regional Council did not impose any rates, therefore no discount on rates is available.
24. INTEREST CHARGES AND INSTALMENTS - 2013/14 FINANCIAL YEAR
The Pilbara Regional Council did not impose any rates, therefore no interest charges or instalments were applied. The Pilbara Regional Council did not impose any service charges.
notes to and forming part of the financial report >>FOR YEAR ENDED 30TH JUNE 2014

52 53
notes to and forming part of the financial report >>FOR YEAR ENDED 30TH JUNE 2014
31. financial risk management >>
Carrying Value Fair Value2014 2013 2014 2013
$ $ $ $Financial AssetsCash and cash equivalents 6,999,735 6,307,345 6,999,735 6,307,345Receivables 31,044 163,125 31,044 163,125
7,030,779 6,470,471 7,030,779 6,470,471
Financial LiabilitiesPayables 344,299 920,843 344,299 920,843
344,299 920,843 344,299 920,843
Fair value is determined as follows:
Cash and Cash Equivalents, Receivables, Payables – estimated to the carrying value which approximates net market value.
(a) Cash and Cash EquivalentsCouncil’s objective is to maximise its return on cash and investments whilst maintaining an adequate level of liquidity and preserving capital. The finance area manages the cash and investments portfolio with the assistance of independent advisers (where applicable). Council has an investment policy and the policy is subject to review by Council. An Investment Report is provided to Council on a monthly basis setting out the make-up and performance of the portfolio.
The major risk associated with investments is price risk - the risk that the capital value of investments may fluctuate due to changes in market prices, whether these changes are caused by factors specific to individual financial instruments of their issuers or factors affecting similar instruments traded in a market.
Cash and investments are also subject to interest rate risk - the risk that movements in interest rates could affect returns.
Another risk associated with cash is credit risk – the risk that a contracting entity will not complete its obligations under a financial instrument resulting in a financial loss to Council.
Council manages these risks by diversifying its portfolio and only investing in registered commercial banks. Council also seeks advice from independent advisers (where applicable) before placing any cash and investments.
2014 2013$ $
Impact of a 1% (1) movement in interest rates on cashand investments:
- Equity 69,997 63,073 - Statement of Comprehensive Income 70,399(2) 63,073(*)
Notes
(1) Sensitivity percentages based on management’s expectation of future possible market movements.
(2) Maximum impact.
(b) ReceivablesCouncil’s major receivables comprise rates and annual charges and user charges and fees. The major risk associated with these receivables is credit risk – the risk that the debts may not be repaid. Council manages this risk by monitoring outstanding debt and employing debt recovery policies. It also encourages ratepayers to pay rates by the due date through incentives.
Credit risk on rates and annual charges is minimised by the ability of Council to recover these debts as a secured charge over the land – that is, the land can be sold to recover the debt. Council is also able to charge interest on overdue rates and annual charges at higher than market rates, which further encourages payment.
The level of outstanding receivables is reported to Council monthly and benchmarks are set and monitored for acceptable collection performance.
Council makes suitable provision for doubtful receivables as required and carries out credit checks on most non-rate debtors.
There are no material receivables that have been subject to a re-negotiation of repayment terms.
The profile of the Council’s credit risk at balance date was:
2014 2013Percentage of Other Receivables - Current 72% 87% - Overdue 28% 13%
c) Payables / BorrowingsPayables and borrowings are both subject to liquidity risk – that is the risk that insufficient funds may be on hand to meet payment obligations as and when they fall due. Council manages this risk by monitoring its cash flow requirements and liquidity levels and maintaining an adequate cash buffer. Payment terms can be extended and overdraft facilities drawn upon if required.
The contractual undiscounted cash flows of Council’s Payables and Borrowings are set out in the Liquidity Sensitivity Table below:
Due Due Due Total Carryingwithin between after contractual values1 year 1 & 5 years 5 years cash flows
$ $ $ $ $2014
Payables 291,546 0 0 291,546 920,843291,546 0 0 291,546 920,843
2013
Payables 920,843 0 0 920,843 920,843920,843 0 0 920,843 920,843

54 55
Ratio Information
The following information relates to those ratios which only require attestation they have been checked and are supported by verifiable information. It does not form part of the audited financial report
2014 2013 2012
Asset Consumption Ratio 0.61 0.43 N/AAsset Renewal Funding Ratio * * * * N/A
The above ratios are calculated as follows:
Asset Consumption Ratio depreciated replacement cost of assetscurrent replacement cost of depreciable assets
Asset Renewal Funding Ratio NPV of planned capital renewal over 10 yearsNPV of required capital expenditure over 10 years
N/A - In keeping with amendments to Local Government (Financial Management) Regulations 50, comparatives for the two preceeding years (being 2012 and 2011) have not been reported as financial information is not available.
Note: ** Council are unable to provide an Asset Renewal Funding Ratio at this time as the information required is not available.
supplementary ratio informationFOR YEAR ENDED 30TH JUNE 2014

56
Suite 5, 205 Bulwer StreetPerth WA 6000 Australia+61 8 9467 2456www.prc.wa.gov.au pilbararegionalcouncil @PilbaraRC
Tony FridayChief Executive Officer0400 055 [email protected]
Melody PiaAdministrator0428 940 [email protected]