Embed Size (px)
Citation preview
IndonesiaAdvancing a National Disaster Risk Financing Strategy – Options for Consideration
October 2011
Disaster Risk Financing and Insurance Program, GFDRR and FCMNBEast Asia and Pacific Disaster Risk Management TeamIndonesia Country Management UnitEast Asia Finance and Private Sector UnitGlobal Facility for Disaster Reduction and Recovery
Pub
lic D
iscl
osur
e A
utho
rized
Pub
lic D
iscl
osur
e A
utho
rized
Pub
lic D
iscl
osur
e A
utho
rized
Pub
lic D
iscl
osur
e A
utho
rized

IndonesiaAdvancing a National Disaster Risk Financing Strategy – Options for Consideration
October 2011
Disaster Risk Financing and Insurance Program, GFDRR and FCMNBEast Asia and Pacific Disaster Risk Management TeamIndonesia Country Management UnitEast Asia Finance and Private Sector UnitGlobal Facility for Disaster Reduction and Recovery
© 2012 The International Bank for Reconstruction and Development/The World Bank
1818 H Street NWWashington DC 20433Telephone: 202-473-1000Internet: www.worldbank.org
All rights reserved
This publication is a product of the staff of the International Bank for Reconstruction and Development/The World Bank. The findings, interpretations, and conclusions expressed in this volume do not necessarily reflect the views of the Executive Directors of The World Bank or the governments they represent.
The World Bank does not guarantee the accuracy of the data included in this work. The boundaries, colors, denominations, and other information shown on any map in this work do not imply any judgment on the part of The World Bank concerning the legal status of any territory or the endorsement or acceptance of such boundaries.
Rights and Permissions
The material in this publication is copyrighted. Copying and/or transmitting portions or all of this work with-out permission may be a violation of applicable law. The International Bank for Reconstruction and Develop-ment/The World Bank encourages dissemination of its work and will normally grant permission to reproduce portions of the work promptly.
For permission to photocopy or reprint any part of this work, please send a request with complete informa-tion to the Copyright Clearance Center Inc., 222 Rosewood Drive, Danvers, MA 01923, USA; telephone: 978-750-8400; fax: 978-750-4470; Internet: www.copyright.com.
All other queries on rights and licenses, including subsidiary rights, should be addressed to the Office of the Publisher, The World Bank, 1818 H Street NW, Washington, DC 20433.
Cover design: Miki Fernandez
Table of Contents
Acknowledgements ..................................................................................................................... iv
Abbreviations and Acronyms ...................................................................................................... v
Executive Summary ..................................................................................................................... 1
Chapter 1. Introduction ................................................................................................................ 5
Chapter 2. Fiscal Management of Natural Disasters ....................................................................... 9
Chapter 3. Fiscal Disaster Risk Assessment .................................................................................... 17
Chapter 4. Review of Private Catastrophe Risk Insurance Market in Indonesia ............................... 25
Chapter 5. Options for National Disaster Risk Financing Strategy in Indonesia ............................... 29
Annexes
Annex 1. Exposure to Natural Hazards in Indonesia .................................................................... 46
Annex 2. Post-Disaster Risk Financing – Indonesia Case Studies .................................................. 48
Annex 3. Property Catastrophe Insurance in Indonesia ............................................................... 53
Annex 4. Insurance of Public Assets in Indonesia ........................................................................ 55
Annex 5. Disaster Risk Financing and Insurance Framework ........................................................ 57
Annex 6. World Bank Development Policy Loan with Catastrophe Draw Down Option ............... 62
Annex 7. Parametric insurance – Basic concepts ......................................................................... 64
Annex 8. Mexican Natural Disaster Fund FONDEN ...................................................................... 72
Annex 9. Catastrophe Bonds in Mexico ...................................................................................... 76
Annex 10. Caribbean Catastrophe Risk Insurance Facility .............................................................. 78
Annex 11. Turkish Catastrophe Insurance Pool ............................................................................. 80
Annex 12. Disaster Risk Management Roles in Indonesia .............................................................. 81
Annex 13. BNPB Database on Natural Disasters ............................................................................ 84
Annex 14. Post-Disaster Operational Phases ................................................................................. 86
Annex 15. Disaster Risk Management Framework in Indonesia ..................................................... 87
Annex 16. Borrowing capacity of Indonesia .................................................................................. 89
The report was produced by a team led by Olivier Mahul (FCMNB and GFDRR, World Bank) and Iwan Gunawan (EASIS, Word Bank), and comprising Djauhari Sitorus (EASFP, World Bank), Suntan Hidayat (Insurance Specialist, Consultant), Ahmad Zaki Fahmi (Public Finance Specialist, Consultant), Bambang
Soetono (EASID, World Bank), Hari Purnomo (EASPR, World Bank), Charles Scawthorn (Catastrophe Risk Modeling Specialist, Consultant), Marc Forni (Financial Specialist, Consultant), and Daniel Clarke (Actuary, Consultant).
The report greatly benefited from the data and information provided by the Ministry of Finance – Fiscal Policy Office (BKF), Bureau of Insurance, Capital Market Financial Institution Supervisory Agency (Bape-pam LK), Director General (DG) Budget, DG State Assets – BNPB and BAPPENAS.
The report is the result of an extensive stakeholder consultation, including high-level meetings with Ministers and Vice Ministers, DG, and Parliament Members. It also builds on consultations with local govern-ments in Padang, Aceh and Yogyakarta.
The team is grateful to the peer reviewers Francis Ghesquiere (SASDU, World Bank), Xiaolan Wang (ECSS6, World Bank) and Issam Abousleiman (TRE, World Bank). The team also thanks Chris Hoban (EACIF) for his comments.
The report has been prepared under the overall guidance of Stefan Koeberle (Country Director, World Bank), Franz Drees-Gross (EASIS, World Bank), Loic Chiquier (FCM, World Bank), Shubham Chaudhuri (EASPR, World Bank), Subrahmanya Pulle Srinivas (EASFP, World Bank) and Abhas Jha (EASIN, World Bank).
The team gratefully acknowledges funding support from the Global Facility for Disaster Reduction and Recovery (GFDRR).
AcknowledgementsAcknowledgements
Abbreviations and Acronyms
AAUI Indonesia General Insurance Association
AEL Annual Expected Loss
AIDRF Australia-Indonesia Disaster Risk Facility
BAKORNAS National Coordinating Board for Disaster Management
Bapepam LK Bureau of Insurance, Capital Market Financial Institution Supervisory Agency
BAPPENAS National Development Planning Agency
BBB Build Back Better
BKF Ministry of Finance – Fiscal Policy Office
BLU A non-profit public service entity (Badan Layanan Umum)
BNPB National Agency for Disaster Management
BPBD Regional Agency for Disaster Management
CARICOM Caribbean Common Market and Community
Cat DDO Catastrophe Draw Down Option
CCRIF Caribbean Catastrophe Risk Insurance Facility
CENAPRED Mexican National Center for Disaster Prevention
DANA Damage and Needs Assessment
DG Director General
DPL Development Policy Loan
ECLAC Economic Commission for Latin America and the Caribbean
ENSO El Niño-Southern Oscillation
FONDEN Mexican Fund for Natural Disasters
GDP Gross Domestic Product
GFDRR Global Facility for Disaster Risk Reduction and Recovery
GoI Government of Indonesia
GR Government Regulation
IMDFF-DR Indonesia Multi Donor Funding Facility for Disaster Recovery
MoF Ministry of Finance
NAP-DRR National Action Plan for Disaster Risk Reduction
NDRF Natural Disaster Reserve Fund
PBB Land and Property Tax
PDNA Post Disaster Needs Assessment
PML Probable Maximum Loss
SINAPROC Mexico National Civil Protection System
SPV Special Purpose Vehicle
TCIP Turkish Catastrophe Insurance Pool
TSI Total Sum Insured
< v >

This study presents options for a national disas-ter risk financing strategy in Indonesia, draw-ing heavily on international experience. The study discusses a series of complementary options for a national disaster risk financing strategy, based on a preliminary fiscal risk analysis and a review of the current budget management of natural disasters in Indonesia. It benefits from the international ex-perience of the World Bank, which has assisted sev-eral countries in the design and implementation of sovereign catastrophe risk financing strategies (for instance, in Mexico, Colombia, Vietnam, Philippines, and the Caribbean island states) and property catas-trophe risk insurance programs (for instance, in Tur-key, Romania and Eastern Europe). This experience is tailored to the institutional, social and economic characteristics of Indonesia.
The Government of Indonesia (GoI) requested the World Bank’s technical assistance to im-prove its financial response capacity in the aftermath of natural disasters. The World Bank has assisted the Ministry of Finance in developing a national disaster risk financing strategy for the financial protection of the state against natural di-sasters. It has also assisted the National Agency for Disaster Management (BNPB) in improving timely post-disaster assistance funding mechanism. The World Bank has worked closely with Ministry of Finance (Fiscal Policy Office (BKF), Bureau of Insur-ance, Capital Market Financial Institution Supervi-sory Agency (Bapepam LK), DG Budget, DG State Assets), National Agency for Disaster Management (BNPB) and BAPPENAS.
The BNPB also requested the World Bank’s tech-nical assistance to explore options to improve its current post-disaster assistance funding mechanism. The World Bank has assisted BNPB in building its capacity to conduct Post Disaster Needs Assessment (PDNA) as one of the basis for funding
allocation and to improve the timely disbursement of its post-disaster financial assistance.
This technical assistance is part of the broader partnership with the GoI on disaster risk man-agement and climate change adaptation. The adoption of Law 24/07 on Natural Disaster Man-agement emphasizes the importance of disaster risk management. The National Action Plan for Disaster Risk Reduction 2010-2012 includes the design and implementation of a national disaster risk financing strategy within a three year time frame.
The potential cost of a major disaster in Indo-nesia could exceed 3 percent of GDP. While the annual economic impact of natural disasters is es-timated at 0.3 percent of Gross Domestic Product (GDP) over the last decade, simulations show that a major earthquake (occurring once every 250 years) could cause losses in excess of US$30 billion, that is, 3 percent of GDP of Indonesia. Damage and loss as-sessment reports from recent major disasters show a consistent ranking of reconstruction needs with housing accounting for the largest expenditures followed by public infrastructure (primarily roads, schools and health facilities).
The Rehabilitation and Reconstruction Fund is the main budget instrument for the GoI to fi-nance public post-disaster expenditures, but it is under-capitalized. Post-disaster reconstruction is largely funded through the reserve of the State’s General Treasury (Bendahara Umum Negara), which requires parliamentary approval. An annual alloca-tion of about IDR 4 trillion (US$450 million) was made through this process in 2010 and 2011. While this represents a 30 percent increase from 2009, it may still be insufficient to deal with a major catas-trophe or a series of moderate to severe disasters in a given fiscal year. More importantly, a budget re-appropriation is required after almost every disas-ter. The study estimates that the immediate liquidity
Executive Summary
< 1 >
required for public post-disaster recovery spending could exceed US$2billion in major disaster years.
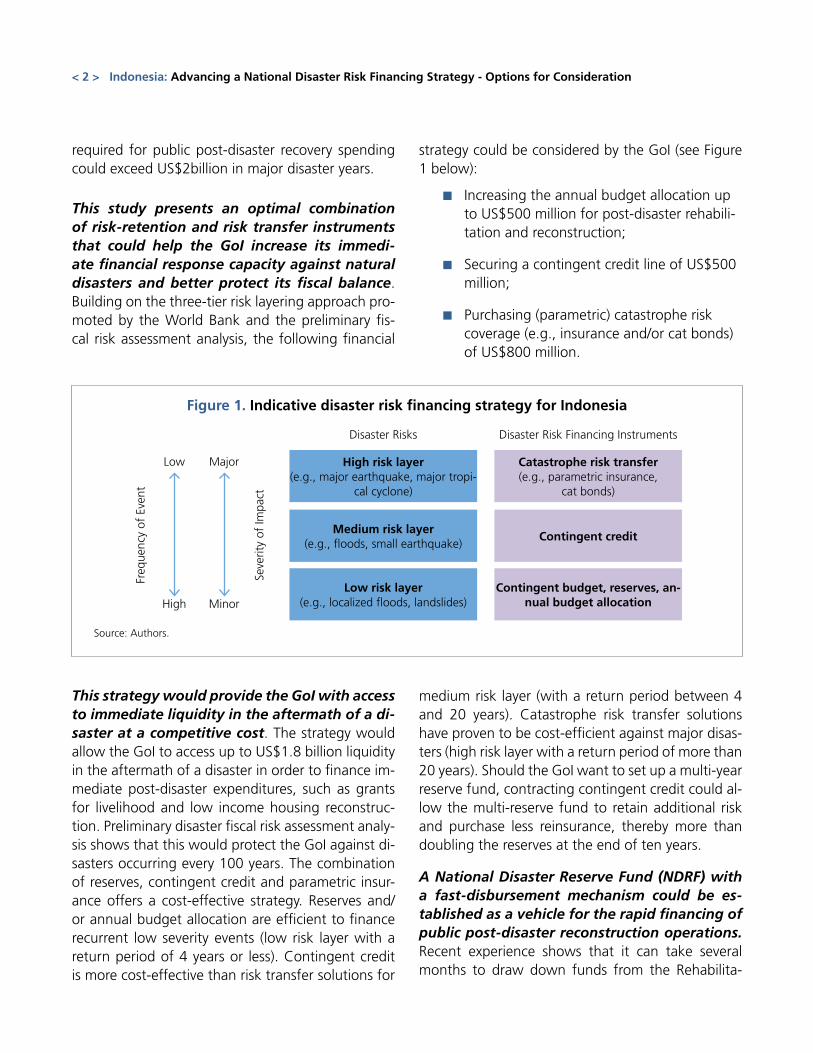
This study presents an optimal combination of risk-retention and risk transfer instruments that could help the GoI increase its immedi-ate financial response capacity against natural disasters and better protect its fiscal balance. Building on the three-tier risk layering approach pro-moted by the World Bank and the preliminary fis-cal risk assessment analysis, the following financial
strategy could be considered by the GoI (see Figure 1 below):
■■ Increasing the annual budget allocation up to US$500 million for post-disaster rehabili-tation and reconstruction;
■■ Securing a contingent credit line of US$500 million;
■■ Purchasing (parametric) catastrophe risk coverage (e.g., insurance and/or cat bonds) of US$800 million.
Disaster Risks
High risk layer(e.g., major earthquake, major tropi-
cal cyclone)
Medium risk layer(e.g., floods, small earthquake)
Low risk layer(e.g., localized floods, landslides)
Catastrophe risk transfer(e.g., parametric insurance,
cat bonds)
Contingent credit
Contingent budget, reserves, an-nual budget allocation
Disaster Risk Financing Instruments
Freq
uenc
y of
Eve
nt
Seve
rity
of Im
pact
Low
High
Major
Minor
Figure 1. Indicative disaster risk financing strategy for Indonesia
This strategy would provide the GoI with access to immediate liquidity in the aftermath of a di-saster at a competitive cost. The strategy would allow the GoI to access up to US$1.8 billion liquidity in the aftermath of a disaster in order to finance im-mediate post-disaster expenditures, such as grants for livelihood and low income housing reconstruc-tion. Preliminary disaster fiscal risk assessment analy-sis shows that this would protect the GoI against di-sasters occurring every 100 years. The combination of reserves, contingent credit and parametric insur-ance offers a cost-effective strategy. Reserves and/or annual budget allocation are efficient to finance recurrent low severity events (low risk layer with a return period of 4 years or less). Contingent credit is more cost-effective than risk transfer solutions for
medium risk layer (with a return period between 4 and 20 years). Catastrophe risk transfer solutions have proven to be cost-efficient against major disas-ters (high risk layer with a return period of more than 20 years). Should the GoI want to set up a multi-year reserve fund, contracting contingent credit could al-low the multi-reserve fund to retain additional risk and purchase less reinsurance, thereby more than doubling the reserves at the end of ten years.
A National Disaster Reserve Fund (NDRF) with a fast-disbursement mechanism could be es-tablished as a vehicle for the rapid financing of public post-disaster reconstruction operations. Recent experience shows that it can take several months to draw down funds from the Rehabilita-
Source: Authors.
< 2 > Indonesia: Advancing a National Disaster Risk Financing Strategy - Options for Consideration
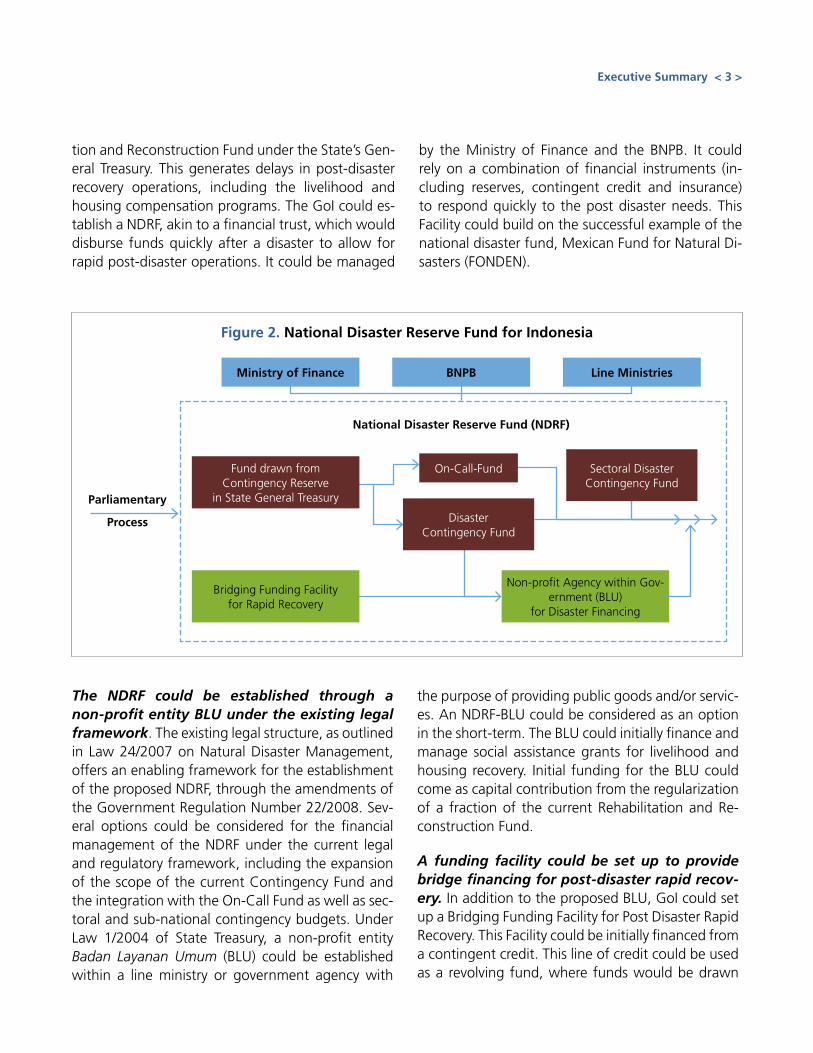
tion and Reconstruction Fund under the State’s Gen-eral Treasury. This generates delays in post-disaster recovery operations, including the livelihood and housing compensation programs. The GoI could es-tablish a NDRF, akin to a financial trust, which would disburse funds quickly after a disaster to allow for rapid post-disaster operations. It could be managed
by the Ministry of Finance and the BNPB. It could rely on a combination of financial instruments (in-cluding reserves, contingent credit and insurance) to respond quickly to the post disaster needs. This Facility could build on the successful example of the national disaster fund, Mexican Fund for Natural Di-sasters (FONDEN).
Ministry of Finance
Parliamentary
Process
BNPB
National Disaster Reserve Fund (NDRF)
Line Ministries
Non-profit Agency within Gov-ernment (BLU)
for Disaster Financing
DisasterContingency Fund
Sectoral DisasterContingency Fund
Fund drawn from Contingency Reserve
in State General Treasury
Bridging Funding Facilityfor Rapid Recovery
On-Call-Fund
The NDRF could be established through a non-profit entity BLU under the existing legal framework. The existing legal structure, as outlined in Law 24/2007 on Natural Disaster Management, offers an enabling framework for the establishment of the proposed NDRF, through the amendments of the Government Regulation Number 22/2008. Sev-eral options could be considered for the financial management of the NDRF under the current legal and regulatory framework, including the expansion of the scope of the current Contingency Fund and the integration with the On-Call Fund as well as sec-toral and sub-national contingency budgets. Under Law 1/2004 of State Treasury, a non-profit entity Badan Layanan Umum (BLU) could be established within a line ministry or government agency with
the purpose of providing public goods and/or servic-es. An NDRF-BLU could be considered as an option in the short-term. The BLU could initially finance and manage social assistance grants for livelihood and housing recovery. Initial funding for the BLU could come as capital contribution from the regularization of a fraction of the current Rehabilitation and Re-construction Fund.
A funding facility could be set up to provide bridge financing for post-disaster rapid recov-ery. In addition to the proposed BLU, GoI could set up a Bridging Funding Facility for Post Disaster Rapid Recovery. This Facility could be initially financed from a contingent credit. This line of credit could be used as a revolving fund, where funds would be drawn
Figure 2. National Disaster Reserve Fund for Indonesia
Executive Summary < 3 >
down when budget liquidity is insufficient (usually at the end of fiscal year) and it would be replenished at the beginning of the following fiscal year. The Facil-ity could provide funding to the BLU or to other line ministries and/or provincial and local governments to undertake urgent recovery activities that cannot be delayed until a new fiscal year starts.
The GoI could support the establishment of a disaster risk insurance program for key public assets in partnership with the private insurance industry. Most of the public assets, including criti-cal assets such as hospital and schools, are not cur-rently insured against natural disasters. This program would aim to offer technical assistance to the public entities in the design of their catastrophe insurance coverage of public assets. Standardized terms and conditions for the property insurance policies would be developed, which would assist public managers in identifying their risk exposure and their insurance needs. The program could also structure a national insurance portfolio of public assets to be then placed on the private (re)insurance market. A national prop-erty catastrophe insurance program for public assets would create economies of scale and diversification benefits, thus lowering reinsurance premiums. It would also provide incentives to the local entities to report their assets to the Central Government.
The GoI could promote property catastrophe insurance of private residential dwellings. Building on the example of Turkey, the GoI could strengthen its partnership with the private insurance sector to further develop property catastrophe in-surance of private residential dwellings. In particular, the insurance supervision of property catastrophe insurance could be strengthened.
The GoI could establish a Joint Disaster Reserve Fund for Indonesia’s local governments. The Fund would build on risk diversification to offer In-donesian provinces/municipalities access to immedi-ate non-earmarked liquidity in case of disasters at the lowest possible cost. Building on the successful example of the Caribbean Catastrophe Risk Insur-ance Facility (CCRIF), the Fund would act as a joint reserve mechanism for the provinces/municipalities of Indonesia. Participating local governments would contribute to the Fund based on their own risk pro-file and desired coverage level. These contributions would be used to maintain a reserve level sufficient to absorb annual payouts to local governments af-fected by adverse natural events. The Fund could also benefit from initial contributions from the cen-tral government and/or the donor partners. To man-age the potential variability in financial outflow from the fund, the Fund could secure additional financial capacity on the international reinsurance and capital markets.
The implementation of a national disaster risk financing strategy would require significant in-stitutional capacity building. Disaster risk financ-ing is one component of a comprehensive fiscal risk management strategy, which requires specific finan-cial and actuarial expertise. Major capacity building on disaster risk assessment and management of natural disasters would be required to develop and use financial tools to guide the GoI in its national disaster risk financing strategy.
< 4 > Indonesia: Advancing a National Disaster Risk Financing Strategy - Options for Consideration
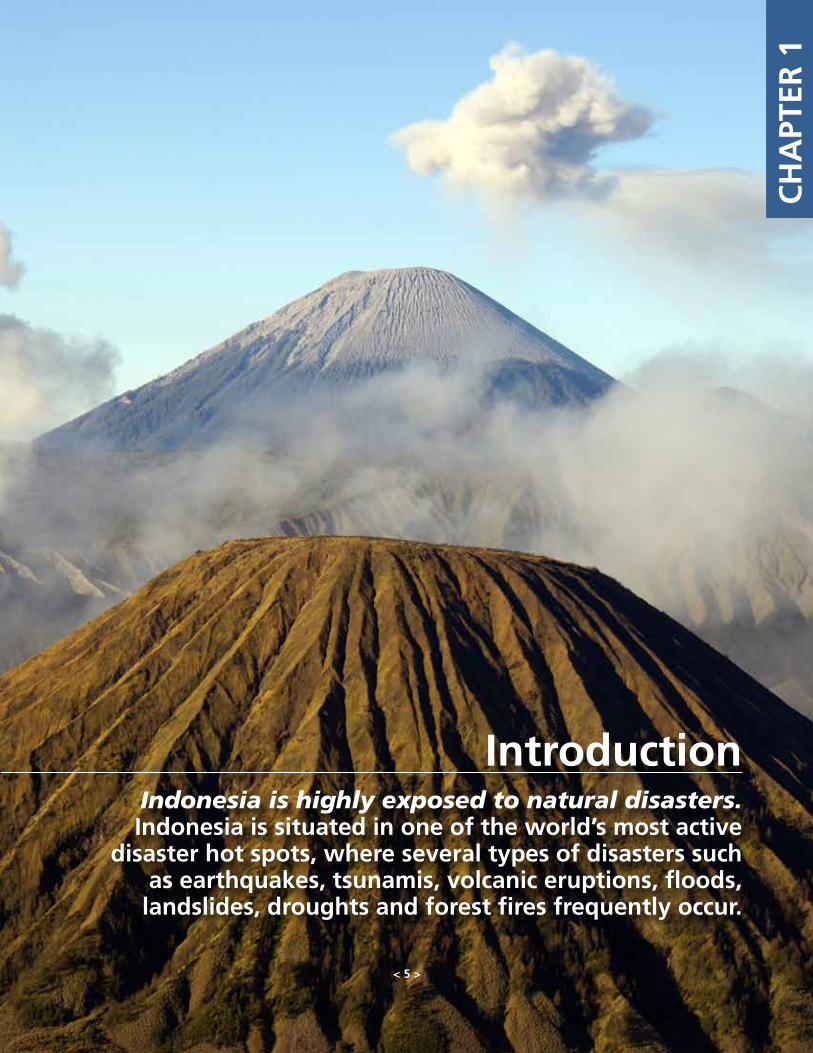
Indonesia is highly exposed to natural disasters. Indonesia is situated in one of the world’s most active
disaster hot spots, where several types of disasters such as earthquakes, tsunamis, volcanic eruptions, floods,
landslides, droughts and forest fires frequently occur.
IntroductionC
HA
PTER
1
< 5 >
According to a global risk analysis by the World Bank, Indonesia is among the top 35 countries that have high mortality risks from multiple hazards. Ap-proximately 40 percent of the population at risk, that is, more than 90 million lives. The increase in population and assets exposed to natural disasters, combined with the rise in the number and inten-sity of hydro-meteorological events resulting from climate change, may further increase the economic and human impact of natural disasters in Indonesia. See Annex 1 for a description of key hazards in In-donesia.
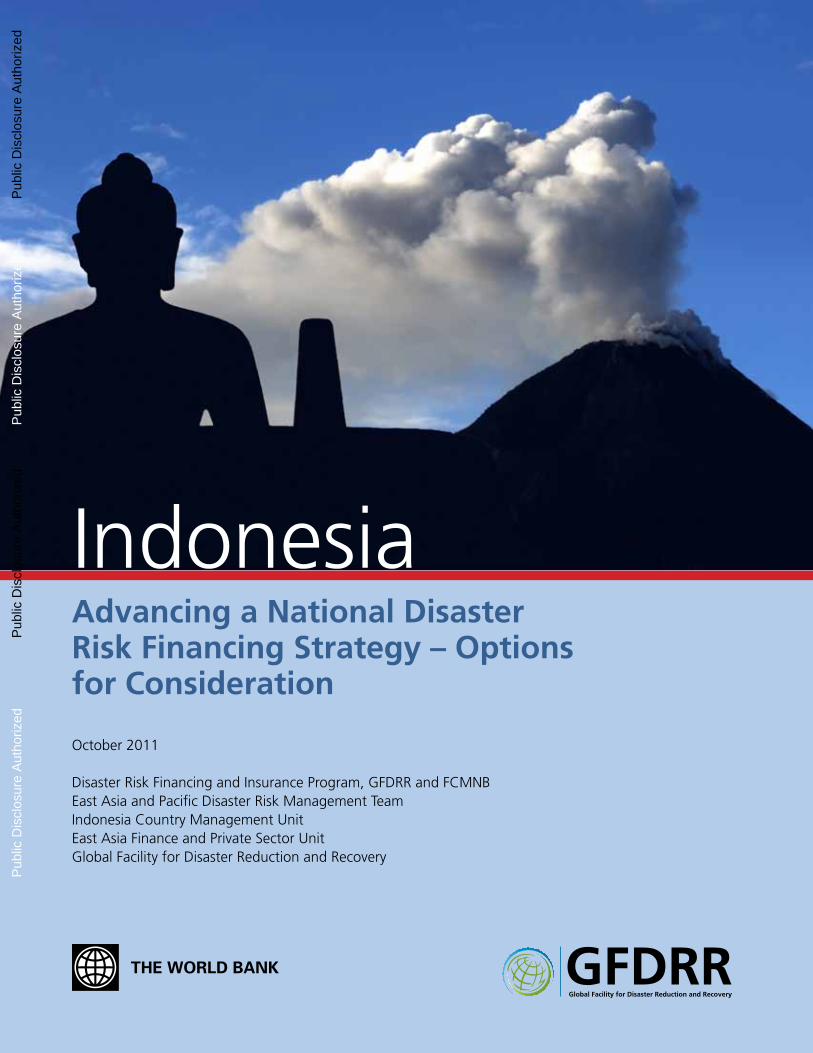
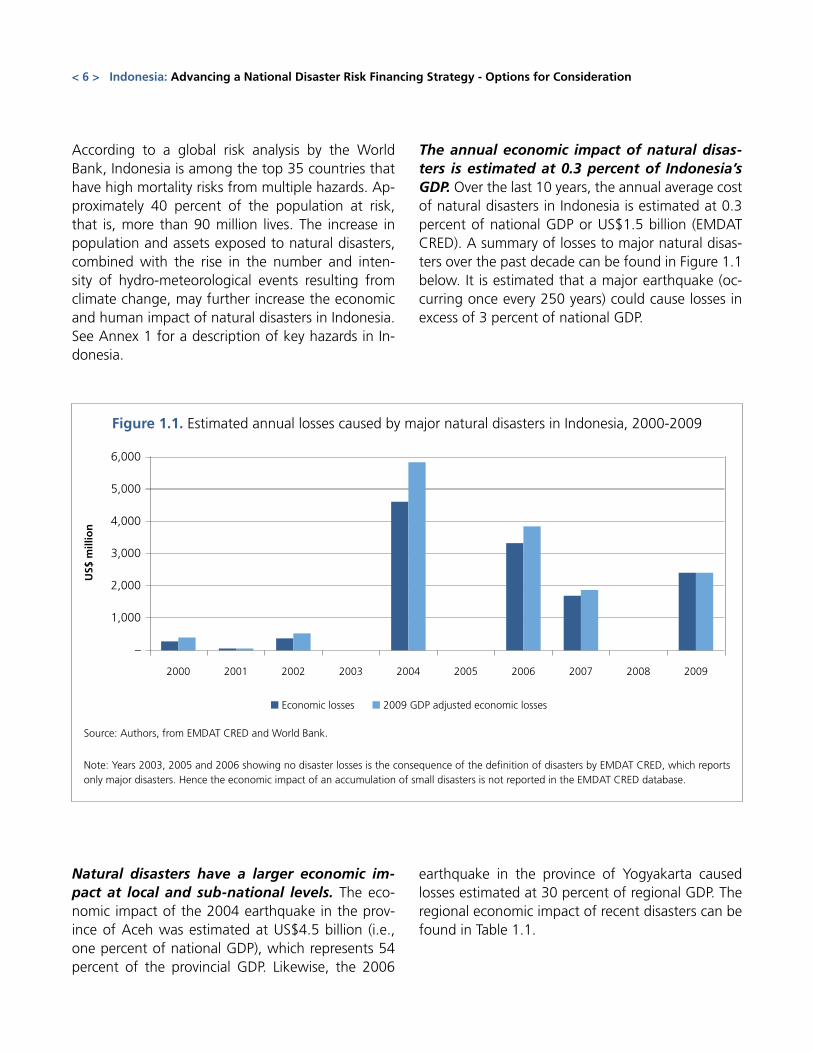
The annual economic impact of natural disas-ters is estimated at 0.3 percent of Indonesia’s GDP. Over the last 10 years, the annual average cost of natural disasters in Indonesia is estimated at 0.3 percent of national GDP or US$1.5 billion (EMDAT CRED). A summary of losses to major natural disas-ters over the past decade can be found in Figure 1.1 below. It is estimated that a major earthquake (oc-curring once every 250 years) could cause losses in excess of 3 percent of national GDP.
Figure 1.1. Estimated annual losses caused by major natural disasters in Indonesia, 2000-2009
Source: Authors, from EMDAT CRED and World Bank.
Note: Years 2003, 2005 and 2006 showing no disaster losses is the consequence of the definition of disasters by EMDAT CRED, which reports only major disasters. Hence the economic impact of an accumulation of small disasters is not reported in the EMDAT CRED database.
Natural disasters have a larger economic im-pact at local and sub-national levels. The eco-nomic impact of the 2004 earthquake in the prov-ince of Aceh was estimated at US$4.5 billion (i.e., one percent of national GDP), which represents 54 percent of the provincial GDP. Likewise, the 2006
earthquake in the province of Yogyakarta caused losses estimated at 30 percent of regional GDP. The regional economic impact of recent disasters can be found in Table 1.1.
< 6 > Indonesia: Advancing a National Disaster Risk Financing Strategy - Options for Consideration
2006 2007 20092001 2002 2003 2005 200820042000
■ Economic losses ■ 2009 GDP adjusted economic losses
6,000
5,000
4,000
3,000
2,000
1,000
–
US$
mill
ion
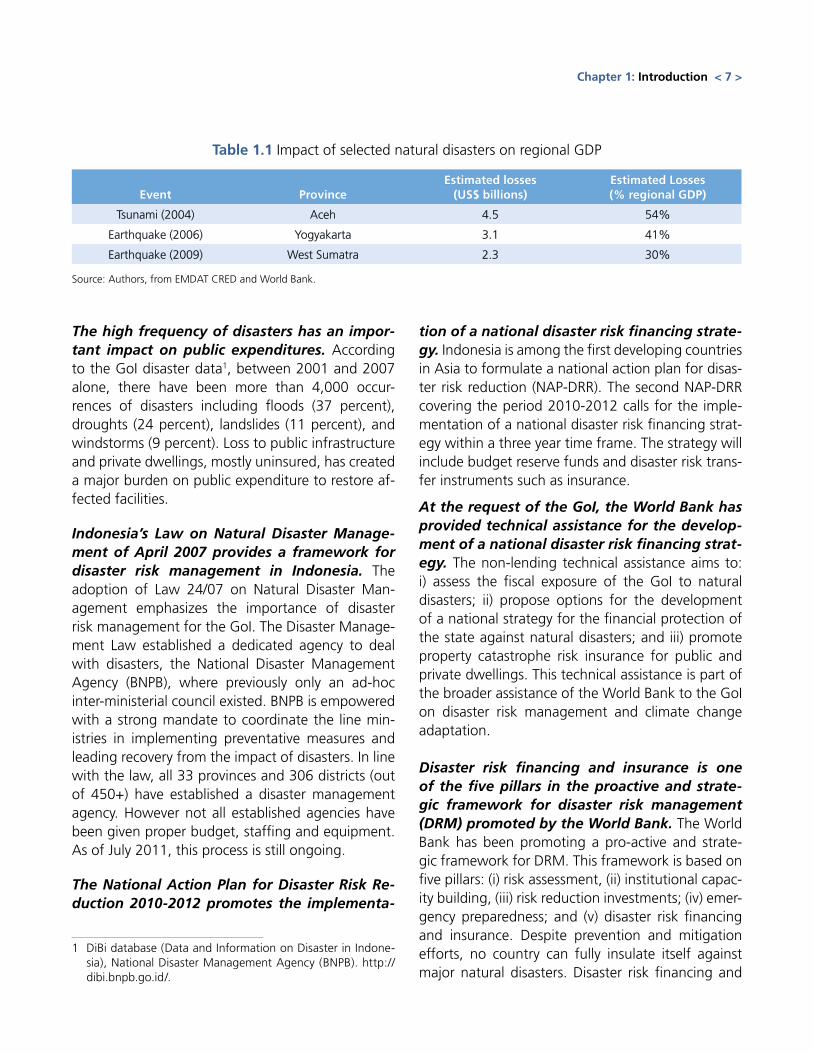
Table 1.1 Impact of selected natural disasters on regional GDP
Event ProvinceEstimated losses
(US$ billions)Estimated Losses (% regional GDP)
Tsunami (2004) Aceh 4.5 54%
Earthquake (2006) Yogyakarta 3.1 41%
Earthquake (2009) West Sumatra 2.3 30%
Source: Authors, from EMDAT CRED and World Bank.
The high frequency of disasters has an impor-tant impact on public expenditures. According to the GoI disaster data1, between 2001 and 2007 alone, there have been more than 4,000 occur-rences of disasters including floods (37 percent), droughts (24 percent), landslides (11 percent), and windstorms (9 percent). Loss to public infrastructure and private dwellings, mostly uninsured, has created a major burden on public expenditure to restore af-fected facilities.
Indonesia’s Law on Natural Disaster Manage-ment of April 2007 provides a framework for disaster risk management in Indonesia. The adoption of Law 24/07 on Natural Disaster Man-agement emphasizes the importance of disaster risk management for the GoI. The Disaster Manage-ment Law established a dedicated agency to deal with disasters, the National Disaster Management Agency (BNPB), where previously only an ad-hoc inter-ministerial council existed. BNPB is empowered with a strong mandate to coordinate the line min-istries in implementing preventative measures and leading recovery from the impact of disasters. In line with the law, all 33 provinces and 306 districts (out of 450+) have established a disaster management agency. However not all established agencies have been given proper budget, staffing and equipment. As of July 2011, this process is still ongoing.
The National Action Plan for Disaster Risk Re-duction 2010-2012 promotes the implementa-
1 DiBi database (Data and Information on Disaster in Indone-sia), National Disaster Management Agency (BNPB). http://dibi.bnpb.go.id/.
tion of a national disaster risk financing strate-gy. Indonesia is among the first developing countries in Asia to formulate a national action plan for disas-ter risk reduction (NAP-DRR). The second NAP-DRR covering the period 2010-2012 calls for the imple-mentation of a national disaster risk financing strat-egy within a three year time frame. The strategy will include budget reserve funds and disaster risk trans-fer instruments such as insurance.
At the request of the GoI, the World Bank has provided technical assistance for the develop-ment of a national disaster risk financing strat-egy. The non-lending technical assistance aims to: i) assess the fiscal exposure of the GoI to natural disasters; ii) propose options for the development of a national strategy for the financial protection of the state against natural disasters; and iii) promote property catastrophe risk insurance for public and private dwellings. This technical assistance is part of the broader assistance of the World Bank to the GoI on disaster risk management and climate change adaptation.
Disaster risk financing and insurance is one of the five pillars in the proactive and strate-gic framework for disaster risk management (DRM) promoted by the World Bank. The World Bank has been promoting a pro-active and strate-gic framework for DRM. This framework is based on five pillars: (i) risk assessment, (ii) institutional capac-ity building, (iii) risk reduction investments; (iv) emer-gency preparedness; and (v) disaster risk financing and insurance. Despite prevention and mitigation efforts, no country can fully insulate itself against major natural disasters. Disaster risk financing and
Chapter 1: Introduction < 7 >
insurance allows countries to increase their financial response capacity in the aftermath of a disaster and to reduce the economic and fiscal burden of natural disasters by devising financial strategies combining post-disaster financing (for example, post disas-ter credit) and ex ante risk financing (for example, reserves, contingent credit and risk transfer instru-ments like insurance).
This report presents the main findings and rec-ommendations of the technical assistance. It consists of five chapters including this introduction. Chapter 2 presents a preliminary financial disaster risk assessment for Indonesia and focuses particu-
larly on the fiscal impact of natural disasters. Chap-ter 3 provides an overview of the budget process for the financing of natural disaster losses for each of the three post-disaster phases: emergency response, recovery, and reconstruction. Chapter 4 provides a short description of the state of the private catas-trophe insurance market. Chapter 5 is devoted to a review of options for the future financing of natural disaster recovery and reconstruction expenditures in Indonesia. This section includes options for sovereign risk financing and for the promotion of commercial catastrophe insurance for the private property sec-tor. The report is complemented by fourteen techni-cal annexes that offer further analyses and results.
< 8 > Indonesia: Advancing a National Disaster Risk Financing Strategy - Options for Consideration
Fiscal Management of Natural Disasters
CH
APT
ER 2
< 9 >
A regulatory framework for post disaster fi-nancing has been established by the GoI and is described under Law 24/2007. It provides the definition of natural disasters and identifies the re-sponsibilities of the central and local governments as well as the functions and duties of the National and Regional Disaster Management Agencies. The regulation outlines the disaster risk financing frame-work, which is a shared responsibility between the central and local governments, stipulating the three phases of a disaster as: emergency, recovery, and re-construction. Additional provisions not included in Law 24/2007 regarding the management of disaster events follow Government Regulation (GR) 21/2007 on disaster response, and GR 22/2007 on financing and management of natural disasters. Finally, Law 33/2004 stipulates how local authorities can request emergency funds from the Central Government in case of a disaster. See Annex 13 for a detailed de-scription of the post-disaster operational phases.
The financial responsibility of central and lo-cal governments is defined by Law 24/2007 and further elaborated in GR 22/2008. Major disasters are financed with support from the central budget through exceptional transfers to the provincial bud-gets. Post-disaster financing of minor scale disasters are generally assigned to the local and provincial gov-ernments. Central Government financing of recovery efforts must be approved by parliament with funds being drawn from the State’s General Treasury (Ben-dahara Umum Negara) and disbursed through the Rehabilitation and Reconstruction Fund. However, the definition of major disasters receiving assistance from the Central Government and minor disasters that do not receive Central Government funding is unclear.
According to the Law 24/2007, the government is responsible for the post-disaster financing of: i) emergency/relief operations; ii) recovery and recon-struction of public infrastructure and buildings; iii) (par-tial) financial assistance for the reconstruction of pri-vate dwellings2. Damage and loss assessment reports
2 Experiences from several recent disasters show that the
from recent major disasters show consistent ranking of reconstruction needs, with housing accounting for the largest needs, followed by public infrastructure (pri-marily roads, schools and health facilities).
The source of emergency response funds, cov-ering the first weeks after a disaster, depends on whether the event is declared a National Disaster or disaster of national significance3. If so, the Central Government takes responsibility through BNPB with line ministries and the BNPB dis-bursing resources through their “On call” funds for emergency response. “On call” funds are a separate line of the budget that can be engaged to support post-disaster early recovery activities while emer-gency status is still in effect. If not declared a Na-tional Disaster, local governments provide financing through their contingency budgets.
Budget appropriations for post-disaster recov-ery activities, financed through the Rehabilita-tion and Reconstruction Fund, are made during the budget discussions at the Parliament. Bud-get preparation and approval affects the availability of additional financing resources in specific months of the year; budget preparation (before December) and mid-year budget revision (June). Timing of assis-tance is also contingent on any delays in the prepa-ration process, while the regulations for budget re-visions and evaluation also affect the flexibility for reallocations of funds.
public financial contribution for the reconstruction of pri-vate dwellings greatly varies by disaster event. For example, in the case of Central Java earthquake (2006), households of heavily damaged houses received a maximum of IDR20 million (US$2300). In the disaster of West Java and West Sumatra (2009), the affected households received IDR15 mil-lion (US$1800) for houses with heavy damage, IDR5 million (US$600) for medium damage, and IDR1 million (US$120) for low damage.
3 In the cases of five recent disasters (West Java and West Su-matra earthquakes of 2009, Wassior flash flood, Mentawai tsunami, and Mt. Merapi eruption of 2010), the Government did not declare them as national disasters. However, the Government considered them as disasters where supports from the National Government is required in both response and recovery phases.
< 10 > Indonesia: Advancing a National Disaster Risk Financing Strategy - Options for Consideration
Identification and transfer of funds for post-di-saster reconstruction can take several months, depending on when during the fiscal year a di-saster strikes. For example, the Aceh tsunami oc-curred on December 26, 2004, at the end of the fiscal year, when the budget allocation for the next fiscal year had already been approved. Major additional budget appropriations for disaster response had to be completed through the mid-year budget revision in 2005, affecting the need for additional financing for emergency response. In contrast, the Yogyakarta earthquake occurred on May 29, 2006, just in time for the mid-year budget revision that started in June, resulting in faster execution of funds.
During the recovery phase, covering approxi-mately the first three to six months after a disaster funds are available through the Re-habilitation and Reconstruction funding assis-tance for major disasters. Every year, the GoI sets aside a specific budget allocation for rehabilitation and reconstruction through the Rehabilitation and Reconstruction Fund to provide resources to recover from recurrent events that occurred in the preced-ing years. The use of these funds requires parliamen-
tary approval as the fund is drawn from the State’s General Treasury. This allocation was IDR 4 trillion (US$450 million) in 2011 (up from IDR 3.8 trillion in 2010 and IDR 3 trillion in 2009).
Reconstruction resources are made available by the Central Government. These funds usually come from the reallocation of capital expenditure budgets of next fiscal years, and/or drawn from the unexpended budget of the previous years. The dis-bursement of these resources can take one year or more.
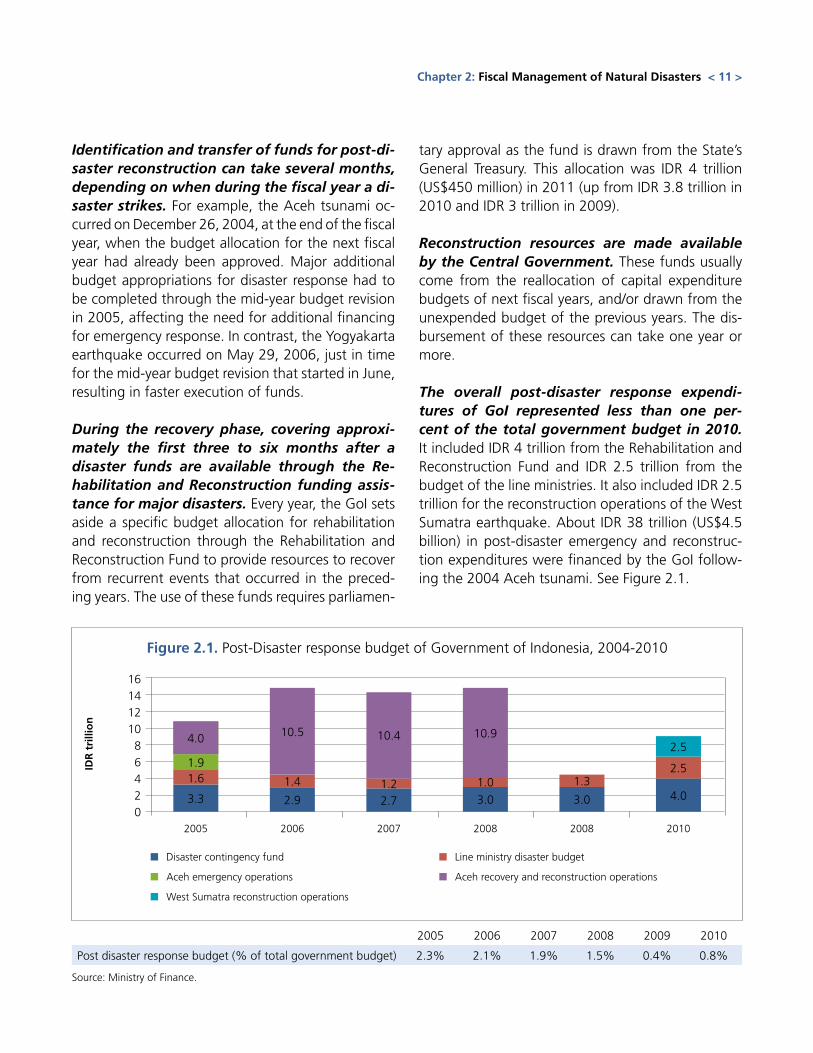
The overall post-disaster response expendi-tures of GoI represented less than one per-cent of the total government budget in 2010. It included IDR 4 trillion from the Rehabilitation and Reconstruction Fund and IDR 2.5 trillion from the budget of the line ministries. It also included IDR 2.5 trillion for the reconstruction operations of the West Sumatra earthquake. About IDR 38 trillion (US$4.5 billion) in post-disaster emergency and reconstruc-tion expenditures were financed by the GoI follow-ing the 2004 Aceh tsunami. See Figure 2.1.
Chapter 2: Fiscal Management of Natural Disasters < 11 >
Figure 2.1. Post-Disaster response budget of Government of Indonesia, 2004-2010
■ Disaster contingency fund ■ Line ministry disaster budget
■ Aceh emergency operations ■ Aceh recovery and reconstruction operations
■ West Sumatra reconstruction operations
1614121086420
IDR
tri
llio
n
3.3
1.61.9
4.0
2005
2.9
1.4
10.5
2006
2.71.2
10.4
2007
3.0
1.0
10.9
2008
4.0
2.5
2.5
2010
3.0
1.3
2008
2005 2006 2007 2008 2009 2010
Post disaster response budget (% of total government budget) 2.3% 2.1% 1.9% 1.5% 0.4% 0.8%
Source: Ministry of Finance.
Donor assistance can represent a significant, although uncertain, part of the financing of natural disasters and is likely to decrease in the future. For example, most of the reconstruc-tion financing after the tsunami in Aceh in 2004, which caused losses estimated at US$4.5 billion, was financed through donor assistance. In contrast, donor assistance represented less than 30 percent of the financial resources required in the case of the Yogyakarta earthquake, which caused losses of US$3.1 billion. Given the economic growth of Indo-nesia (and Indonesia being now part of the G20), it is likely that the donor assistance will decrease in the future, as Indonesia has larger domestic financial capacity to cope with the economic losses caused by natural disasters.
From Municipal to Central post-disaster recov-ery financing. In the aftermath of a disaster, the district government establishes a recovery plan. This plan is expected to be financed out of its own bud-get (on contingency line and/or post-disaster budget reallocation). In case the recovery budget exceeds 20 percent of the total budget, the district govern-
ment can ask the provincial government for budget support, or directly request support from the central government. If additional financing is still needed, the provincial government asks the central govern-ment for budget support. The post-disaster evalua-tion committee, which assesses the financing needs, includes representatives of government entities and is chaired by BNPB. Once approved by the evalua-tion committee, a financial request is submitted by BNPB to the Ministry of Finance. The Ministry of Fi-nance seeks approval for the financing plan from Parliament during the semi-annual budget revision. Budget support from the Rehabilitation and Recon-struction Fund is then transferred to the local gov-ernments. The recovery activities are executed by the local government and the line ministries under the coordination of BNPB and BPBD.
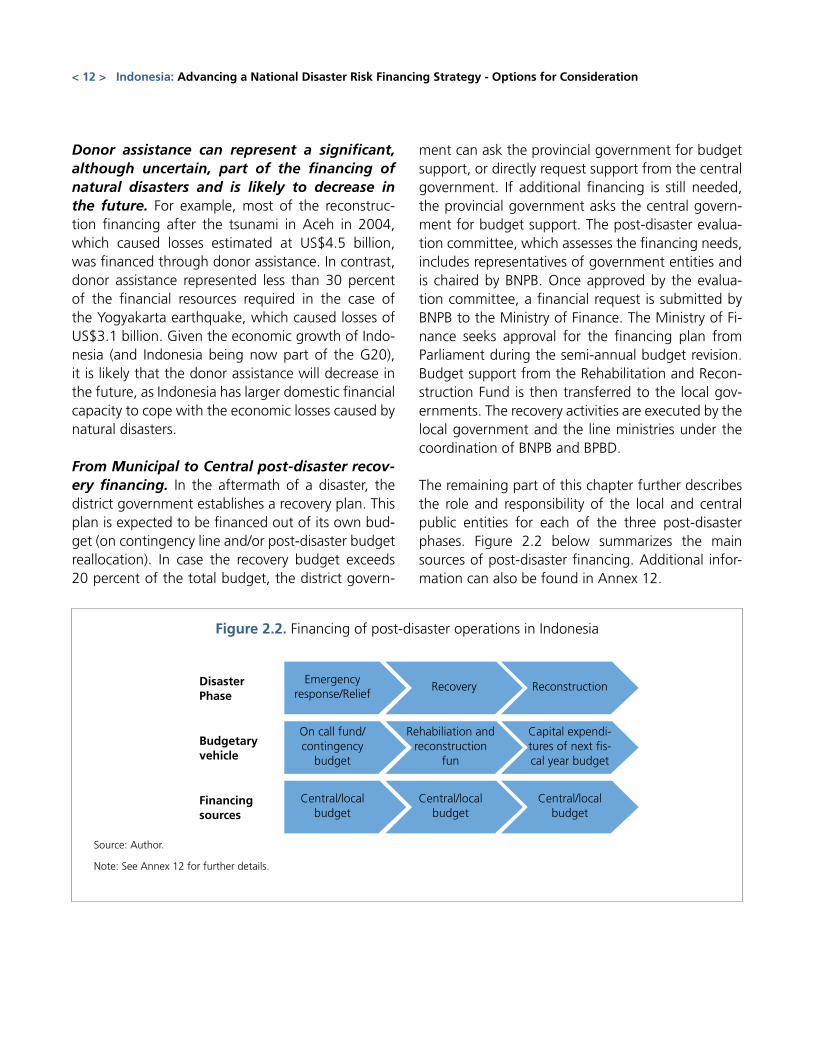
The remaining part of this chapter further describes the role and responsibility of the local and central public entities for each of the three post-disaster phases. Figure 2.2 below summarizes the main sources of post-disaster financing. Additional infor-mation can also be found in Annex 12.
< 12 > Indonesia: Advancing a National Disaster Risk Financing Strategy - Options for Consideration
Emergencyresponse/Relief
Recovery ReconstructionDisasterPhase
On call fund/contingency
budget
Rehabiliation and reconstruction
fun
Capital expendi-tures of next fis-cal year budget
Budgetary vehicle
Central/local budget
Central/local budget
Central/local budget
Financingsources
Source: Author.
Note: See Annex 12 for further details.
Figure 2.2. Financing of post-disaster operations in Indonesia
Emergency Response/Relief Phase
During the first few weeks after a disaster, the emergency response phase includes activities such as rescue and evacuation, and the provision of ba-sic supplies (e.g., food, water), health services, and emergency shelters.
Funds for emergency response activities are immediately available from a variety of sourc-es, depending on the size of the disaster. The local governments use their own financial resources for emergency response through their contingency budget line. If these funds are not sufficient, funds may be provided by the provincial government. In the event of a disaster, BNPB disburses funds from its “on call” fund.
Post-disaster emergency response operations are mostly executed by local governments and financed through their own contingency budget at a relatively fast speed. Local govern-ments do not have specific “on call” funds to be triggered after a disaster, but instead draw monies from their contingency budget line. These funds are quick-disbursing budget items that can be im-mediately executed after a disaster. Provincial gov-ernments also allocate a portion of their budget for unforeseen events such as natural disasters and other non-planned activities through a contingency budget line. Due to the contingent nature of this budget item, funds can only be used for emergency response and cannot be allocated for activities that can be planned in advance, such as reconstruction.
The BNPB ensures coordination of emergency response activities through its “on call” fund. In the event of a National Disaster, “on call” funds are transferred to the local governments through the local disaster agencies BPBD. For larger disasters Ministry of Social Affairs is involved in emergency response operations using their own “on call” fund within their budget. In addition, some portion of the Rehabilitation and Reconstruction Fund can be used as “on call” funds.
Recovery PhaseThe recovery phase (also called rehabilitation phase) starts after the emergency response phase and lasts 3 to 6 months. During this post-disaster phase, lifeline infrastructure (water, electrici-ty, sanitation, etc) and key public buildings (hospitals, bridges, etc) are repaired. Housing rehabilitation as-sistance is also provided to the affected households.
The type of financial assistance provided dur-ing the recovery phase depends on the severity of the event. According to the government regula-tion GR 21/2007, if the disaster damage is less than 20 percent of the municipal budget, recovery is fi-nanced at the local level. If the disaster damage ex-ceeds 20 percent of municipal budget, assistance is provided by the provincial government. If additional funds are required, they are provided by the Central Government through the Rehabilitation and Recon-struction Fund. It should be noted that in the rule is not always followed in practice.
The Rehabilitation and Reconstruction Fund may offer budget resources for the financing of natural disasters. The current Rehabilitation and Reconstruction Fund (Dana Rehabilitasi dan Rekonstruksi4), which is the continuation of funding assistance practice for post-disaster previously man-aged by the Coordinating Ministry for Social Wel-fare, is voted by the Parliament in the annual bud-get. It is not a multi-year reserve fund, but instead, a line item that is renewed every year on the basis of proposal from the executive branch (i.e., today from BNPB). The GR 22/2008 stipulates a Disaster Contingency fund. However, Article 6 (2) of the GR 22/2008 limits the use of the disaster contingency fund only for preparedness activities at the pre-
4 It should be noted that the term ‘Dana Rehabilitasi dan Rekonstruksi’ is not recognized in the GR 22/2008. Instead, article 6 (5) stipulates that: “Social assistance fund through grant is provided in the State Budget (APBN) for activities at the post-disaster stage”. The current practice of requesting to parliament to draw from contingent reserve at the State’s General Treasury leads to the approved fund being called ‘Rehabilitation and Reconstruction (RR) Fund’.
Chapter 2: Fiscal Management of Natural Disasters < 13 >
disaster stage, possibly mixing the term contingency with that of contingency plan, which indeed is a pre-disaster measure. This restriction contradicts the concept of ‘contingent’ being conditional of disaster events that may occur.
In practice disaster contingency funds are not specifically allocated, but instead are drawn from a contingency fund in the State’s General Treasury. The current practice in providing funds for post-disaster rehabilitation and reconstruction has been to propose special budget allocation from the line item “others” (budget code 999) based on proposal submitted to the Parliaments to draw from the broad contingency reserve in the State’s General Treasury (BUN). Proceeds are mainly used for post-disaster recovery expenditures and are predomi-nantly targeted to the affected households (e.g., as social compensations). In 2011, IDR 4 trillion were allocated to this fund, or 0.4 percent of government expenditures. This allocation, referred to as Rehabili-tation and Reconstruction Fund, represents a 5 per-cent increase from IDR 3.8 trillion in 2010 and a 33 percent increase from IDR 3 trillion in 2010.
To engage funds from the Rehabilitation and Reconstruction Fund, BNBP sends a proposal to the Ministry of Finance, which submits it to the Parliament for approval. The parliamentary bud-get process occurs annually and is revised halfway through each year. Recovery expenditures can also be financed during the fiscal year of the disaster through a budget reallocation of capital expendi-tures of the line ministries, but the funds available are limited and are not yet well coordinated.
The current Budget Law does not allow for the fast disbursement of funds in case of disaster and can generate a liquidity crunch. Contrary to emergency spending from the “on call” funds, the execution of funds from the Rehabilitation and Reconstruction Fund to finance post-disaster recov-ery operations has to follow the state budget cycle. Recent experience shows that it can take several months to draw down funds from the Contingency Fund in BUN because any specific allocation and
disbursement must be approved by Parliament. This generates delays in post-disaster recovery and re-construction operations. See Annex 2.
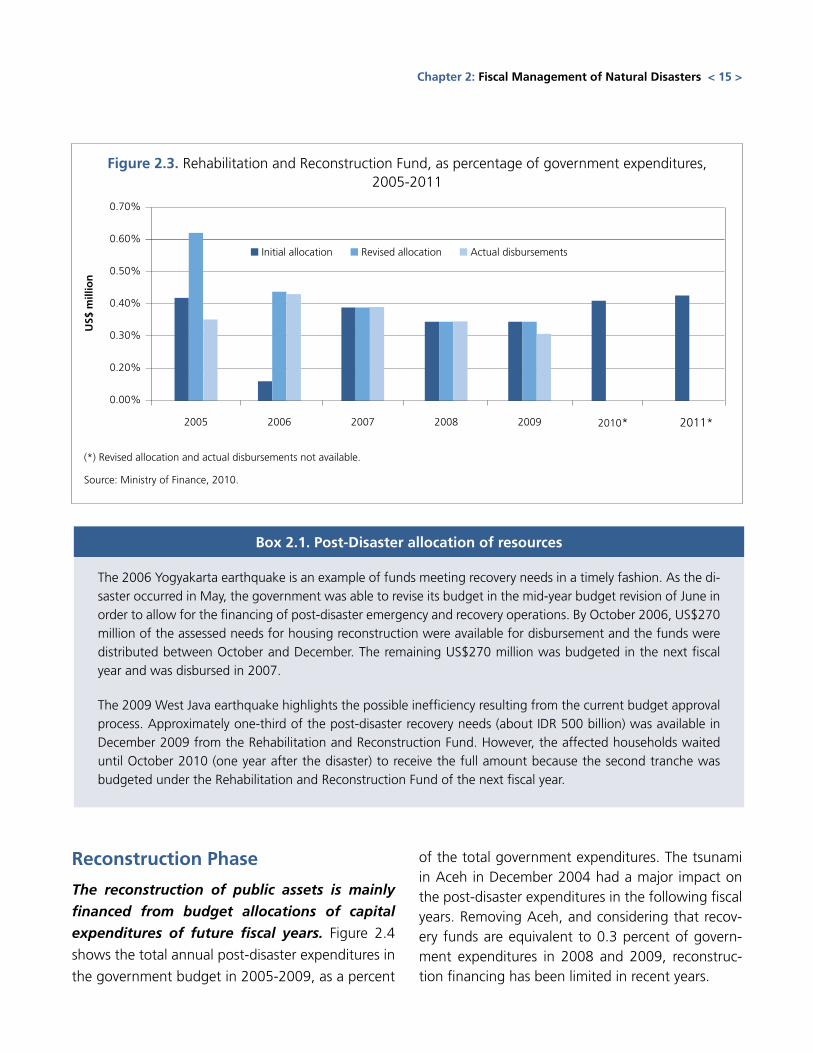
The size of the Rehabilitation and Reconstruc-tion Fund can be revised based on past events and has remained relatively constant in recent years, except in 2011 where it increased signifi-cantly. Figure 2.3 shows the annual allocation to the Rehabilitation and Reconstruction Fund within the initial budget and the revised budget, as well as the actual disbursements, as a percentage of the total government expenditures. The major increase in 2005 in the revised budget is the consequence of the Tsunami in Aceh in December 2004. Likewise, the 2006 increase in the revised budget was voted by the Parliament to finance the emergency and re-covery expenditures in the aftermath of the earth-quake in Yogyakarta of May 2006. In 2007-2009, the initial budget allocation was enough to cover the post-disaster emergency and recovery activities, and no budget revision was needed. The Rehabili-tation and Reconstruction Fund received an annual budget allocation of 0.3 and 0.4 percent of govern-ment expenditures in 2010 and 2011, respectively.
The Ministry of Social Affairs disburses liveli-hood grants and housing compensation to the households affected by a disaster, out of its own budget. The amount varies by disaster. For example, the grant distributed to disaster affected households in Wasior Papua in October 2010 was IDR 5,000 per person, per day, during the recovery phase (normally three to six months). The Ministry of Social Affairs receives an annual allocation for this purpose and if the funds are insufficient, the Minis-try can request an additional allocation in the mid-year budget revision.
The distribution of these grants can take some time. In the case of Aceh Tsunami in late December 2004, for example, the grants were received in May and June 2005, that is, five months after the oc-currence of the disaster. In the case of Yogyakarta earthquake in May 2006, the grants were distrib-uted between June and August 2006. See Box 2.1.
< 14 > Indonesia: Advancing a National Disaster Risk Financing Strategy - Options for Consideration
Chapter 2: Fiscal Management of Natural Disasters < 15 >
Box 2.1. Post-Disaster allocation of resources
The 2006 Yogyakarta earthquake is an example of funds meeting recovery needs in a timely fashion. As the di-saster occurred in May, the government was able to revise its budget in the mid-year budget revision of June in order to allow for the financing of post-disaster emergency and recovery operations. By October 2006, US$270 million of the assessed needs for housing reconstruction were available for disbursement and the funds were distributed between October and December. The remaining US$270 million was budgeted in the next fiscal year and was disbursed in 2007.
The 2009 West Java earthquake highlights the possible inefficiency resulting from the current budget approval process. Approximately one-third of the post-disaster recovery needs (about IDR 500 billion) was available in December 2009 from the Rehabilitation and Reconstruction Fund. However, the affected households waited until October 2010 (one year after the disaster) to receive the full amount because the second tranche was budgeted under the Rehabilitation and Reconstruction Fund of the next fiscal year.
Figure 2.3. Rehabilitation and Reconstruction Fund, as percentage of government expenditures, 2005-2011
(*) Revised allocation and actual disbursements not available.
Source: Ministry of Finance, 2010.
2010* 2011*2005 2006 2007 2008 2009
■ Initial allocation ■ Revised allocation ■ Actual disbursements
0.70%
0.60%
0.50%
0.40%
0.30%
0.20%
0.00%
US$
mill
ion
Reconstruction Phase
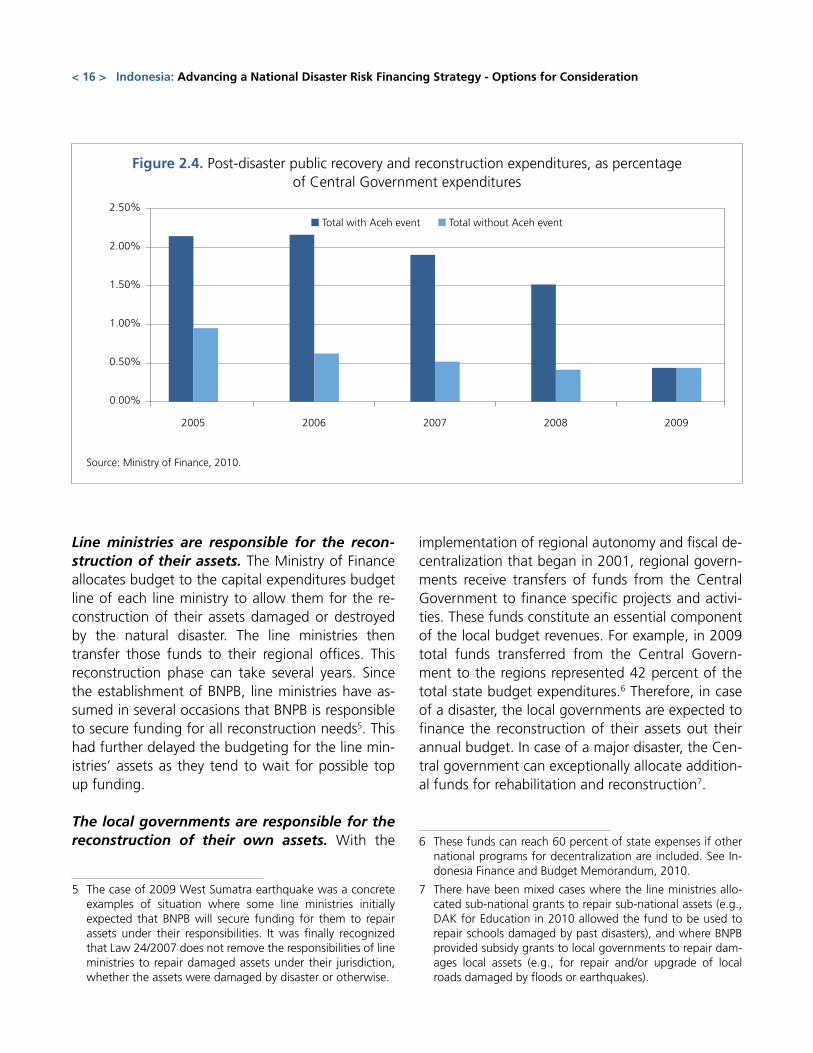
The reconstruction of public assets is mainly
financed from budget allocations of capital
expenditures of future fiscal years. Figure 2.4
shows the total annual post-disaster expenditures in
the government budget in 2005-2009, as a percent
of the total government expenditures. The tsunami in Aceh in December 2004 had a major impact on the post-disaster expenditures in the following fiscal years. Removing Aceh, and considering that recov-ery funds are equivalent to 0.3 percent of govern-ment expenditures in 2008 and 2009, reconstruc-tion financing has been limited in recent years.
< 16 > Indonesia: Advancing a National Disaster Risk Financing Strategy - Options for Consideration
Line ministries are responsible for the recon-struction of their assets. The Ministry of Finance allocates budget to the capital expenditures budget line of each line ministry to allow them for the re-construction of their assets damaged or destroyed by the natural disaster. The line ministries then transfer those funds to their regional offices. This reconstruction phase can take several years. Since the establishment of BNPB, line ministries have as-sumed in several occasions that BNPB is responsible to secure funding for all reconstruction needs5. This had further delayed the budgeting for the line min-istries’ assets as they tend to wait for possible top up funding.
The local governments are responsible for the reconstruction of their own assets. With the
5 The case of 2009 West Sumatra earthquake was a concrete examples of situation where some line ministries initially expected that BNPB will secure funding for them to repair assets under their responsibilities. It was finally recognized that Law 24/2007 does not remove the responsibilities of line ministries to repair damaged assets under their jurisdiction, whether the assets were damaged by disaster or otherwise.
implementation of regional autonomy and fiscal de-centralization that began in 2001, regional govern-ments receive transfers of funds from the Central Government to finance specific projects and activi-ties. These funds constitute an essential component of the local budget revenues. For example, in 2009 total funds transferred from the Central Govern-ment to the regions represented 42 percent of the total state budget expenditures.6 Therefore, in case of a disaster, the local governments are expected to finance the reconstruction of their assets out their annual budget. In case of a major disaster, the Cen-tral government can exceptionally allocate addition-al funds for rehabilitation and reconstruction7.
6 These funds can reach 60 percent of state expenses if other national programs for decentralization are included. See In-donesia Finance and Budget Memorandum, 2010.
7 There have been mixed cases where the line ministries allo-cated sub-national grants to repair sub-national assets (e.g., DAK for Education in 2010 allowed the fund to be used to repair schools damaged by past disasters), and where BNPB provided subsidy grants to local governments to repair dam-ages local assets (e.g., for repair and/or upgrade of local roads damaged by floods or earthquakes).
Figure 2.4. Post-disaster public recovery and reconstruction expenditures, as percentage of Central Government expenditures
Source: Ministry of Finance, 2010.
2005 2006 2007 2008 2009
■ Total with Aceh event ■ Total without Aceh event
2.50%
2.00%
1.50%
1.00%
0.50%
0.00%
Fiscal Disaster Risk Assessment
CH
APT
ER 3
< 17 >
The assessment of the financial and fiscal risk related to natural disasters is the first step in devising di-saster risk financing strategies. Such an assessment ideally requires both historic loss data and modeled losses from catastrophe risk models. This presents a preliminary fiscal risk profile of Government of In-donesia.
Indonesia has conducted post-disaster damage assessments to measure the physical and finan-cial losses caused by adverse natural events for several years. The damage assessment procedure was upgraded in 2006 with the introduction of the PDNA system, based on the Economic Commission for Latin America and the Caribbean (ECLAC) meth-odology. This damage assessment system is intend-ed to record direct physical damage to public and private property in order to facilitate post-disaster recovery and reconstruction financing decisions by government.
Contingent liability and post-disaster spending needsThe contingent liability of the government due to natural disasters creates major fiscal risk. However, the government’s contingent liability is not clearly defined in the laws and thus makes the fiscal risk difficult to assess. Beyond its explicit contingent liability and its associated spending needs, such as the reconstruction of public assets and infrastruc-ture, the Government may have a moral and social responsibility (implicit contingent liability) to assist the population in case of a disaster. For example, the Government provides not only emergency assis-tance (such as food, shelters, and medication) but also can finance recovery/reconstruction activities such as stimulus grants for rebuilding of low-income housing.
The contingent liability of the GoI related to natural disasters can be categorized in short term and medium term post-disaster spend-ing needs. All financial resources do not need to be mobilized immediately after the occurrence of a
disaster. In the aftermath of a disaster, immediate resources must be mobilized to fund post-disaster emergency and recovery activities. Once the recov-ery phase is completed, the GoI must mobilize lon-ger term resources to meet reconstruction needs. In general, there are three broad categories of post-disaster spending needs for which the Government assumed contingent liability, namely: 1) repair of na-tionally owned public assets such as national roads, major water infrastructure, and national govern-ment buildings (typically in medium-term)); 2) repair of sub-nationally owned public assets such as pro-vincial and district roads, schools, or local markets (typically in short-to-medium term); and 3) stimulus grants for livelihood recovery and housing recon-struction (typically in short term).
A major challenge for governments in the af-termath of a disaster is to access immediate liquidity to finance its short-term spending needs. While there are various financial instruments that can be mobilized for the post-disaster recon-struction phase, including additional credit and tax increases, financial instruments that ensure access to immediate liquidity after a disaster are more chal-lenging to access. See Annex 5 which describes the potential financial instruments available.
Assessing the short-term post-disaster spend-ing needs is essential. To devise a cost-effective disaster risk financing strategy, especially for the funding of short-term post-disaster public spend-ing needs, it is critical to assess those possible public spending needs that create additional fiscal risk for the government.
Fiscal disaster risk modelingThe fiscal disaster risk profile of Indonesia, which reflects the government’s contingent lia-bility of natural disasters, should build on both historic disaster losses and simulated disaster losses. Historic disaster loss data, as reported by the provincial and the central governments, informs about the recurrent losses caused by small but fre-
< 18 > Indonesia: Advancing a National Disaster Risk Financing Strategy - Options for Consideration
quent disasters, such as localized floods, small earth-quakes, etc. Simulated catastrophe losses are com-puted from catastrophe risk models for a specific peril, such as earthquake, and inform about possible catastrophe losses caused by a major disaster occur-ring once every 20 years or less frequently.
Probabilistic catastrophe risk models offer the government innovative tools to assess the fi-nancial exposure to natural disasters. Govern-ments in both developed and developing countries are increasingly using catastrophe risk modeling techniques to guide their disaster risk management and financing decisions. Such tools allow for the probabilistic assessment of low-frequency, high se-verity disasters, such as a major earthquake or tropi-cal cyclone occurring once every 20 years or less fre-quently. See Box 3.1.
The reinsurance company PT Maipark has de-veloped an earthquake risk model for the in-surance industry in Indonesia, which still needs some further technical improvements. While the hazard module relies on the state-of-the-art seismic technology and a unique catalogue of his-torical events, some further development would im-prove the model, such as the development of a set of country-specific vulnerability classes. This model is currently being used to develop scenario-based earthquake analysis to guide the Ministry of Finance in its fiscal risk management. See Box 3.2.
Box 3.1. Probabilistic catastrophe risk modeling
Financial disaster risk assessment for governments can be developed using inputs from probabilistic catastrophe risk models. This technique was originally developed by the insurance industry to assess the risk on a portfolio of assets and is increasingly used by governments to assess their exposure to adverse natural events. A typical risk model is made of the following modules:
Hazard module: This module defines the frequency and severity of potential perils (e.g. earthquake, tropical cyclone) at specific locations within the region of interest. This is done by analyzing historical frequencies and reviewing scientific studies performed on the severity and frequencies in the region of interest. This module then generates thousands of stochastic events based on historical data and experts’ opinions.
Exposure module: This is a geo-referenced database of assets at risk, assigning a list of attributes (e.g., exact location, construction type, number of stories) for each asset. This information is used to determine the area’s vulnerability, captured though vulnerability functions. At a larger scale, for example when analyzing an entire country, proxies are used to define the vulnerability of entire neighborhoods or even cities.
Loss module: This module combines the hazard module and the exposure module to calculate different risk metrics, such as the annual expected loss (AEL), which is an expression of the long-term (for example, 1,000 years) average annual loss, and the probable maximum loss for a given return period, which represents the expected loss severity based on likely occurrence, such as the 1-in-50-year loss or the 1-in-100-year loss.
Risk matrices generated by probabilistic risk models can be used to complement historical analysis and are particularly useful to policy makers in assessing the probability of losses and the maximum loss that could be generated by major events (e.g. an earthquake affecting a major city or a cyclone affecting a major port).
Chapter 3: Fiscal Disaster Risk Assessment < 19 >
A disaster risk modeling and management tool, called Risk-in-a-Box is under development. This initiative, undertaken by BNPB with support from the World Bank, the Global Facility for Disaster Re-duction and Recovery (GDFRR) and the Australia-In-donesia Disaster Risk Facility (AIDRF), aims to guide disaster risk management decisions by providing de-tailed risk assessment. The purpose of Risk-in-a-Box is to develop a tool, to be run on laptops, that will model impacts of different hazard events on popula-tion or infrastructure according to given guidelines. The objective of the tool is to support the overall process of sub-national risk assessments in Indone-sia and the software developed is likely to be useful more broadly as a general impact modeling tool.
An analysis of historical losses should comple-ment the earthquake risk modeling approach. The Indonesian earthquake model, once completed, can assist the Ministry of Finance in identifying the fiscal impact of major disasters. However, such an approach: (i) is limited to earthquake risks; and, (ii) does not efficiently capture the more recurrent loss-es usually caused by localized floods or landslide. Re-current localized losses must be taken into account since the accumulation of such events can create significant fiscal losses for the government.
Preliminary fiscal disaster risk profile of Government of IndonesiaThe public spending needs related to post- disaster recovery and reconstruction operations are difficult to trace. As a first attempt to assess this fiscal disaster risk in Indonesia, historic budget expenditures related to natural disasters are used to estimate the impact of natural disaster on the govern-ment budget. Unfortunately, such data is not easily available because most of the post-disaster expendi-tures are not identified as such in the budget. This is particularly true for the recovery expenditures to be financed during the year of the disaster. Reconstruc-tion activities, which usually start several months after a disaster, are typically planned in the budget of fu-ture fiscal years and thus may be easier to trace.
The fiscal disaster risk related to the pub-lic spending needs for post-disaster recovery operations is estimated using the number of buildings affected by disasters, as reported by BNPB. Post-disaster recovery expenditures financed by the government in the first months after a disas-ter are estimated using an indirect approach based on the number of buildings damaged or destroyed as reported by BNPB. Figure 3.1 shows the num-
Box 3.2. Scenario-based earthquake risk analysis for Ministry of Finance
The fiscal department of Ministry of Finance (BKF) set up a working group to develop an earthquake risk model to be used for the fiscal strategy against natural disasters. This working group includes the Bandung Institute of Technology, the private reinsurance company PT Maipark, the Ministry of Public Works, BKMG, LIPI, and the Geological Agency.
The model builds on the earthquake hazard model developed by PT Maipark. An exposure database (includ-ing both public and private assets) will be developed with assistance from the World Bank and the Australia-Indonesia Facility for Disaster Reduction.
A scenario-based analysis will be conducted to assess the economic and fiscal impact of major earthquakes, including probable maximum losses of selected earthquake events. Three areas have been selected for in depth scenario analysis including: i) area of Sunda Straits; ii) coastal area of Central and East Java; and iii) Nusa Tenggara Barat near to Bali island. These areas were selected based on their high vulnerability and economic importance.
< 20 > Indonesia: Advancing a National Disaster Risk Financing Strategy - Options for Consideration
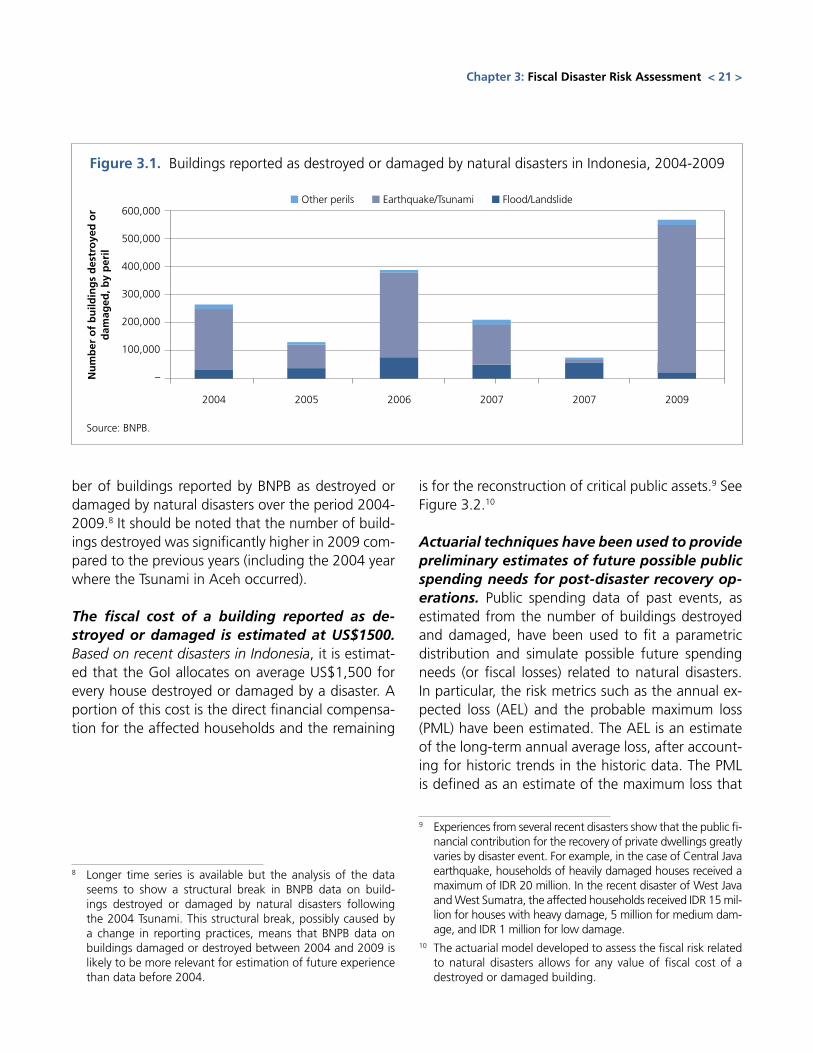
ber of buildings reported by BNPB as destroyed or damaged by natural disasters over the period 2004-2009.8 It should be noted that the number of build-ings destroyed was significantly higher in 2009 com-pared to the previous years (including the 2004 year where the Tsunami in Aceh occurred).
The fiscal cost of a building reported as de-stroyed or damaged is estimated at US$1500. Based on recent disasters in Indonesia, it is estimat-ed that the GoI allocates on average US$1,500 for every house destroyed or damaged by a disaster. A portion of this cost is the direct financial compensa-tion for the affected households and the remaining
8 Longer time series is available but the analysis of the data seems to show a structural break in BNPB data on build-ings destroyed or damaged by natural disasters following the 2004 Tsunami. This structural break, possibly caused by a change in reporting practices, means that BNPB data on buildings damaged or destroyed between 2004 and 2009 is likely to be more relevant for estimation of future experience than data before 2004.
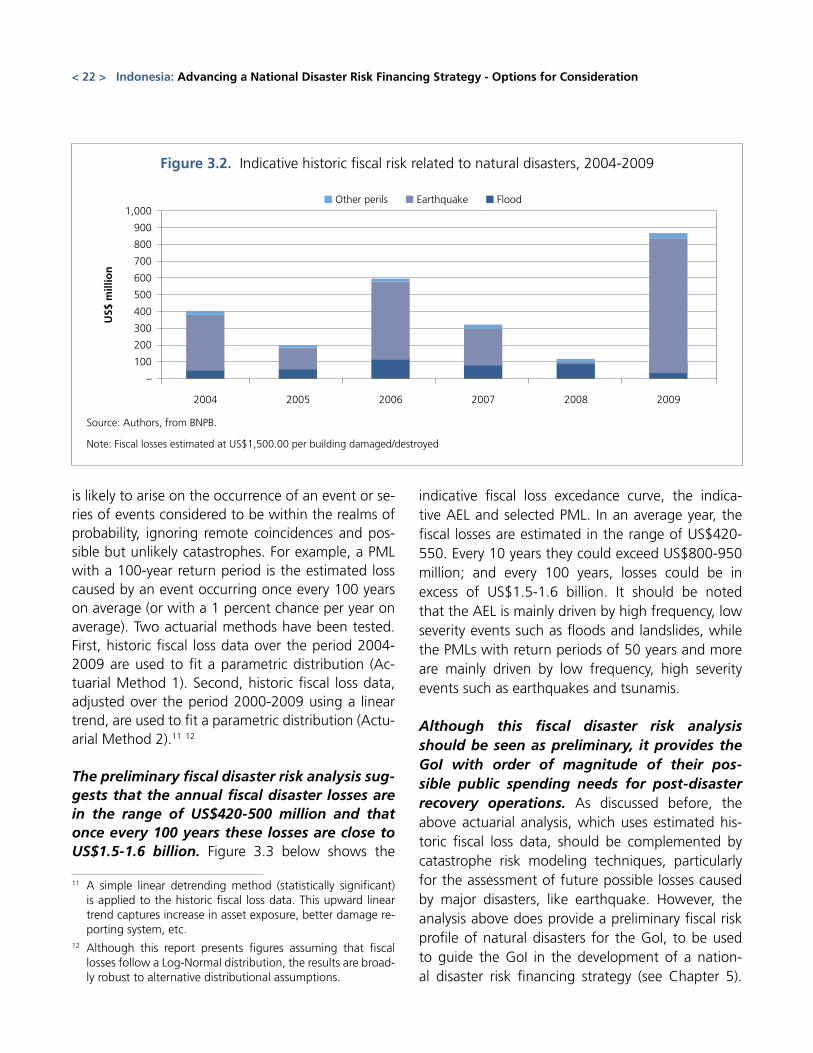
is for the reconstruction of critical public assets.9 See Figure 3.2.10
Actuarial techniques have been used to provide preliminary estimates of future possible public spending needs for post-disaster recovery op-erations. Public spending data of past events, as estimated from the number of buildings destroyed and damaged, have been used to fit a parametric distribution and simulate possible future spending needs (or fiscal losses) related to natural disasters. In particular, the risk metrics such as the annual ex-pected loss (AEL) and the probable maximum loss (PML) have been estimated. The AEL is an estimate of the long-term annual average loss, after account-ing for historic trends in the historic data. The PML is defined as an estimate of the maximum loss that
9 Experiences from several recent disasters show that the public fi-nancial contribution for the recovery of private dwellings greatly varies by disaster event. For example, in the case of Central Java earthquake, households of heavily damaged houses received a maximum of IDR 20 million. In the recent disaster of West Java and West Sumatra, the affected households received IDR 15 mil-lion for houses with heavy damage, 5 million for medium dam-age, and IDR 1 million for low damage.
10 The actuarial model developed to assess the fiscal risk related to natural disasters allows for any value of fiscal cost of a destroyed or damaged building.
Figure 3.1. Buildings reported as destroyed or damaged by natural disasters in Indonesia, 2004-2009
Source: BNPB.
2004 2005 2006 2007 2007 2009
■ Other perils ■ Earthquake/Tsunami ■ Flood/Landslide600,000
500,000
400,000
300,000
200,000
100,000
–Nu
mb
er o
f b
uild
ing
s d
estr
oye
d o
r d
amag
ed, b
y p
eril
Chapter 3: Fiscal Disaster Risk Assessment < 21 >
is likely to arise on the occurrence of an event or se-ries of events considered to be within the realms of probability, ignoring remote coincidences and pos-sible but unlikely catastrophes. For example, a PML with a 100-year return period is the estimated loss caused by an event occurring once every 100 years on average (or with a 1 percent chance per year on average). Two actuarial methods have been tested. First, historic fiscal loss data over the period 2004-2009 are used to fit a parametric distribution (Ac-tuarial Method 1). Second, historic fiscal loss data, adjusted over the period 2000-2009 using a linear trend, are used to fit a parametric distribution (Actu-arial Method 2).11 12
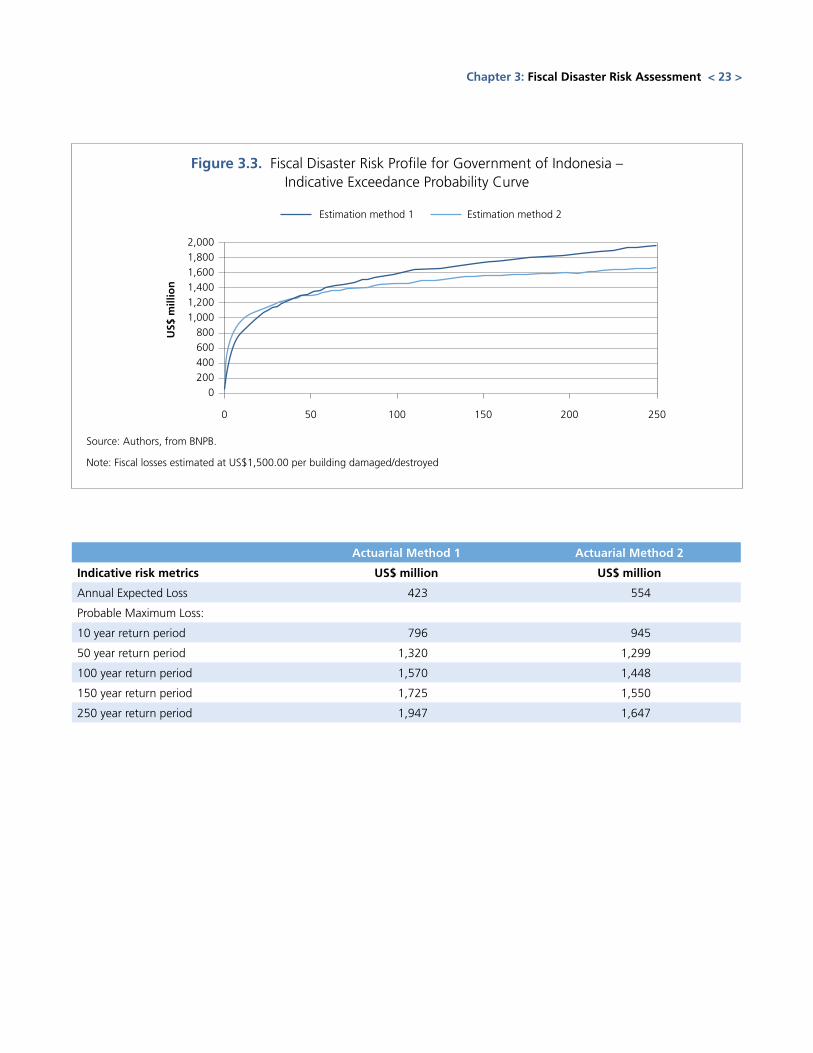
The preliminary fiscal disaster risk analysis sug-gests that the annual fiscal disaster losses are in the range of US$420-500 million and that once every 100 years these losses are close to US$1.5-1.6 billion. Figure 3.3 below shows the
11 A simple linear detrending method (statistically significant) is applied to the historic fiscal loss data. This upward linear trend captures increase in asset exposure, better damage re-porting system, etc.
12 Although this report presents figures assuming that fiscal losses follow a Log-Normal distribution, the results are broad-ly robust to alternative distributional assumptions.
indicative fiscal loss excedance curve, the indica-tive AEL and selected PML. In an average year, the fiscal losses are estimated in the range of US$420-550. Every 10 years they could exceed US$800-950 million; and every 100 years, losses could be in excess of US$1.5-1.6 billion. It should be noted that the AEL is mainly driven by high frequency, low severity events such as floods and landslides, while the PMLs with return periods of 50 years and more are mainly driven by low frequency, high severity events such as earthquakes and tsunamis.
Although this fiscal disaster risk analysis should be seen as preliminary, it provides the GoI with order of magnitude of their pos-sible public spending needs for post-disaster recovery operations. As discussed before, the above actuarial analysis, which uses estimated his-toric fiscal loss data, should be complemented by catastrophe risk modeling techniques, particularly for the assessment of future possible losses caused by major disasters, like earthquake. However, the analysis above does provide a preliminary fiscal risk profile of natural disasters for the GoI, to be used to guide the GoI in the development of a nation-al disaster risk financing strategy (see Chapter 5).
Figure 3.2. Indicative historic fiscal risk related to natural disasters, 2004-2009
Source: Authors, from BNPB.
Note: Fiscal losses estimated at US$1,500.00 per building damaged/destroyed
2004 2005 2006 2007 20092008
■ Other perils ■ Earthquake ■ Flood1,000
900
800
700
600
500
400
300
200
100
–
U
S$ m
illio
n
< 22 > Indonesia: Advancing a National Disaster Risk Financing Strategy - Options for Consideration
Actuarial Method 1 Actuarial Method 2
Indicative risk metrics US$ million US$ million
Annual Expected Loss 423 554
Probable Maximum Loss:
10 year return period 796 945
50 year return period 1,320 1,299
100 year return period 1,570 1,448
150 year return period 1,725 1,550
250 year return period 1,947 1,647
Figure 3.3. Fiscal Disaster Risk Profile for Government of Indonesia – Indicative Exceedance Probability Curve
Source: Authors, from BNPB.
Note: Fiscal losses estimated at US$1,500.00 per building damaged/destroyed
50 100 150 200 2500
2,000
1,800
1,600
1,400
1,200
1,000
800
600
400
200
0
U
S$ m
illio
n
Estimation method 1 Estimation method 2
Chapter 3: Fiscal Disaster Risk Assessment < 23 >

Review of Private Catastrophe Risk Insurance Market
in Indonesia
CH
APT
ER 4
< 25 >
Indonesia’s non-life insurance market is un-der-developed. The non-life insurance market in Indonesia is less developed than in its neighboring countries. The non-life insurance penetration rate, measured as a percentage of GDP, is estimated at 0.6 percent in Indonesia compared to 1.6 percent in Malaysia and 1.1 percent in Thailand.
The current insurance regulatory framework does not monitor or control catastrophe risk. There is no specific regulatory treatment of catastrophe risks, such as specific capital or reinsurance protection re-quirements or catastrophe reserves.
Private property catastrophe insurance
PT Maipark is the only specialized earthquake insurance company in Indonesia. The General Insurance Association of Indonesia, supported by the GoI and the Bureau of Insurance, established the specialized catastrophe insurance company PT Maipark in 2004. The mandate of this insurer, owned by the domestic non-life insurance companies, is to: i) promote discipline and proper handling of earth-quake insurance; ii) set a benchmark for earthquake
insurance pricing; iii) develop a hazard and exposure database for earthquakes; and, iv) build local capac-ity for earthquake resilience. A full description of Maipark can be found in Annex 3.
Earthquake insurance penetration is very low with less than 5 percent of assets insured (main-ly commercial and industrial assets). The volume of Maipark’s coverage for non-life catastrophic in-surance was estimated at US$2.6 billion in 2008. However, market penetration is increasingly quickly. Premiums written in 2009 totaled US$8.8 million compared to US$6.5 million in 2008, a growth rate of 27 percent. The maximum commission paid on earthquake cessions is 8.5 percent.
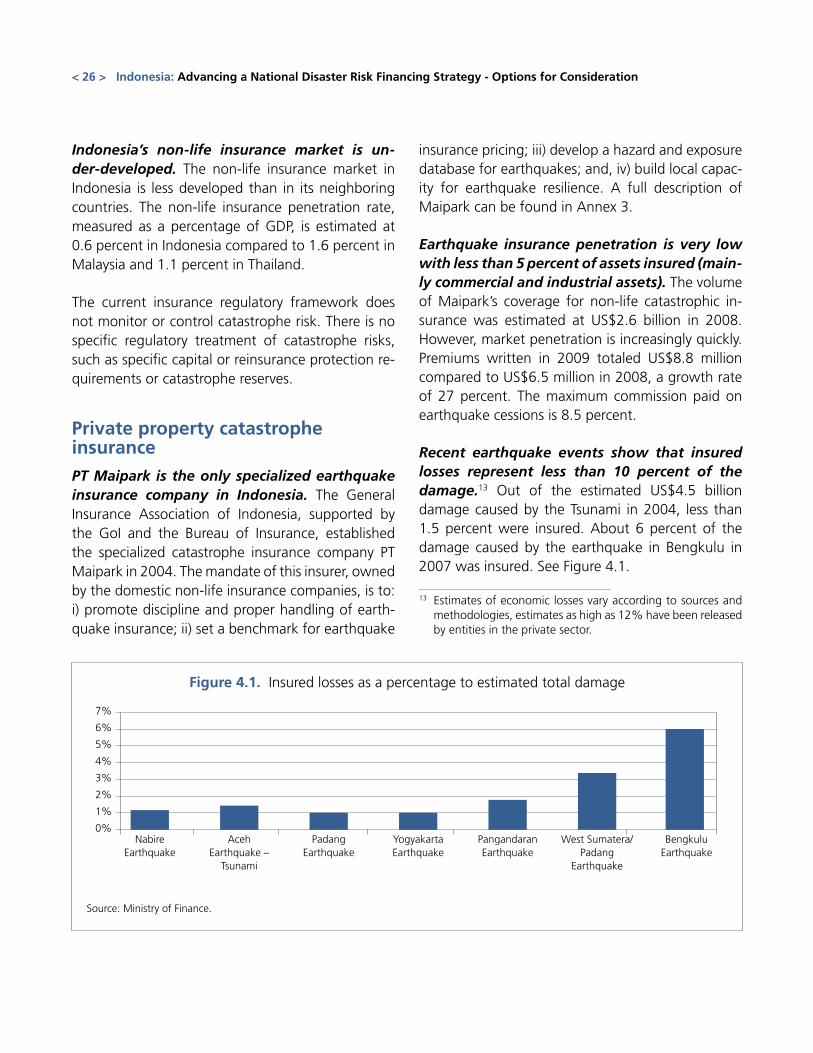
Recent earthquake events show that insured losses represent less than 10 percent of the damage.13 Out of the estimated US$4.5 billion damage caused by the Tsunami in 2004, less than 1.5 percent were insured. About 6 percent of the damage caused by the earthquake in Bengkulu in 2007 was insured. See Figure 4.1.
13 Estimates of economic losses vary according to sources and methodologies, estimates as high as 12% have been released by entities in the private sector.
Figure 4.1. Insured losses as a percentage to estimated total damage
Source: Ministry of Finance.
7%
6%
5%
4%
3%
2%
1%
0%Nabire
EarthquakeAceh
Earthquake – Tsunami
Padang Earthquake
Yogyakarta Earthquake
Pangandaran Earthquake
West Sumatera/Padang
Earthquake
Bengkulu Earthquake
< 26 > Indonesia: Advancing a National Disaster Risk Financing Strategy - Options for Consideration
Earthquake insurance premium rates vary by zone and type of buildings. Earthquake premium rates, developed by Maipark and approved by the Insurance Association, vary by zone (5 zones), use (commercial and industrial, residential) and type of construction. They vary from 0.85 per mill to 4.7 per mill of the total sum insured. See Annex 3 for addi-tional coverage details.
Other forms of catastrophe risk insurance have been piloted, such as a microinsurance against floods. Developed by Whana Tata in 2009, this product was established in partnership with the German development agency GTZ and the reinsurer Munich Re. This product is not a property insurance product, as the payout is not based on actual prop-erty losses. Rather it serves as livelihood coverage against floods, providing immediate cash to the in-sured households located in flooded areas. This bi-nary insurance product is sold for IDR 50,000 and pays IDR 250,000 when flooding in Jakarta reaches a certain predefined level. Coverage cards (or sev-eral) can be purchased by any person that can prove residence in the covered area, which was available in 23 sub-districts of Jakarta, and about 500 cards were sold through local insurance agents. The pro-gram was not renewed in 2010.
Catastrophe risk insurance of public assetsPublic assets are usually not insured for cata-strophic events, although some provinces/mu-nicipalities have begun insuring their critical assets. Assets owned by the Central Government are not insured, and similar to many developed countries, the Central Government is, de facto, its own insurer. However there have been recent initia-tives in some provinces to insure selected public as-sets against natural disasters.
The West Sumatra Province government has in-sured its local assets against earthquake risks since 2008. This insurance coverage protects 42 lo-cal government buildings, four hospitals, 73 local government official and guest houses. The insurance premium is paid from a specific budget item “ex-penditure for insurance of local government assets”. Total insurance premiums were around IDR 200 mil-lion in 2010. The first claim experience was after the earthquake of September 2009 and was settled in May 2010 (i.e., seven months after the earthquake) for an amount of IDR 20 billion.
The municipality of Yogyakarta has insured its public assets since 2003, including government buildings, schools, hospitals, traditional mar-ket places, and motor vehicles. After the 2006 earthquake, the municipality received a payout of IDR3.4 billion, which represents 14 times the annual premium that year In addition to protecting public assets, the municipality plans to set up compulsory property catastrophe insurance for private dwellings with insurance premiums bundled with the land and property tax (PBB) payment.
Chapter 4: Review of Private Catastrophe Risk Insurance Market in Indonesia < 27 >

Options for National Disaster Risk Financing Strategy
in Indonesia
CH
APT
ER 5
< 29 >
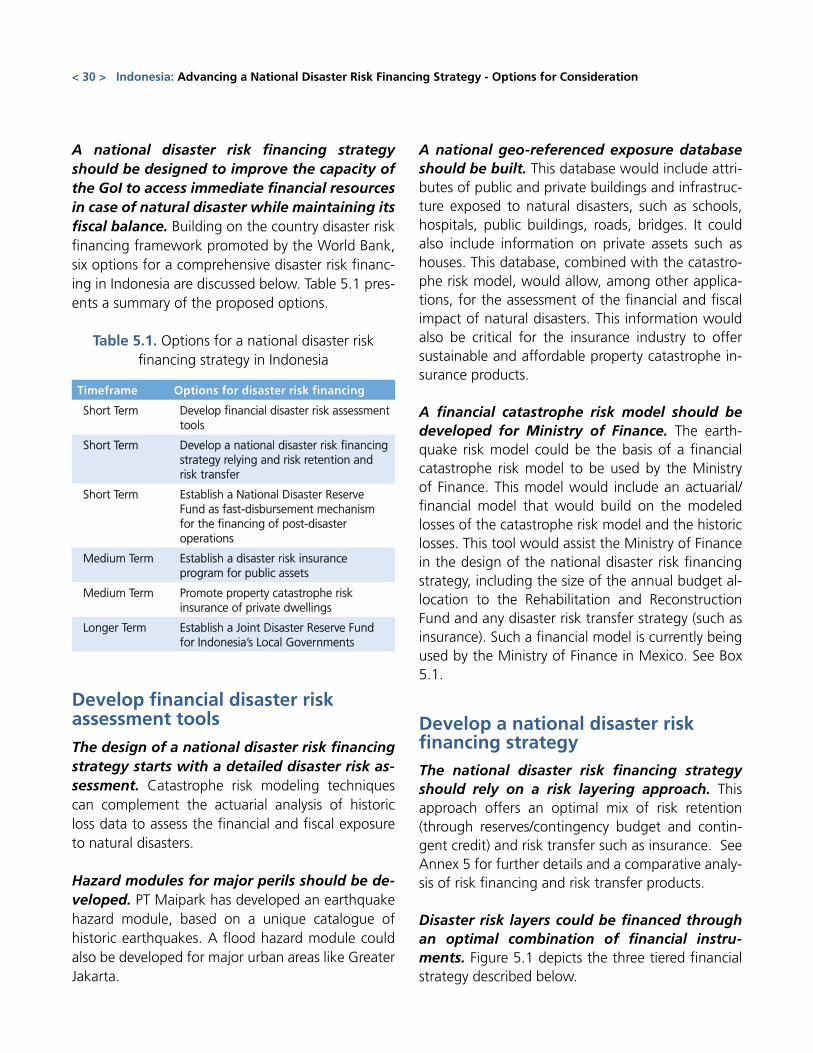
A national disaster risk financing strategy should be designed to improve the capacity of the GoI to access immediate financial resources in case of natural disaster while maintaining its fiscal balance. Building on the country disaster risk financing framework promoted by the World Bank, six options for a comprehensive disaster risk financ-ing in Indonesia are discussed below. Table 5.1 pres-ents a summary of the proposed options.
Table 5.1. Options for a national disaster risk financing strategy in Indonesia
Timeframe Options for disaster risk financing
Short Term Develop financial disaster risk assessment tools
Short Term Develop a national disaster risk financing strategy relying and risk retention and risk transfer
Short Term Establish a National Disaster Reserve Fund as fast-disbursement mechanism for the financing of post-disaster operations
Medium Term Establish a disaster risk insurance program for public assets
Medium Term Promote property catastrophe risk insurance of private dwellings
Longer Term Establish a Joint Disaster Reserve Fund for Indonesia’s Local Governments
Develop financial disaster risk assessment tools
The design of a national disaster risk financing strategy starts with a detailed disaster risk as-sessment. Catastrophe risk modeling techniques can complement the actuarial analysis of historic loss data to assess the financial and fiscal exposure to natural disasters.
Hazard modules for major perils should be de-veloped. PT Maipark has developed an earthquake hazard module, based on a unique catalogue of historic earthquakes. A flood hazard module could also be developed for major urban areas like Greater Jakarta.
A national geo-referenced exposure database should be built. This database would include attri-butes of public and private buildings and infrastruc-ture exposed to natural disasters, such as schools, hospitals, public buildings, roads, bridges. It could also include information on private assets such as houses. This database, combined with the catastro-phe risk model, would allow, among other applica-tions, for the assessment of the financial and fiscal impact of natural disasters. This information would also be critical for the insurance industry to offer sustainable and affordable property catastrophe in-surance products.
A financial catastrophe risk model should be developed for Ministry of Finance. The earth-quake risk model could be the basis of a financial catastrophe risk model to be used by the Ministry of Finance. This model would include an actuarial/financial model that would build on the modeled losses of the catastrophe risk model and the historic losses. This tool would assist the Ministry of Finance in the design of the national disaster risk financing strategy, including the size of the annual budget al-location to the Rehabilitation and Reconstruction Fund and any disaster risk transfer strategy (such as insurance). Such a financial model is currently being used by the Ministry of Finance in Mexico. See Box 5.1.
Develop a national disaster risk financing strategyThe national disaster risk financing strategy should rely on a risk layering approach. This approach offers an optimal mix of risk retention (through reserves/contingency budget and contin-gent credit) and risk transfer such as insurance. See Annex 5 for further details and a comparative analy-sis of risk financing and risk transfer products.
Disaster risk layers could be financed through an optimal combination of financial instru-ments. Figure 5.1 depicts the three tiered financial strategy described below.
< 30 > Indonesia: Advancing a National Disaster Risk Financing Strategy - Options for Consideration
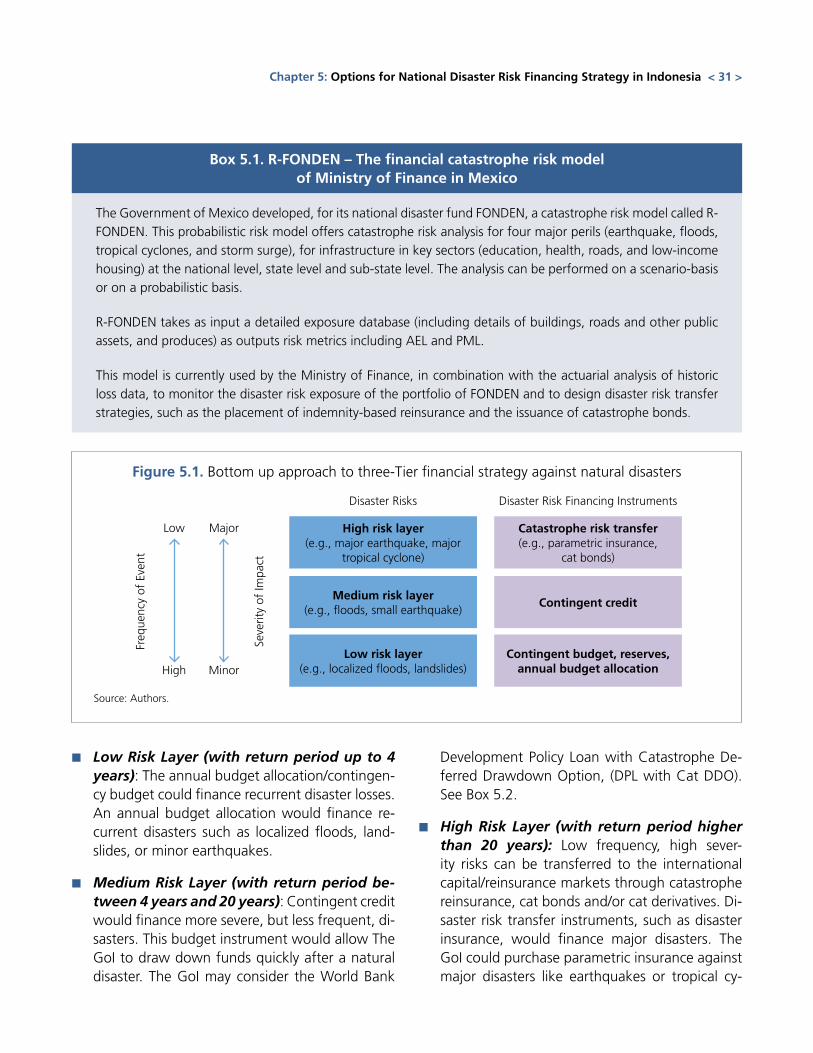
■■ Low Risk Layer (with return period up to 4 years): The annual budget allocation/contingen-cy budget could finance recurrent disaster losses. An annual budget allocation would finance re-current disasters such as localized floods, land-slides, or minor earthquakes.
■■ Medium Risk Layer (with return period be-tween 4 years and 20 years): Contingent credit would finance more severe, but less frequent, di-sasters. This budget instrument would allow The GoI to draw down funds quickly after a natural disaster. The GoI may consider the World Bank
Development Policy Loan with Catastrophe De-ferred Drawdown Option, (DPL with Cat DDO). See Box 5.2.
■■ High Risk Layer (with return period higher than 20 years): Low frequency, high sever-ity risks can be transferred to the international capital/reinsurance markets through catastrophe reinsurance, cat bonds and/or cat derivatives. Di-saster risk transfer instruments, such as disaster insurance, would finance major disasters. The GoI could purchase parametric insurance against major disasters like earthquakes or tropical cy-
Chapter 5: Options for National Disaster Risk Financing Strategy in Indonesia < 31 >
Box 5.1. R-FONDEN – The financial catastrophe risk modelof Ministry of Finance in Mexico
The Government of Mexico developed, for its national disaster fund FONDEN, a catastrophe risk model called R-FONDEN. This probabilistic risk model offers catastrophe risk analysis for four major perils (earthquake, floods, tropical cyclones, and storm surge), for infrastructure in key sectors (education, health, roads, and low-income housing) at the national level, state level and sub-state level. The analysis can be performed on a scenario-basis or on a probabilistic basis.
R-FONDEN takes as input a detailed exposure database (including details of buildings, roads and other public assets, and produces) as outputs risk metrics including AEL and PML.
This model is currently used by the Ministry of Finance, in combination with the actuarial analysis of historic loss data, to monitor the disaster risk exposure of the portfolio of FONDEN and to design disaster risk transfer strategies, such as the placement of indemnity-based reinsurance and the issuance of catastrophe bonds.
Disaster Risks
High risk layer(e.g., major earthquake, major
tropical cyclone)
Medium risk layer(e.g., floods, small earthquake)
Low risk layer(e.g., localized floods, landslides)
Catastrophe risk transfer(e.g., parametric insurance,
cat bonds)
Contingent credit
Contingent budget, reserves, annual budget allocation
Disaster Risk Financing Instruments
Freq
uenc
y of
Eve
nt
Seve
rity
of Im
pact
Low
High
Major
Minor
Figure 5.1. Bottom up approach to three-Tier financial strategy against natural disasters
Source: Authors.
clones. Payouts would be disbursed based on parametric triggers, such as the magnitude of an earthquake or the intensity of a tropical cyclone. This type of insurance is transparent and allows for fast claims settlement (usually within 2 to 4 weeks).
A “bottom-up” disaster risk financing approach should be considered. The GoI should first secure financing for recurrent events (bottom risk layer) through risk retention (reserves and/or contingent credit) and then move up by increasing its level of financial resilience through disaster risk transfer in-struments.
Although the national budget does not explicitly prohibit the purchase of insurance, there is cur-rently no specific budget item allowing for the payment of insurance premiums. Under the cur-rent budget law, BNPB cannot use its annual budget allocation to purchase insurance. It should be allowed under the budget law to use part of its resources to purchase insurance. In Mexico, for example, the bud-get law authorizes the national disaster fund FON-DEN, through its Trust Fund, to use part of its annual budget allocation for the purchase of financial risk transfer instruments such as insurance and catastro-phe bonds. Such transactions are made through the public reinsurance company Agroasemex.
Additional financial capacity could be secured through parametric insurance. The GoI could complement its reserves and/or contingent credit with parametric insurance. Parametric insurance products are insurance contracts that make pay-ments based on the intensity of an event (for exam-ple, wind speed, earthquake intensity) rather than the actual loss. Unlike traditional insurance settle-ments, which require an assessment of individual losses on the ground, parametric insurance relies on an assessment of losses using a predefined formula based on variables that are exogenous to both the individual policyholder and the insurer, but which have a strong correlation to individual losses. Para-metric instruments allow for fast claims settlement (usually within 2 to 4 weeks) and are less exposed to moral hazard and adverse selection. However, para-metric products are exposed to basis risk, i.e., the possibility that claims payments may not perfectly match individual losses. Careful design of index in-surance parameters is important to help reduce ba-sis risk. Key features for parametric insurance cover-age are defined in Box 5.3 and Table 5.2. See Annex 7 for a complete description of parametric insurance coverage.
< 32 > Indonesia: Advancing a National Disaster Risk Financing Strategy - Options for Consideration
Box 5.2. World Bank Catastrophe Deferred Drawdown Option
The Development Policy Loan (DPL) with catastrophe draw down options (Cat DDO) offers a source of im-mediate liquidity that can serve as bridge financing while other sources (e.g. concessional funding, bilateral aid or reconstruction loans) are being mobilized after a natural disaster. Borrowers have access to financing in amounts up to US$500 million or 0.25 percent of GDP (whichever is less). The Cat DDO has a “soft” trigger, as opposed to “parametric” trigger; funds can be drawn down upon the occurrence of a natural disaster resulting in the declaration of a state of emergency. See Annex 6 for additional details.
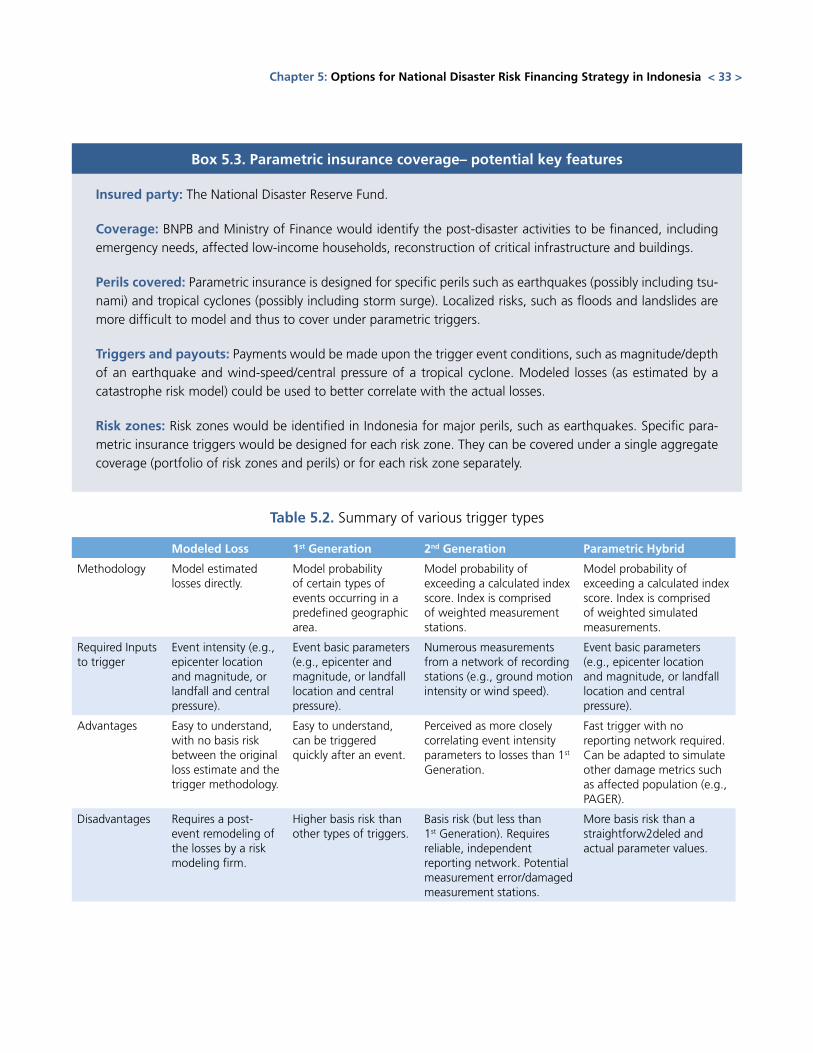
Table 5.2. Summary of various trigger types
Modeled Loss 1st Generation 2nd Generation Parametric Hybrid
Methodology Model estimated losses directly.
Model probability of certain types of events occurring in a predefined geographic area.
Model probability of exceeding a calculated index score. Index is comprised of weighted measurement stations.
Model probability of exceeding a calculated index score. Index is comprised of weighted simulated measurements.
Required Inputs to trigger
Event intensity (e.g., epicenter location and magnitude, or landfall and central pressure).
Event basic parameters (e.g., epicenter and magnitude, or landfall location and central pressure).
Numerous measurements from a network of recording stations (e.g., ground motion intensity or wind speed).
Event basic parameters (e.g., epicenter location and magnitude, or landfall location and central pressure).
Advantages Easy to understand, with no basis risk between the original loss estimate and the trigger methodology.
Easy to understand, can be triggered quickly after an event.
Perceived as more closely correlating event intensity parameters to losses than 1st Generation.
Fast trigger with no reporting network required. Can be adapted to simulate other damage metrics such as affected population (e.g., PAGER).
Disadvantages Requires a post-event remodeling of the losses by a risk modeling firm.
Higher basis risk than other types of triggers.
Basis risk (but less than 1st Generation). Requires reliable, independent reporting network. Potential measurement error/damaged measurement stations.
More basis risk than a straightforw2deled and actual parameter values.
Chapter 5: Options for National Disaster Risk Financing Strategy in Indonesia < 33 >
Box 5.3. Parametric insurance coverage– potential key features
Insured party: The National Disaster Reserve Fund.
Coverage: BNPB and Ministry of Finance would identify the post-disaster activities to be financed, including emergency needs, affected low-income households, reconstruction of critical infrastructure and buildings.
Perils covered: Parametric insurance is designed for specific perils such as earthquakes (possibly including tsu-nami) and tropical cyclones (possibly including storm surge). Localized risks, such as floods and landslides are more difficult to model and thus to cover under parametric triggers.
Triggers and payouts: Payments would be made upon the trigger event conditions, such as magnitude/depth of an earthquake and wind-speed/central pressure of a tropical cyclone. Modeled losses (as estimated by a catastrophe risk model) could be used to better correlate with the actual losses.
Risk zones: Risk zones would be identified in Indonesia for major perils, such as earthquakes. Specific para-metric insurance triggers would be designed for each risk zone. They can be covered under a single aggregate coverage (portfolio of risk zones and perils) or for each risk zone separately.
The GoI could complement its financial disas-ter risk transfer strategy by issuing catastrophe bonds against extreme losses caused by spe-cific perils. Catastrophe bonds are index-linked se-curities that secure financial resources on the capital markets, to be disbursed in case of the occurrence of a pre-defined natural disaster. Cat bonds gener-ally cover the highest level of risk and are mainly issued to specific perils with an annual probability of occurrence of 2 percent or less (that is, a return pe-riod of 50 years or more). Mexico issued cat bonds in 2006 and in 2009. The 2009 MultiCat program is described in Box 5.4 and Annex 9.
An indicative national disaster risk financing strategy is proposed below. The fiscal disaster risk profile described in Chapter 2 and the above-mentioned risk layering approached are the basis for the design of a comprehensive national disaster risk financing strategy. It relies on a three-tier risk financ-ing approach: reserves, contingent credit and risk transfer (e.g., parametric insurance). Figure 5.2 illus-trates the indicative disaster risk financing strategy.
The annual budget allocation could increase to 0.5 percent of the annual government budget expenditures, or US$500 million. This annual allo-cation is estimated to allow the government to cover the recovery costs of recurrent natural disasters, for events with a return period up to 4 years. The GoI has already increased the annual budget allocation to IDR 4 trillion (approx. US$450 million) in 2011.
A contingent credit line of US$500 million could be secured to increase the retention capacity of the GoI. This contingent credit line, such as the
World Bank DPL with Cat DDO, would be triggered on average every 4 years, when the annual budget al-location is exhausted.14 Whilst the GoI could increase the annual budget allocation to US$1 billion instead of securing a contingent credit line, it may be politi-cally more sustainable to pre-fund losses through the reserve fund that are expected to occur once every 4 years and post-fund larger losses (by repaying any drawn down debt) expected to occur on average ev-ery 4 to 20 years. A contingent credit line enables the government to save reinsurance costs without the need to increase the annual budget allocation beyond what would be politically sustainable.
The contingent credit could be used as a bridg-ing facility. The contingent credit can act as bridg-ing funding facility for post-disaster rapid recovery to suit Indonesia’s specific budgetary needs. The fa-cility can be set with flexible triggers, to allow GoI to access short-term liquidity (especially when a disas-ter occurs at the end of budget revision cycle), and to allow GoI to repay the loan once the new fiscal year starts.
A (parametric) disaster insurance coverage of US$800 million could be purchased to leverage the financial capacity of the GoI. This insurance coverage would protect the government against
14 The Cat DDO is shown to be at least 40 percent less expen-sive (in expected net present value) than the average disaster insurance premium for medium risk layers. This analysis is based on the comparison, for a given risk layer, between the average disaster insurance premium and the expected net present value of the cost of the CAT DDO (which depends on the free end fee, the interest rate and the discount rate). See Clarke and Mahul (2011).
< 34 > Indonesia: Advancing a National Disaster Risk Financing Strategy - Options for Consideration
Box 5.4. Mexican Catastrophe Bond MultiCat
In 2009, the Government of Mexico issued a four-tranche cat bond (totaling US$290 million) with a three-year maturity under the MultiCat Program. The issuer is a Special Purpose Vehicle (SPV) that indirectly provides para-metric insurance to FONDEN against earthquake risk in three regions around Mexico City and hurricanes on the Atlantic and Pacific coasts. The cat bond will repay the principal to investors unless an earthquake or hurricane triggers a transfer of the funds to the Mexican government. See Annex 9 for additional details.
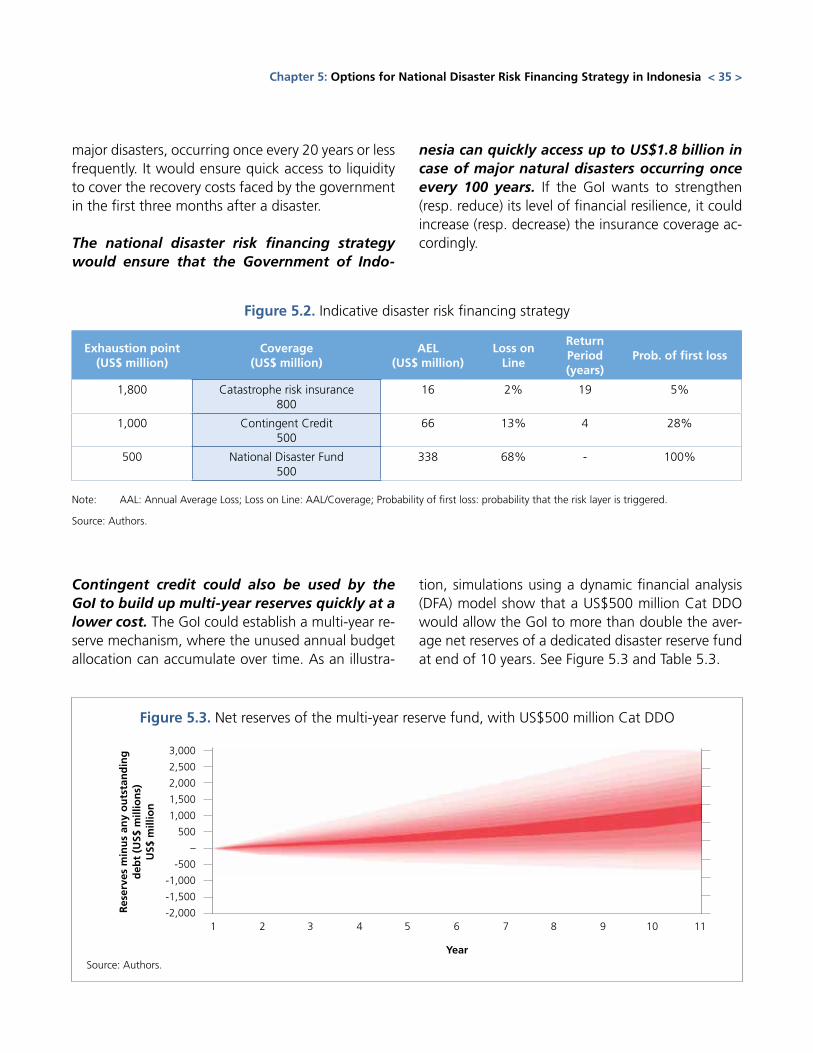
major disasters, occurring once every 20 years or less frequently. It would ensure quick access to liquidity to cover the recovery costs faced by the government in the first three months after a disaster.
The national disaster risk financing strategy would ensure that the Government of Indo-
nesia can quickly access up to US$1.8 billion in case of major natural disasters occurring once every 100 years. If the GoI wants to strengthen (resp. reduce) its level of financial resilience, it could increase (resp. decrease) the insurance coverage ac-cordingly.
Chapter 5: Options for National Disaster Risk Financing Strategy in Indonesia < 35 >
Figure 5.2. Indicative disaster risk financing strategy
Exhaustion point(US$ million)
Coverage(US$ million)
AEL(US$ million)
Loss on Line
Return Period (years)
Prob. of first loss
1,800 Catastrophe risk insurance800
16 2% 19 5%
1,000 Contingent Credit500
66 13% 4 28%
500 National Disaster Fund500
338 68% - 100%
Note: AAL: Annual Average Loss; Loss on Line: AAL/Coverage; Probability of first loss: probability that the risk layer is triggered.
Source: Authors.
Contingent credit could also be used by the GoI to build up multi-year reserves quickly at a lower cost. The GoI could establish a multi-year re-serve mechanism, where the unused annual budget allocation can accumulate over time. As an illustra-
tion, simulations using a dynamic financial analysis (DFA) model show that a US$500 million Cat DDO would allow the GoI to more than double the aver-age net reserves of a dedicated disaster reserve fund at end of 10 years. See Figure 5.3 and Table 5.3.
Figure 5.3. Net reserves of the multi-year reserve fund, with US$500 million Cat DDO
Source: Authors.
3,000
2,500
2,000
1,500
1,000
500
–
-500
-1,000
-1,500
-2,000 1 2 3 4 5 6 7 8 9 10 11
Res
erve
s m
inu
s an
y o
uts
tan
din
g
deb
t (U
S$ m
illio
ns)
U
S$ m
illio
n
Year
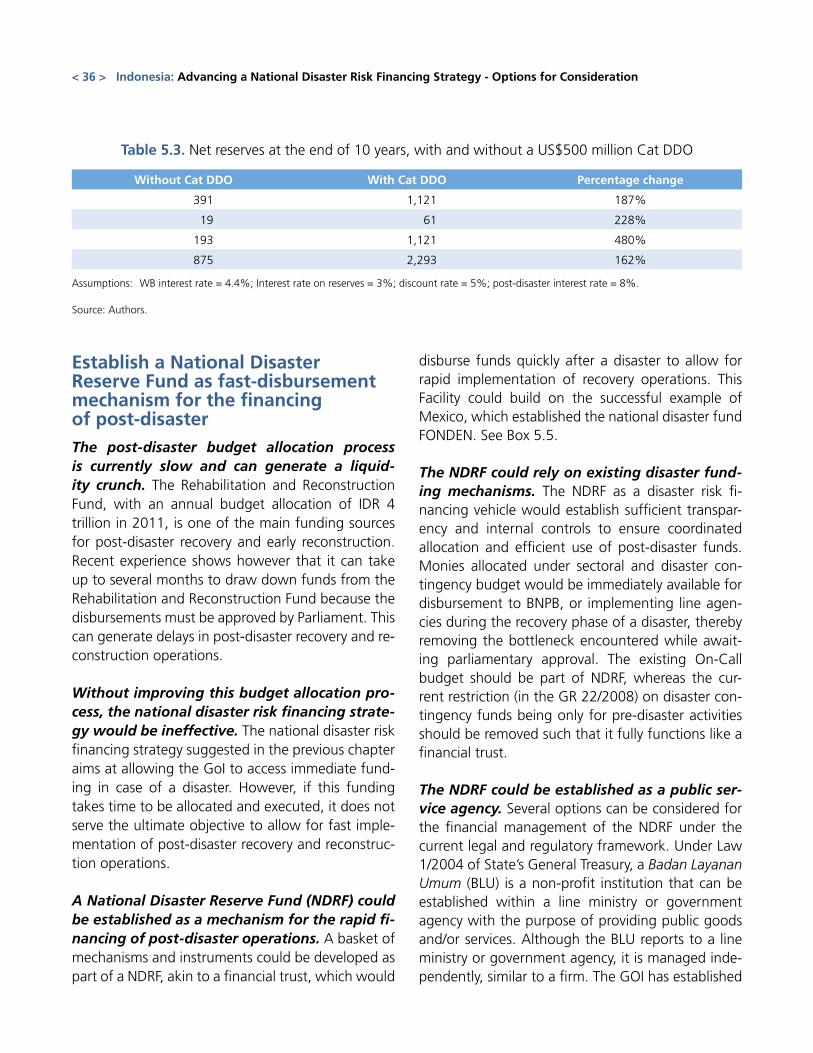
Table 5.3. Net reserves at the end of 10 years, with and without a US$500 million Cat DDO
Without Cat DDO With Cat DDO Percentage change
391 1,121 187%
19 61 228%
193 1,121 480%
875 2,293 162%
Assumptions: WB interest rate = 4.4%; Interest rate on reserves = 3%; discount rate = 5%; post-disaster interest rate = 8%.
Source: Authors.
< 36 > Indonesia: Advancing a National Disaster Risk Financing Strategy - Options for Consideration
Establish a National Disaster Reserve Fund as fast-disbursement mechanism for the financing of post-disaster The post-disaster budget allocation process is currently slow and can generate a liquid-ity crunch. The Rehabilitation and Reconstruction Fund, with an annual budget allocation of IDR 4 trillion in 2011, is one of the main funding sources for post-disaster recovery and early reconstruction. Recent experience shows however that it can take up to several months to draw down funds from the Rehabilitation and Reconstruction Fund because the disbursements must be approved by Parliament. This can generate delays in post-disaster recovery and re-construction operations.
Without improving this budget allocation pro-cess, the national disaster risk financing strate-gy would be ineffective. The national disaster risk financing strategy suggested in the previous chapter aims at allowing the GoI to access immediate fund-ing in case of a disaster. However, if this funding takes time to be allocated and executed, it does not serve the ultimate objective to allow for fast imple-mentation of post-disaster recovery and reconstruc-tion operations.
A National Disaster Reserve Fund (NDRF) could be established as a mechanism for the rapid fi-nancing of post-disaster operations. A basket of mechanisms and instruments could be developed as part of a NDRF, akin to a financial trust, which would
disburse funds quickly after a disaster to allow for rapid implementation of recovery operations. This Facility could build on the successful example of Mexico, which established the national disaster fund FONDEN. See Box 5.5.
The NDRF could rely on existing disaster fund-ing mechanisms. The NDRF as a disaster risk fi-nancing vehicle would establish sufficient transpar-ency and internal controls to ensure coordinated allocation and efficient use of post-disaster funds. Monies allocated under sectoral and disaster con-tingency budget would be immediately available for disbursement to BNPB, or implementing line agen-cies during the recovery phase of a disaster, thereby removing the bottleneck encountered while await-ing parliamentary approval. The existing On-Call budget should be part of NDRF, whereas the cur-rent restriction (in the GR 22/2008) on disaster con-tingency funds being only for pre-disaster activities should be removed such that it fully functions like a financial trust.
The NDRF could be established as a public ser-vice agency. Several options can be considered for the financial management of the NDRF under the current legal and regulatory framework. Under Law 1/2004 of State’s General Treasury, a Badan Layanan Umum (BLU) is a non-profit institution that can be established within a line ministry or government agency with the purpose of providing public goods and/or services. Although the BLU reports to a line ministry or government agency, it is managed inde-pendently, similar to a firm. The GOI has established
public entities like hospitals, universities, the public R&D agency, and the road management agency as BLUs. An important feature of the BLU is that it is given flexibility to manage its revenue and expendi-tures as a corporation, without going through the regular government budget appropriation process that has to be approved by the Parliament every time requiring modification. Hence, a BLU could be the financial vehicle that ensures fast disbursement for the financing of post-disaster emergency and recovery operations (such as for housing and liveli-hood subsidy). However, a requirement to establish a BLU is that the entity must have a regular revenue stream. As an alternative to a BLU structure, other options - such as the creation of a public insurance company - could also be considered.
The NDRF would have a bridging facility and would be responsible for the financing of emer-gency assistance and post-disaster recovery ac-tivities. Prioritization and implementation planning of activities to be financed would be completed by BNPB, local disaster management agencies, and line ministries. The NDRF would be mandated to pro-vide funds for: i) post-disaster emergency expenses managed by BNPB; ii) a compensation scheme for households affected by natural disasters; and, iii) disbursement for post-disaster and recovery to the national and local agencies in case of critical damag-es caused to infrastructure (e.g., roads, bridges) and
public buildings (e.g., schools, hospitals). A proper fiduciary oversight would be developed. It could draw lessons from the newly established Indonesia Multi Donor Funding Facility for Disaster Recovery (IMDFF-DR).
For long-term reconstruction and recovery needs sectoral and sub-national budget alloca-tions should remain the main source of funding as part of NDRF. As disaster risk management is a shared responsibility between national, sub-national and sectoral authorities, major long-term and multi-year reconstruction and recovery needs should re-main within the respective authorities having over-sight over the assets and activities impacted by disasters. As part of NDRF, the Government may de-velop an inter-sectoral reconstruction budget coor-dination process for rehabilitation of national assets, whilst using regional transfer mechanisms such as DAK, deconcentration and co-administration (Tugas Pembantuan) to assist sub-national governments.
The NDRF would report to both BNPB and the Ministry of Finance. The Ministry of Finance would provide the NDRF with an annual budget allocation approved by the Parliament, to be deposited in a financial entity akin to a Trust and managed by a public entity (BLU). The NDRF would operate ac-cording to a detailed Operations Manual (including detailed disbursement and execution procedures)
Chapter 5: Options for National Disaster Risk Financing Strategy in Indonesia < 37 >
Box 5.5. The Mexican Fund for Natural Disasters (FONDEN)
The Federal Government created FONDEN in 1996 as a financial mechanism to provide the Federal agencies and the Mexican states with post-disaster financial resources. The mandate of the FONDEN is to: (i) finance post-disaster emergency assistance (through a revolving fund); and, (ii) provide the 32 Mexican States and the line ministries (e.g., Ministry of Infrastructure, Ministry of Health, Ministry of Education, Ministry of Human Development) with financial resources in case of natural disasters that would exceed their budget capacity. The FONDEN finances the post-disaster recovery and reconstruction of public assets (100 percent of Federal assets and 50 percent of state and municipal assets) and low-income houses. A Trust Fund was especially established to finance the FONDEN program.
The Government of Mexico created FONDEN as a response to the delays faced in the post-disaster financing of emergency and recovery activities. See Annex 8 for further details.
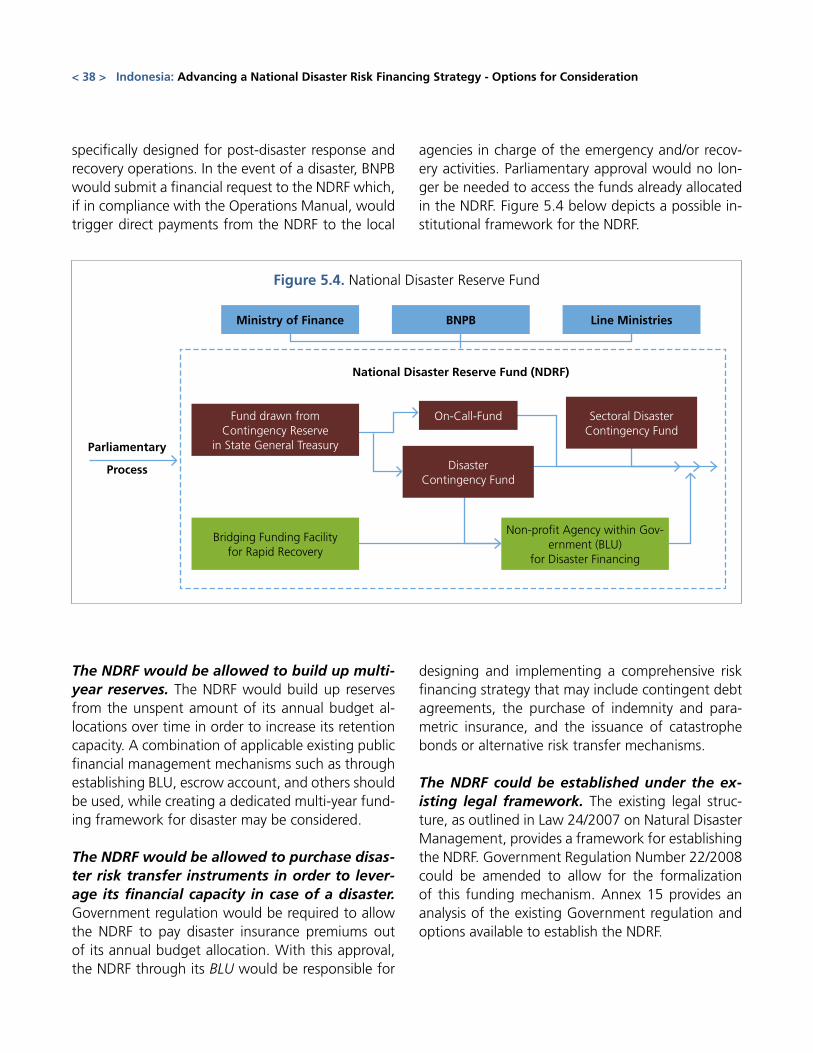
specifically designed for post-disaster response and recovery operations. In the event of a disaster, BNPB would submit a financial request to the NDRF which, if in compliance with the Operations Manual, would trigger direct payments from the NDRF to the local
agencies in charge of the emergency and/or recov-ery activities. Parliamentary approval would no lon-ger be needed to access the funds already allocated in the NDRF. Figure 5.4 below depicts a possible in-stitutional framework for the NDRF.
< 38 > Indonesia: Advancing a National Disaster Risk Financing Strategy - Options for Consideration
Ministry of Finance
Parliamentary
Process
BNPB
National Disaster Reserve Fund (NDRF)
Line Ministries
Non-profit Agency within Gov-ernment (BLU)
for Disaster Financing
DisasterContingency Fund
Sectoral DisasterContingency Fund
Fund drawn from Contingency Reserve
in State General Treasury
Bridging Funding Facilityfor Rapid Recovery
On-Call-Fund
Figure 5.4. National Disaster Reserve Fund
The NDRF would be allowed to build up multi-year reserves. The NDRF would build up reserves from the unspent amount of its annual budget al-locations over time in order to increase its retention capacity. A combination of applicable existing public financial management mechanisms such as through establishing BLU, escrow account, and others should be used, while creating a dedicated multi-year fund-ing framework for disaster may be considered.
The NDRF would be allowed to purchase disas-ter risk transfer instruments in order to lever-age its financial capacity in case of a disaster. Government regulation would be required to allow the NDRF to pay disaster insurance premiums out of its annual budget allocation. With this approval, the NDRF through its BLU would be responsible for
designing and implementing a comprehensive risk financing strategy that may include contingent debt agreements, the purchase of indemnity and para-metric insurance, and the issuance of catastrophe bonds or alternative risk transfer mechanisms.
The NDRF could be established under the ex-isting legal framework. The existing legal struc-ture, as outlined in Law 24/2007 on Natural Disaster Management, provides a framework for establishing the NDRF. Government Regulation Number 22/2008 could be amended to allow for the formalization of this funding mechanism. Annex 15 provides an analysis of the existing Government regulation and options available to establish the NDRF.
Establish a disaster risk insurance program for public assets
Public assets, such as schools and hospitals, and public infrastructure, such as roads and bridges, can be severely affected by natural di-sasters and are currently not insured in Indo-nesia. Given easy access to capital markets, most developed countries self-insure their public assets. In other words, because these countries have access to bond market funding, they bear the full cost of recovery/reconstruction when a disaster strikes. In Indonesia, most public assets and infrastructure are not insured, although some provinces/municipalities have recently insured selected public assets. See An-nex 3 for recent developments.
In some middle-income countries, where fis-cal resources and access to capital are limited, some governments require by law that pub-lic assets have a property insurance coverage against natural disasters. This is the case in Latin American countries such as Costa Rica, Mexico, and Colombia. However, in practice, most public assets remain uninsured or under-insured, partly because the public managers are reluctant to spend part of their limited budget to pay an insurance premium and they often lack basic information to select a cost-effective insurance coverage.
A Disaster Risk Insurance Program for Pub-lic Assets could be established in Indonesia to promote disaster insurance of public assets in collaboration with the private insurance indus-try. This program would aim at offering technical assistance to public entities in the design of their catastrophe insurance coverage of public assets. Standardized terms and conditions for the property insurance policies would be developed in collabora-tion with the private insurance industry that would assist public managers in identifying their risk expo-sure and their insurance needs. The program could also structure a national insurance portfolio of pub-lic assets to be then placed on the private (re)insur-ance market. A national approach to insuring pub-
lic assets would allow for economies of scale and diversification benefits, and thus, lower reinsurance premiums.
Promote property catastrophe insurance of private dwellings
The current penetration of catastrophe prop-erty insurance is low in Indonesia. Despite the efforts of the specialized reinsurer PT Maipark, less than 5 percent of the properties are currently in-sured against natural disasters - and most of them are commercial and industrial properties. This low penetration is a direct consequence of the low de-velopment of the non-life insurance market in Indo-nesia.
The GoI may want to promote property catas-trophe insurance for private residential dwell-ings. A developed domestic property catastrophe insurance market would reduce the GoI’s implicit contingent exposure to major disasters. To promote market development, the GoI could finance and make available exposure and loss models to pri-vate insurers. It could also support information and awareness campaigns.
Turkey provides an interesting example of a homeowner’s catastrophe insurance program. The Turkish Catastrophe Insurance Pool (TCIP) was established in 2000 to overcome problems of market failure in Turkey, namely a lack of local market earth-quake capacity. The World Bank provided technical and financial assistance in the design stage of the TCIP to model and rate the earthquake exposure, as well as a contingent loan in the start-up imple-mentation phase to cover claims as part of the risk financing program. A key feature of the coverage is that it is a simple property, earthquake only, policy that is provided at affordable rates. Given the very low voluntary demand by Turkish home-owners for insurance, earthquake insurance was made compul-sory for registered houses in urban centers. See Box 5.6 for a short description.
Chapter 5: Options for National Disaster Risk Financing Strategy in Indonesia < 39 >
Should the GoI want to establish a private resi-dential catastrophe insurance program, a num-ber of key decisions would need to be made, including whether:
■■ to form a public-sector catastrophe insurance fund, as in the case of Turkey, or to promote some form of “coinsurance pool” through the involvement of the existing non-life private commercial insurers. The specialized reinsurer PT Maipark could play a central role;
■■ to make homeowners property insurance com-pulsory or to market the coverage on a volun-tary basis. The Turkish example showed that the demand by homeowners for property insurance was low due to the lack of an insurance culture by Turkish homeowners and it was necessary to make coverage compulsory;
■■ to bundle property catastrophe insurance with mortgages for homeowners or to keep as stand-alone coverage. Mortgage-linked ca-tastrophe insurance coverage could be made compulsory. An alternative to make coverage compulsory could be to bundle coverage with property taxes;
■■ to target the product at urban property own-ers alone or to target all households. In Turkey, earthquake insurance is only compulsory in ur-
ban areas. In Indonesia much of the rural hous-ing stock is unlikely to meet minimum building standards required by local insurers and their reinsurers; and,
■■ to involve government in the program through a public-private partnership. This could include the provision of start-up funding (research and development costs). The GoI could also act as a reinsurer of last resort for extreme insured losses, when the financial capacity of the private sector is insufficient.
Alternative disaster microinsurance products designed to protect the livelihoods of affected households could be developed, as part of a comprehensive coverage against natural disas-ters. In light of the flood microinsurance program piloted by Wahana Tata, similar microinsurance products could be designed to protect households impacted by recurrent natural disasters. Such micro-insurance products could be linked to some savings and/or credit mechanisms in order to offer a com-prehensive coverage against natural disasters. For example, microinsurance could build on the com-munity empowerment programs such as the PNPM (Program Nasional Pemberdayaan Masyarakat), which already have a large network.
Improved quality of insurance supervision would be required to effectively promote catastrophe risk cov-
< 40 > Indonesia: Advancing a National Disaster Risk Financing Strategy - Options for Consideration
Box 5.6. Turkish Catastrophe Insurance Pool
The Turkish Catastrophe Insurance Pool (TICP) is a public sector insurance company that is managed on sound technical and commercial insurance principles. The TCIP purchases commercial reinsurance and the Govern-ment of Turkey acts as a catastrophe reinsurer of last resort for claims arising out of an earthquake with a return period of greater than 300 years.
The TCIP policy is a stand-alone property earthquake policy with a maximum sum insured per policy of US$65,000, an average premium rate of US$46, and a 2 percent of sum insured deductible. Premium rates are based on construction type (2 types) and property location (differentiating between 5 earthquake risk zones) and vary from less that 0.05 percent for a concrete reinforced house in a low risk zone to 0.60 percent for a house located in the highest risk zone. Since inception, TCIP has averaged a penetration rate of about 20 per-cent, or 3 million domestic dwellings. See Annex 11 for further details.
erage among private insurers. The quality of insur-ance supervision in Indonesia should be further im-proved through the use of a risk-based assessment of insurers’ retention capacity and reinsurance strate-gies based on catastrophe risk modeling and actuarial tools. This would include the development of an ac-tuarial model to further refine the commercial earth-quake premium rates and to assess the impact of natural disasters on the insurers’ portfolio. A scoring tool to assess the quality and adequacy of the insur-ers’ reinsurance strategies could also be developed.
Establish a Joint Disaster Reserve Fund for Indonesia’s Local GovernmentsExperience from the last ten years shows that Indonesian local governments (e.g., municipali-ties or provinces) often lack the financial re-sources required to respond effectively in the aftermath of natural disasters. Due to their limit-ed size and economic base, many local governments (municipalities or provincial governments) do not have the capacity to set aside the required reserves needed to finance the disaster losses not covered by the Central Government.
The proposed Fund would help Indonesian lo-cal governments improve their response ca-pacity at very low cost. Local governments are responsible for a fair share of the cost of natural disasters and they often struggle to mobilize the required financial resources to support emergency and recovery activities. The proposed Fund would act as a reserve facility holding financial reserves to become available in case of an adverse natural event. The joint nature of the Fund means that lo-cal governments would have immediate access to significant resources without having to build these reserves over time. At the same time, local govern-ments would have access to significant resources without having to bear the financial (and political) cost of holding these resources. Finally, by pooling their risks, local governments would be able to ac-cess the reinsurance market where it is more effi-
cient, thus significantly reducing the cost of securing additional capacity.
The proposed Fund would act as a joint reserve fund for the local governments. Participating local governments would contribute to the Fund based on their own risk profile and de-sired coverage level. These contributions would be used to maintain a reserve level sufficient to ab-sorb annual payouts to local governments affected by adverse natural events. To manage the potential variability in financial outflows, the Fund would se-cure additional financial capacity on the internation-al reinsurance and capital markets. See Figure 5.5 for an illustration of the proposed Fund.
The proposed Fund would help Indonesia’s local governments access non-earmarked resources quickly in the aftermath of a natural disaster. To ensure transparency and avoid delays, payouts would be processed on a parametric basis. In con-trast to traditional indemnity insurance that makes claims payments based on formal confirmation of a loss, parametric instruments disburses funds based on the occurrence of a pre-defined easily verifiable event - without having to wait for an on-site loss assessment. With immediate access to liquidity pro-vincial governments would not be dependent on Central Government transfers to finance emergency and recovery efforts after significant disasters.
The Fund would provide the participating lo-cal governments with access to catastrophe risk insurance at the lowest possible cost. Pre-liminary analysis shows that a joint reserve Fund would allow for the participating local governments to pool their natural disaster risks into one, better-diversified portfolio, thus significantly reducing the cost of reserves. The cost of financial protection is highly dependent on the variability of the risk that is being insured. Since disaster risk among the local governments is not perfectly correlated, the cost of coverage for a pooled portfolio would be less than the sum of coverage on an individual province-wise basis (See Box 5.7).
Chapter 5: Options for National Disaster Risk Financing Strategy in Indonesia < 41 >
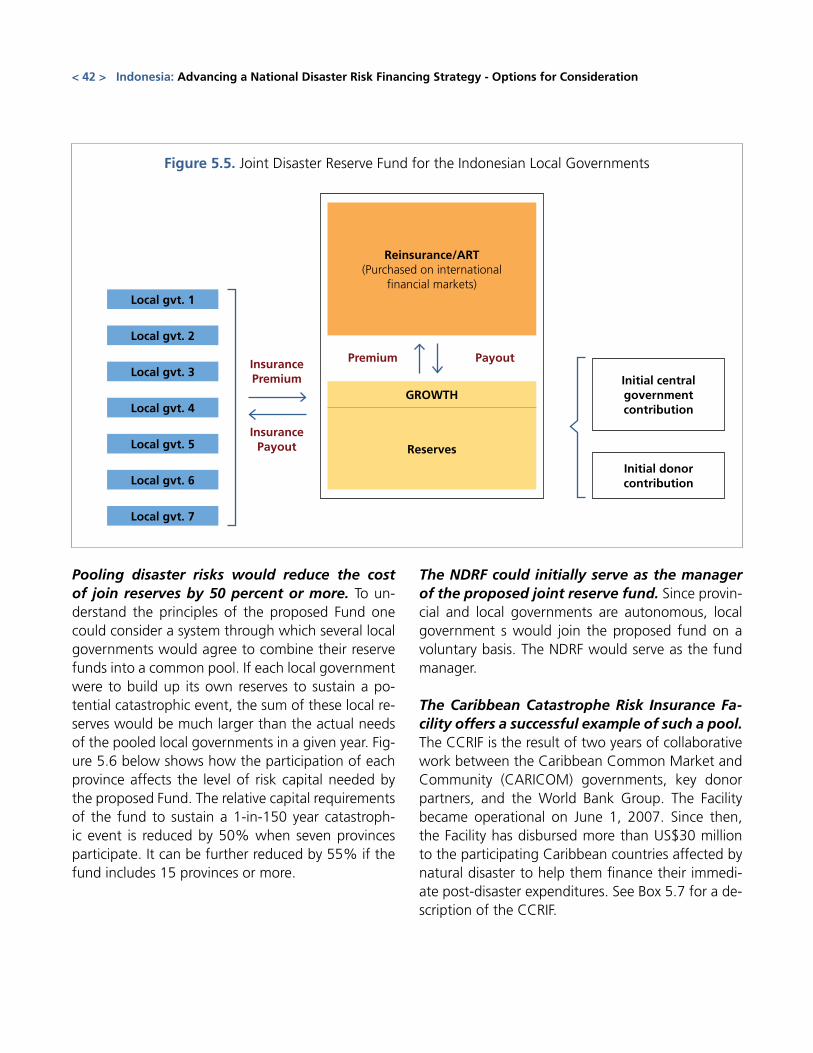
Pooling disaster risks would reduce the cost of join reserves by 50 percent or more. To un-derstand the principles of the proposed Fund one could consider a system through which several local governments would agree to combine their reserve funds into a common pool. If each local government were to build up its own reserves to sustain a po-tential catastrophic event, the sum of these local re-serves would be much larger than the actual needs of the pooled local governments in a given year. Fig-ure 5.6 below shows how the participation of each province affects the level of risk capital needed by the proposed Fund. The relative capital requirements of the fund to sustain a 1-in-150 year catastroph-ic event is reduced by 50% when seven provinces participate. It can be further reduced by 55% if the fund includes 15 provinces or more.
The NDRF could initially serve as the manager of the proposed joint reserve fund. Since provin-cial and local governments are autonomous, local government s would join the proposed fund on a voluntary basis. The NDRF would serve as the fund manager.
The Caribbean Catastrophe Risk Insurance Fa-cility offers a successful example of such a pool. The CCRIF is the result of two years of collaborative work between the Caribbean Common Market and Community (CARICOM) governments, key donor partners, and the World Bank Group. The Facility became operational on June 1, 2007. Since then, the Facility has disbursed more than US$30 million to the participating Caribbean countries affected by natural disaster to help them finance their immedi-ate post-disaster expenditures. See Box 5.7 for a de-scription of the CCRIF.
< 42 > Indonesia: Advancing a National Disaster Risk Financing Strategy - Options for Consideration
Local gvt. 1
InsurancePremium
Premium Payout
InsurancePayout
Local gvt. 2
Local gvt. 3
Local gvt. 4
Local gvt. 5
Local gvt. 6
Local gvt. 7
Initial centralgovernment contribution
Initial donor contribution
Reinsurance/ART(Purchased on international
financial markets)
GROWTH
Reserves
Figure 5.5. Joint Disaster Reserve Fund for the Indonesian Local Governments
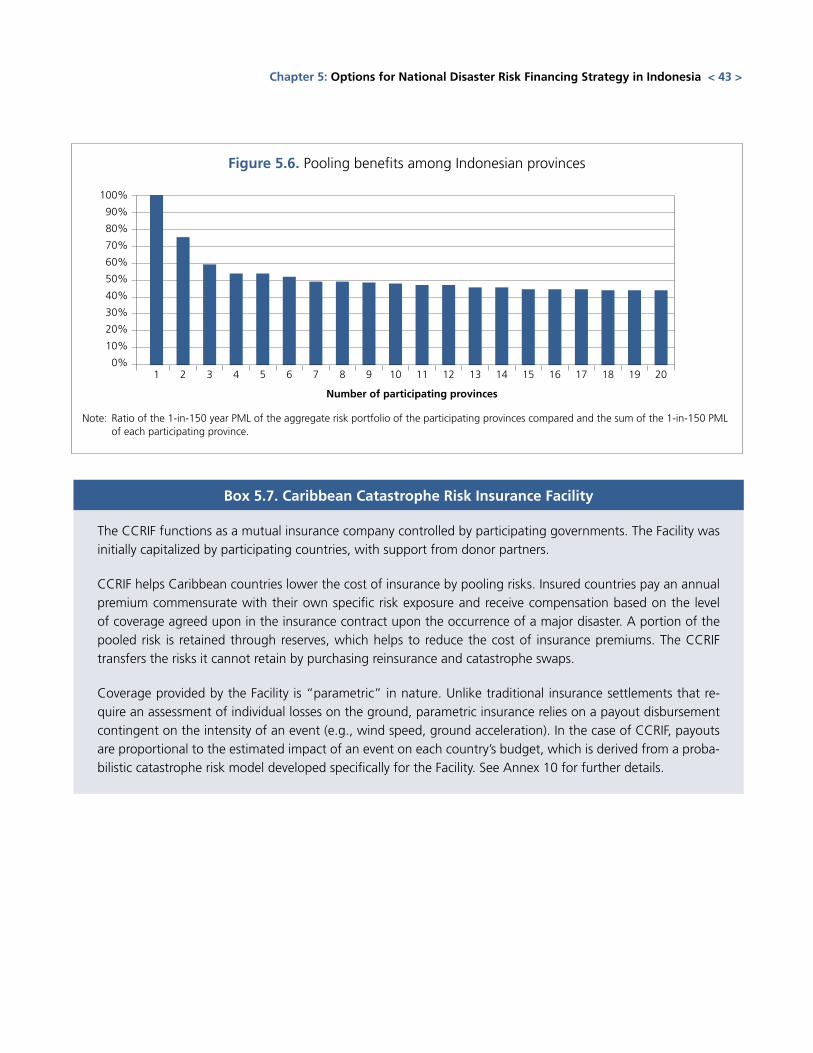
Chapter 5: Options for National Disaster Risk Financing Strategy in Indonesia < 43 >
Box 5.7. Caribbean Catastrophe Risk Insurance Facility
The CCRIF functions as a mutual insurance company controlled by participating governments. The Facility was initially capitalized by participating countries, with support from donor partners.
CCRIF helps Caribbean countries lower the cost of insurance by pooling risks. Insured countries pay an annual premium commensurate with their own specific risk exposure and receive compensation based on the level of coverage agreed upon in the insurance contract upon the occurrence of a major disaster. A portion of the pooled risk is retained through reserves, which helps to reduce the cost of insurance premiums. The CCRIF transfers the risks it cannot retain by purchasing reinsurance and catastrophe swaps.
Coverage provided by the Facility is “parametric” in nature. Unlike traditional insurance settlements that re-quire an assessment of individual losses on the ground, parametric insurance relies on a payout disbursement contingent on the intensity of an event (e.g., wind speed, ground acceleration). In the case of CCRIF, payouts are proportional to the estimated impact of an event on each country’s budget, which is derived from a proba-bilistic catastrophe risk model developed specifically for the Facility. See Annex 10 for further details.
Figure 5.6. Pooling benefits among Indonesian provinces
Note: Ratio of the 1-in-150 year PML of the aggregate risk portfolio of the participating provinces compared and the sum of the 1-in-150 PML of each participating province.
100%
90%
80%
70%
60%
50%
40%
30%
20%
10%
0%1 2 3 4 5 6 7 8 9 10 11 12 13 14 15 16 17 18 19 20
Number of participating provinces


AN
NEX
ES
< 45 >
Indonesia ranks 12th among the most vulnerable countries to high mortality risk from multiple haz-ards. The country is situated in one of the most active disaster hot spots, where several types of disasters such as earthquakes, tsunamis, volcanic eruptions, floods, landslides, droughts and forest fires fre-quently occur. According to a global risk analysis by the World Bank15, about 40 percent of the popula-tion lives at high mortality risk. For a country that has more than 230 million people, this implies that more than 90 million people live at risk.
The high frequency of disasters has an important impact on public expenditures. According to the Government’s disaster data16, between 2001 and 2007 alone, there have been more than 4,000 oc-currences of disasters including floods (37 percent), droughts (24 percent), landslides (11 percent), and windstorms (9 percent). As the disasters damage public infrastructure and private homes, mostly un-insured, they create an enormous burden on public expenditure to restore affected facilities.
Hazard Profile
Geologic
Situated in the earthquake belt and Pacific ring-of-fire, Indonesia is highly vulnerable to earthquakes and volcanic eruptions. The areas most vulnerable to earthquakes are Sumatera, Java, Bali, Nusa Teng-gara, Maluku, Sulawesi and Papua. Sumatera alone has suffered from over 15 large earthquakes in the past 100 years. Indonesia also has 129 active volca-noes, 70 of which are classified as dangerous. Be-tween 2001 and 2007, 26 volcanic eruptions were
15 See World Bank, Natural Disaster Hotspots, A Global Risk Analysis (Washington, DC: Disaster Risk Management Series, 2005), Table 1.2
16 DiBi database (Data and Information on Disaster in Indone-sia), National Disaster Management Agency (BNPB). http://dibi.bnpb.go.id/.
recorded - predominantly in Java. Most recently, in 2010, Mount Merapi erupted, killing 324 and dis-locating over 320,000 people. In 1815 the Tambora volcano on the northern coast of Sumbawa, West Nusa Tenggara Province erupted claiming more 92,000 lives and in 1883 the Krakatoa eruption claimed more than 36,000 lives and created tsuna-mis as far away as South Africa. The islands of Java and Sumatra are also prone to landslides because of their topographic and unstable soil conditions.
Hydrometeorological
Within the past century, floods have been the most frequent disaster for Indonesia. A high rainfall regime in the west and a dry zone in some eastern provinces are subject to recurring floods and droughts. Floods often impact major population centers such as Ja-karta (with a population of more than 13 million), Medan (more than 2 million), and Bandung (more than 4 million). The government estimated that the 2007 flood in Jakarta created total damage and losses of more than US$900 million17. According to the Ministry of Public Works, the annual flood in the Bengawan Solo Watershed that occurred in 2007 cost the government more than US$200 million or equal to the total emergency allocation for all disas-ters for the entire year of 200818.
Climate variability and change
Deforestation and prolonged drought intensify the occurrence of forest fires. The wildland fire and smoke-haze episodes in Indonesia during the 1980s and 1990s were the first documented influence of drought impact triggered by the El Niño-Southern
17 Laporan Perkiraan Kerusakan dan Kerugian Pasca Bencana Banjir Awal Februari 2007 di WIlayah Jabodetabek, National Development Planning Agency (BAPPENAS) 2007.
18 Source: Center for Strategic Assessment of the Ministry of Public Works, April 2009.
Annex 1. Exposure to Natural Hazards in Indonesia
< 46 > Indonesia: Advancing a National Disaster Risk Financing Strategy - Options for Consideration
Oscillation (ENSO). In East Kalimantan, nearly 3.5 million hectares of forests were affected by drought and fire. Nearly 0.8 million hectares of primary rain forest were burned, though impacts were more widespread in logged-over and secondary forests (mainly in the vicinity of settlement areas). The cli-mate anomaly brought by El Nino also induced a de-crease in rainfall impacting food production by an average of 3.06 percent.
Factors of Vulnerability
Population increase and urbanization
As in many other developing countries, economic growth in Indonesia has shown a strong correlation with urbanization, both in the sense of people mov-ing from rural areas to the cities and in terms of the urbanizing of rural settlements. By 2008, at least 50 percent of the population was living in cities, and urban areas were increasing in population at 4.4 percent per year, well beyond national population growth. Currently, more than 110 million people live in or around 60 cities that are predominantly locat-ed in the coastal areas, exposing them to common hazards such as earthquakes, flooding and commu-nicable diseases. The high population density and unplanned development in many of the larger cities has also increased the vulnerability of the population in the case of large-scale disasters.
Increased exposure due to poorly enforced zoning and poorly maintained infrastruc-ture
The high rate of urbanization in Indonesia, and lim-ited capacity of urban centers to provide adequate shelters and infrastructure, has led to the emer-gence of many unplanned settlements. Poor quality and enforcement of land use zoning in turn has led to many hazard prone locations being occupied by settlements, thereby increasing the exposure of the population to disasters. The Ministry of Public Works estimated that a quarter of urban population (or around 25 million people) lives in slums and infor-
mal settlements. The combination of the poor qual-ity settlements and inadequate infrastructure has increased Indonesia’s vulnerability, especially when larger scale disaster events occur.
Overall Risk Profile
More frequent events, increased exposure, and lower coping capacity leading to great-er impacts
The overall risk profile implies increased exposure and lower coping capacity in coming years. A com-bination of Indonesia’s unique geological setting and the complexity of its population settlements have generally led to increased disaster occurrence with a tendency for significant human impacts (e.g., loss of life and economic disruption). High and in-creasing population density, coupled with growing unplanned development in high risk zones, contin-ues to increase Indonesia’s vulnerability to recurrent and large scale disasters.
Annex 1. Exposure to Natural Hazards in Indonesia < 47 >
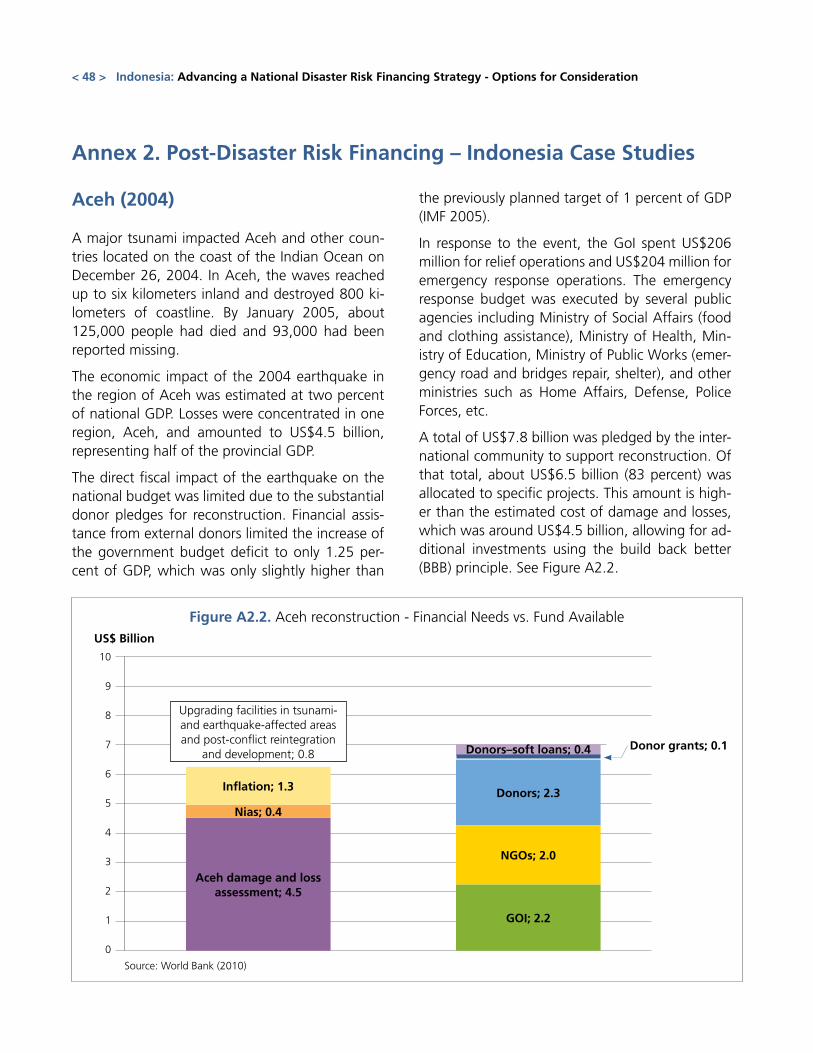
Aceh (2004)
A major tsunami impacted Aceh and other coun-tries located on the coast of the Indian Ocean on December 26, 2004. In Aceh, the waves reached up to six kilometers inland and destroyed 800 ki-lometers of coastline. By January 2005, about 125,000 people had died and 93,000 had been reported missing.
The economic impact of the 2004 earthquake in the region of Aceh was estimated at two percent of national GDP. Losses were concentrated in one region, Aceh, and amounted to US$4.5 billion, representing half of the provincial GDP.
The direct fiscal impact of the earthquake on the national budget was limited due to the substantial donor pledges for reconstruction. Financial assis-tance from external donors limited the increase of the government budget deficit to only 1.25 per-cent of GDP, which was only slightly higher than
the previously planned target of 1 percent of GDP (IMF 2005).
In response to the event, the GoI spent US$206 million for relief operations and US$204 million for emergency response operations. The emergency response budget was executed by several public agencies including Ministry of Social Affairs (food and clothing assistance), Ministry of Health, Min-istry of Education, Ministry of Public Works (emer-gency road and bridges repair, shelter), and other ministries such as Home Affairs, Defense, Police Forces, etc.
A total of US$7.8 billion was pledged by the inter-national community to support reconstruction. Of that total, about US$6.5 billion (83 percent) was allocated to specific projects. This amount is high-er than the estimated cost of damage and losses, which was around US$4.5 billion, allowing for ad-ditional investments using the build back better (BBB) principle. See Figure A2.2.
Annex 2. Post-Disaster Risk Financing – Indonesia Case Studies
10
9
8
7
6
5
4
3
2
1
0
Aceh damage and loss assessment; 4.5
GOI; 2.2
Donors; 2.3
Donor grants; 0.1
NGOs; 2.0
Nias; 0.4
Inflation; 1.3
Upgrading facilities in tsunami- and earthquake-affected areas and post-conflict reintegration
and development; 0.8 Donors–soft loans; 0.4
US$ Billion
Figure A2.2. Aceh reconstruction - Financial Needs vs. Fund Available
Source: World Bank (2010)
< 48 > Indonesia: Advancing a National Disaster Risk Financing Strategy - Options for Consideration
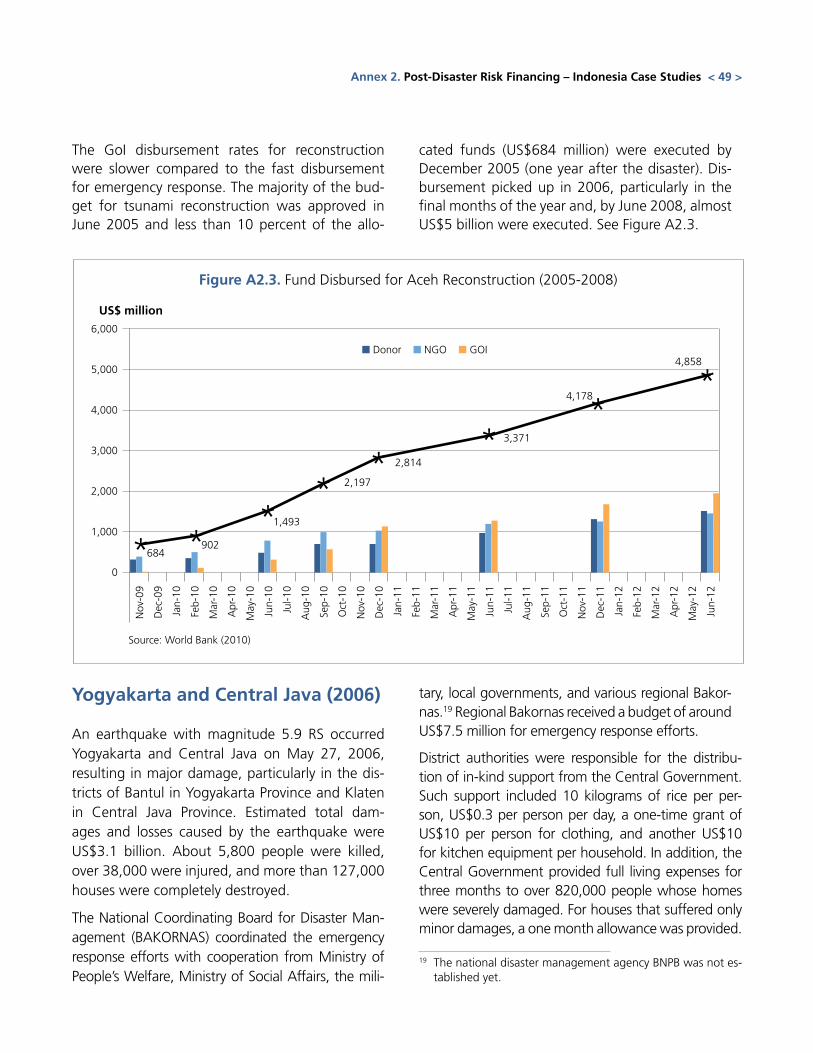
The GoI disbursement rates for reconstruction were slower compared to the fast disbursement for emergency response. The majority of the bud-get for tsunami reconstruction was approved in June 2005 and less than 10 percent of the allo-
cated funds (US$684 million) were executed by December 2005 (one year after the disaster). Dis-bursement picked up in 2006, particularly in the final months of the year and, by June 2008, almost US$5 billion were executed. See Figure A2.3.
6,000
5,000
4,000
3,000
2,000
1,000
0
US$ million
Figure A2.3. Fund Disbursed for Aceh Reconstruction (2005-2008)
Source: World Bank (2010)
Yogyakarta and Central Java (2006)
An earthquake with magnitude 5.9 RS occurred Yogyakarta and Central Java on May 27, 2006, resulting in major damage, particularly in the dis-tricts of Bantul in Yogyakarta Province and Klaten in Central Java Province. Estimated total dam-ages and losses caused by the earthquake were US$3.1 billion. About 5,800 people were killed, over 38,000 were injured, and more than 127,000 houses were completely destroyed.
The National Coordinating Board for Disaster Man-agement (BAKORNAS) coordinated the emergency response efforts with cooperation from Ministry of People’s Welfare, Ministry of Social Affairs, the mili-
tary, local governments, and various regional Bakor-nas.19 Regional Bakornas received a budget of around US$7.5 million for emergency response efforts.
District authorities were responsible for the distribu-tion of in-kind support from the Central Government. Such support included 10 kilograms of rice per per-son, US$0.3 per person per day, a one-time grant of US$10 per person for clothing, and another US$10 for kitchen equipment per household. In addition, the Central Government provided full living expenses for three months to over 820,000 people whose homes were severely damaged. For houses that suffered only minor damages, a one month allowance was provided.
19 The national disaster management agency BNPB was not es-tablished yet.
Nov
-09
Jul-1
0
Mar
-11
Nov
-11
Mar
-10
Nov
-10
Jul-1
1
Mar
-12
Jan-
10
Sep-
10
May
-11
Jan-
12
May
-10
Jan-
11
Sep-
11
May
-12
Dec
-09
Aug
-10
Apr
-11
Dec
-11
Apr
-10
Dec
-10
Aug
-11
Apr
-12
Feb-
10
Oct
-10
Jun-
11
Feb-
12
Jun-
10
Feb-
11
Oct
-11
Jun-
12
■ Donor ■ NGO ■ GOI
684902
1,493
2,197
2,814
3,371
4,178
4,858
Annex 2. Post-Disaster Risk Financing – Indonesia Case Studies < 49 >
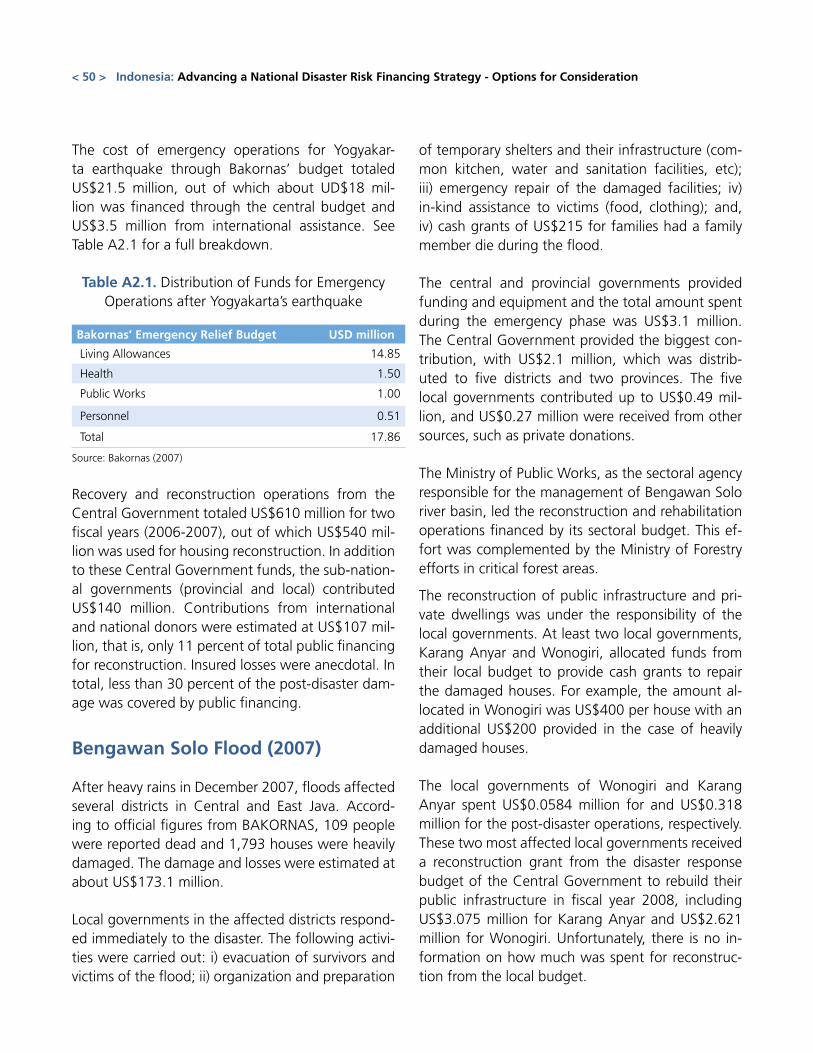
The cost of emergency operations for Yogyakar-ta earthquake through Bakornas’ budget totaled US$21.5 million, out of which about UD$18 mil-lion was financed through the central budget and US$3.5 million from international assistance. See Table A2.1 for a full breakdown.
Table A2.1. Distribution of Funds for Emergency Operations after Yogyakarta’s earthquake
Bakornas’ Emergency Relief Budget USD million
Living Allowances 14.85
Health 1.50
Public Works 1.00
Personnel 0.51
Total 17.86
Source: Bakornas (2007)
Recovery and reconstruction operations from the Central Government totaled US$610 million for two fiscal years (2006-2007), out of which US$540 mil-lion was used for housing reconstruction. In addition to these Central Government funds, the sub-nation-al governments (provincial and local) contributed US$140 million. Contributions from international and national donors were estimated at US$107 mil-lion, that is, only 11 percent of total public financing for reconstruction. Insured losses were anecdotal. In total, less than 30 percent of the post-disaster dam-age was covered by public financing.
Bengawan Solo Flood (2007)
After heavy rains in December 2007, floods affected several districts in Central and East Java. Accord-ing to official figures from BAKORNAS, 109 people were reported dead and 1,793 houses were heavily damaged. The damage and losses were estimated at about US$173.1 million.
Local governments in the affected districts respond-ed immediately to the disaster. The following activi-ties were carried out: i) evacuation of survivors and victims of the flood; ii) organization and preparation
of temporary shelters and their infrastructure (com-mon kitchen, water and sanitation facilities, etc); iii) emergency repair of the damaged facilities; iv) in-kind assistance to victims (food, clothing); and, iv) cash grants of US$215 for families had a family member die during the flood.
The central and provincial governments provided funding and equipment and the total amount spent during the emergency phase was US$3.1 million. The Central Government provided the biggest con-tribution, with US$2.1 million, which was distrib-uted to five districts and two provinces. The five local governments contributed up to US$0.49 mil-lion, and US$0.27 million were received from other sources, such as private donations.
The Ministry of Public Works, as the sectoral agency responsible for the management of Bengawan Solo river basin, led the reconstruction and rehabilitation operations financed by its sectoral budget. This ef-fort was complemented by the Ministry of Forestry efforts in critical forest areas.
The reconstruction of public infrastructure and pri-vate dwellings was under the responsibility of the local governments. At least two local governments, Karang Anyar and Wonogiri, allocated funds from their local budget to provide cash grants to repair the damaged houses. For example, the amount al-located in Wonogiri was US$400 per house with an additional US$200 provided in the case of heavily damaged houses.
The local governments of Wonogiri and Karang Anyar spent US$0.0584 million for and US$0.318 million for the post-disaster operations, respectively. These two most affected local governments received a reconstruction grant from the disaster response budget of the Central Government to rebuild their public infrastructure in fiscal year 2008, including US$3.075 million for Karang Anyar and US$2.621 million for Wonogiri. Unfortunately, there is no in-formation on how much was spent for reconstruc-tion from the local budget.
< 50 > Indonesia: Advancing a National Disaster Risk Financing Strategy - Options for Consideration
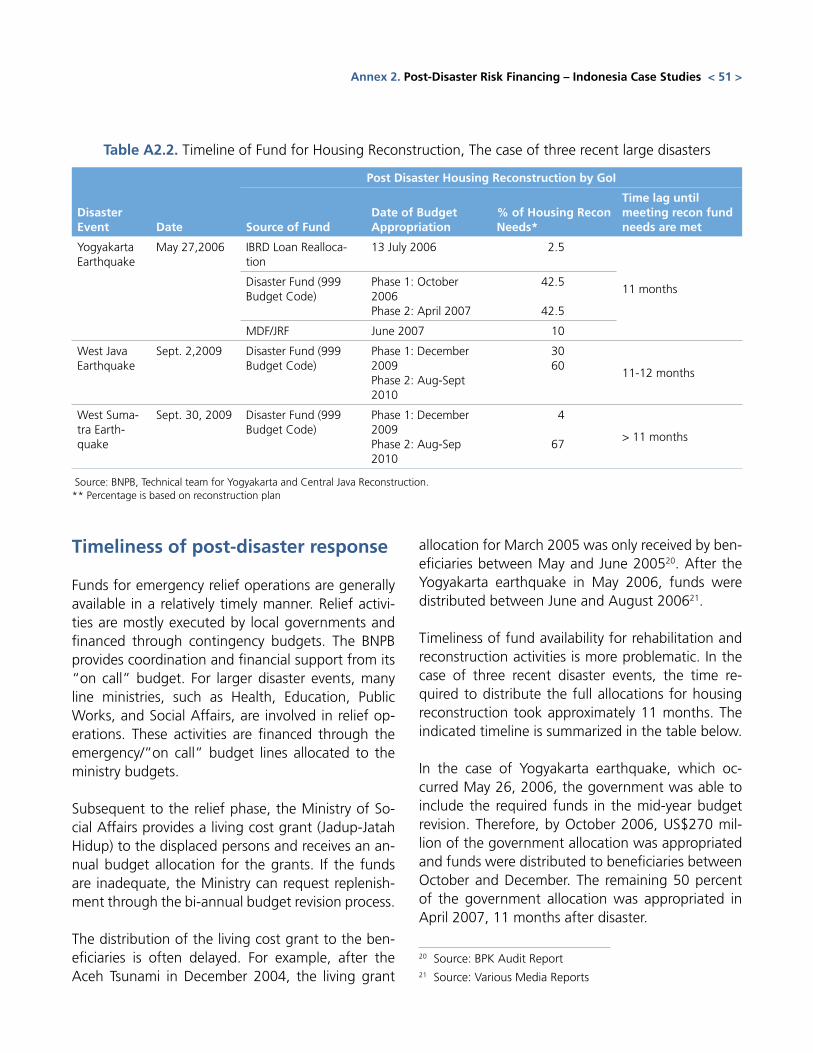
Timeliness of post-disaster response
Funds for emergency relief operations are generally available in a relatively timely manner. Relief activi-ties are mostly executed by local governments and financed through contingency budgets. The BNPB provides coordination and financial support from its “on call” budget. For larger disaster events, many line ministries, such as Health, Education, Public Works, and Social Affairs, are involved in relief op-erations. These activities are financed through the emergency/”on call” budget lines allocated to the ministry budgets.
Subsequent to the relief phase, the Ministry of So-cial Affairs provides a living cost grant (Jadup-Jatah Hidup) to the displaced persons and receives an an-nual budget allocation for the grants. If the funds are inadequate, the Ministry can request replenish-ment through the bi-annual budget revision process.
The distribution of the living cost grant to the ben-eficiaries is often delayed. For example, after the Aceh Tsunami in December 2004, the living grant
allocation for March 2005 was only received by ben-eficiaries between May and June 200520. After the Yogyakarta earthquake in May 2006, funds were distributed between June and August 200621.
Timeliness of fund availability for rehabilitation and reconstruction activities is more problematic. In the case of three recent disaster events, the time re-quired to distribute the full allocations for housing reconstruction took approximately 11 months. The indicated timeline is summarized in the table below.
In the case of Yogyakarta earthquake, which oc-curred May 26, 2006, the government was able to include the required funds in the mid-year budget revision. Therefore, by October 2006, US$270 mil-lion of the government allocation was appropriated and funds were distributed to beneficiaries between October and December. The remaining 50 percent of the government allocation was appropriated in April 2007, 11 months after disaster.
20 Source: BPK Audit Report21 Source: Various Media Reports
Table A2.2. Timeline of Fund for Housing Reconstruction, The case of three recent large disasters
Disaster Event Date
Post Disaster Housing Reconstruction by GoI
Source of FundDate of Budget Appropriation
% of Housing Recon Needs*
Time lag until meeting recon fund needs are met
Yogyakarta Earthquake
May 27,2006 IBRD Loan Realloca-tion
13 July 2006 2.5
11 monthsDisaster Fund (999 Budget Code)
Phase 1: October 2006Phase 2: April 2007
42.5
42.5
MDF/JRF June 2007 10
West Java Earthquake
Sept. 2,2009 Disaster Fund (999 Budget Code)
Phase 1: December 2009Phase 2: Aug-Sept 2010
3060
11-12 months
West Suma-tra Earth-quake
Sept. 30, 2009 Disaster Fund (999 Budget Code)
Phase 1: December 2009Phase 2: Aug-Sep 2010
4
67> 11 months
Source: BNPB, Technical team for Yogyakarta and Central Java Reconstruction. ** Percentage is based on reconstruction plan
Annex 2. Post-Disaster Risk Financing – Indonesia Case Studies < 51 >
In the case of West Java earthquake of September 2, 2009, 30 percent of the required funds, approxi-mately $50 million, were appropriated in December 2009. The second tranche of funds was appropri-ated in August-September 2010, roughly one full year after disaster.
The West Sumatra earthquake occurred on Sep-tember 30, 2009 and experienced similar delays to
fully disburse as the West Java earthquake. The first tranche was appropriated in December 2009; how-ever only US$31 million was appropriated, which was enough to cover about 4 percent of housing re-construction needs. The second tranche was appro-priated in August 2010, approximately 11 months after disaster.
< 52 > Indonesia: Advancing a National Disaster Risk Financing Strategy - Options for Consideration
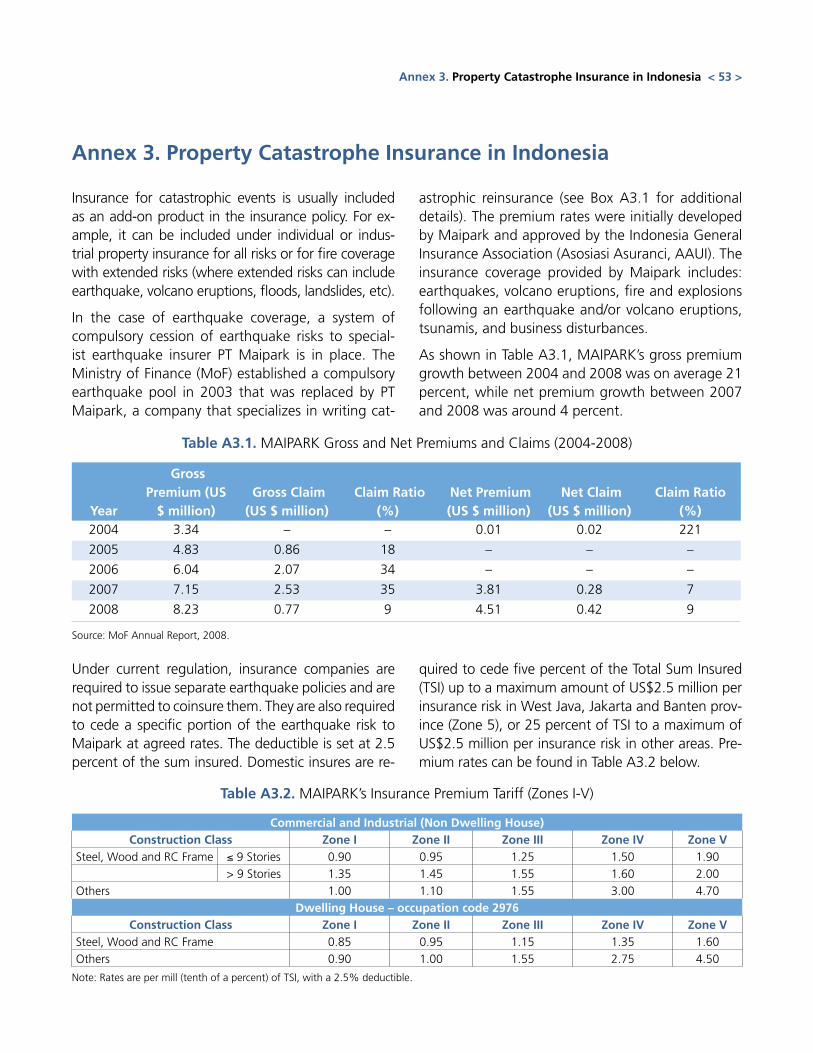
Annex 3. Property Catastrophe Insurance in Indonesia
Insurance for catastrophic events is usually included as an add-on product in the insurance policy. For ex-ample, it can be included under individual or indus-trial property insurance for all risks or for fire coverage with extended risks (where extended risks can include earthquake, volcano eruptions, floods, landslides, etc).
In the case of earthquake coverage, a system of compulsory cession of earthquake risks to special-ist earthquake insurer PT Maipark is in place. The Ministry of Finance (MoF) established a compulsory earthquake pool in 2003 that was replaced by PT Maipark, a company that specializes in writing cat-
astrophic reinsurance (see Box A3.1 for additional details). The premium rates were initially developed by Maipark and approved by the Indonesia General Insurance Association (Asosiasi Asuranci, AAUI). The insurance coverage provided by Maipark includes: earthquakes, volcano eruptions, fire and explosions following an earthquake and/or volcano eruptions, tsunamis, and business disturbances.
As shown in Table A3.1, MAIPARK’s gross premium growth between 2004 and 2008 was on average 21 percent, while net premium growth between 2007 and 2008 was around 4 percent.
Table A3.1. MAIPARK Gross and Net Premiums and Claims (2004-2008)
Year
Gross Premium (US
$ million) Gross Claim (US $ million)
Claim Ratio (%)
Net Premium (US $ million)
Net Claim (US $ million)
Claim Ratio (%)
2004 3.34 – – 0.01 0.02 221
2005 4.83 0.86 18 – – –
2006 6.04 2.07 34 – – –
2007 7.15 2.53 35 3.81 0.28 7
2008 8.23 0.77 9 4.51 0.42 9
Source: MoF Annual Report, 2008.
Under current regulation, insurance companies are required to issue separate earthquake policies and are not permitted to coinsure them. They are also required to cede a specific portion of the earthquake risk to Maipark at agreed rates. The deductible is set at 2.5 percent of the sum insured. Domestic insures are re-
quired to cede five percent of the Total Sum Insured (TSI) up to a maximum amount of US$2.5 million per insurance risk in West Java, Jakarta and Banten prov-ince (Zone 5), or 25 percent of TSI to a maximum of US$2.5 million per insurance risk in other areas. Pre-mium rates can be found in Table A3.2 below.
Commercial and Industrial (Non Dwelling House)Construction Class Zone I Zone II Zone III Zone IV Zone V
Steel, Wood and RC Frame ≤ 9 Stories 0.90 0.95 1.25 1.50 1.90
> 9 Stories 1.35 1.45 1.55 1.60 2.00
Others 1.00 1.10 1.55 3.00 4.70
Dwelling House – occupation code 2976Construction Class Zone I Zone II Zone III Zone IV Zone V
Steel, Wood and RC Frame 0.85 0.95 1.15 1.35 1.60
Others 0.90 1.00 1.55 2.75 4.50
Table A3.2. MAIPARK’s Insurance Premium Tariff (Zones I-V)
Annex 3. Property Catastrophe Insurance in Indonesia < 53 >
Note: Rates are per mill (tenth of a percent) of TSI, with a 2.5% deductible.
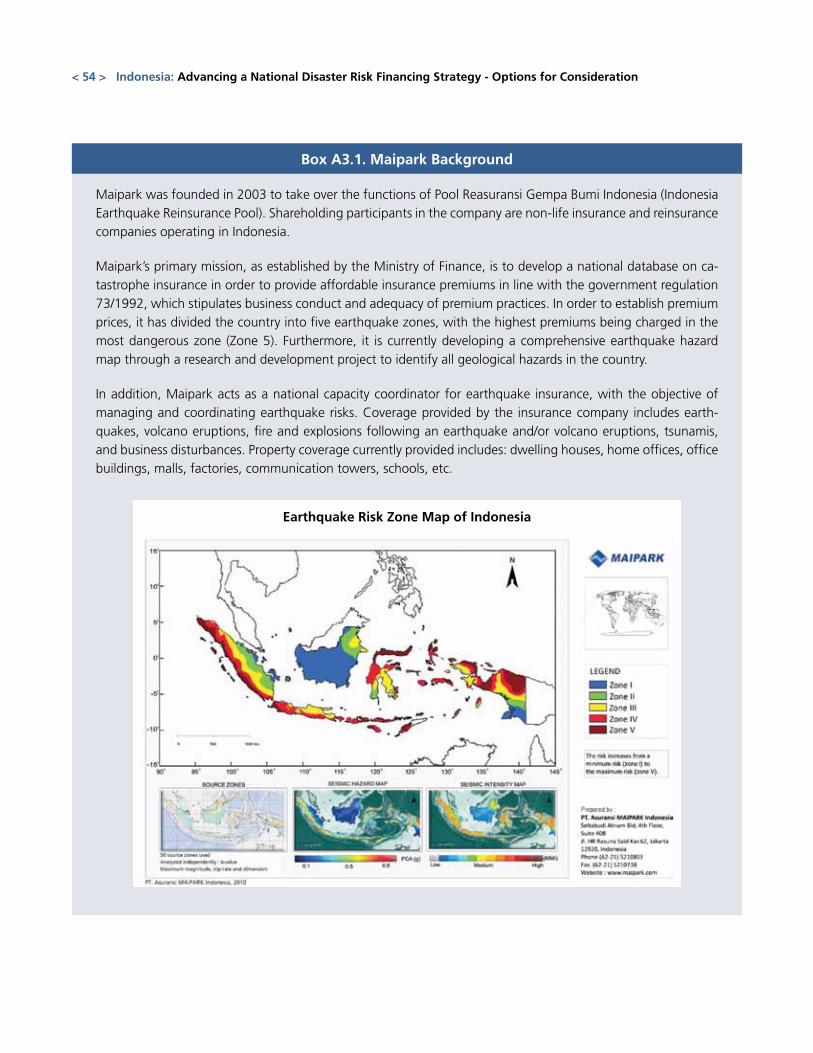
< 54 > Indonesia: Advancing a National Disaster Risk Financing Strategy - Options for Consideration
Box A3.1. Maipark Background
Maipark was founded in 2003 to take over the functions of Pool Reasuransi Gempa Bumi Indonesia (Indonesia Earthquake Reinsurance Pool). Shareholding participants in the company are non-life insurance and reinsurance companies operating in Indonesia.
Maipark’s primary mission, as established by the Ministry of Finance, is to develop a national database on ca-tastrophe insurance in order to provide affordable insurance premiums in line with the government regulation 73/1992, which stipulates business conduct and adequacy of premium practices. In order to establish premium prices, it has divided the country into five earthquake zones, with the highest premiums being charged in the most dangerous zone (Zone 5). Furthermore, it is currently developing a comprehensive earthquake hazard map through a research and development project to identify all geological hazards in the country.
In addition, Maipark acts as a national capacity coordinator for earthquake insurance, with the objective of managing and coordinating earthquake risks. Coverage provided by the insurance company includes earth-quakes, volcano eruptions, fire and explosions following an earthquake and/or volcano eruptions, tsunamis, and business disturbances. Property coverage currently provided includes: dwelling houses, home offices, office buildings, malls, factories, communication towers, schools, etc.
Earthquake Risk Zone Map of Indonesia
Annex 4. Insurance of Public Assets in Indonesia
Annex 4. Insurance of Public Assets in Indonesia < 55 >
The Central Government does not currently insure public assets against natural disaster risks and the majority of provincial and local governments also self insure their critical assets. In recent years, there has been some progress among local governments to buy insurance coverage for their public assets against natural disasters
PT Asuransi Bangun Askrida
PT Asuransi Bangun Askrida was established by the government as a state-owned company in 1989 to provide insurance coverage for government build-ings and property. Askrida was initially owned by the Regional Development Bank (Bank Pembangu-nan Daerah), although in 1996 the shareholding was extended to all local provincial governments. Askrida now offers indemnity insurance products for fire, motor vehicle, engineering, personal accident, fraud, marine, surety bond and counter identity.
Given the lengthy insurance premium budget pro-cesses, Askrida has proposed to some local govern-ments that they include a catastrophe property insur-ance protection plan within their budgets. Given the complexity and difficulty in monitoring a nationwide program, Askrida has only approached local gov-ernments for regional/provincial schemes. However, Askrida would support a national plan to finance in-surance premium payments, at the local level, through the national budget. Through this approach, payouts would be allocated to local governments that would distribute them to the community. Two examples of local governments insuring assets include West Su-matra Province Pandang, and Yogyakarta.
West Sumatra Province, Padang
In 2007, the West Sumatra Province government in-sured local assets—fire risk only—with PT Asuransi Bangum Askrida insurance. Since 2008, the cover-
age was extended to earthquake risks. This insur-ance coverage covers 42 local government build-ings, four hospitals, 73 local government official and guest houses. Insurance premiums were 1.25 per mill (based on Maipark’s tariff).
The insurance premium allocation is paid from the provincial government budget. The first insurance premium payment was for 42 local government buildings, and the second payment was for local gov-ernment official’s houses and guest houses. The total insurance premium of about US$20,000 is budgeted in the local provincial budget as “expenditure for in-surance of local government assets”. The first claim experience was after the earthquake of September 2009 and was settled in May 2010 (that is, seven months after earthquake) for an amount of US$2 mil-lion. The final claim settlement is still pending.
The Padang municipal government has also insured some of their local government assets. However, the policy was not yet effective when the earthquake took place in 2009. In fiscal year 2010, additional as-sets were insured among Padang municipal govern-ments, including Puskesmas, a local government-owned small clinic, and some schools.
Yogyakarta
Yogyakarta is one of many regions in Indonesia which is highly exposed to earthquakes, volcanic eruptions, tsunamis, tornados and landslides. Since 2003, the municipality of Yogyakarta has insured its public assets. These assets include government buildings, schools, hospitals, traditional market places and motor vehicle. The aggregate insurance premium is estimated at US$90,000 in 2010 and US$20,000 million in 2011. The premium in 2011 decreased due to a smaller budget capacity of the municipality of Yogyakarta. The average premium rate is 5 percent of the sum insured. The insurance scheme is opened to all insurance companies and
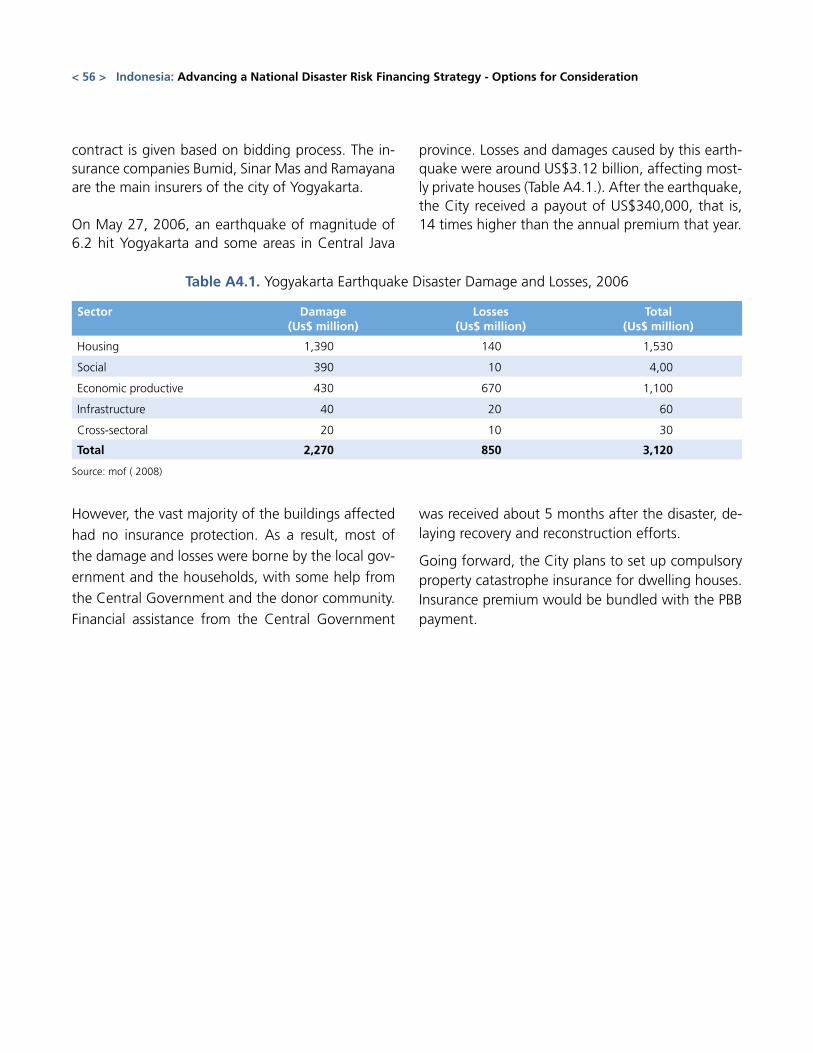
contract is given based on bidding process. The in-surance companies Bumid, Sinar Mas and Ramayana are the main insurers of the city of Yogyakarta.
On May 27, 2006, an earthquake of magnitude of 6.2 hit Yogyakarta and some areas in Central Java
province. Losses and damages caused by this earth-quake were around US$3.12 billion, affecting most-ly private houses (Table A4.1.). After the earthquake, the City received a payout of US$340,000, that is, 14 times higher than the annual premium that year.
< 56 > Indonesia: Advancing a National Disaster Risk Financing Strategy - Options for Consideration
Table A4.1. Yogyakarta Earthquake Disaster Damage and Losses, 2006
Sector Damage(Us$ million)
Losses (Us$ million)
Total (Us$ million)
Housing 1,390 140 1,530
Social 390 10 4,00
Economic productive 430 670 1,100
Infrastructure 40 20 60
Cross-sectoral 20 10 30
Total 2,270 850 3,120
Source: mof ( 2008)
However, the vast majority of the buildings affected
had no insurance protection. As a result, most of
the damage and losses were borne by the local gov-
ernment and the households, with some help from
the Central Government and the donor community.
Financial assistance from the Central Government
was received about 5 months after the disaster, de-laying recovery and reconstruction efforts.
Going forward, the City plans to set up compulsory property catastrophe insurance for dwelling houses. Insurance premium would be bundled with the PBB payment.
Annex 5. Disaster Risk Financing and Insurance Framework
Annex 5. Disaster Risk Financing and Insurance Framework < 57 >
To help countries reduce their (over-)reliance on post disaster external assistance, the World Bank has pro-moted a disaster risk financing and insurance frame-work, which is partly based on corporate risk man-agement principles but also considers economic and social factors such as the government’s fiscal profile and the living conditions of the poor (Gurenko and Lester 2003, Cummins and Mahul 2009).
This risk management approach relies on the identi-fication and assessment of the (implicit and explicit) contingent liability of the government in the event of natural disasters and on the financing of this con-tingent liability, possibly using market-based finan-cial instruments. By ensuring that sufficient liquid-ity exists immediately following a disaster, modern funding approaches can help speed recovery, ensure that scarce government funds are well used, and re-duce the risk-enhancing effects of moral hazard.
With sufficient liquidity following a disaster, the gov-ernment can immediately focus on early recovery and not be distracted by having to close short-term funding gaps. At the same time, authorities can jumpstart reconstruction, particularly of key pub-lic infrastructure (including bridges, hospitals, and schools). Finally, catastrophe risk management can assist countries in the optimal allocation of risk in the economy, which may result in higher economic growth, better risk reduction, and more effective poverty alleviation.
The sovereign catastrophe risk financing framework is part of a broader disaster risk management frame-work promoted by the World Bank, which also in-cludes: i) risk assessment; ii) emergency prepared-ness; iii) risk reduction; and, iv) institutional capacity building. Catastrophe risk financing complements other disaster risk management activities and pro-tects against extreme events that cannot be effi-ciently mitigated. It can also provide incentives for prevention and preparedness activities and allow
rapid response once a disaster occurs. The World Bank country catastrophe risk financing framework is based on three pillars:
■■ Assessment of the government’s contingent lia-bility. The first step in understanding the govern-ment’s contingent liability is to develop precise risk models that accurately reflect the country’s risk exposure to natural hazards and the losses associated with various events. Second, a dia-logue must take place regarding the roles and re-sponsibilities of the government and individuals in the aftermath of a catastrophic event. The con-tingent liability of the government due to natural disasters is often implicit, as the law usually does not clearly define the financial responsibility of the government when a disaster hits the country. The government thus acts as a (re)insurer of last resort, without knowing precisely its catastrophe risk exposure. By understanding the full exposure and the extent of public intervention in recovery efforts, it is possible to ascertain the contingent liability carried by the government.
■■ Promotion of commercial property catastrophe insurance. The government can reduce its con-tingent liability by encouraging private competi-tive insurance solutions for the transfer of pri-vately-owned risks, including property insurance and agricultural insurance. This can be done by creating an enabling environment that allows pri-vate insurers and reinsurers to offer competitive products and, possibly, through the establish-ment of catastrophe insurance programs based on public-private partnerships, including catas-trophe insurance pools. This allows the govern-ment to reduce its contingent liability in the case of a natural disaster. The government can thus concentrate its financial support on the poor and disadvantaged.
■■ Sovereign financial protection against natural disasters. The government can manage its re-
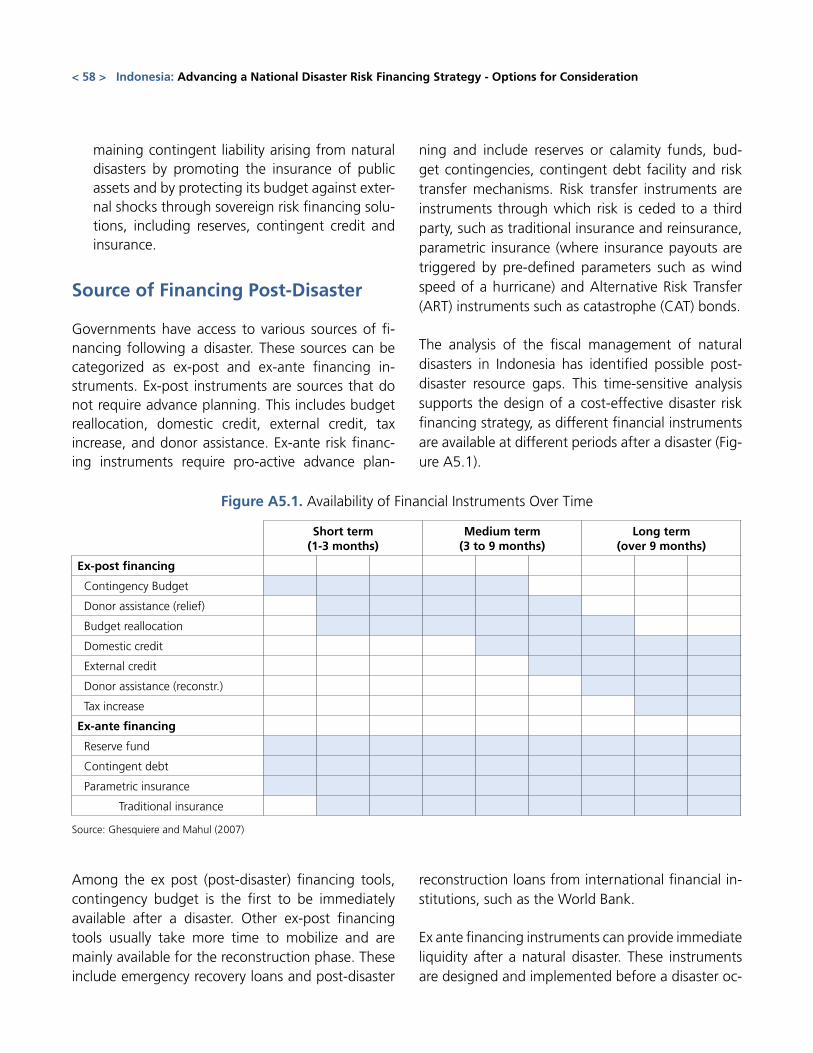
maining contingent liability arising from natural disasters by promoting the insurance of public assets and by protecting its budget against exter-nal shocks through sovereign risk financing solu-tions, including reserves, contingent credit and insurance.
Source of Financing Post-Disaster
Governments have access to various sources of fi-nancing following a disaster. These sources can be categorized as ex-post and ex-ante financing in-struments. Ex-post instruments are sources that do not require advance planning. This includes budget reallocation, domestic credit, external credit, tax increase, and donor assistance. Ex-ante risk financ-ing instruments require pro-active advance plan-
ning and include reserves or calamity funds, bud-get contingencies, contingent debt facility and risk transfer mechanisms. Risk transfer instruments are instruments through which risk is ceded to a third party, such as traditional insurance and reinsurance, parametric insurance (where insurance payouts are triggered by pre-defined parameters such as wind speed of a hurricane) and Alternative Risk Transfer (ART) instruments such as catastrophe (CAT) bonds.
The analysis of the fiscal management of natural disasters in Indonesia has identified possible post-disaster resource gaps. This time-sensitive analysis supports the design of a cost-effective disaster risk financing strategy, as different financial instruments are available at different periods after a disaster (Fig-ure A5.1).
Figure A5.1. Availability of Financial Instruments Over Time
Short term(1-3 months)
Medium term(3 to 9 months)
Long term(over 9 months)
Ex-post financing
Contingency Budget
Donor assistance (relief)
Budget reallocation
Domestic credit
External credit
Donor assistance (reconstr.)
Tax increase
Ex-ante financing
Reserve fund
Contingent debt
Parametric insurance
Traditional insurance
Source: Ghesquiere and Mahul (2007)
Among the ex post (post-disaster) financing tools, contingency budget is the first to be immediately available after a disaster. Other ex-post financing tools usually take more time to mobilize and are mainly available for the reconstruction phase. These include emergency recovery loans and post-disaster
reconstruction loans from international financial in-stitutions, such as the World Bank.
Ex ante financing instruments can provide immediate liquidity after a natural disaster. These instruments are designed and implemented before a disaster oc-
< 58 > Indonesia: Advancing a National Disaster Risk Financing Strategy - Options for Consideration
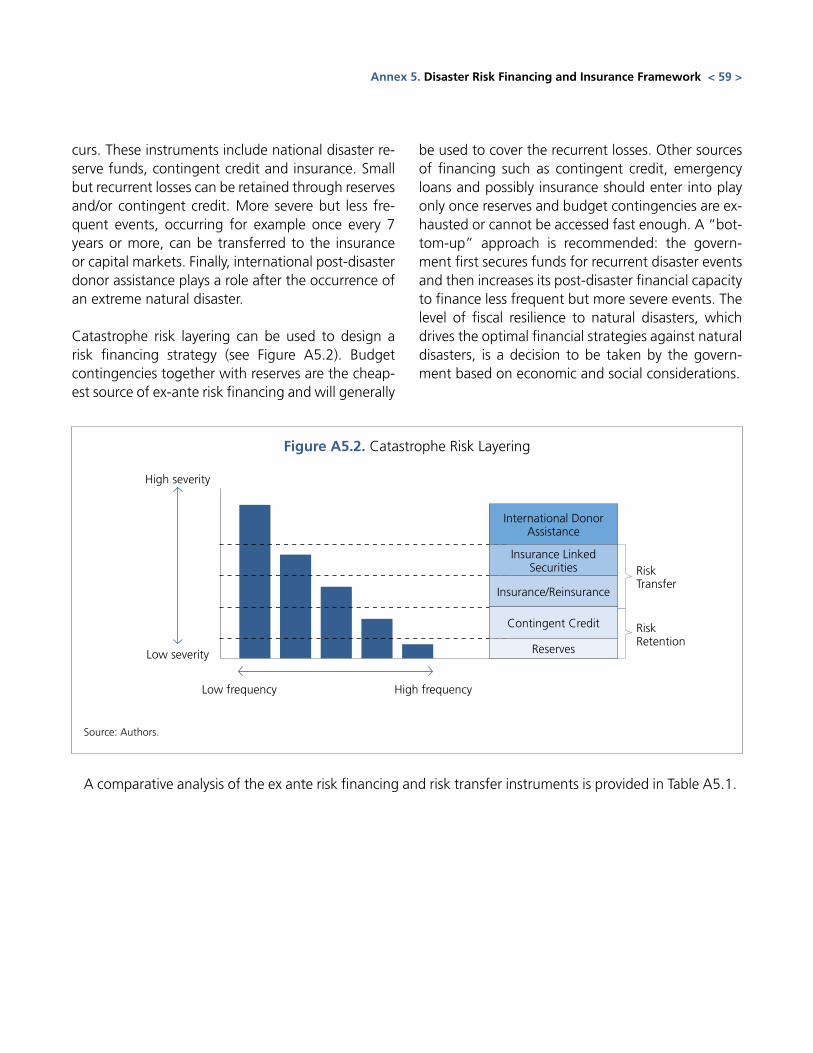
curs. These instruments include national disaster re-serve funds, contingent credit and insurance. Small but recurrent losses can be retained through reserves and/or contingent credit. More severe but less fre-quent events, occurring for example once every 7 years or more, can be transferred to the insurance or capital markets. Finally, international post-disaster donor assistance plays a role after the occurrence of an extreme natural disaster.
Catastrophe risk layering can be used to design a risk financing strategy (see Figure A5.2). Budget contingencies together with reserves are the cheap-est source of ex-ante risk financing and will generally
be used to cover the recurrent losses. Other sources of financing such as contingent credit, emergency loans and possibly insurance should enter into play only once reserves and budget contingencies are ex-hausted or cannot be accessed fast enough. A “bot-tom-up” approach is recommended: the govern-ment first secures funds for recurrent disaster events and then increases its post-disaster financial capacity to finance less frequent but more severe events. The level of fiscal resilience to natural disasters, which drives the optimal financial strategies against natural disasters, is a decision to be taken by the govern-ment based on economic and social considerations.
RiskTransfer
High severity
Low severity
Low frequency High frequency
RiskRetention
Figure A5.2. Catastrophe Risk Layering
International Donor Assistance
Insurance Linked Securities
Insurance/Reinsurance
Contingent Credit
Reserves
Source: Authors.
A comparative analysis of the ex ante risk financing and risk transfer instruments is provided in Table A5.1.
Annex 5. Disaster Risk Financing and Insurance Framework < 59 >
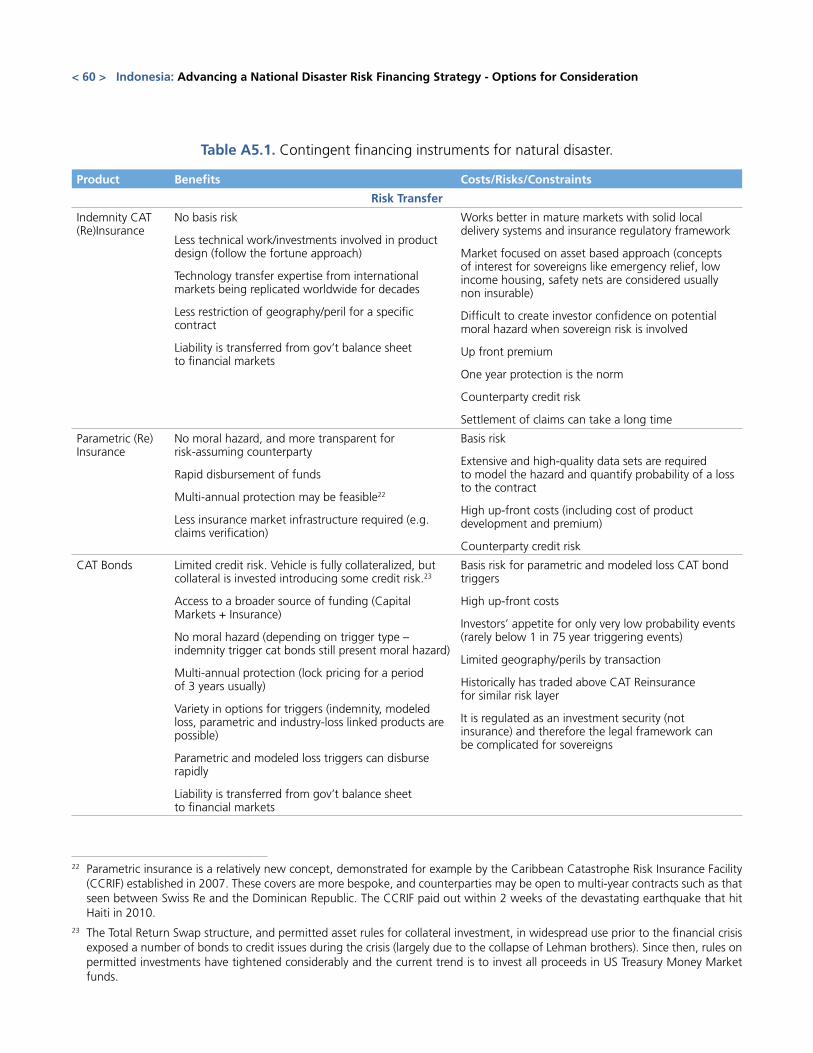
Table A5.1. Contingent financing instruments for natural disaster.
Product Benefits Costs/Risks/Constraints
Risk Transfer
Indemnity CAT (Re)Insurance
No basis risk
Less technical work/investments involved in product design (follow the fortune approach)
Technology transfer expertise from international markets being replicated worldwide for decades
Less restriction of geography/peril for a specific contract
Liability is transferred from gov’t balance sheet to financial markets
Works better in mature markets with solid local delivery systems and insurance regulatory framework
Market focused on asset based approach (concepts of interest for sovereigns like emergency relief, low income housing, safety nets are considered usually non insurable)
Difficult to create investor confidence on potential moral hazard when sovereign risk is involved
Up front premium
One year protection is the norm
Counterparty credit risk
Settlement of claims can take a long time
Parametric (Re)Insurance
No moral hazard, and more transparent for risk-assuming counterparty
Rapid disbursement of funds
Multi-annual protection may be feasible22
Less insurance market infrastructure required (e.g. claims verification)
Basis risk
Extensive and high-quality data sets are required to model the hazard and quantify probability of a loss to the contract
High up-front costs (including cost of product development and premium)
Counterparty credit risk
CAT Bonds Limited credit risk. Vehicle is fully collateralized, but collateral is invested introducing some credit risk.23
Access to a broader source of funding (Capital Markets + Insurance)
No moral hazard (depending on trigger type – indemnity trigger cat bonds still present moral hazard)
Multi-annual protection (lock pricing for a period of 3 years usually)
Variety in options for triggers (indemnity, modeled loss, parametric and industry-loss linked products are possible)
Parametric and modeled loss triggers can disburse rapidly
Liability is transferred from gov’t balance sheet to financial markets
Basis risk for parametric and modeled loss CAT bond triggers
High up-front costs
Investors’ appetite for only very low probability events (rarely below 1 in 75 year triggering events)
Limited geography/perils by transaction
Historically has traded above CAT Reinsurance for similar risk layer
It is regulated as an investment security (not insurance) and therefore the legal framework can be complicated for sovereigns
< 60 > Indonesia: Advancing a National Disaster Risk Financing Strategy - Options for Consideration
22 Parametric insurance is a relatively new concept, demonstrated for example by the Caribbean Catastrophe Risk Insurance Facility (CCRIF) established in 2007. These covers are more bespoke, and counterparties may be open to multi-year contracts such as that seen between Swiss Re and the Dominican Republic. The CCRIF paid out within 2 weeks of the devastating earthquake that hit Haiti in 2010.
23 The Total Return Swap structure, and permitted asset rules for collateral investment, in widespread use prior to the financial crisis exposed a number of bonds to credit issues during the crisis (largely due to the collapse of Lehman brothers). Since then, rules on permitted investments have tightened considerably and the current trend is to invest all proceeds in US Treasury Money Market funds.
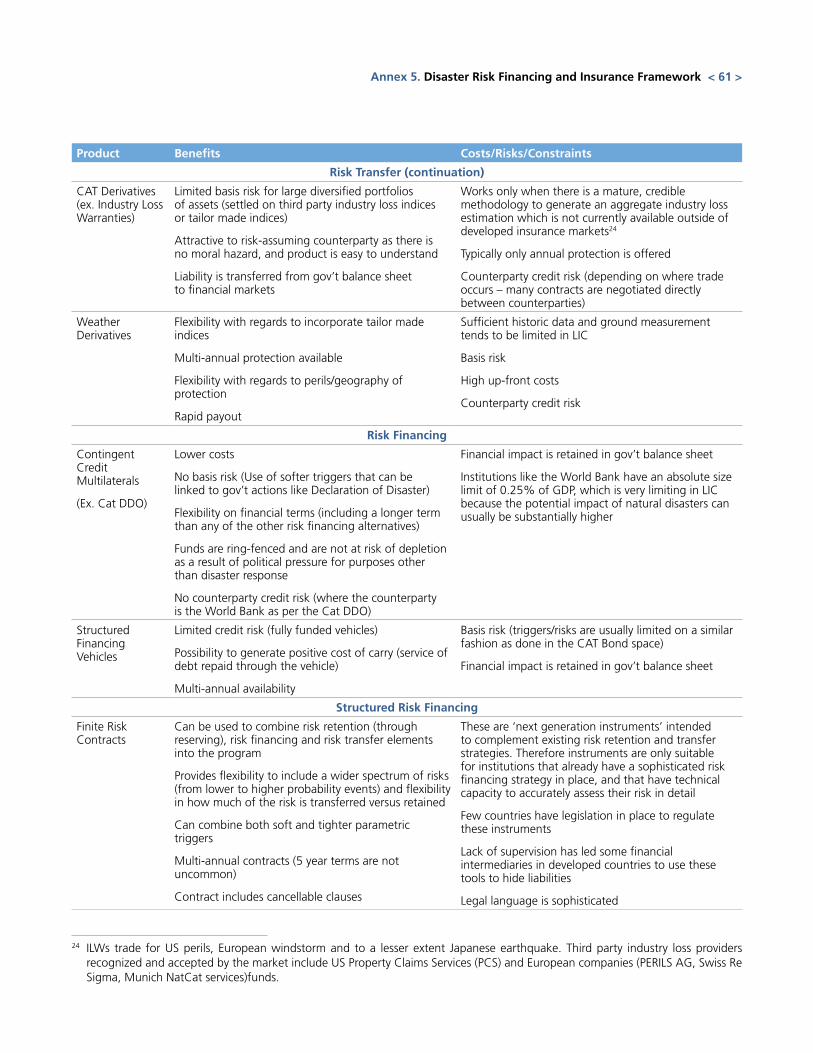
Product Benefits Costs/Risks/Constraints
Risk Transfer (continuation)
CAT Derivatives (ex. Industry Loss Warranties)
Limited basis risk for large diversified portfolios of assets (settled on third party industry loss indices or tailor made indices)
Attractive to risk-assuming counterparty as there is no moral hazard, and product is easy to understand
Liability is transferred from gov’t balance sheet to financial markets
Works only when there is a mature, credible methodology to generate an aggregate industry loss estimation which is not currently available outside of developed insurance markets24
Typically only annual protection is offered
Counterparty credit risk (depending on where trade occurs – many contracts are negotiated directly between counterparties)
Weather Derivatives
Flexibility with regards to incorporate tailor made indices
Multi-annual protection available
Flexibility with regards to perils/geography of protection
Rapid payout
Sufficient historic data and ground measurement tends to be limited in LIC
Basis risk
High up-front costs
Counterparty credit risk
Risk Financing
Contingent Credit Multilaterals
(Ex. Cat DDO)
Lower costs
No basis risk (Use of softer triggers that can be linked to gov’t actions like Declaration of Disaster)
Flexibility on financial terms (including a longer term than any of the other risk financing alternatives)
Funds are ring-fenced and are not at risk of depletion as a result of political pressure for purposes other than disaster response
No counterparty credit risk (where the counterparty is the World Bank as per the Cat DDO)
Financial impact is retained in gov’t balance sheet
Institutions like the World Bank have an absolute size limit of 0.25% of GDP, which is very limiting in LIC because the potential impact of natural disasters can usually be substantially higher
Structured Financing Vehicles
Limited credit risk (fully funded vehicles)
Possibility to generate positive cost of carry (service of debt repaid through the vehicle)
Multi-annual availability
Basis risk (triggers/risks are usually limited on a similar fashion as done in the CAT Bond space)
Financial impact is retained in gov’t balance sheet
Structured Risk Financing
Finite Risk Contracts
Can be used to combine risk retention (through reserving), risk financing and risk transfer elements into the program
Provides flexibility to include a wider spectrum of risks (from lower to higher probability events) and flexibility in how much of the risk is transferred versus retained
Can combine both soft and tighter parametric triggers
Multi-annual contracts (5 year terms are not uncommon)
Contract includes cancellable clauses
These are ‘next generation instruments’ intended to complement existing risk retention and transfer strategies. Therefore instruments are only suitable for institutions that already have a sophisticated risk financing strategy in place, and that have technical capacity to accurately assess their risk in detail
Few countries have legislation in place to regulate these instruments
Lack of supervision has led some financial intermediaries in developed countries to use these tools to hide liabilities
Legal language is sophisticated
Annex 5. Disaster Risk Financing and Insurance Framework < 61 >
24 ILWs trade for US perils, European windstorm and to a lesser extent Japanese earthquake. Third party industry loss providers recognized and accepted by the market include US Property Claims Services (PCS) and European companies (PERILS AG, Swiss Re Sigma, Munich NatCat services)funds.
Annex 6. World Bank Development Policy Loan with Catastrophe Draw Down Option
The Development Policy Loan with Cat DDO is a contingent credit line that provides immediate li-quidity to IBRD member countries in the aftermath of a natural disaster. It is part of a broad spectrum of World Bank Group disaster risk financing instru-ments available to assist borrowers in planning ef-ficient responses to catastrophic events.
The Cat DDO helps develop a country’s capacity to manage the risk of natural disasters and should be part of a broader preventive disaster risk manage-ment strategy. The Cat DDO complements existing market-based disaster risk financing instruments such as insurance, catastrophe bonds, reserve funds, etc.
In order to gain access to financing, the borrower must implement a disaster risk management pro-gram, which the Bank will monitor on a periodic basis.
Key Features
The Cat DDO offers a source of immediate liquidity that can serve as bridge financing while other sourc-es (e.g. concessional funding, bilateral aid or recon-struction loans) are being mobilized after a natural disaster. The Cat DDO ensures that the government will have immediate access to bridge financing fol-lowing a disaster, which is when a government’s post-disaster liquidity constraints are highest.
Borrowers have access to financing in amounts up to US$500 million or 0.25 percent of GDP (which-ever is less). The Cat DDO has a “soft” trigger, as
opposed to “parametric” trigger, which means that funds become available for disbursement upon the occurrence of a natural disaster resulting in the dec-laration of a state of emergency.
The Cat DDO has a revolving feature; amounts re-paid during the drawdown period are available for subsequent withdrawal. The three-year drawdown period may be renewed up to four times, for a total maximum period of 15 years.
Pricing Considerations
The Cat DDO carries a LIBOR-based interest rate that is charged on disbursed and outstanding amounts. The interest rate will be the prevailing rate for IBRD loans at time of drawdown. A front-end fee of 0.50 percent on the approved loan amount and a renew-al fee of 0.25 percent also applies.
The Cat DDO provides an affordable source of con-tingent credit for governments to finance recurrent losses caused by natural disasters. The expected net present value of the cost of the Cat DDO is estimat-ed to be at least 30 percent lower than the cost of insurance for medium risk layers (that is, a disaster occurring once every three years). This cost saving can be even higher when the country’s opportunity cost of capital is greater.
< 62 > Indonesia: Advancing a National Disaster Risk Financing Strategy - Options for Consideration
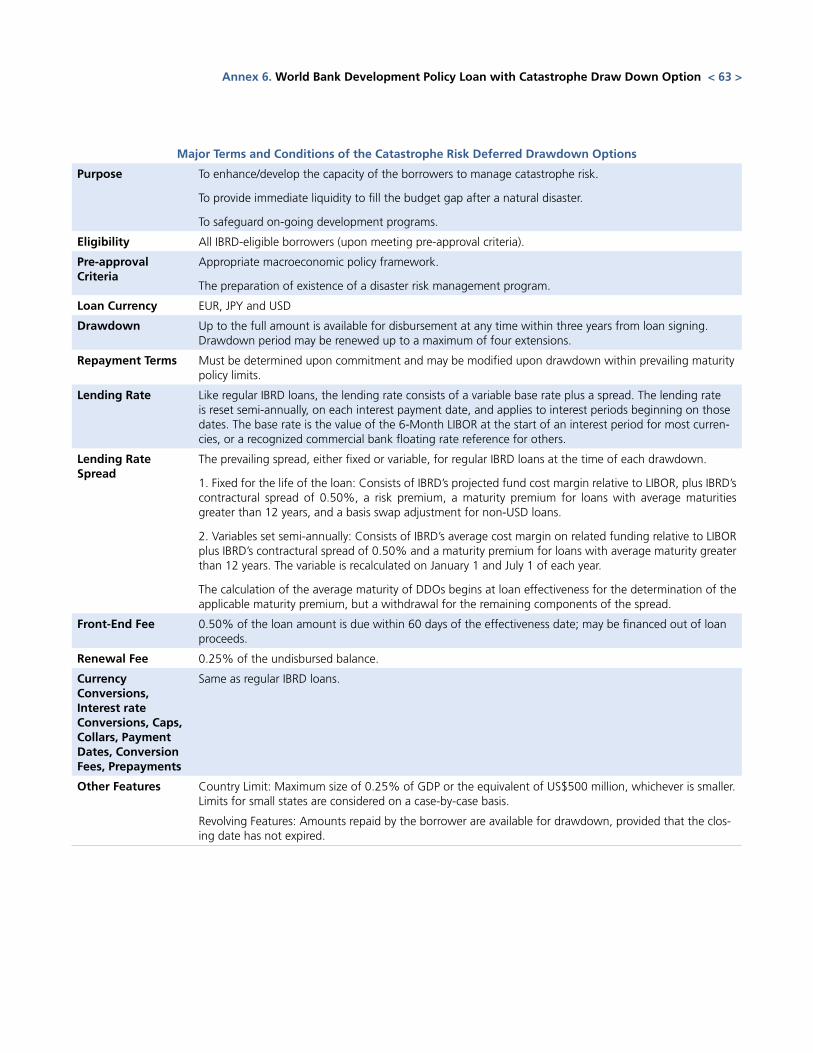
Major Terms and Conditions of the Catastrophe Risk Deferred Drawdown Options
Purpose To enhance/develop the capacity of the borrowers to manage catastrophe risk.
To provide immediate liquidity to fill the budget gap after a natural disaster.
To safeguard on-going development programs.
Eligibility All IBRD-eligible borrowers (upon meeting pre-approval criteria).
Pre-approval Criteria
Appropriate macroeconomic policy framework.
The preparation of existence of a disaster risk management program.
Loan Currency EUR, JPY and USD
Drawdown Up to the full amount is available for disbursement at any time within three years from loan signing. Drawdown period may be renewed up to a maximum of four extensions.
Repayment Terms Must be determined upon commitment and may be modified upon drawdown within prevailing maturity policy limits.
Lending Rate Like regular IBRD loans, the lending rate consists of a variable base rate plus a spread. The lending rate is reset semi-annually, on each interest payment date, and applies to interest periods beginning on those dates. The base rate is the value of the 6-Month LIBOR at the start of an interest period for most curren-cies, or a recognized commercial bank floating rate reference for others.
Lending Rate Spread
The prevailing spread, either fixed or variable, for regular IBRD loans at the time of each drawdown.
1. Fixed for the life of the loan: Consists of IBRD’s projected fund cost margin relative to LIBOR, plus IBRD’s contractural spread of 0.50%, a risk premium, a maturity premium for loans with average maturities greater than 12 years, and a basis swap adjustment for non-USD loans.
2. Variables set semi-annually: Consists of IBRD’s average cost margin on related funding relative to LIBOR plus IBRD’s contractural spread of 0.50% and a maturity premium for loans with average maturity greater than 12 years. The variable is recalculated on January 1 and July 1 of each year.
The calculation of the average maturity of DDOs begins at loan effectiveness for the determination of the applicable maturity premium, but a withdrawal for the remaining components of the spread.
Front-End Fee 0.50% of the loan amount is due within 60 days of the effectiveness date; may be financed out of loan proceeds.
Renewal Fee 0.25% of the undisbursed balance.
Currency Conversions, Interest rate Conversions, Caps, Collars, Payment Dates, Conversion Fees, Prepayments
Same as regular IBRD loans.
Other Features Country Limit: Maximum size of 0.25% of GDP or the equivalent of US$500 million, whichever is smaller. Limits for small states are considered on a case-by-case basis.
Revolving Features: Amounts repaid by the borrower are available for drawdown, provided that the clos-ing date has not expired.
Annex 6. World Bank Development Policy Loan with Catastrophe Draw Down Option < 63 >
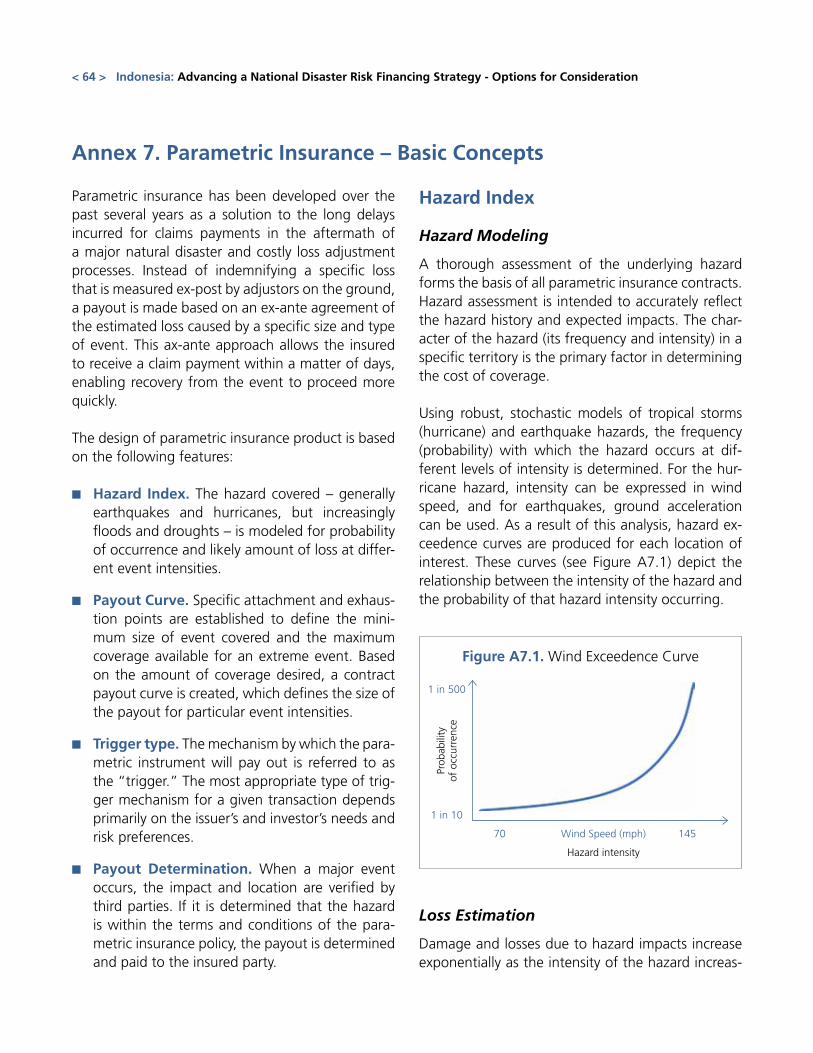
Annex 7. Parametric Insurance – Basic Concepts
Parametric insurance has been developed over the past several years as a solution to the long delays incurred for claims payments in the aftermath of a major natural disaster and costly loss adjustment processes. Instead of indemnifying a specific loss that is measured ex-post by adjustors on the ground, a payout is made based on an ex-ante agreement of the estimated loss caused by a specific size and type of event. This ax-ante approach allows the insured to receive a claim payment within a matter of days, enabling recovery from the event to proceed more quickly.
The design of parametric insurance product is based on the following features:
■■ Hazard Index. The hazard covered – generally earthquakes and hurricanes, but increasingly floods and droughts – is modeled for probability of occurrence and likely amount of loss at differ-ent event intensities.
■■ Payout Curve. Specific attachment and exhaus-tion points are established to define the mini-mum size of event covered and the maximum coverage available for an extreme event. Based on the amount of coverage desired, a contract payout curve is created, which defines the size of the payout for particular event intensities.
■■ Trigger type. The mechanism by which the para-metric instrument will pay out is referred to as the “trigger.” The most appropriate type of trig-ger mechanism for a given transaction depends primarily on the issuer’s and investor’s needs and risk preferences.
■■ Payout Determination. When a major event occurs, the impact and location are verified by third parties. If it is determined that the hazard is within the terms and conditions of the para-metric insurance policy, the payout is determined and paid to the insured party.
Hazard Index
Hazard Modeling
A thorough assessment of the underlying hazard forms the basis of all parametric insurance contracts. Hazard assessment is intended to accurately reflect the hazard history and expected impacts. The char-acter of the hazard (its frequency and intensity) in a specific territory is the primary factor in determining the cost of coverage.
Using robust, stochastic models of tropical storms (hurricane) and earthquake hazards, the frequency (probability) with which the hazard occurs at dif-ferent levels of intensity is determined. For the hur-ricane hazard, intensity can be expressed in wind speed, and for earthquakes, ground acceleration can be used. As a result of this analysis, hazard ex-ceedence curves are produced for each location of interest. These curves (see Figure A7.1) depict the relationship between the intensity of the hazard and the probability of that hazard intensity occurring.
Loss Estimation
Damage and losses due to hazard impacts increase exponentially as the intensity of the hazard increas-
1 in 500
1 in 10
70 Wind Speed (mph) 145
Hazard intensity
Figure A7.1. Wind Exceedence Curve
Prob
abili
tyof
occ
urre
nce
< 64 > Indonesia: Advancing a National Disaster Risk Financing Strategy - Options for Consideration
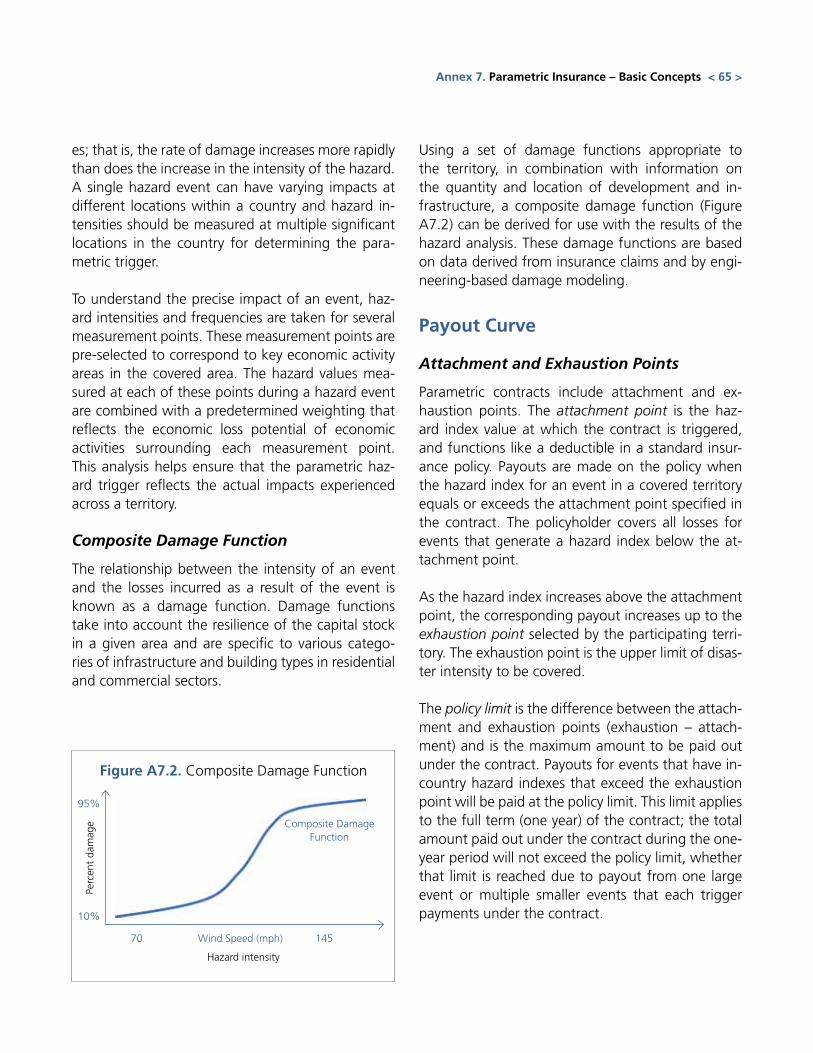
es; that is, the rate of damage increases more rapidly than does the increase in the intensity of the hazard. A single hazard event can have varying impacts at different locations within a country and hazard in-tensities should be measured at multiple significant locations in the country for determining the para-metric trigger.
To understand the precise impact of an event, haz-ard intensities and frequencies are taken for several measurement points. These measurement points are pre-selected to correspond to key economic activity areas in the covered area. The hazard values mea-sured at each of these points during a hazard event are combined with a predetermined weighting that reflects the economic loss potential of economic activities surrounding each measurement point. This analysis helps ensure that the parametric haz-ard trigger reflects the actual impacts experienced across a territory.
Composite Damage Function
The relationship between the intensity of an event and the losses incurred as a result of the event is known as a damage function. Damage functions take into account the resilience of the capital stock in a given area and are specific to various catego-ries of infrastructure and building types in residential and commercial sectors.
Using a set of damage functions appropriate to the territory, in combination with information on the quantity and location of development and in-frastructure, a composite damage function (Figure A7.2) can be derived for use with the results of the hazard analysis. These damage functions are based on data derived from insurance claims and by engi-neering-based damage modeling.
Payout Curve
Attachment and Exhaustion Points
Parametric contracts include attachment and ex-haustion points. The attachment point is the haz-ard index value at which the contract is triggered, and functions like a deductible in a standard insur-ance policy. Payouts are made on the policy when the hazard index for an event in a covered territory equals or exceeds the attachment point specified in the contract. The policyholder covers all losses for events that generate a hazard index below the at-tachment point.
As the hazard index increases above the attachment point, the corresponding payout increases up to the exhaustion point selected by the participating terri-tory. The exhaustion point is the upper limit of disas-ter intensity to be covered.
The policy limit is the difference between the attach-ment and exhaustion points (exhaustion – attach-ment) and is the maximum amount to be paid out under the contract. Payouts for events that have in-country hazard indexes that exceed the exhaustion point will be paid at the policy limit. This limit applies to the full term (one year) of the contract; the total amount paid out under the contract during the one-year period will not exceed the policy limit, whether that limit is reached due to payout from one large event or multiple smaller events that each trigger payments under the contract.
95%
10%
70 Wind Speed (mph) 145
Hazard intensity
Figure A7.2. Composite Damage Function
Perc
ent
dam
age Composite Damage
Function
Annex 7. Parametric Insurance – Basic Concepts < 65 >
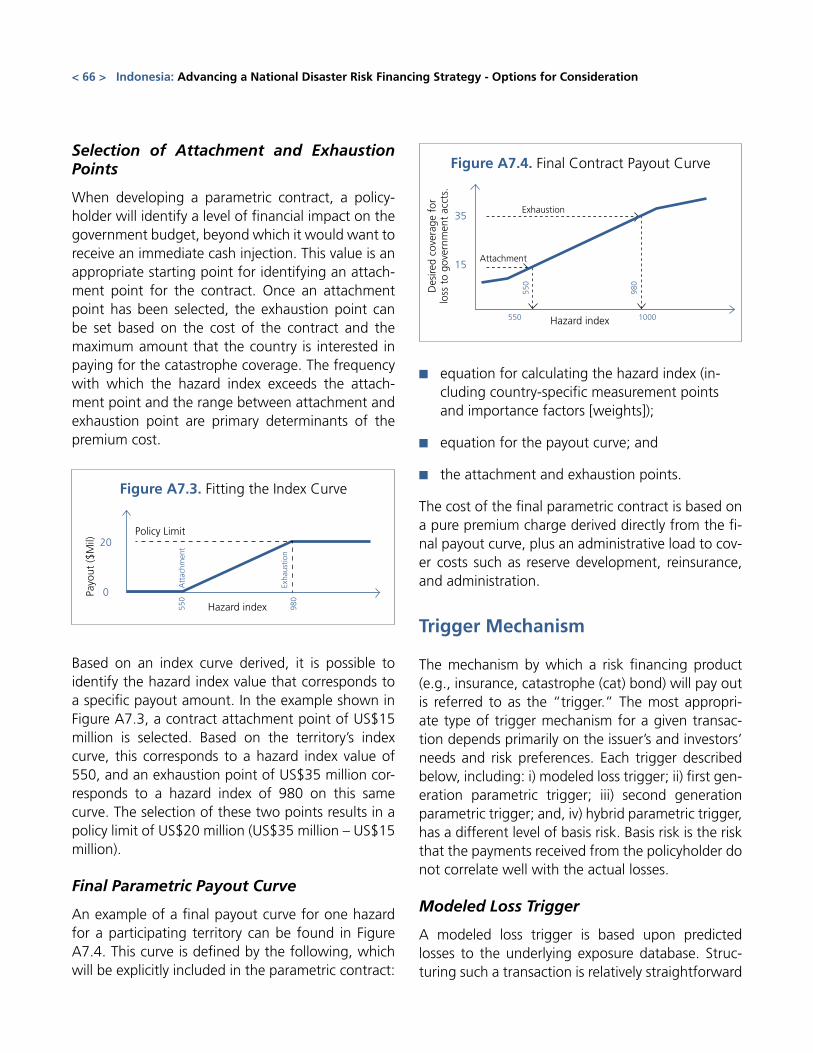
Selection of Attachment and Exhaustion Points
When developing a parametric contract, a policy-holder will identify a level of financial impact on the government budget, beyond which it would want to receive an immediate cash injection. This value is an appropriate starting point for identifying an attach-ment point for the contract. Once an attachment point has been selected, the exhaustion point can be set based on the cost of the contract and the maximum amount that the country is interested in paying for the catastrophe coverage. The frequency with which the hazard index exceeds the attach-ment point and the range between attachment and exhaustion point are primary determinants of the premium cost.
Based on an index curve derived, it is possible to identify the hazard index value that corresponds to a specific payout amount. In the example shown in Figure A7.3, a contract attachment point of US$15 million is selected. Based on the territory’s index curve, this corresponds to a hazard index value of 550, and an exhaustion point of US$35 million cor-responds to a hazard index of 980 on this same curve. The selection of these two points results in a policy limit of US$20 million (US$35 million – US$15 million).
Final Parametric Payout Curve
An example of a final payout curve for one hazard for a participating territory can be found in Figure A7.4. This curve is defined by the following, which will be explicitly included in the parametric contract:
■■ equation for calculating the hazard index (in-cluding country-specific measurement points and importance factors [weights]);
■■ equation for the payout curve; and
■■ the attachment and exhaustion points.
The cost of the final parametric contract is based on a pure premium charge derived directly from the fi-nal payout curve, plus an administrative load to cov-er costs such as reserve development, reinsurance, and administration.
Trigger Mechanism
The mechanism by which a risk financing product (e.g., insurance, catastrophe (cat) bond) will pay out is referred to as the “trigger.” The most appropri-ate type of trigger mechanism for a given transac-tion depends primarily on the issuer’s and investors’ needs and risk preferences. Each trigger described below, including: i) modeled loss trigger; ii) first gen-eration parametric trigger; iii) second generation parametric trigger; and, iv) hybrid parametric trigger, has a different level of basis risk. Basis risk is the risk that the payments received from the policyholder do not correlate well with the actual losses.
Modeled Loss Trigger
A modeled loss trigger is based upon predicted losses to the underlying exposure database. Struc-turing such a transaction is relatively straightforward
20
35
0
15
Hazard index
Hazard index
Policy Limit
Attachment
Exhaustion
Figure A7.3. Fitting the Index Curve
Figure A7.4. Final Contract Payout Curve
Payo
ut ($
Mil)
Des
ired
cove
rage
for
loss
to
gove
rnm
ent
acct
s.
550
A
ttac
hmen
t
550
550
980
1000
980
Ex
haus
tion
< 66 > Indonesia: Advancing a National Disaster Risk Financing Strategy - Options for Consideration
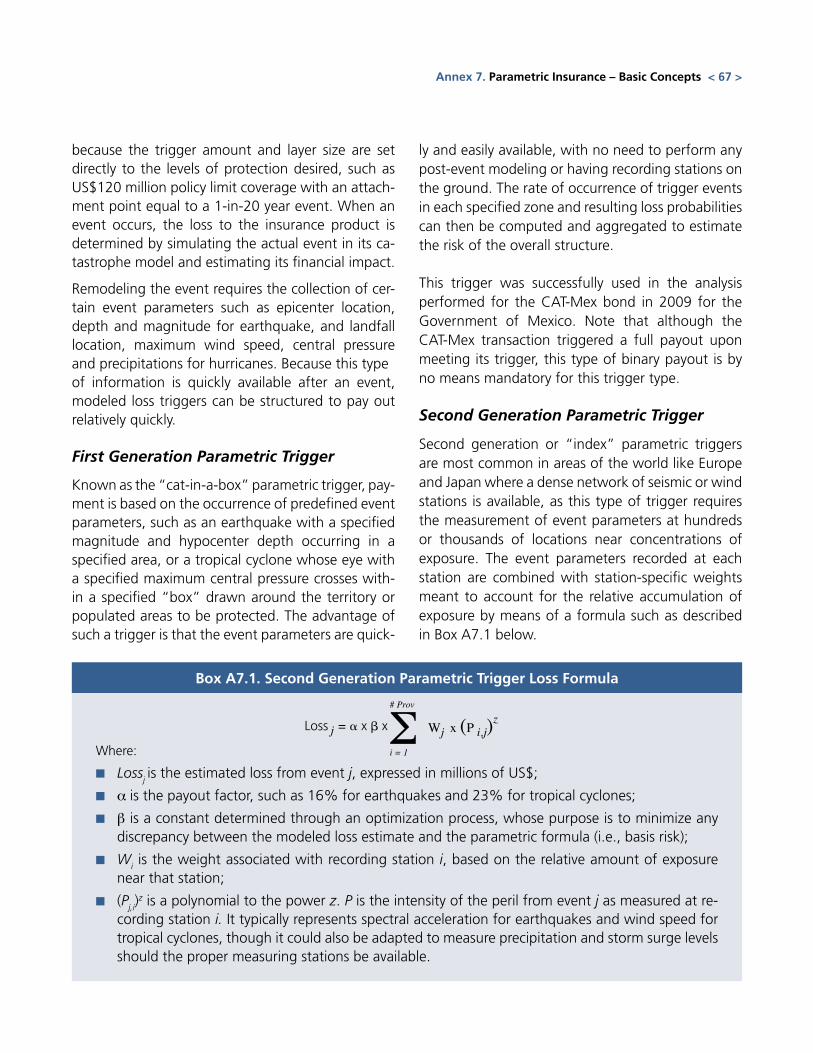
because the trigger amount and layer size are set directly to the levels of protection desired, such as US$120 million policy limit coverage with an attach-ment point equal to a 1-in-20 year event. When an event occurs, the loss to the insurance product is determined by simulating the actual event in its ca-tastrophe model and estimating its financial impact.
Remodeling the event requires the collection of cer-tain event parameters such as epicenter location, depth and magnitude for earthquake, and landfall location, maximum wind speed, central pressure and precipitations for hurricanes. Because this type of information is quickly available after an event, modeled loss triggers can be structured to pay out relatively quickly.
First Generation Parametric Trigger
Known as the “cat-in-a-box” parametric trigger, pay-ment is based on the occurrence of predefined event parameters, such as an earthquake with a specified magnitude and hypocenter depth occurring in a specified area, or a tropical cyclone whose eye with a specified maximum central pressure crosses with-in a specified “box” drawn around the territory or populated areas to be protected. The advantage of such a trigger is that the event parameters are quick-
ly and easily available, with no need to perform any post-event modeling or having recording stations on the ground. The rate of occurrence of trigger events in each specified zone and resulting loss probabilities can then be computed and aggregated to estimate the risk of the overall structure.
This trigger was successfully used in the analysis performed for the CAT-Mex bond in 2009 for the Government of Mexico. Note that although the CAT-Mex transaction triggered a full payout upon meeting its trigger, this type of binary payout is by no means mandatory for this trigger type.
Second Generation Parametric Trigger
Second generation or “index” parametric triggers are most common in areas of the world like Europe and Japan where a dense network of seismic or wind stations is available, as this type of trigger requires the measurement of event parameters at hundreds or thousands of locations near concentrations of exposure. The event parameters recorded at each station are combined with station-specific weights meant to account for the relative accumulation of exposure by means of a formula such as described in Box A7.1 below.
Annex 7. Parametric Insurance – Basic Concepts < 67 >
Box A7.1. Second Generation Parametric Trigger Loss Formula
Where:
■■ Lossj is the estimated loss from event j, expressed in millions of US$;
■■ a is the payout factor, such as 16% for earthquakes and 23% for tropical cyclones;
■■ β is a constant determined through an optimization process, whose purpose is to minimize any discrepancy between the modeled loss estimate and the parametric formula (i.e., basis risk);
■■ Wi is the weight associated with recording station i, based on the relative amount of exposure
near that station;
■■ (Pj,i)z is a polynomial to the power z. P is the intensity of the peril from event j as measured at re-
cording station i. It typically represents spectral acceleration for earthquakes and wind speed for tropical cyclones, though it could also be adapted to measure precipitation and storm surge levels should the proper measuring stations be available.
S# Prov
i = 1
Loss j = a x b x Wj x (P i,j)z
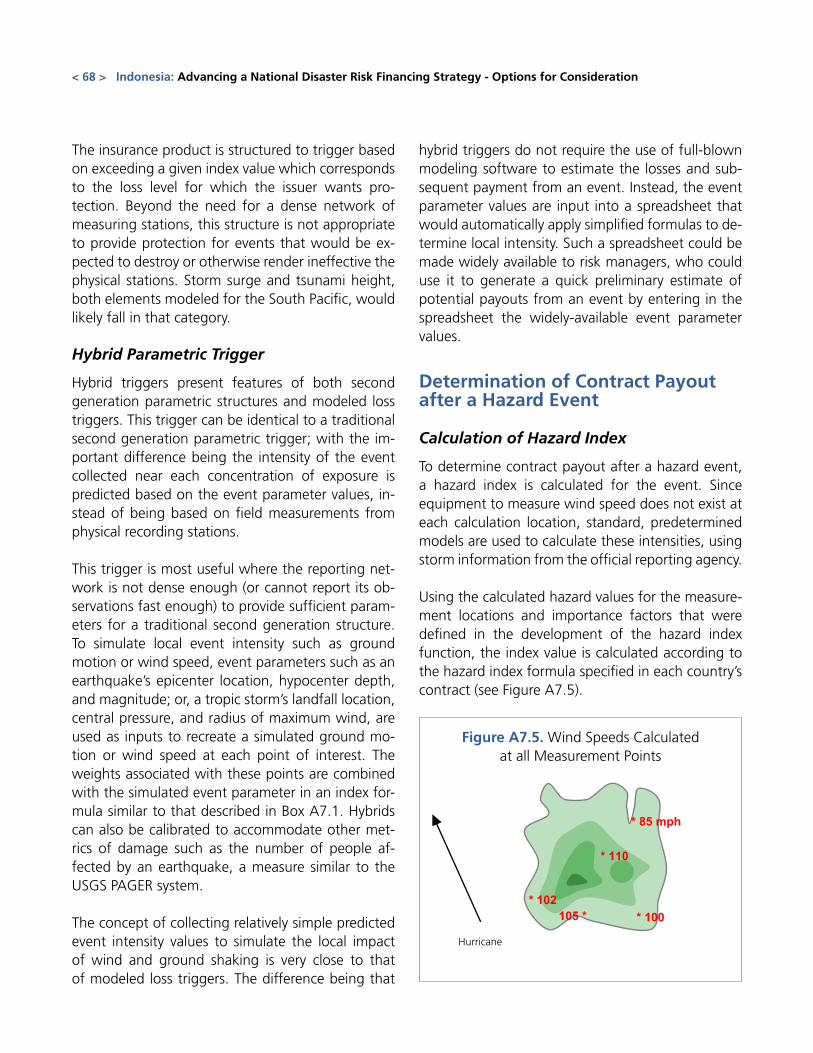
The insurance product is structured to trigger based on exceeding a given index value which corresponds to the loss level for which the issuer wants pro-tection. Beyond the need for a dense network of measuring stations, this structure is not appropriate to provide protection for events that would be ex-pected to destroy or otherwise render ineffective the physical stations. Storm surge and tsunami height, both elements modeled for the South Pacific, would likely fall in that category.
Hybrid Parametric Trigger
Hybrid triggers present features of both second generation parametric structures and modeled loss triggers. This trigger can be identical to a traditional second generation parametric trigger; with the im-portant difference being the intensity of the event collected near each concentration of exposure is predicted based on the event parameter values, in-stead of being based on field measurements from physical recording stations.
This trigger is most useful where the reporting net-work is not dense enough (or cannot report its ob-servations fast enough) to provide sufficient param-eters for a traditional second generation structure. To simulate local event intensity such as ground motion or wind speed, event parameters such as an earthquake’s epicenter location, hypocenter depth, and magnitude; or, a tropic storm’s landfall location, central pressure, and radius of maximum wind, are used as inputs to recreate a simulated ground mo-tion or wind speed at each point of interest. The weights associated with these points are combined with the simulated event parameter in an index for-mula similar to that described in Box A7.1. Hybrids can also be calibrated to accommodate other met-rics of damage such as the number of people af-fected by an earthquake, a measure similar to the USGS PAGER system.
The concept of collecting relatively simple predicted event intensity values to simulate the local impact of wind and ground shaking is very close to that of modeled loss triggers. The difference being that
hybrid triggers do not require the use of full-blown modeling software to estimate the losses and sub-sequent payment from an event. Instead, the event parameter values are input into a spreadsheet that would automatically apply simplified formulas to de-termine local intensity. Such a spreadsheet could be made widely available to risk managers, who could use it to generate a quick preliminary estimate of potential payouts from an event by entering in the spreadsheet the widely-available event parameter values.
Determination of Contract Payout after a Hazard Event
Calculation of Hazard Index
To determine contract payout after a hazard event, a hazard index is calculated for the event. Since equipment to measure wind speed does not exist at each calculation location, standard, predetermined models are used to calculate these intensities, using storm information from the official reporting agency.
Using the calculated hazard values for the measure-ment locations and importance factors that were defined in the development of the hazard index function, the index value is calculated according to the hazard index formula specified in each country’s contract (see Figure A7.5).
< 68 > Indonesia: Advancing a National Disaster Risk Financing Strategy - Options for Consideration
* 85 mph
* 100 * 102 105 *
* 110
Hurricane
Figure A7.5. Wind Speeds Calculated at all Measurement Points
Hurricane
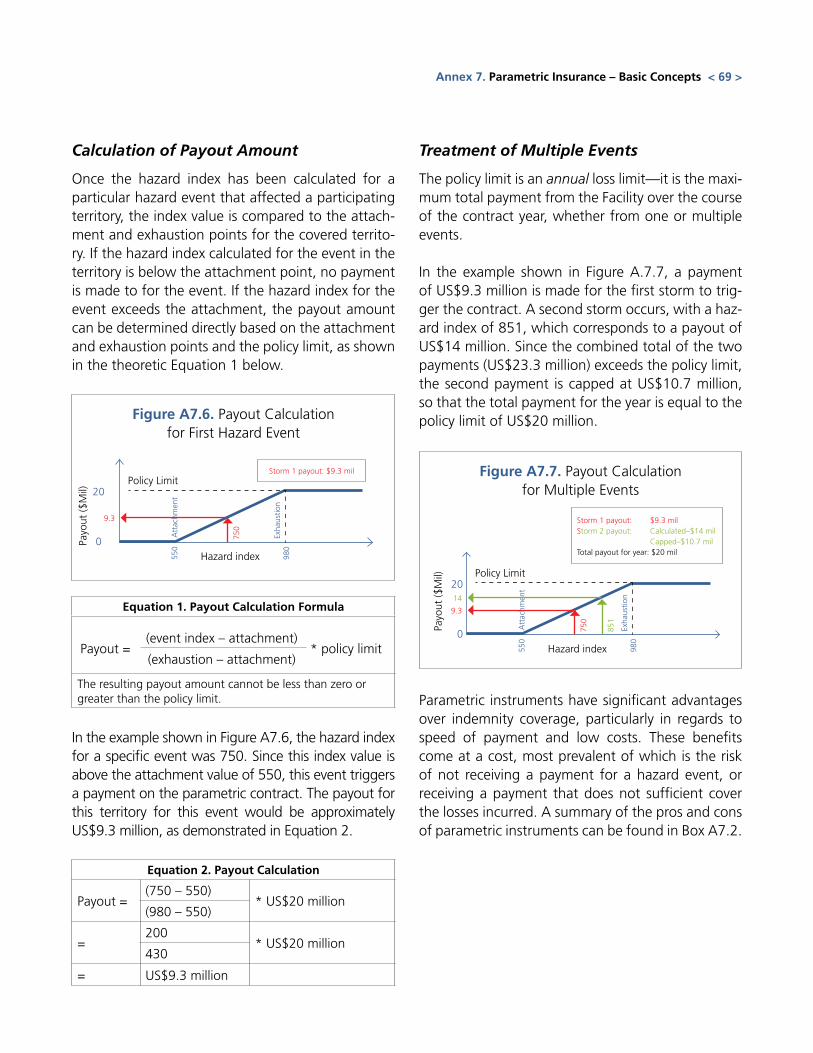
Calculation of Payout Amount
Once the hazard index has been calculated for a particular hazard event that affected a participating territory, the index value is compared to the attach-ment and exhaustion points for the covered territo-ry. If the hazard index calculated for the event in the territory is below the attachment point, no payment is made to for the event. If the hazard index for the event exceeds the attachment, the payout amount can be determined directly based on the attachment and exhaustion points and the policy limit, as shown in the theoretic Equation 1 below.
In the example shown in Figure A7.6, the hazard index for a specific event was 750. Since this index value is above the attachment value of 550, this event triggers a payment on the parametric contract. The payout for this territory for this event would be approximately US$9.3 million, as demonstrated in Equation 2.
Equation 2. Payout Calculation
Payout =(750 – 550)
* US$20 million(980 – 550)
=200
* US$20 million 430
= US$9.3 million
Treatment of Multiple Events
The policy limit is an annual loss limit—it is the maxi-mum total payment from the Facility over the course of the contract year, whether from one or multiple events.
In the example shown in Figure A.7.7, a payment of US$9.3 million is made for the first storm to trig-ger the contract. A second storm occurs, with a haz-ard index of 851, which corresponds to a payout of US$14 million. Since the combined total of the two payments (US$23.3 million) exceeds the policy limit, the second payment is capped at US$10.7 million, so that the total payment for the year is equal to the policy limit of US$20 million.
Parametric instruments have significant advantages over indemnity coverage, particularly in regards to speed of payment and low costs. These benefits come at a cost, most prevalent of which is the risk of not receiving a payment for a hazard event, or receiving a payment that does not sufficient cover the losses incurred. A summary of the pros and cons of parametric instruments can be found in Box A7.2.
Annex 7. Parametric Insurance – Basic Concepts < 69 >
Figure A7.6. Payout Calculation for First Hazard Event
Figure A7.7. Payout Calculation for Multiple Events20
20
0
0
Hazard index
Hazard index
Policy Limit
Policy Limit
Payo
ut ($
Mil)
Payo
ut ($
Mil)
550
A
ttac
hmen
t
550
A
ttac
hmen
t
980
980
750
750
851
9.3
9.3
14
Exha
ustio
n
Exha
ustio
n
Storm 1 payout: $9.3 mil
Storm 1 payout: $9.3 milStorm 2 payout: Calculated–$14 mil Capped–$10.7 milTotal payout for year: $20 mil
Payout = * policy limit(event index – attachment)
(exhaustion – attachment)
Equation 1. Payout Calculation Formula
The resulting payout amount cannot be less than zero or greater than the policy limit.
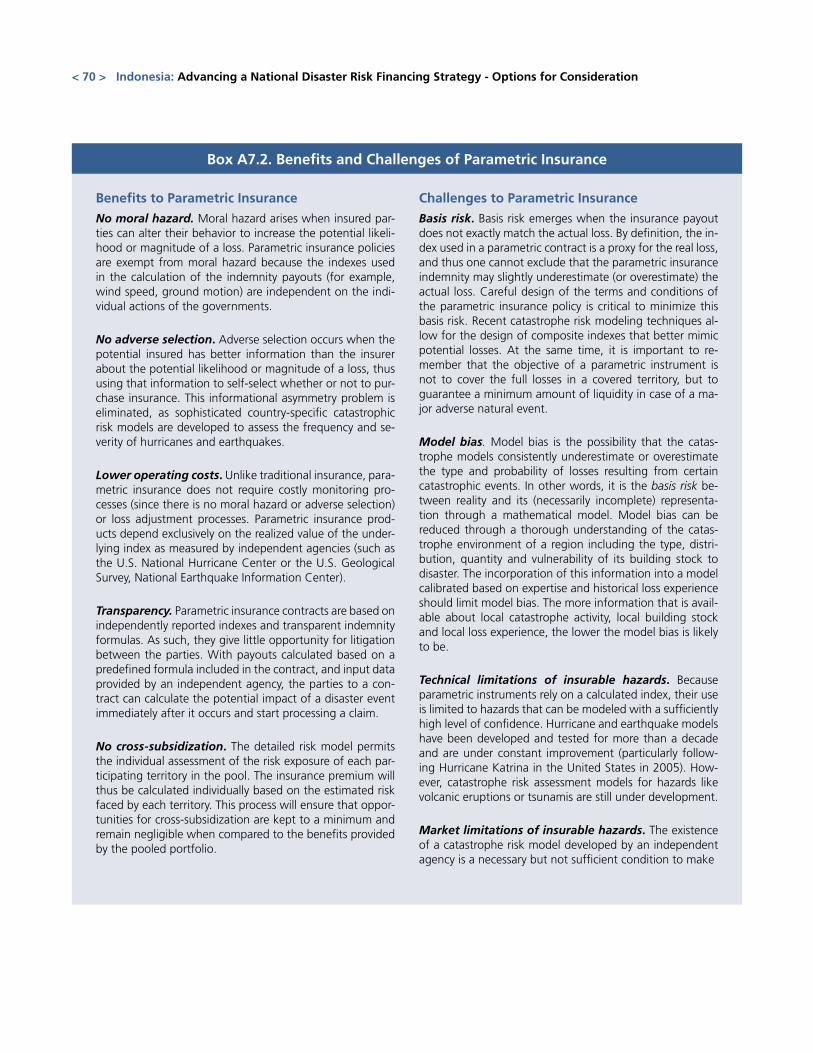
Box A7.2. Benefits and Challenges of Parametric Insurance
Benefits to Parametric Insurance
No moral hazard. Moral hazard arises when insured par-ties can alter their behavior to increase the potential likeli-hood or magnitude of a loss. Parametric insurance policies are exempt from moral hazard because the indexes used in the calculation of the indemnity payouts (for example, wind speed, ground motion) are independent on the indi-vidual actions of the governments.
No adverse selection. Adverse selection occurs when the potential insured has better information than the insurer about the potential likelihood or magnitude of a loss, thus using that information to self-select whether or not to pur-chase insurance. This informational asymmetry problem is eliminated, as sophisticated country-specific catastrophic risk models are developed to assess the frequency and se-verity of hurricanes and earthquakes.
Lower operating costs. Unlike traditional insurance, para-metric insurance does not require costly monitoring pro-cesses (since there is no moral hazard or adverse selection) or loss adjustment processes. Parametric insurance prod-ucts depend exclusively on the realized value of the under-lying index as measured by independent agencies (such as the U.S. National Hurricane Center or the U.S. Geological Survey, National Earthquake Information Center).
Transparency. Parametric insurance contracts are based on independently reported indexes and transparent indemnity formulas. As such, they give little opportunity for litigation between the parties. With payouts calculated based on a predefined formula included in the contract, and input data provided by an independent agency, the parties to a con-tract can calculate the potential impact of a disaster event immediately after it occurs and start processing a claim.
No cross-subsidization. The detailed risk model permits the individual assessment of the risk exposure of each par-ticipating territory in the pool. The insurance premium will thus be calculated individually based on the estimated risk faced by each territory. This process will ensure that oppor-tunities for cross-subsidization are kept to a minimum and remain negligible when compared to the benefits provided by the pooled portfolio.
Challenges to Parametric Insurance
Basis risk. Basis risk emerges when the insurance payout does not exactly match the actual loss. By definition, the in-dex used in a parametric contract is a proxy for the real loss, and thus one cannot exclude that the parametric insurance indemnity may slightly underestimate (or overestimate) the actual loss. Careful design of the terms and conditions of the parametric insurance policy is critical to minimize this basis risk. Recent catastrophe risk modeling techniques al-low for the design of composite indexes that better mimic potential losses. At the same time, it is important to re-member that the objective of a parametric instrument is not to cover the full losses in a covered territory, but to guarantee a minimum amount of liquidity in case of a ma-jor adverse natural event.
Model bias. Model bias is the possibility that the catas-trophe models consistently underestimate or overestimate the type and probability of losses resulting from certain catastrophic events. In other words, it is the basis risk be-tween reality and its (necessarily incomplete) representa-tion through a mathematical model. Model bias can be reduced through a thorough understanding of the catas-trophe environment of a region including the type, distri-bution, quantity and vulnerability of its building stock to disaster. The incorporation of this information into a model calibrated based on expertise and historical loss experience should limit model bias. The more information that is avail-able about local catastrophe activity, local building stock and local loss experience, the lower the model bias is likely to be.
Technical limitations of insurable hazards. Because parametric instruments rely on a calculated index, their use is limited to hazards that can be modeled with a sufficiently high level of confidence. Hurricane and earthquake models have been developed and tested for more than a decade and are under constant improvement (particularly follow-ing Hurricane Katrina in the United States in 2005). How-ever, catastrophe risk assessment models for hazards like volcanic eruptions or tsunamis are still under development.
Market limitations of insurable hazards. The existence of a catastrophe risk model developed by an independent agency is a necessary but not sufficient condition to make
< 70 > Indonesia: Advancing a National Disaster Risk Financing Strategy - Options for Consideration
Box A7.2. Benefits and Challenges of Parametric Insurance (continuation)
Benefits to Parametric Insurance
Immediate disbursement. Because no loss assessment is required, parametric contracts allow for the settlement of claims shortly after an event. It is expected that claims are settled within four weeks following a disaster, as weather/earthquake information is available on a daily basis. This rapid claim settlement is essential if the affected states are to get access to liquidity to cover emergency and early re-covery expenditures.
Reinsurance and securitization. Parametric insurance is a new type of financial product where the underlying as-set is a physical index (for example, wind speed, ground motion). Financial markets are interested in these types of products, which are uncorrelated with their asset portfolio and thus allow for further diversification. While they are sometimes reluctant to invest in insurance and reinsurance companies, because they do not fully understand the risks faced by these companies, parametric instruments are gen-erally event specific, making them more transparent and thus more attractive to investors. This facilitates the access of the capital markets through securitization (for example, index-linked securities, including catastrophe bonds).
Challenges to Parametric Insurance
this risk insurable. Financial investors generally charge an uncertainty load in the premium to accept risks that are new in the market. This uncertainty load can make the pre-mium so high, compared to the expected loss, that the risk becomes uninsurable. This is currently the case for tsunamis and volcanic eruptions.
Education. Parametric insurance is a combination of in-surance concepts and financial concepts. Education of policymakers and government agencies will be essential to ensure that the instrument is understood and used appro-priately by local authorities.
Annex 7. Parametric Insurance – Basic Concepts < 71 >
Annex 8. Mexican Natural Disaster Fund FONDEN
Mexico has a long history of, and broad exposure to, natural disasters. Located on the along the world’s “fire belt”, where 80 percent of the world’s seismic and volcanic activity takes place, Mexico is a seismi-cally active country. The country is also highly ex-posed to tropical storms and is located in one of the few regions of the world that can be affected simul-taneously by two independent cyclone regions, the North Atlantic and the North Pacific.
To address its vulnerability to adverse natural events, Mexico has developed a comprehensive institutional approach to natural disasters. The catalyst to com-prehensive disaster risk management was the Mex-ico City earthquake of 1985. The earthquake killed 6,000 people, injured 30,000 others and left a to-tal of 150,000 victims. Total direct losses exceeded US$4 billion.
Mexico established the National Civil Protection Sys-tem (SINAPROC) in 1986 as the main mechanism for interagency coordination of disaster efforts. SINAPROC is responsible for mitigating societal loss and essential functions caused by disasters. Respon-sibility for SINAPROC lies with the Interior Ministry. Also within the Ministry of the Interior, the National Center for Disaster Prevention (CENAPRED) was es-tablished. CENAPRED is an institution that bridges the gap between academic researchers and government by channeling research applications developed by university researchers to the Ministry of the Interior.
The Fund for Natural Disasters (FONDEN)
Despite developing an institutional approach to disas-ters, all levels of government in Mexico were still reg-ularly required to reallocate planed capital expendi-tures towards financing post-disaster reconstruction efforts. Budget reallocations created delays and scal-ing back of investment programs, while also slowing deployment of funds for recovery efforts. In response,
in 1994, legislation was passed to require federal, state and municipal assets to be privately insured. In 1996, the government created the Fund for Natural Disasters in the Ministry of Finance (FONDEN).
FONDEN is an instrument for the coordination of intergovernmental and inter-institutional entities to quickly provide funds in response to natural disasters. FONDEN’s main purpose is to provide immediate fi-nancial support to federal agencies and local govern-ments recovering from a disaster, and in particular for the: i) provision of relief supplies; and, ii) financing for reconstruction of public infrastructure and low in-come homes. FONDEN is also responsible for carrying out studies on risk management and contributing to the design of risk transfer instruments
Main Features of FONDEN
FONDEN was originally established as a budgetary tool to allocate funds on an annual basis to pay for expected expenditures for disaster losses. In 1999, FONDEN was modified through the establishment the FONDEN Trust Fund, a catastrophe reserve fund that accumulates the unspent disaster budget of each year.
Financial support is directed towards public infra-structure and low-income households who, due to their poverty status, require government assistance. The adverse natural events covered by the FONDEN consist of geological perils including earthquake, volcanic eruption, tsunami, landslide and hydrologi-cal perils including drought, hurricane, excess rain-fall, hail storm, flood, tornado, wildfire.
The FONDEN is based on three complementary in-struments, the Revolving Fund, the FONDEN Pro-gram and the FONDEN Trust Fund. The first provides monies for disaster relief efforts, the second supports reconstruction of infrastructure and the third man-ages Mexico’s catastrophe risk financing strategy.
< 72 > Indonesia: Advancing a National Disaster Risk Financing Strategy - Options for Consideration
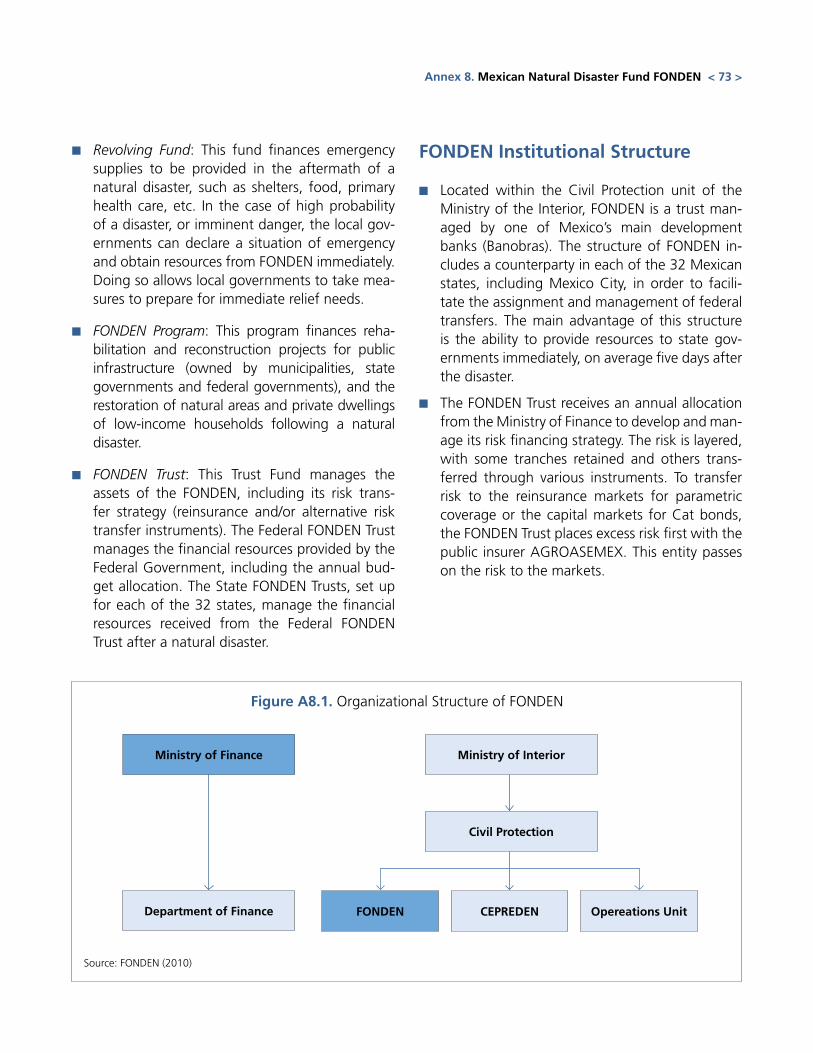
■■ Revolving Fund: This fund finances emergency supplies to be provided in the aftermath of a natural disaster, such as shelters, food, primary health care, etc. In the case of high probability of a disaster, or imminent danger, the local gov-ernments can declare a situation of emergency and obtain resources from FONDEN immediately. Doing so allows local governments to take mea-sures to prepare for immediate relief needs.
■■ FONDEN Program: This program finances reha-bilitation and reconstruction projects for public infrastructure (owned by municipalities, state governments and federal governments), and the restoration of natural areas and private dwellings of low-income households following a natural disaster.
■■ FONDEN Trust: This Trust Fund manages the assets of the FONDEN, including its risk trans-fer strategy (reinsurance and/or alternative risk transfer instruments). The Federal FONDEN Trust manages the financial resources provided by the Federal Government, including the annual bud-get allocation. The State FONDEN Trusts, set up for each of the 32 states, manage the financial resources received from the Federal FONDEN Trust after a natural disaster.
FONDEN Institutional Structure
■■ Located within the Civil Protection unit of the Ministry of the Interior, FONDEN is a trust man-aged by one of Mexico’s main development banks (Banobras). The structure of FONDEN in-cludes a counterparty in each of the 32 Mexican states, including Mexico City, in order to facili-tate the assignment and management of federal transfers. The main advantage of this structure is the ability to provide resources to state gov-ernments immediately, on average five days after the disaster.
■■ The FONDEN Trust receives an annual allocation from the Ministry of Finance to develop and man-age its risk financing strategy. The risk is layered, with some tranches retained and others trans-ferred through various instruments. To transfer risk to the reinsurance markets for parametric coverage or the capital markets for Cat bonds, the FONDEN Trust places excess risk first with the public insurer AGROASEMEX. This entity passes on the risk to the markets.
Source: FONDEN (2010)
Figure A8.1. Organizational Structure of FONDEN
Ministry of Finance Ministry of Interior
Civil Protection
FONDEN CEPREDEN Opereations UnitDepartment of Finance
Annex 8. Mexican Natural Disaster Fund FONDEN < 73 >
FONDEN Program
The purpose of this program is to provide financ-ing to state and local governments that are over-whelmed by the occurrence of a disaster. The assess-ment of losses to be co-financed by the FONDEN is based on a specific procedure involving the local and federal authorities. This procedure includes six main steps and should not exceed 23 days after occur-rence of the disaster:
1. In the aftermath of a disaster, a specialized fed-eral or state agency (e.g., meteorological depart-ment, geosciences department) certifies the oc-currence of a natural disaster and informs the State Government;
2. Within 4 days after the occurrence of a disaster, the State Government sets up a technical com-mittee to identify and assess the damage caused by the natural disaster;
3. Within 10 days, the technical committee pro-vides the State Government with a technical and financial evaluation of the natural disaster;
4. Within 15 days, the State Government informs the Federal Government. The Ministry of Interior issues a declaration of state of natural disaster. Meanwhile, the Ministry of Finance authorizes the FONDEN to release early partial contribution to the State;
5. Within the following 2 days, the Ministry of In-terior should: i) ensure that the requested assis-tance is related to the natural disaster; ii) verify that the damaged infrastructure has not ben-efited from the FONDEN in the past; if this is the case, the proof of insurance of the damage infrastructure is requested; and iii) formally ap-prove the co-financing of the reconstruction of the damaged assets.
6. The claims are authorized to be financed by the FONDEN. In case of federal assets, the Federal FONDEN Trust pays directly the contractor. In case of state of municipal assets, the Federal FONDEN Trust transfers the funds to the State
FONDEN Trust once the State Government has transferred its contribution.
FONDEN Trust
The Federal Government aims to promote the pri-vate insurance of specific public assets owned by Federal agencies and State Governments, thus re-ducing its financing dependence on the FONDEN in case of a natural disaster. The Federal Government has empowered the FONDEN to develop a catastro-phe risk financing strategy, relying on private risk transfer instruments such as reinsurance and catas-trophe bonds. This helps the FONDEN to increase its financial independence and overcome some political economy issues.
The financial structure of the FONDEN is depicted in Figure A8.2. The public bank Banogras acts as the account manager of the FONDEN Trust. The public reinsurer Agroasemex intermediates any financial transactions with the international reinsurance and capital markets.
The FONDEN Disaster Risk Financing Strategy for 2011
The disaster risk financing strategy of the FONDEN relies on a combination of risk retention and risk transfer. To execute this strategy, the FONDEN re-ceives an annual budget allocation from the Federal budget, which is sometimes complemented by an exceptional budget allocation in the case of a major disaster. In order to purchase insurance coverage the Federal law was modified to allow the FONDEN to transfer risk to the reinsurance and capital markets, with the insurance premium being defined as a ser-vice in the government budget law. The transferring of risk to the reinsurance and capital markets are intermediated by the public reinsurance company Agroasemex. Below, Figure A8.3 describes the FON-DEN’s disaster risk financing strategy for 2011.
< 74 > Indonesia: Advancing a National Disaster Risk Financing Strategy - Options for Consideration
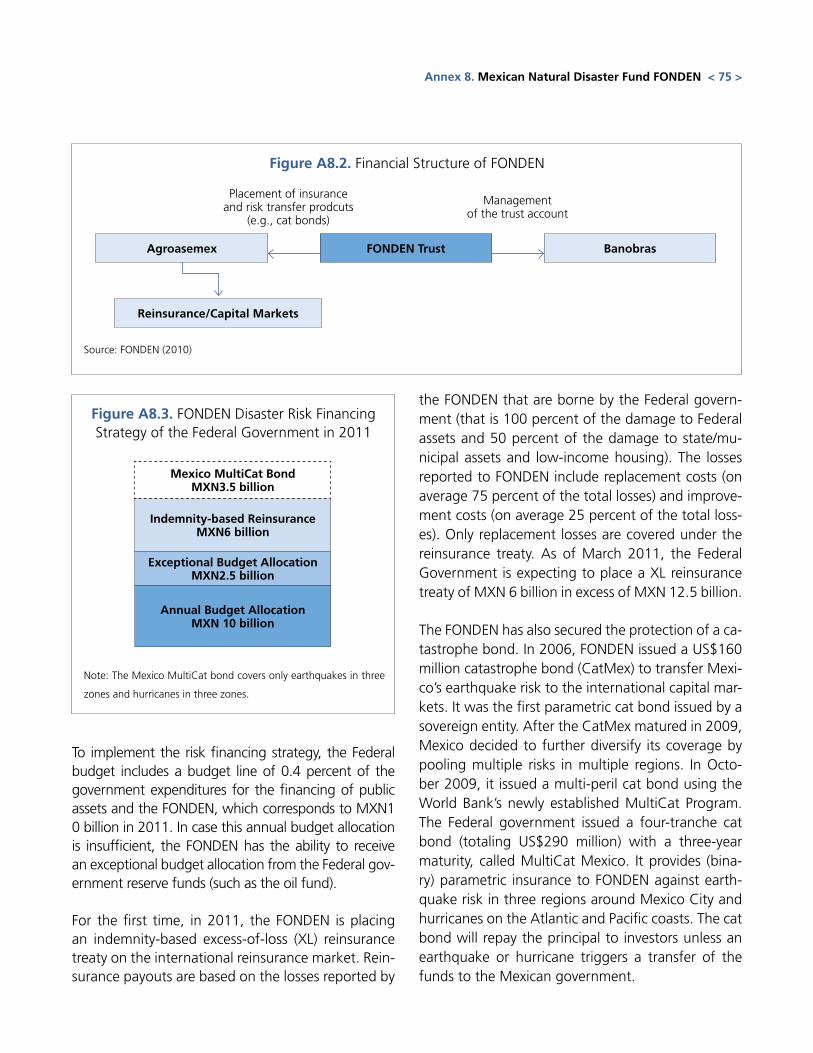
To implement the risk financing strategy, the Federal budget includes a budget line of 0.4 percent of the government expenditures for the financing of public assets and the FONDEN, which corresponds to MXN1 0 billion in 2011. In case this annual budget allocation is insufficient, the FONDEN has the ability to receive an exceptional budget allocation from the Federal gov-ernment reserve funds (such as the oil fund).
For the first time, in 2011, the FONDEN is placing an indemnity-based excess-of-loss (XL) reinsurance treaty on the international reinsurance market. Rein-surance payouts are based on the losses reported by
the FONDEN that are borne by the Federal govern-ment (that is 100 percent of the damage to Federal assets and 50 percent of the damage to state/mu-nicipal assets and low-income housing). The losses reported to FONDEN include replacement costs (on average 75 percent of the total losses) and improve-ment costs (on average 25 percent of the total loss-es). Only replacement losses are covered under the reinsurance treaty. As of March 2011, the Federal Government is expecting to place a XL reinsurance treaty of MXN 6 billion in excess of MXN 12.5 billion.
The FONDEN has also secured the protection of a ca-tastrophe bond. In 2006, FONDEN issued a US$160 million catastrophe bond (CatMex) to transfer Mexi-co’s earthquake risk to the international capital mar-kets. It was the first parametric cat bond issued by a sovereign entity. After the CatMex matured in 2009, Mexico decided to further diversify its coverage by pooling multiple risks in multiple regions. In Octo-ber 2009, it issued a multi-peril cat bond using the World Bank’s newly established MultiCat Program. The Federal government issued a four-tranche cat bond (totaling US$290 million) with a three-year maturity, called MultiCat Mexico. It provides (bina-ry) parametric insurance to FONDEN against earth-quake risk in three regions around Mexico City and hurricanes on the Atlantic and Pacific coasts. The cat bond will repay the principal to investors unless an earthquake or hurricane triggers a transfer of the funds to the Mexican government.
Source: FONDEN (2010)
Note: The Mexico MultiCat bond covers only earthquakes in three
zones and hurricanes in three zones.
Figure A8.2. Financial Structure of FONDEN
Figure A8.3. FONDEN Disaster Risk Financing Strategy of the Federal Government in 2011
Agroasemex
Placement of insurance and risk transfer prodcuts
(e.g., cat bonds)
Management of the trust account
Banobras
Reinsurance/Capital Markets
FONDEN Trust
Annual Budget AllocationMXN 10 billion
Exceptional Budget AllocationMXN2.5 billion
Indemnity-based ReinsuranceMXN6 billion
Mexico MultiCat BondMXN3.5 billion
Annex 8. Mexican Natural Disaster Fund FONDEN < 75 >
Annex 9. Catastrophe Bonds in Mexico
The FONDEN uses various instruments to support local states and entities in responding to natural disasters, including reserve funds and risk transfer solutions. In 2006, FONDEN issued a US$160 mil-lion catastrophe bond (CatMex) to transfer Mexico’s earthquake risk to the international capital markets. It was the first parametric cat bond issued by a sov-ereign.
After the CatMex matured in 2009, Mexico decided to further diversify its coverage by pooling multiple risks in multiple regions. In October 2009, it issued a multi-peril cat bond using the World Bank’s newly established MultiCat Program, which helps sover-eign and sub-sovereign entities pool multiple perils in multiple regions and reduce insurance costs.
Objective
The purpose of a MultiCat Program is to transfer di-saster-related risks, covering multiple hazards, to the capital markets in order to reduce pressure on public budgets. Doing so ensures that adequate funds are in place for relief activities.
Outcome
■■ The bond was oversubscribed, with broad distri-bution among investors. With this bond, Mexico transferred a pool of disaster risk to the market for the first time; secured multi-year protection for the covered risks at a fixed price; and reduced potential pressure on public budgets. Mexico ef-fectively locked in funding for disaster relief prior to the event happening, rather than relying only on public budgets after the event.
■■ The demonstration effect of this transaction for other emerging market countries is significant. It has paved the way for other highly exposed countries to manage fiscal volatility and stabilize government budgets by transferring extreme
natural disaster risks to capital markets, while obviating the need to build up excessive budget reserves.
Operating structure
Mexico issued a four-tranche cat bond (totaling US$290 million) with a three-year maturity under the MultiCat Program. The issuer is a Special Pur-pose Vehicle (SPV) that indirectly provides paramet-ric insurance to the FONDEN against earthquake risk in three regions around Mexico City and hurricanes on the Atlantic and Pacific coasts. The cat bond will repay the principal to investors unless an earthquake or hurricane triggers a transfer of the funds to the Mexican government.
The SPV structure is displayed in Figure A9.1 and the institutional arrangements are described below:
1. The FONDEN enters into an insurance contract with local insurance company Agroasemex.
2. Agroasemex enters into a reinsurance contract with Swiss Re to transfer all of the catastrophe risk.
3. Swiss Re enters into a derivative counterparty contract with a Cayman Islands-based special purpose vehicle (MultiCat Mexico 2009 Ltd.) to transfer the catastrophe risk.
4. The SPV issues floating rate notes (Cat Bonds) to capital markets investors to hedge its obligations to Swiss Re under the counterparty contract. The proceeds received from investors are invested in US Treasury money market funds and deposited in a collateral account.
5. A separate event payment account is established with a third party bank to allow the FONDEN to receive parametric loss payments directly from the SPV, subject to the insurance contract.
< 76 > Indonesia: Advancing a National Disaster Risk Financing Strategy - Options for Consideration
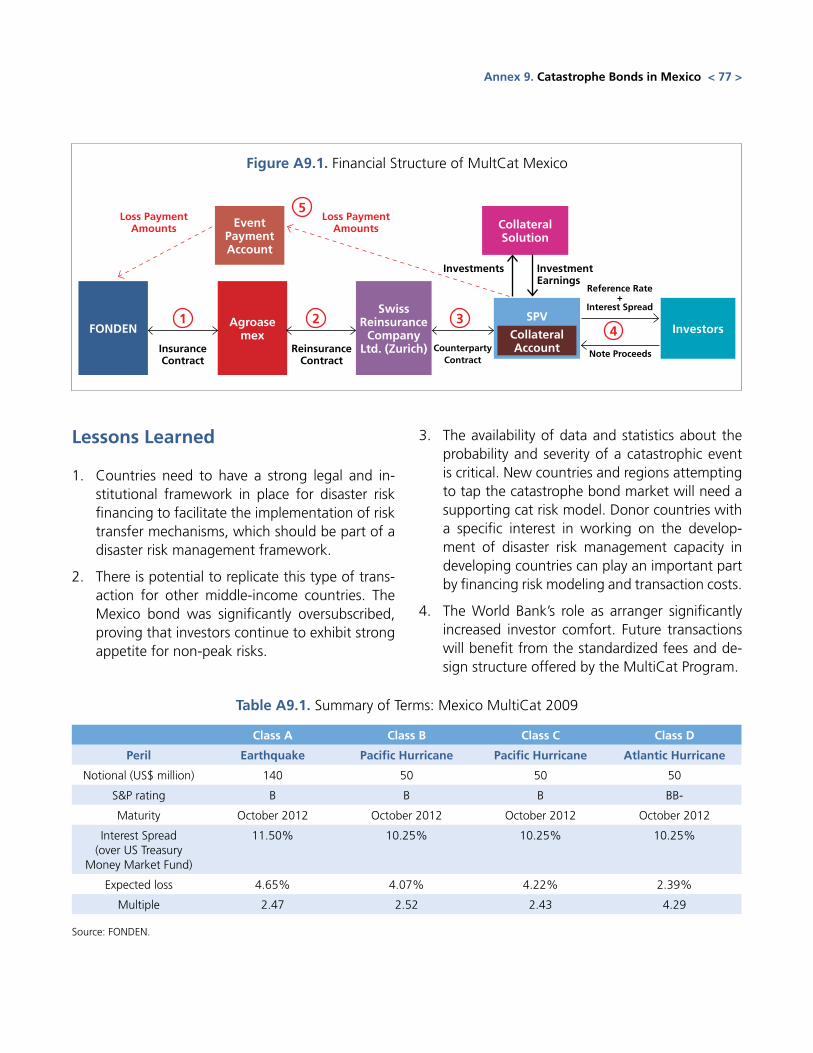
Figure A9.1. Financial Structure of MultCat Mexico
Lessons Learned
1. Countries need to have a strong legal and in-stitutional framework in place for disaster risk financing to facilitate the implementation of risk transfer mechanisms, which should be part of a disaster risk management framework.
2. There is potential to replicate this type of trans-action for other middle-income countries. The Mexico bond was significantly oversubscribed, proving that investors continue to exhibit strong appetite for non-peak risks.
3. The availability of data and statistics about the probability and severity of a catastrophic event is critical. New countries and regions attempting to tap the catastrophe bond market will need a supporting cat risk model. Donor countries with a specific interest in working on the develop-ment of disaster risk management capacity in developing countries can play an important part by financing risk modeling and transaction costs.
4. The World Bank’s role as arranger significantly increased investor comfort. Future transactions will benefit from the standardized fees and de-sign structure offered by the MultiCat Program.
Annex 9. Catastrophe Bonds in Mexico < 77 >
FONDEN
Event Payment Account
Collateral Solution
Agroase mex
SPV
Investors
Swiss Reinsurance
Company Ltd. (Zurich)
Collateral Account
Loss PaymentAmounts
InsuranceContract
ReinsuranceContract
Counterparty Contract
Note Proceeds
Reference Rate+
Interest Spread
Loss PaymentAmounts
Investments Investment Earnings
1 2 34
5
Table A9.1. Summary of Terms: Mexico MultiCat 2009
Class A Class B Class C Class D
Peril Earthquake Pacific Hurricane Pacific Hurricane Atlantic Hurricane
Notional (US$ million) 140 50 50 50
S&P rating B B B BB-
Maturity October 2012 October 2012 October 2012 October 2012
Interest Spread(over US Treasury
Money Market Fund)
11.50% 10.25% 10.25% 10.25%
Expected loss 4.65% 4.07% 4.22% 2.39%
Multiple 2.47 2.52 2.43 4.29
Source: FONDEN.
Annex 10. Caribbean Catastrophe Risk Insurance Facility
On average, one to three Caribbean countries are affected by a hurricane or an earthquake each year, although during severe hurricane seasons this num-ber can climb much higher. In 2004, the region suf-fered a disastrous hurricane season, with 15 named storms. Hurricane Ivan, the strongest storm of the season, wrought devastation on the Cayman Islands, Grenada, and Jamaica. In Grenada, 89 percent of the country’s housing stock and more than 80 per-cent of its public and commercial building structures sustained damage. The damage was estimated at over US$800 million, or approximately 200 percent of Grenada’s GDP. The Heads of Government of the CARICOM were compelled by their experiences dur-ing this catastrophic season to ask for World Bank assistance in improving access to catastrophe risk insurance.
Objectives
The main objective of the CCRIF is to provide its members with access to affordable and effective coverage against natural disasters. For a number of reasons, small island states have difficulty absorbing the financial impacts of disasters, including: i) lim-ited budgetary capacity prevents them from estab-lishing sufficient financial reserves; ii) cross-regional subsidization of recovery efforts is generally impos-sible due to their limited size and economic diversifi-cation; iii) high debt levels limit their access to credit after disasters; and, iv) limited access to catastrophe insurance due to the high transaction costs resulting from the relatively small level of business brought into these markets.
CCRIF enables countries to pool their individual risks into a single, better diversified, joint reserve mecha-nism. Through risk pooling, CCRIF provides coverage to countries at a significantly lower cost than individ-ual governments would incur if they had to maintain their own reserves or if they were to independently purchase insurance in the open market.
Structure and Description
The CCRIF functions as a mutual insurance company controlled by participating governments. It was ini-tially capitalized by the participating countries, with support from donor partners. CCRIF helps Carib-bean countries lower the cost of insurance by pool-ing risks. A portion of the pooled risks is retained through reserves, which reduces the cost of insur-ance premiums. The CCRIF transfers the risks it can-not retain by purchasing reinsurance and catastro-phe swaps.
The coverage provided by the Facility is parametric in nature. Unlike traditional insurance settlements that require an assessment of individual losses on the ground, parametric insurance relies on a pay-out disbursement contingent on the intensity of an event (e.g., wind speed, ground acceleration). In the case of CCRIF, payouts are proportional to the esti-mated impact of an event on each country’s budget. The estimated impact is derived from a probabilistic catastrophe risk model developed specifically for the Facility.
Insured countries pay an annual premium commen-surate with their own specific risk exposure and re-ceive compensation based on the level of coverage agreed upon in the insurance contract upon the oc-currence of a triggering event.
Outcome
CCRIF is the first-ever multi-country risk pool. Six-teen Caribbean countries joined in 2007 and have renewed their policies each year since. Seven pay-outs have been made to date (see below for CCRIF members and payouts). The CCRIF has been well received by the reinsurance market, which has pro-vided capacity at a low rate to the Facility. A US$20 million cat swap between IBRD and CCRIF was the first derivative transaction to enable emerging coun-
< 78 > Indonesia: Advancing a National Disaster Risk Financing Strategy - Options for Consideration
tries to access the capital market to insure against natural disasters.
Lessons Learned
1. The CCRIF addresses one disaster risk financing need of small island states: access to immediate liquidity in the aftermath of a disaster. The CCRIF does not cover all losses that a country may incur, in-stead it covers estimated liquidity needs for the first three to six months after a major catastrophe. When designing a disaster risk financing strategy, it is im-portant to understand that each country requires a tailored combination of disaster risk financing tools. There is neither a “one size fits all” strategy nor a “silver bullet” disaster risk financing tool.
2. A critical mass of country participation in CCRIF is required for the Facility to benefit from risk pooling and diversification. In order for Caribbean countries to benefit from diversification through risk pooling
(e.g., joint reserves and improved reinsurance rates), enough countries must participate in the Facility. Furthermore, the CCRIF carries administrative costs that are shared by participants; a significant number of participants are required to maintain an afford-able average administrative cost per country.
3. Dialogue on risk financing can enhance discus-sions with decision makers on more comprehensive disaster risk management. Risk modeling developed for risk financing products can provide useful infor-mation on the risk exposure of the analyzed econo-my. This information and related dialogue on finan-cial protection can help sensitize decision makers to the need for more comprehensive strategies to deal with increasing losses from adverse natural events, including actions to try to avoid the creation of new risks (e.g., territorial planning, building standards) and to reduce existing risks (e.g., protective mea-sures, strengthening of infrastructure).
CCRIF Member Countries
Anguilla Grenada
Antigua and Barbuda Haiti
Bahamas Jamaica
Barbados St. Kitts and Nevis
Belize St. Lucia
Bermuda St. Vincent & the Grenadines
Cayman Islands Trinidad & Tobago
Dominica Turks & Caicos Islands
Payouts to Date (USD in Millions)
8.5 to Barbados (2010)
3.2 to St. Lucia (2010)
1.1 to St. Vincent & the Grenadines (2010)
4.2 to Anguilla (2010)
7.8 to Haiti (2010)
6.3 to Turks & Caicos Islands (20108)
1 to Dominica (2007)
1 to St. Lucia (2007)
Annex 10. Caribbean Catastrophe Risk Insurance Facility < 79 >
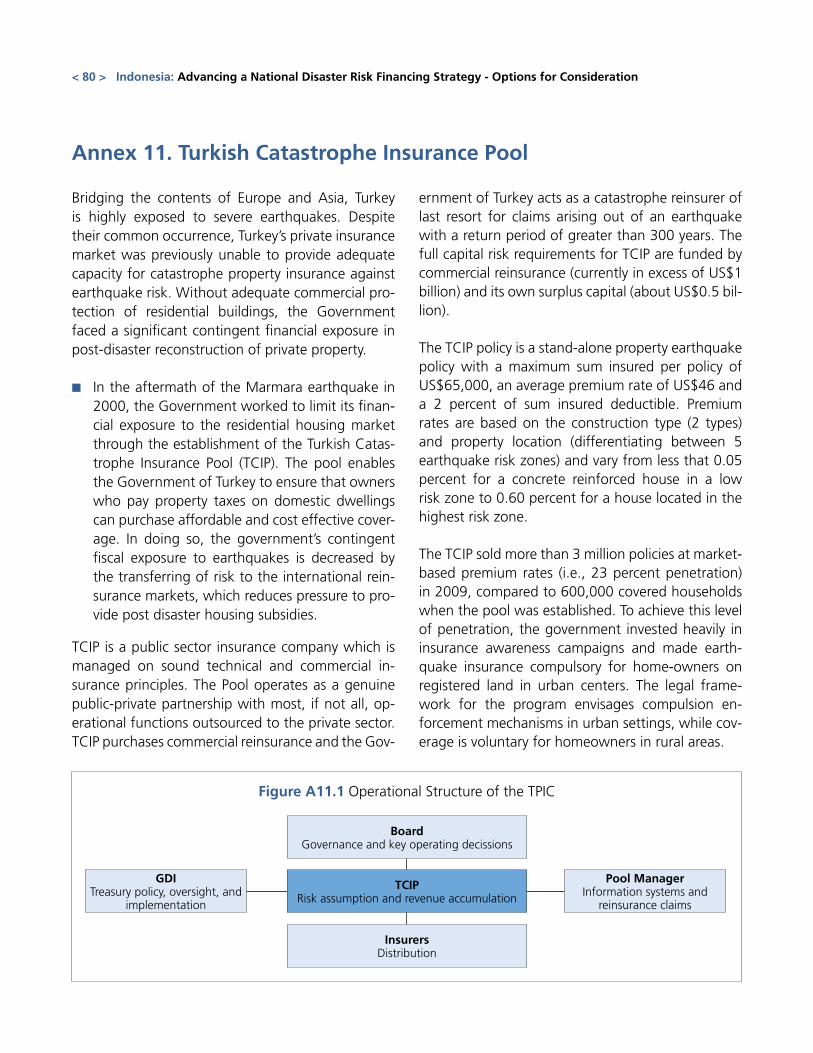
Annex 11. Turkish Catastrophe Insurance Pool
Bridging the contents of Europe and Asia, Turkey is highly exposed to severe earthquakes. Despite their common occurrence, Turkey’s private insurance market was previously unable to provide adequate capacity for catastrophe property insurance against earthquake risk. Without adequate commercial pro-tection of residential buildings, the Government faced a significant contingent financial exposure in post-disaster reconstruction of private property.
■■ In the aftermath of the Marmara earthquake in 2000, the Government worked to limit its finan-cial exposure to the residential housing market through the establishment of the Turkish Catas-trophe Insurance Pool (TCIP). The pool enables the Government of Turkey to ensure that owners who pay property taxes on domestic dwellings can purchase affordable and cost effective cover-age. In doing so, the government’s contingent fiscal exposure to earthquakes is decreased by the transferring of risk to the international rein-surance markets, which reduces pressure to pro-vide post disaster housing subsidies.
TCIP is a public sector insurance company which is managed on sound technical and commercial in-surance principles. The Pool operates as a genuine public-private partnership with most, if not all, op-erational functions outsourced to the private sector. TCIP purchases commercial reinsurance and the Gov-
ernment of Turkey acts as a catastrophe reinsurer of last resort for claims arising out of an earthquake with a return period of greater than 300 years. The full capital risk requirements for TCIP are funded by commercial reinsurance (currently in excess of US$1 billion) and its own surplus capital (about US$0.5 bil-lion).
The TCIP policy is a stand-alone property earthquake policy with a maximum sum insured per policy of US$65,000, an average premium rate of US$46 and a 2 percent of sum insured deductible. Premium rates are based on the construction type (2 types) and property location (differentiating between 5 earthquake risk zones) and vary from less that 0.05 percent for a concrete reinforced house in a low risk zone to 0.60 percent for a house located in the highest risk zone.
The TCIP sold more than 3 million policies at market-based premium rates (i.e., 23 percent penetration) in 2009, compared to 600,000 covered households when the pool was established. To achieve this level of penetration, the government invested heavily in insurance awareness campaigns and made earth-quake insurance compulsory for home-owners on registered land in urban centers. The legal frame-work for the program envisages compulsion en-forcement mechanisms in urban settings, while cov-erage is voluntary for homeowners in rural areas.
Figure A11.1 Operational Structure of the TPIC
< 80 > Indonesia: Advancing a National Disaster Risk Financing Strategy - Options for Consideration
BoardGovernance and key operating decissions
TCIPRisk assumption and revenue accumulation
GDITreasury policy, oversight, and
implementation
Pool ManagerInformation systems and
reinsurance claims
InsurersDistribution
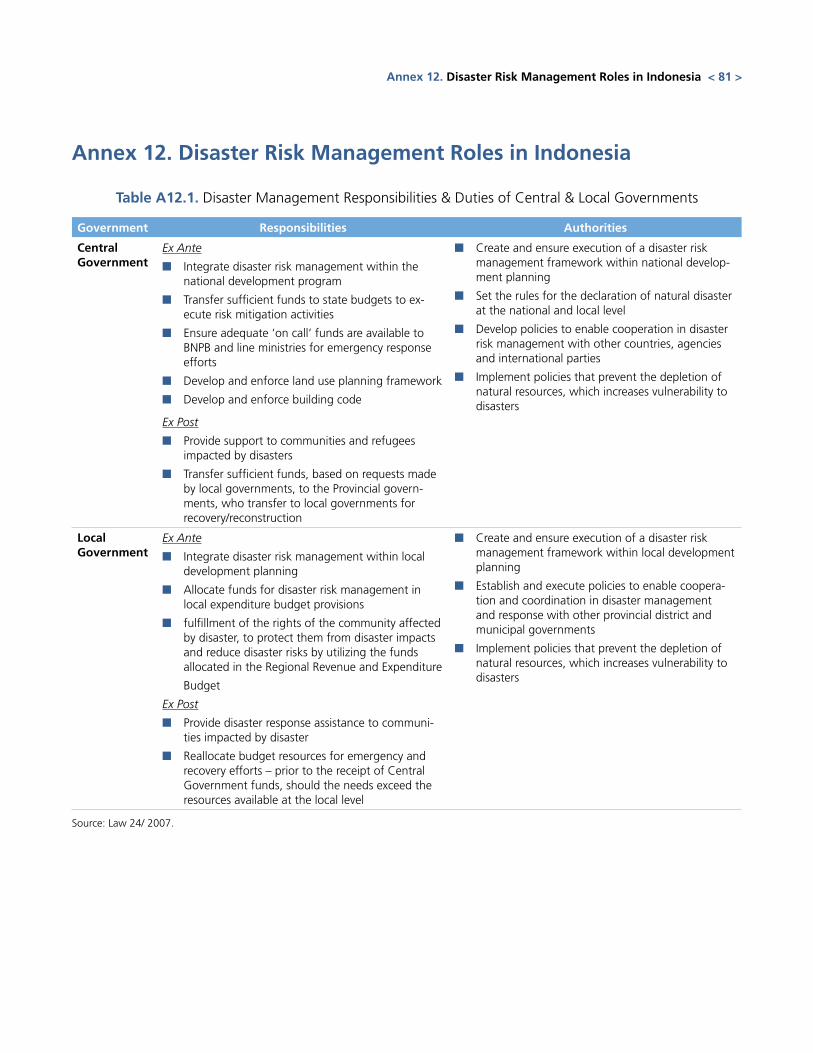
Annex 12. Disaster Risk Management Roles in Indonesia
Annex 12. Disaster Risk Management Roles in Indonesia < 81 >
Table A12.1. Disaster Management Responsibilities & Duties of Central & Local Governments
Government Responsibilities Authorities
Central Government
Ex Ante
■■ Integrate disaster risk management within the national development program
■■ Transfer sufficient funds to state budgets to ex-ecute risk mitigation activities
■■ Ensure adequate ‘on call’ funds are available to BNPB and line ministries for emergency response efforts
■■ Develop and enforce land use planning framework
■■ Develop and enforce building code
Ex Post
■■ Provide support to communities and refugees impacted by disasters
■■ Transfer sufficient funds, based on requests made by local governments, to the Provincial govern-ments, who transfer to local governments for recovery/reconstruction
■■ Create and ensure execution of a disaster risk management framework within national develop-ment planning
■■ Set the rules for the declaration of natural disaster at the national and local level
■■ Develop policies to enable cooperation in disaster risk management with other countries, agencies and international parties
■■ Implement policies that prevent the depletion of natural resources, which increases vulnerability to disasters
Local Government
Ex Ante
■■ Integrate disaster risk management within local development planning
■■ Allocate funds for disaster risk management in local expenditure budget provisions
■■ fulfillment of the rights of the community affected by disaster, to protect them from disaster impacts and reduce disaster risks by utilizing the funds allocated in the Regional Revenue and Expenditure
Budget
Ex Post
■■ Provide disaster response assistance to communi-ties impacted by disaster
■■ Reallocate budget resources for emergency and recovery efforts – prior to the receipt of Central Government funds, should the needs exceed the resources available at the local level
■■ Create and ensure execution of a disaster risk management framework within local development planning
■■ Establish and execute policies to enable coopera-tion and coordination in disaster management and response with other provincial district and municipal governments
■■ Implement policies that prevent the depletion of natural resources, which increases vulnerability to disasters
Source: Law 24/ 2007.

Table A12.2. Role of National and Regional Disaster Management Agencies
Institution Responsibilities Duties
National Disaster Management AgencyBNPB24
Ex Ante
■■ Create and implement a disaster risk manage-ment framework within national development program
• RiskIdentification
• Vulnerabilitymapping
• Potentialdisasterimpactassessment
• Earlywarningsystems
• Communityoutreach/awareness
■■ Coordinate disaster risk management activities
■■ Deliver research, education and training
■■ Develop an Early Warning System
■■ Encourage community participation
Ex Post
■■ Support communities impacted by disasters through coordination of recovery efforts
■■ Provide guidance and direction on disaster reduction efforts, including: disaster mitigation emergency response; rehabilitation; and, recon-struction
■■ Disseminate disaster risk management informa-tion to local communities
■■ Report status of disaster risk management efforts to the President on a monthly basis during normal times and at all times during emergencies
■■ Execute and account for disaster recovery and reconstruction donations and other international assistance
■■ Report on use of funds received from the national budget
■■ Develop guidelines for the establishment of regional disaster management agencies
Regional Disaster ManagementAgencyBPBD
Ex Ante
■■ Create and implement a disaster risk manage-ment framework within national development program
• RiskIdentification
• Vulnerabilitymapping
• Potentialdisasterimpactassessment
• Earlywarningsystems
• Communityoutreach/awareness
■■ Coordinate disaster risk management activities
■■ Encourage community participationEx Post
■■ Support communities impacted by disasters through coordination of recovery efforts
■■ Provide guidance and direction on disaster relief efforts, including disaster prevention, emergency response, rehabilitation, and reconstruction in accordance with local government policies and National Disaster Management Agency
■■ Collect data and develop risk maps for disaster prone areas to inform local development
■■ Create and implement operational procedures for disaster management
■■ Report status of disaster risk management efforts to the Regional Head on a monthly basis dur-ing normal conditions and at all times during emergencies
■■ Manage collection and disbursement of money and goods to disaster affected populations
■■ Report on the use of budget revenues received from local expenditure budget
Source: Law 24/ 2007.
25 The National Disaster Management Agency is a minister-level non-departmental Government Institution.
< 82 > Indonesia: Advancing a National Disaster Risk Financing Strategy - Options for Consideration
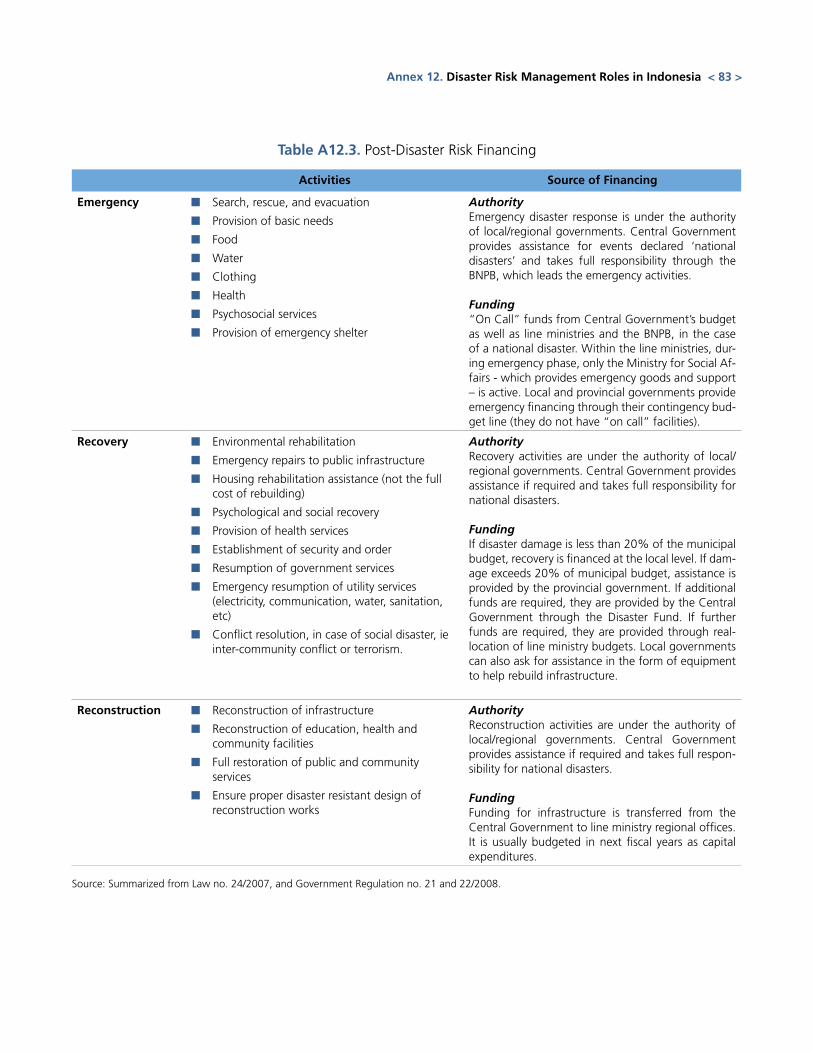
Table A12.3. Post-Disaster Risk Financing
Activities Source of Financing
Emergency ■■ Search, rescue, and evacuation
■■ Provision of basic needs
■■ Food
■■ Water
■■ Clothing
■■ Health
■■ Psychosocial services
■■ Provision of emergency shelter
Authority Emergency disaster response is under the authority of local/regional governments. Central Government provides assistance for events declared ‘national disasters’ and takes full responsibility through the BNPB, which leads the emergency activities.
Funding“On Call” funds from Central Government’s budget as well as line ministries and the BNPB, in the case of a national disaster. Within the line ministries, dur-ing emergency phase, only the Ministry for Social Af-fairs - which provides emergency goods and support – is active. Local and provincial governments provide emergency financing through their contingency bud-get line (they do not have “on call” facilities).
Recovery ■■ Environmental rehabilitation
■■ Emergency repairs to public infrastructure
■■ Housing rehabilitation assistance (not the full cost of rebuilding)
■■ Psychological and social recovery
■■ Provision of health services
■■ Establishment of security and order
■■ Resumption of government services
■■ Emergency resumption of utility services (electricity, communication, water, sanitation, etc)
■■ Conflict resolution, in case of social disaster, ie inter-community conflict or terrorism.
AuthorityRecovery activities are under the authority of local/regional governments. Central Government provides assistance if required and takes full responsibility for national disasters.
FundingIf disaster damage is less than 20% of the municipal budget, recovery is financed at the local level. If dam-age exceeds 20% of municipal budget, assistance is provided by the provincial government. If additional funds are required, they are provided by the Central Government through the Disaster Fund. If further funds are required, they are provided through real-location of line ministry budgets. Local governments can also ask for assistance in the form of equipment to help rebuild infrastructure.
Reconstruction ■■ Reconstruction of infrastructure
■■ Reconstruction of education, health and community facilities
■■ Full restoration of public and community services
■■ Ensure proper disaster resistant design of reconstruction works
AuthorityReconstruction activities are under the authority of local/regional governments. Central Government provides assistance if required and takes full respon-sibility for national disasters.
Funding Funding for infrastructure is transferred from the Central Government to line ministry regional offices. It is usually budgeted in next fiscal years as capital expenditures.
Source: Summarized from Law no. 24/2007, and Government Regulation no. 21 and 22/2008.
Annex 12. Disaster Risk Management Roles in Indonesia < 83 >
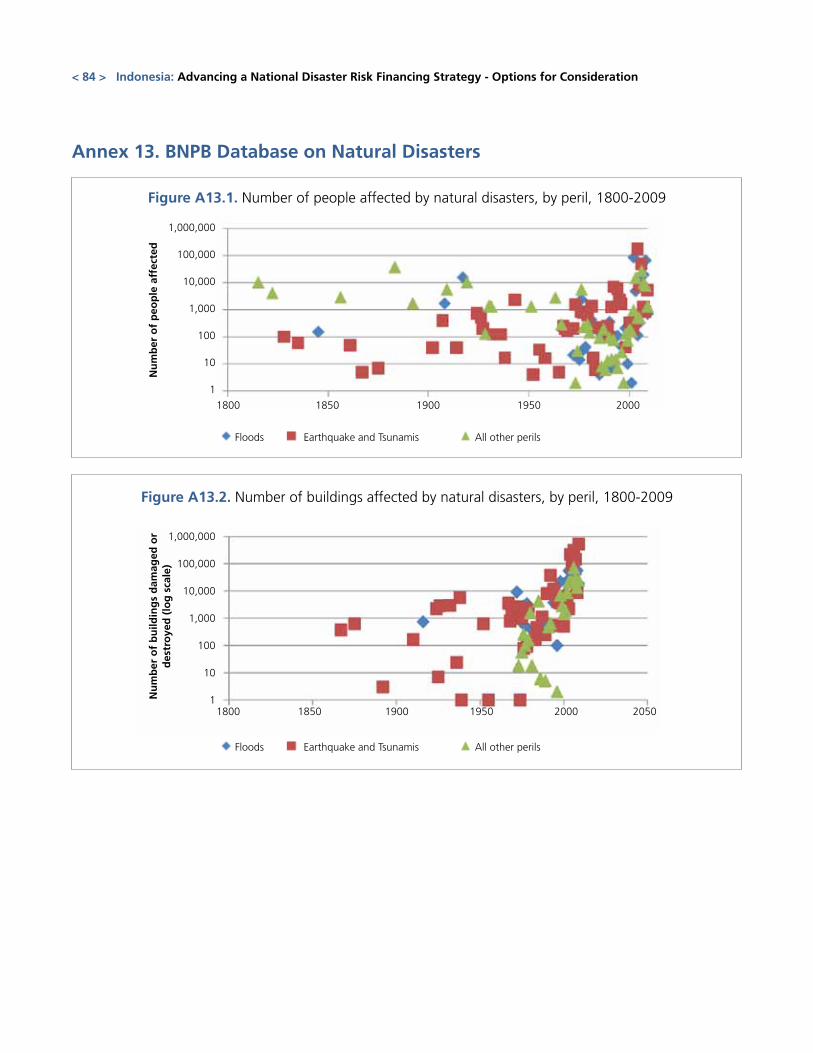
Annex 13. BNPB Database on Natural Disasters
Figure A13.1. Number of people affected by natural disasters, by peril, 1800-2009
Figure A13.2. Number of buildings affected by natural disasters, by peril, 1800-2009
Floods
1,000,000
100,000
10,000
1,000
100
10
1
Nu
mb
er o
f p
eop
le a
ffec
ted
1800 1850 1900 1950 2000
All other perilsEarthquake and Tsunamis
1,000,000
100,000
10,000
1,000
100
10
1Nu
mb
er o
f b
uild
ing
s d
amag
ed o
r d
estr
oye
d (
log
sca
le)
1800 1850 1900 1950 2000 2050
Floods All other perilsEarthquake and Tsunamis
< 84 > Indonesia: Advancing a National Disaster Risk Financing Strategy - Options for Consideration
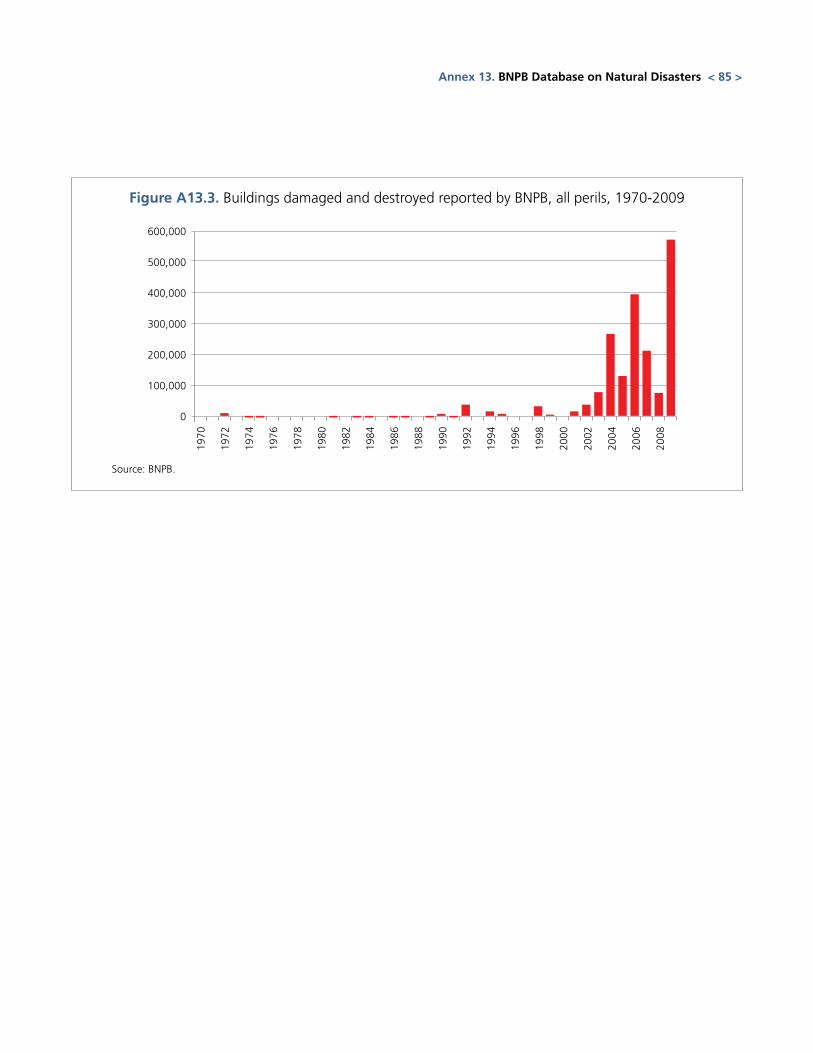
Figure A13.3. Buildings damaged and destroyed reported by BNPB, all perils, 1970-2009
Source: BNPB.
600,000
500,000
400,000
300,000
200,000
100,000
0
1970
1978
1986
1994
2002
1974
1982
1990
1998
2006
1972
1980
1988
1996
2004
1976
1984
1992
2000
2008
Annex 13. BNPB Database on Natural Disasters < 85 >
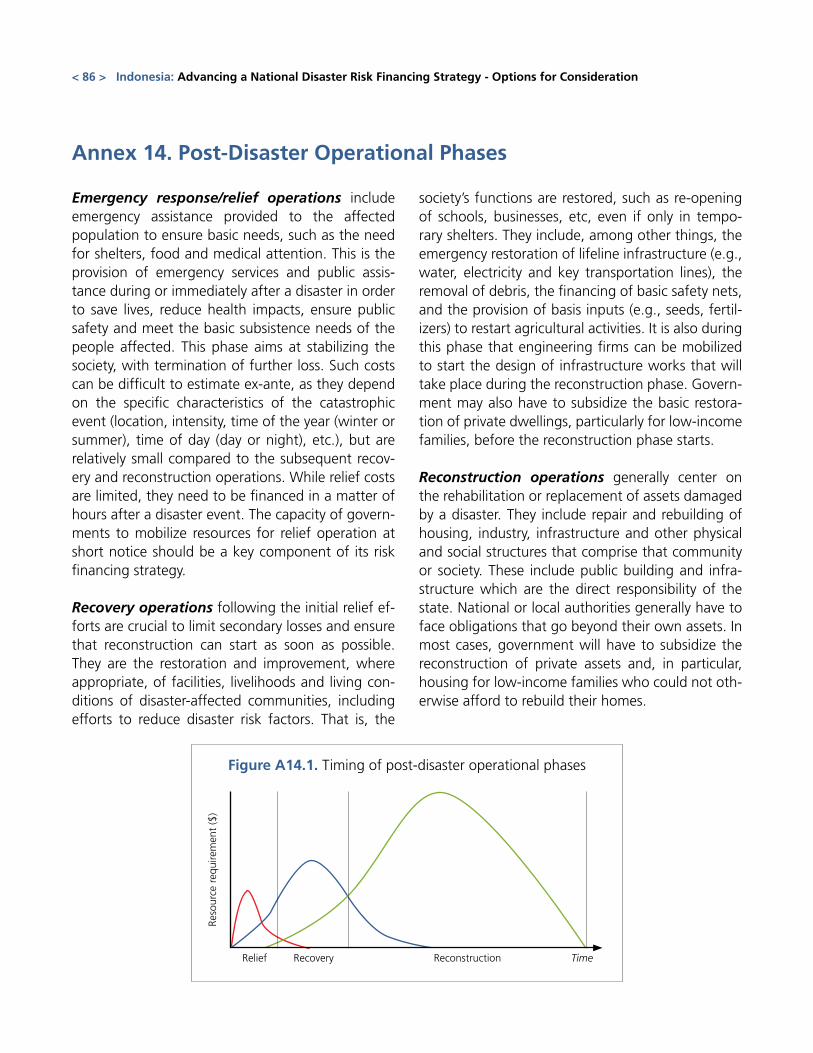
Annex 14. Post-Disaster Operational Phases
< 86 > Indonesia: Advancing a National Disaster Risk Financing Strategy - Options for Consideration
Emergency response/relief operations include emergency assistance provided to the affected population to ensure basic needs, such as the need for shelters, food and medical attention. This is the provision of emergency services and public assis-tance during or immediately after a disaster in order to save lives, reduce health impacts, ensure public safety and meet the basic subsistence needs of the people affected. This phase aims at stabilizing the society, with termination of further loss. Such costs can be difficult to estimate ex-ante, as they depend on the specific characteristics of the catastrophic event (location, intensity, time of the year (winter or summer), time of day (day or night), etc.), but are relatively small compared to the subsequent recov-ery and reconstruction operations. While relief costs are limited, they need to be financed in a matter of hours after a disaster event. The capacity of govern-ments to mobilize resources for relief operation at short notice should be a key component of its risk financing strategy.
Recovery operations following the initial relief ef-forts are crucial to limit secondary losses and ensure that reconstruction can start as soon as possible. They are the restoration and improvement, where appropriate, of facilities, livelihoods and living con-ditions of disaster-affected communities, including efforts to reduce disaster risk factors. That is, the
society’s functions are restored, such as re-opening of schools, businesses, etc, even if only in tempo-rary shelters. They include, among other things, the emergency restoration of lifeline infrastructure (e.g., water, electricity and key transportation lines), the removal of debris, the financing of basic safety nets, and the provision of basis inputs (e.g., seeds, fertil-izers) to restart agricultural activities. It is also during this phase that engineering firms can be mobilized to start the design of infrastructure works that will take place during the reconstruction phase. Govern-ment may also have to subsidize the basic restora-tion of private dwellings, particularly for low-income families, before the reconstruction phase starts.
Reconstruction operations generally center on the rehabilitation or replacement of assets damaged by a disaster. They include repair and rebuilding of housing, industry, infrastructure and other physical and social structures that comprise that community or society. These include public building and infra-structure which are the direct responsibility of the state. National or local authorities generally have to face obligations that go beyond their own assets. In most cases, government will have to subsidize the reconstruction of private assets and, in particular, housing for low-income families who could not oth-erwise afford to rebuild their homes.
Figure A14.1. Timing of post-disaster operational phases
Relief
Reso
urce
req
uire
men
t ($
)
TimeRecovery Reconstruction
Annex 15. Disaster Risk Management Framework in Indonesia
Law 24/2007 provides a comprehensive framework for the implementation of disaster risk management ac-tivities in Indonesia, defining roles and responsibilities, institutional relationships, and funding guidelines. The Law provides clear definition of the government’s responsibility to allocate sufficient funds and, in particular, the allocation of on-call funds for emergency response. Law 27/2007 only provides the principles of funding allocation for disaster management in Indonesia, which includes:
a. The definitions of responsibility for national, provincial and local governments for the allocation of suf-ficient funding for disaster management and emergency response in national and local budgets (APBN and APBD), as stipulated in Articles 6 (e and f) and 8 (d);
b. The importance of public participation in funding provisions, as stipulated in Article 60 (2);
c. The requirement that national, provincial and local governments allocate sufficient funds to cover their respective areas of responsibility, as stipulated in Article 61;
d. The directive that during emergency response, BNBP can use ready to use funds (also known as ‘on-call’) that are allocated in BNPB’s annual budget, as stipulated in Article 62; and,
e. The statement that further details on the management of disaster funding should be included in a gov-ernment regulation, as stipulated in Article 63.
Government Regulation 22/2008 on Funding and Management of Disaster Assistance was enacted the fol-lowing year to provide more detailed guidance on the Disaster Management Fund. The Disaster Risk Man-agement Fund was allocated IDR 3.8 trillion in 2010 and IDR 4 trillion in 2011. This regulation defines the uses of the Disaster Management Fund, which comprises three financing vehicles, including: i) a contingency fund for disaster preparedness and mitigation activities; ii) a ready fund (known as ‘on call’ funds) to be used in emergency response; and iii) grant patterned social assistance funds to be used for livelihood recovery and reconstruction of critical public services. The majority of these resources are earmarked for the grant pat-terned social assistance fund, which provides monies to households impacted by disasters.
Figure A15.1 below shows the schematic diagram of articles in the Law 24/2007 and Government Regulation 22/2008 that govern existing disaster funding mechanisms. Law 24/2007 establishes overall guidelines on a comprehensive disaster risk management strategy while Government Regulation 22/2008 governs the Di-saster Management Fund. The GR22/2008 leaves room for additions to the Disaster Management Fund that would enable the Government to enter contingent financing agreements and purchase disaster risk transfer mechanisms such as parametric insurance, CAT bonds and Alternative Risk Transfer Vehicles. Opportunities to incorporate a comprehensive disaster risk financing strategy are proposed in Figure A15.1.
Annex 15. Disaster Risk Management Framework in Indonesia < 87 >
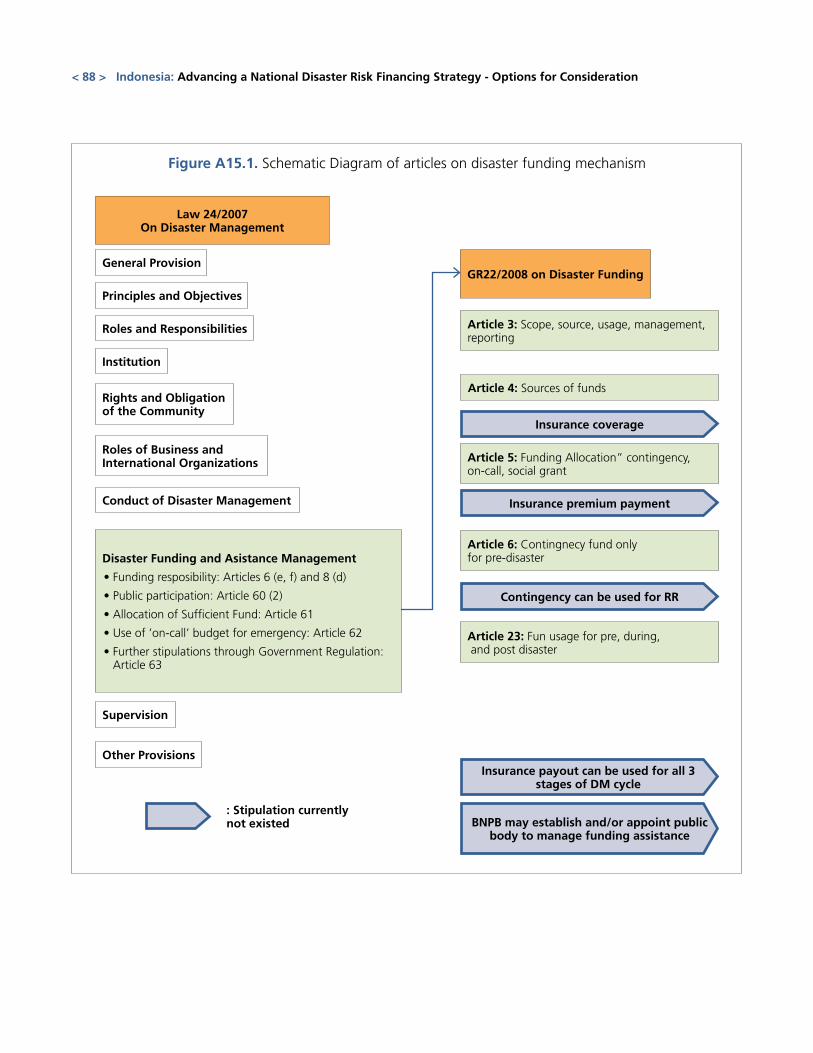
Figure A15.1. Schematic Diagram of articles on disaster funding mechanism
General Provision
Principles and Objectives
Roles and Responsibilities
Article 4: Sources of funds
Institution
Conduct of Disaster Management
Supervision
Other Provisions
: Stipulation currently not existed
Insurance coverage
Contingency can be used for RR
Insurance payout can be used for all 3 stages of DM cycle
BNPB may establish and/or appoint public body to manage funding assistance
Insurance premium payment
Rights and Obligation of the Community
Article 3: Scope, source, usage, management, reporting
Article 5: Funding Allocation” contingency, on-call, social grant
Article 23: Fun usage for pre, during, and post disaster
Article 6: Contingnecy fund only for pre-disaster
Roles of Business and International Organizations
Law 24/2007On Disaster Management
GR22/2008 on Disaster Funding
< 88 > Indonesia: Advancing a National Disaster Risk Financing Strategy - Options for Consideration
Disaster Funding and Asistance Management
•Fundingresposibility:Articles6(e,f)and8(d)
•Publicparticipation:Article60(2)
•AllocationofSufficientFund:Article61
•Useof’on-call’budgetforemergency:Article62
•FurtherstipulationsthroughGovernmentRegulation:Article 63
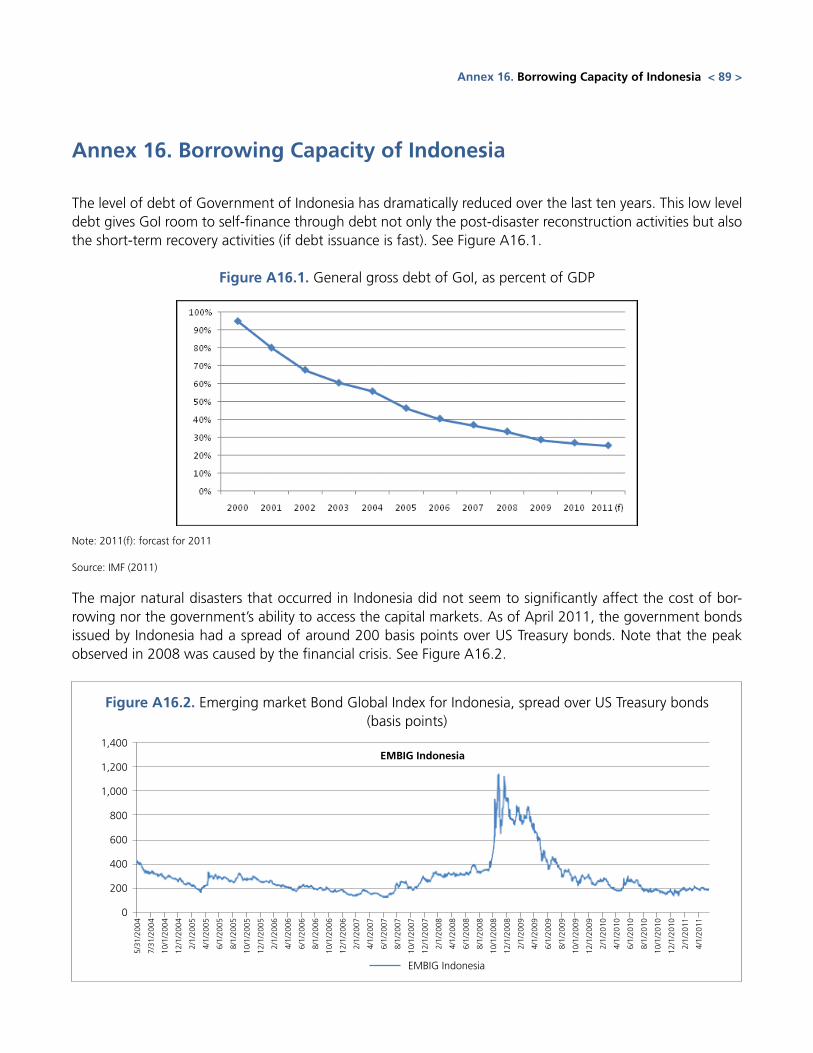
Annex 16. Borrowing Capacity of Indonesia
The level of debt of Government of Indonesia has dramatically reduced over the last ten years. This low level debt gives GoI room to self-finance through debt not only the post-disaster reconstruction activities but also the short-term recovery activities (if debt issuance is fast). See Figure A16.1.
Figure A16.1. General gross debt of GoI, as percent of GDP
Note: 2011(f): forcast for 2011
Source: IMF (2011)
The major natural disasters that occurred in Indonesia did not seem to significantly affect the cost of bor-rowing nor the government’s ability to access the capital markets. As of April 2011, the government bonds issued by Indonesia had a spread of around 200 basis points over US Treasury bonds. Note that the peak observed in 2008 was caused by the financial crisis. See Figure A16.2.
Figure A16.2. Emerging market Bond Global Index for Indonesia, spread over US Treasury bonds (basis points)
5/31
/200
4
10/1
/200
5
2/1/
2007
6/1/
2008
10/1
/200
9
2/1/
2005
6/1/
2006
10/1
/200
7
2/1/
2009
6/1/
2010
10/1
/200
4
2/1/
2006
6/1/
2007
10/1
/200
8
2/1/
2010
6/1/
2005
10/1
/200
6
2/1/
2008
6/1/
2009
10/1
/201
0
2/1/
2011
7/31
/200
4
12/1
/200
5
4/1/
2007
8/1/
2008
12/1
/200
9
4/1/
2005
8/1/
2006
12/1
/200
7
4/1/
2009
8/1/
2010
12/1
/200
4
4/1/
2006
8/1/
2007
12/1
/200
8
4/1/
2010
8/1/
2005
12/1
/200
6
4/1/
2008
8/1/
2009
12/1
/201
0
4/1/
2011
1,400
1,200
1,000
800
600
400
200
0
EMBIG Indonesia
EMBIG Indonesia
Annex 16. Borrowing Capacity of Indonesia < 89 >


Global Facility for Disaster Reduction and Recovery
1818 H Street, NWWashington, DC 20433, USA
Telephone: 202-458-0268E-mail: [email protected]: 202-522-3227
Special thanks and appreciation are extended to the partners who support GFDRR’s work to protect livelihood and improve lives: ACP Secretariat, Arab Academy for Science, Technology and Maritime Transport, Australia, Bangladesh, Belgium, Brazil, Canada, China, Colombia, Denmark, Egypt, European Commission, Finland, France, Germany, Haiti, India, Indonesia, International Federation of Red Cross and Red Crescent Societies, Ireland, Islamic Development Bank, Italy, Japan, Luxembourg, Malawi, Malaysia, Mexico, the Netherlands, New Zealand, Nigeria, Norway, Portugal, Saudi Arabia, Senegal, South Africa, South Korea, Spain, Sweden, Switzerland, Turkey, United Kingdom, United Nations Development Programme, United States, UN International Strategy for Disaster Reduction, Vietnam, the World Bank, and Yemen.
Australia CanadaBelgium Colombia EgyptBangladesh ChinaBrazil Denmark Finland
TurkeySweden United States YemenSpain United KingdomSwitzerland VietnamSouth Korea
Mexico NorwayNew Zealand Saudi Arabia South AfricaThe Netherlands PortugalNigeria SenegalMalaysia
France IndonesiaHaiti Italy LuxembourgGermany IrelandIndia Japan Malawi