Embed Size (px)
Citation preview
Advanced(issues(in(fMRI(sta1s1cs:(
Nonparametric(Inference,(
Power(&(Meta<Analysis(
Thomas(E.(Nichols(
University(of(Warwick(
(
Zurich(SPM(Course(
(
5(February,(2015(

Advanced(issues(in(fMRI(sta1s1cs(
• Nonparametric(Inference(
– What(if(I(don’t(trust(my(assump1ons?(
• Power(– What’s(the(chance(of(finding(my(effect?((pre<data)(
• Meta<Analysis(
– What(does(the(literature(say?(
3
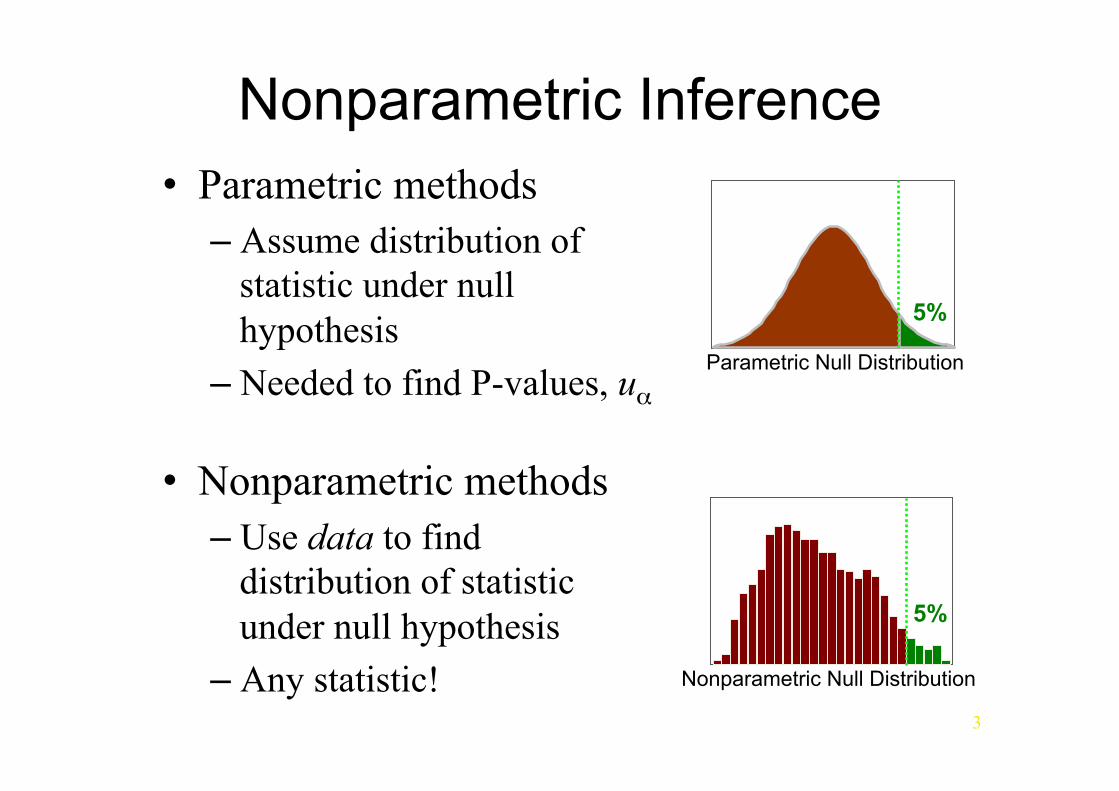
Nonparametric Inference • Parametric methods
– Assume distribution of statistic under null hypothesis
– Needed to find P-values, uα
• Nonparametric methods – Use data to find
distribution of statistic under null hypothesis
– Any statistic!
5%
Parametric Null Distribution
5%
Nonparametric Null Distribution
4
Permutation Test Toy Example
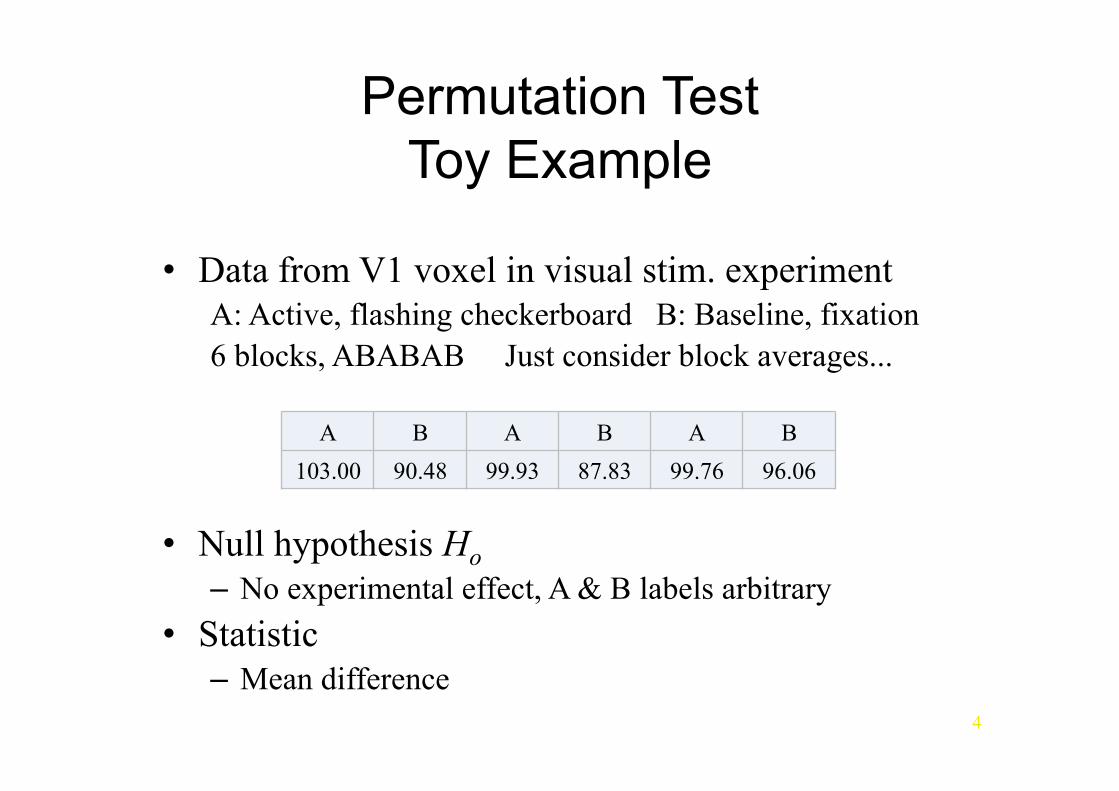
• Data from V1 voxel in visual stim. experiment A: Active, flashing checkerboard B: Baseline, fixation 6 blocks, ABABAB Just consider block averages...
• Null hypothesis Ho – No experimental effect, A & B labels arbitrary
• Statistic – Mean difference
A B A B A B 103.00 90.48 99.93 87.83 99.76 96.06
5
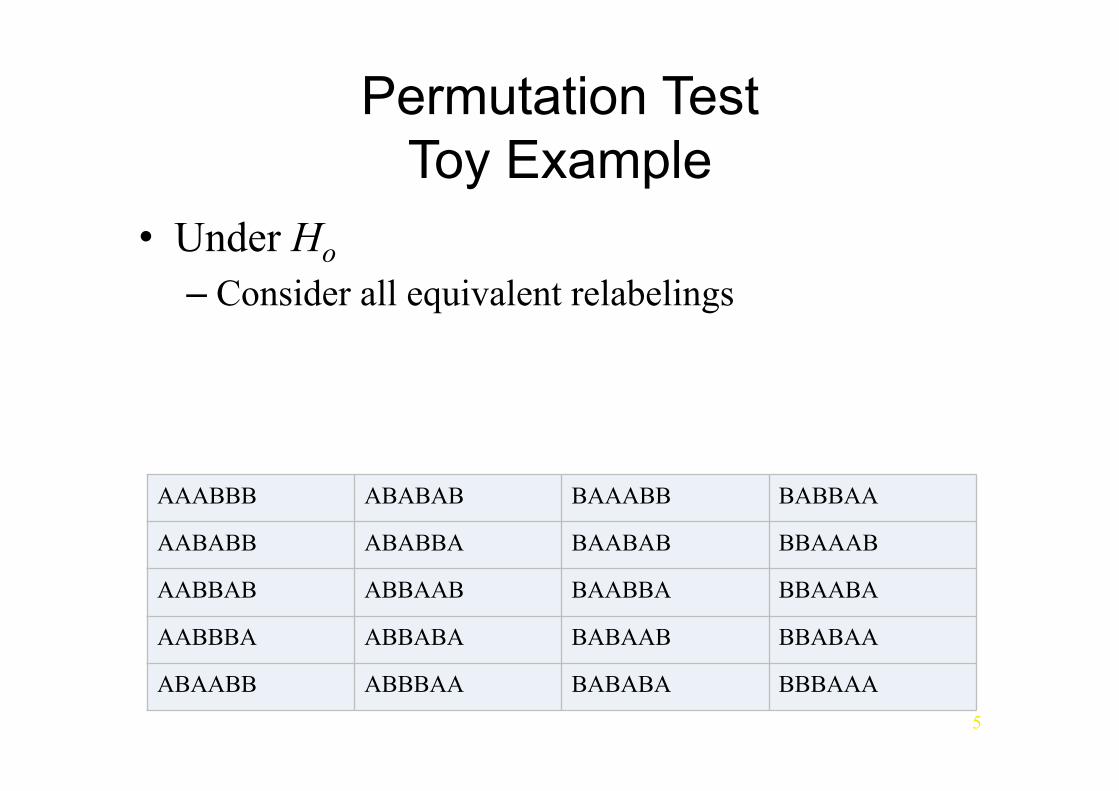
Permutation Test Toy Example
• Under Ho – Consider all equivalent relabelings
AAABBB ABABAB BAAABB BABBAA
AABABB ABABBA BAABAB BBAAAB
AABBAB ABBAAB BAABBA BBAABA
AABBBA ABBABA BABAAB BBABAA
ABAABB ABBBAA BABABA BBBAAA
6
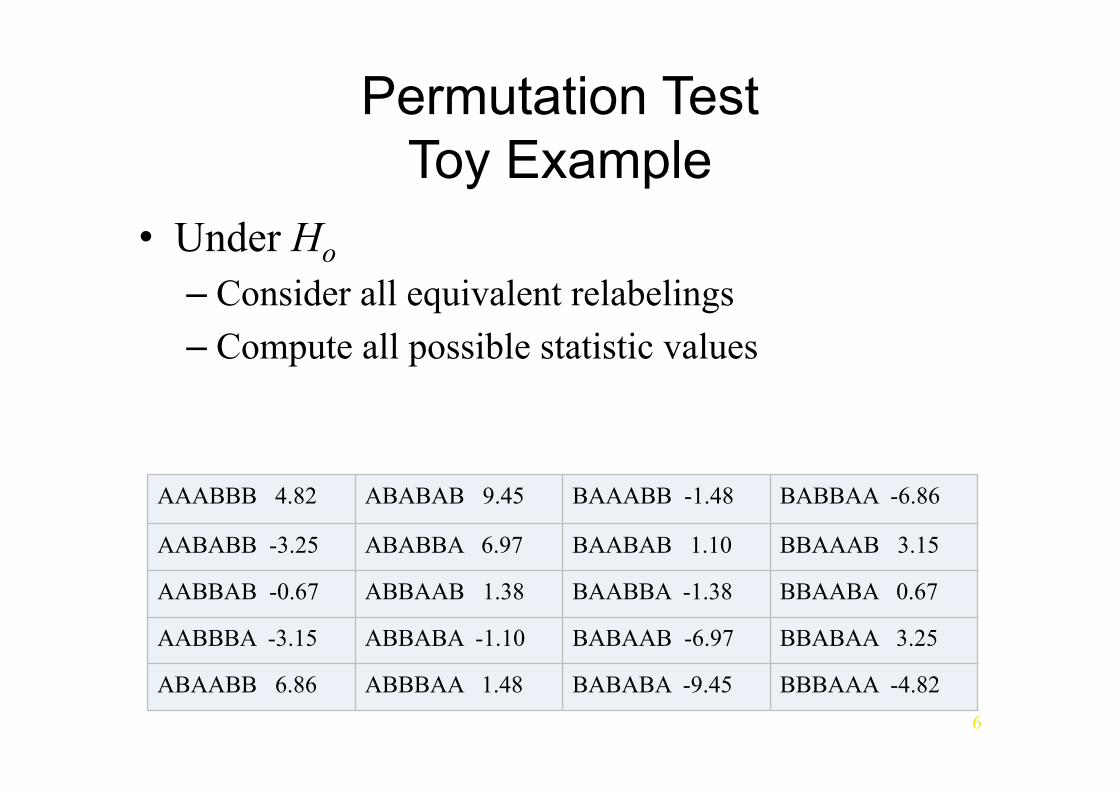
Permutation Test Toy Example
• Under Ho – Consider all equivalent relabelings – Compute all possible statistic values
AAABBB 4.82 ABABAB 9.45 BAAABB -1.48 BABBAA -6.86
AABABB -3.25 ABABBA 6.97 BAABAB 1.10 BBAAAB 3.15
AABBAB -0.67 ABBAAB 1.38 BAABBA -1.38 BBAABA 0.67
AABBBA -3.15 ABBABA -1.10 BABAAB -6.97 BBABAA 3.25
ABAABB 6.86 ABBBAA 1.48 BABABA -9.45 BBBAAA -4.82
7
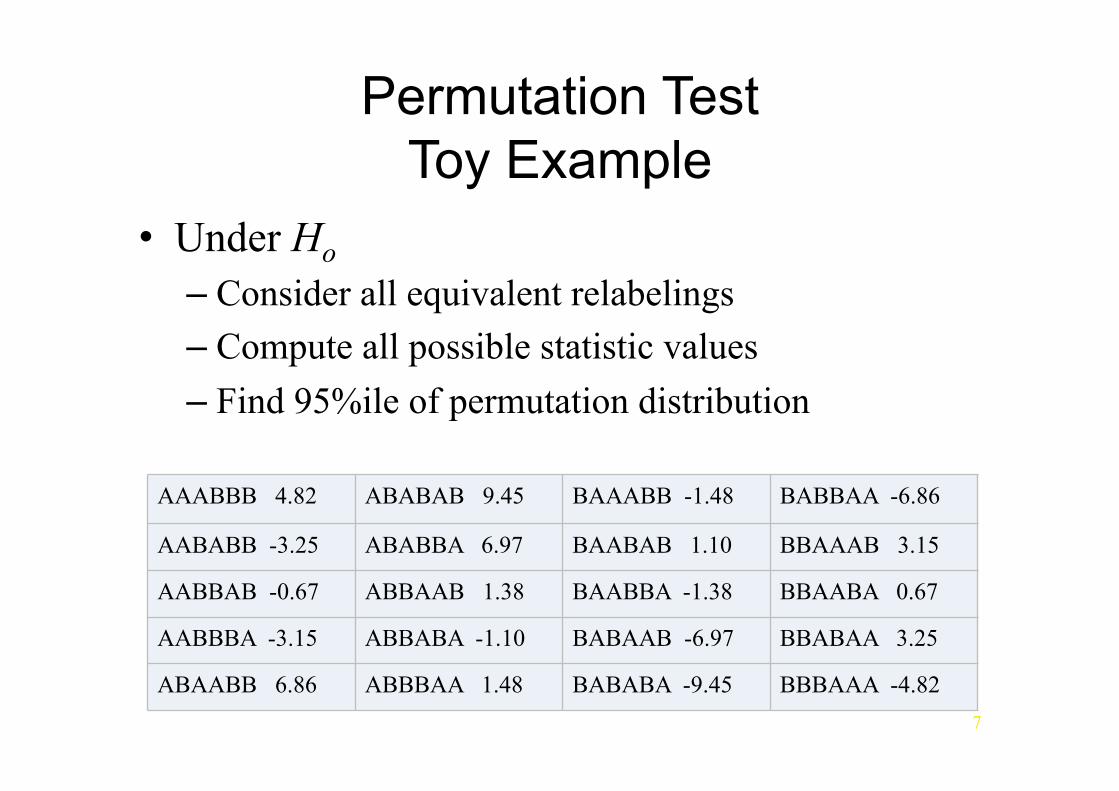
Permutation Test Toy Example
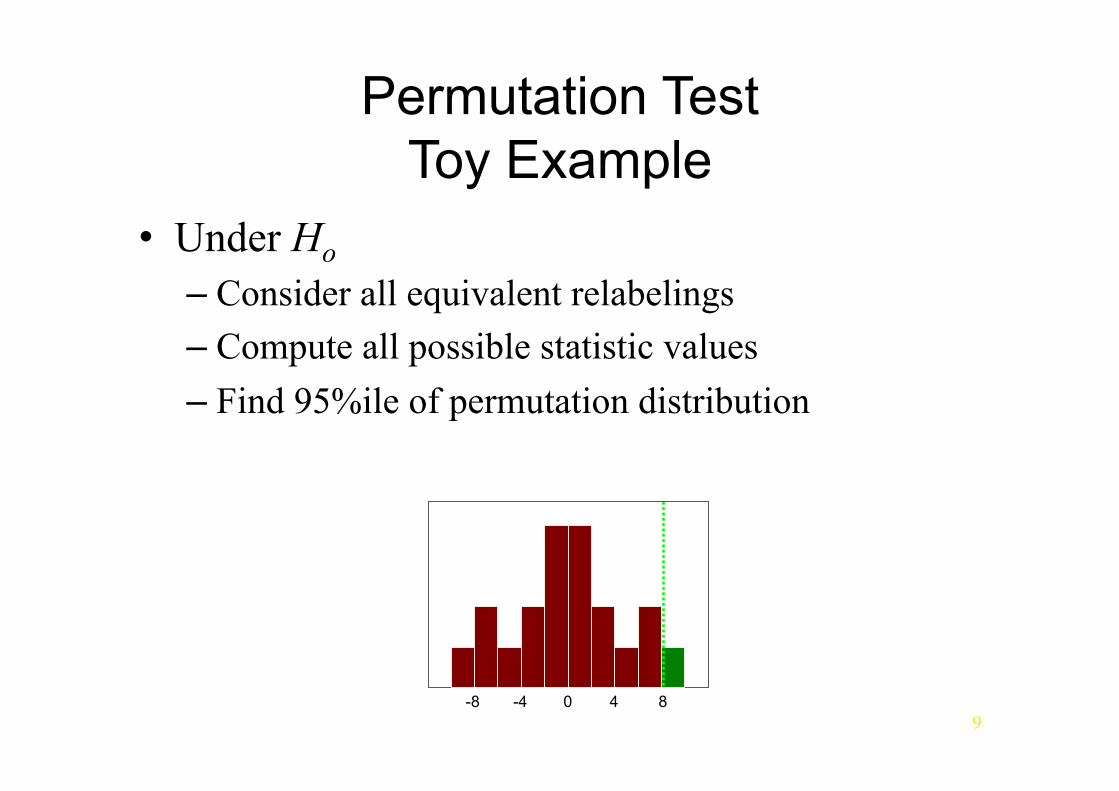
• Under Ho – Consider all equivalent relabelings – Compute all possible statistic values – Find 95%ile of permutation distribution
AAABBB 4.82 ABABAB 9.45 BAAABB -1.48 BABBAA -6.86
AABABB -3.25 ABABBA 6.97 BAABAB 1.10 BBAAAB 3.15
AABBAB -0.67 ABBAAB 1.38 BAABBA -1.38 BBAABA 0.67
AABBBA -3.15 ABBABA -1.10 BABAAB -6.97 BBABAA 3.25
ABAABB 6.86 ABBBAA 1.48 BABABA -9.45 BBBAAA -4.82
8
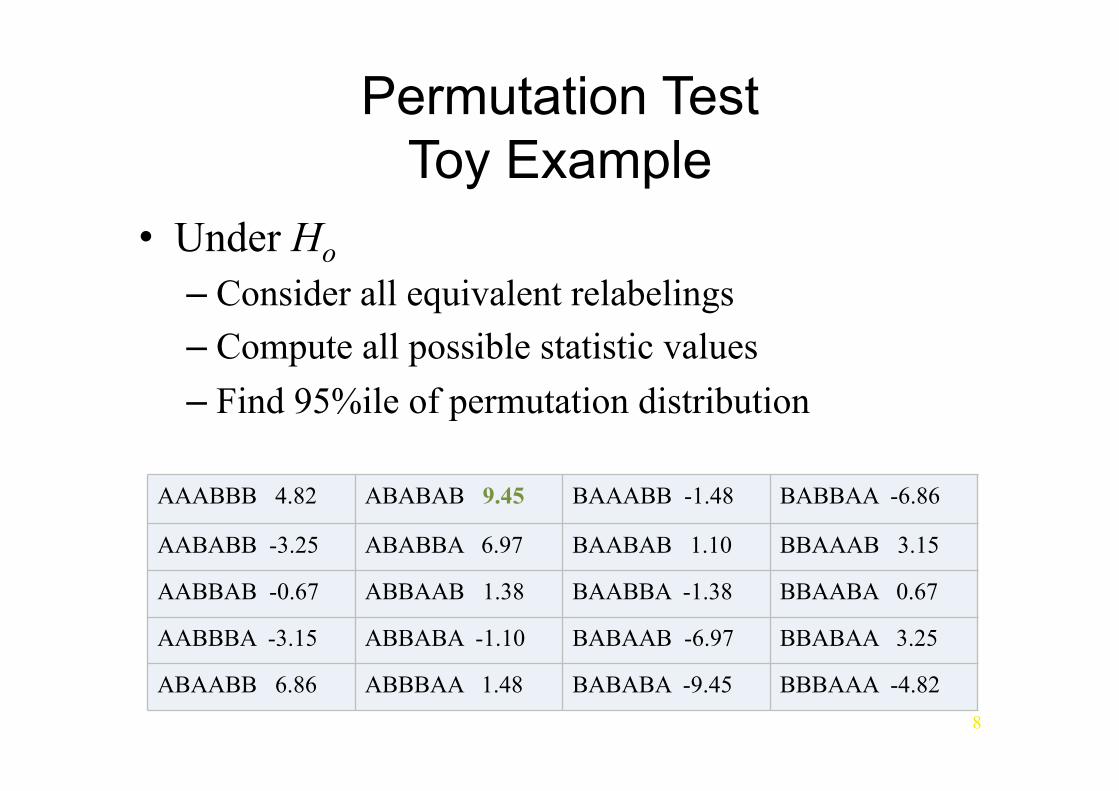
Permutation Test Toy Example
• Under Ho – Consider all equivalent relabelings – Compute all possible statistic values – Find 95%ile of permutation distribution
AAABBB 4.82 ABABAB 9.45 BAAABB -1.48 BABBAA -6.86
AABABB -3.25 ABABBA 6.97 BAABAB 1.10 BBAAAB 3.15
AABBAB -0.67 ABBAAB 1.38 BAABBA -1.38 BBAABA 0.67
AABBBA -3.15 ABBABA -1.10 BABAAB -6.97 BBABAA 3.25
ABAABB 6.86 ABBBAA 1.48 BABABA -9.45 BBBAAA -4.82
9
Permutation Test Toy Example
• Under Ho – Consider all equivalent relabelings – Compute all possible statistic values – Find 95%ile of permutation distribution
0 4 8 -4 -8

Multiple Tests: What is “A False Positive”?
• False Discovery Rate (FDR) – Expected proportion of false positives among detections – Compute from voxel- , peak- or cluster-wise uncorrected P-values
• Familywise Error Rate (FWE) – Chance of one or more false positives
FWE(u) = P(One or more false positives | Ho) = P(Max voxel above threshold u | Ho) = P( max T ≥ u | Ho)
FWE$corrected++thresholds+/+P$values++just+like+uncorrected!+ 5%
Ho Maximum Distribution
5%
Ho Distribution (1 voxel)
Uncorr:+Tail+area+on+1$voxel+null+ FWE$corr:+Tail+area+on+max.+null+
11
Controlling FWE: Permutation Test
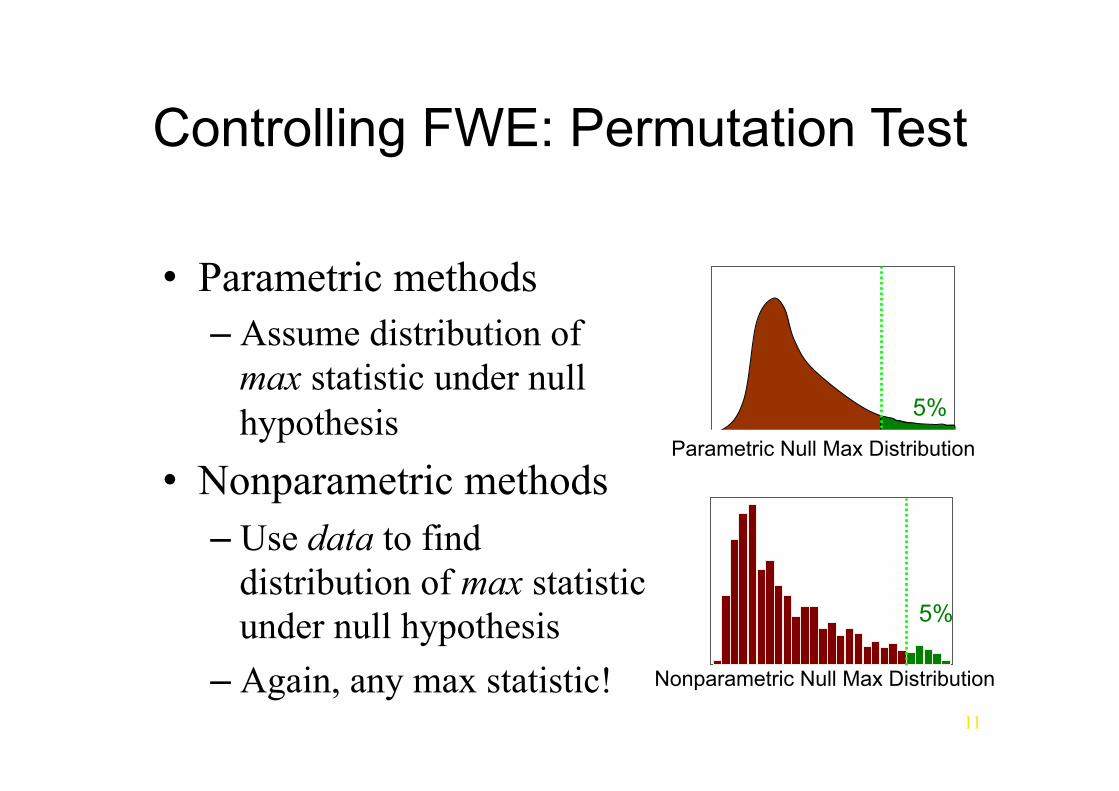
• Parametric methods – Assume distribution of
max statistic under null hypothesis
• Nonparametric methods – Use data to find
distribution of max statistic under null hypothesis
– Again, any max statistic!
5%
Parametric Null Max Distribution
5%
Nonparametric Null Max Distribution
12
Permutation Test Smoothed Variance t
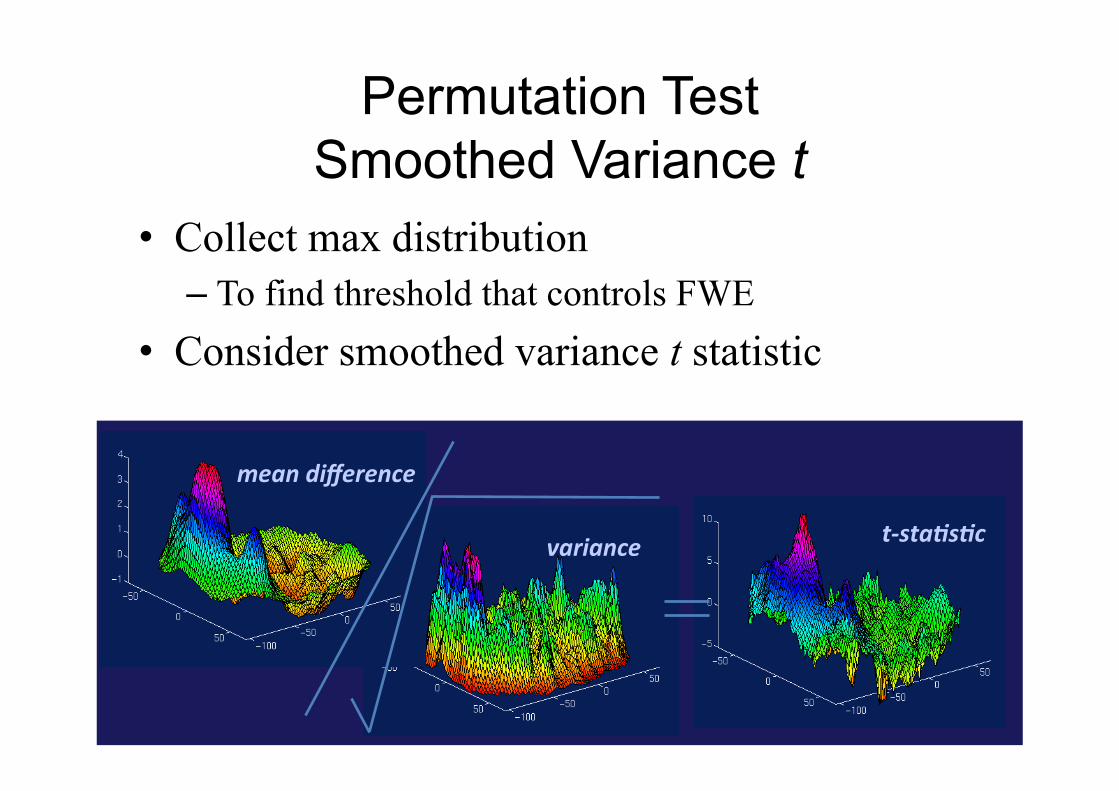
• Collect max distribution – To find threshold that controls FWE
• Consider smoothed variance t statistic
t"sta%s%c'variance'
mean'difference'

13
Permutation Test Smoothed Variance t
• Collect max distribution – To find threshold that controls FWE
• Consider smoothed variance t statistic
Smoothed'Variance't"sta%s%c'
mean'difference'smoothed'variance'
14
Permutation Test Strengths
• Requires only assumption of exchangeability – Under Ho, distribution unperturbed by permutation – Allows us to build permutation distribution
• Subjects are exchangeable – Under Ho, each subject�s A/B labels can be
flipped • fMRI scans not exchangeable under Ho
– Due to temporal autocorrelation
15
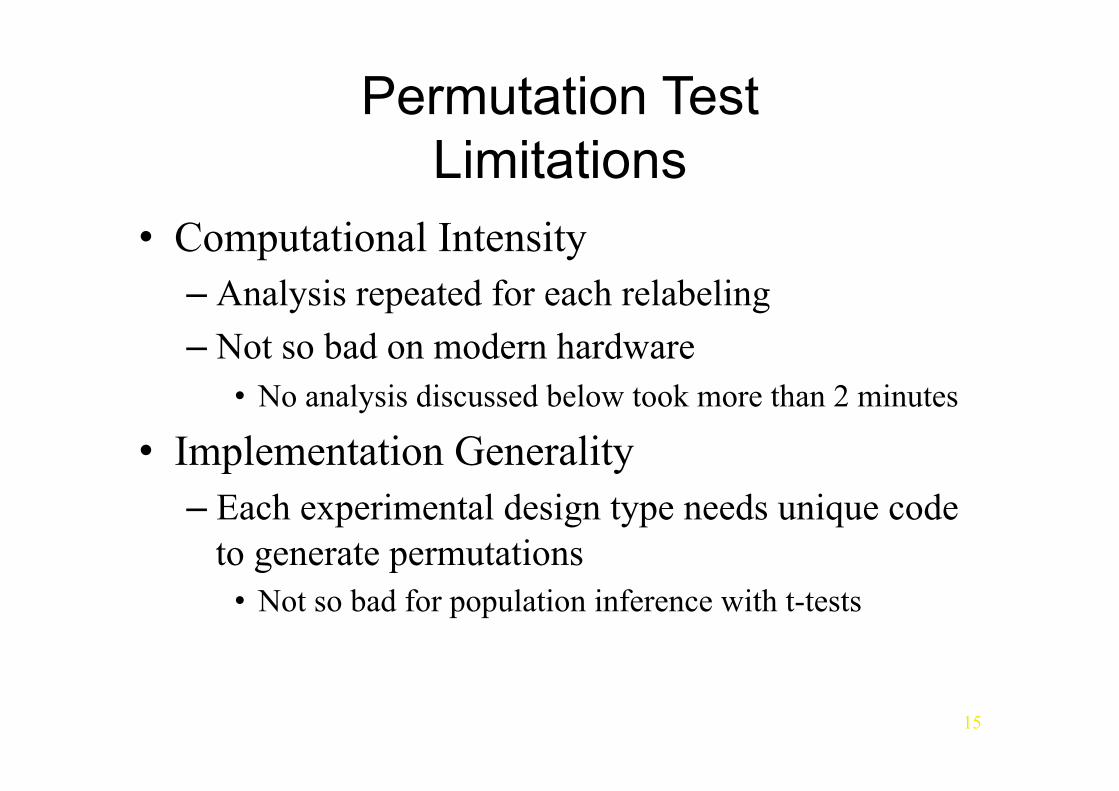
Permutation Test Limitations
• Computational Intensity – Analysis repeated for each relabeling – Not so bad on modern hardware
• No analysis discussed below took more than 2 minutes
• Implementation Generality – Each experimental design type needs unique code
to generate permutations • Not so bad for population inference with t-tests
16
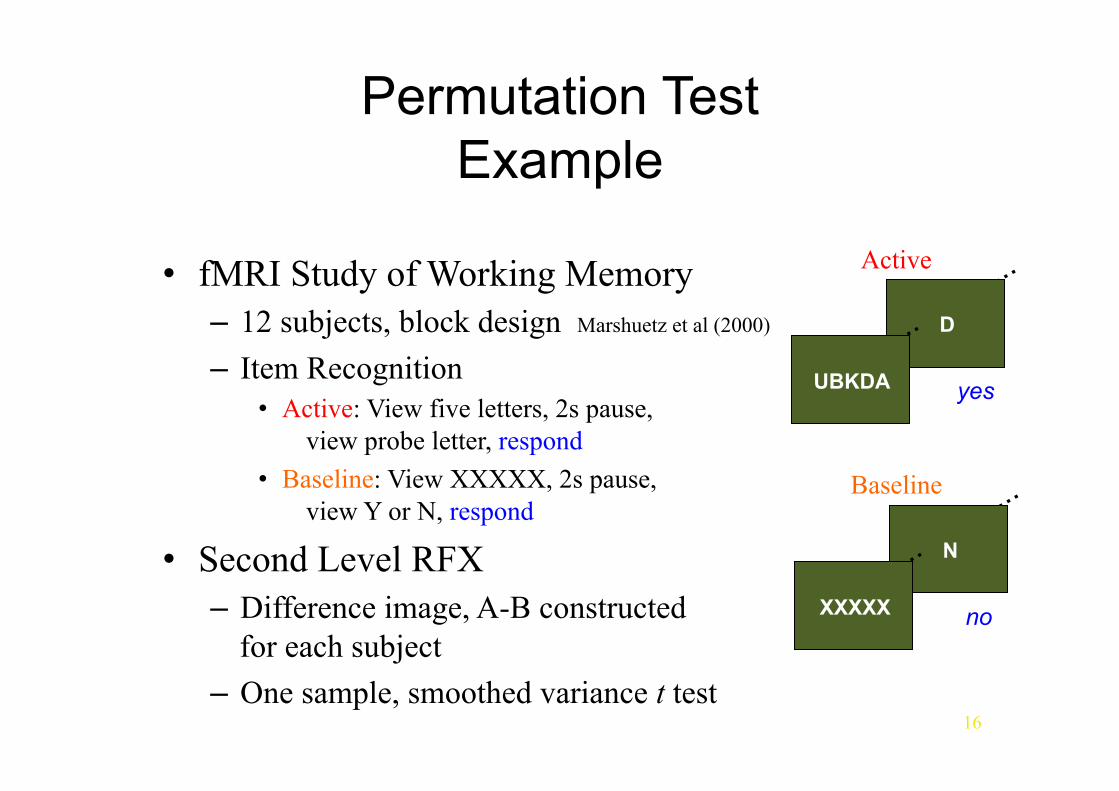
Permutation Test Example
• fMRI Study of Working Memory – 12 subjects, block design Marshuetz et al (2000) – Item Recognition
• Active: View five letters, 2s pause, view probe letter, respond
• Baseline: View XXXXX, 2s pause, view Y or N, respond
• Second Level RFX – Difference image, A-B constructed
for each subject – One sample, smoothed variance t test
D
yes UBKDA
Active
N
no XXXXX
Baseline

17
Permutation Test Example
• Permute! – 212 = 4,096 ways to flip 12 A/B labels – For each, note maximum of t image .
Permutation Distribution Maximum t
Maximum Intensity Projection Thresholded t
18
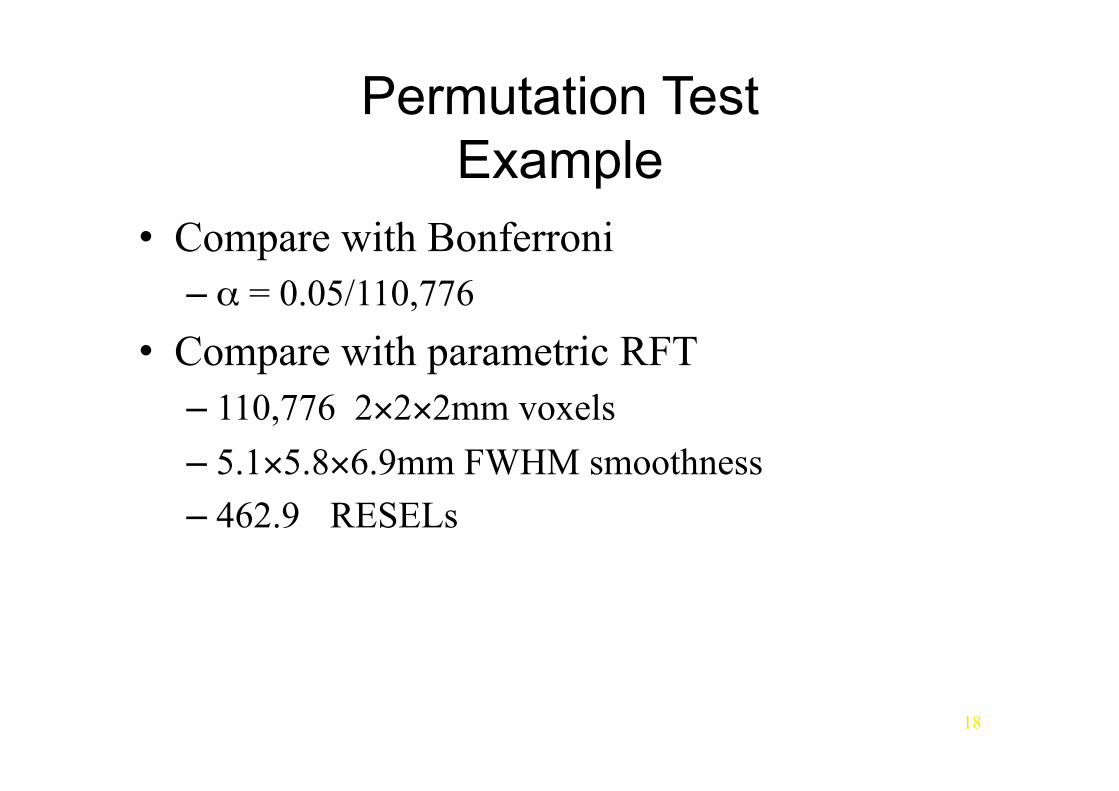
Permutation Test Example
• Compare with Bonferroni – α = 0.05/110,776
• Compare with parametric RFT – 110,776 2×2×2mm voxels – 5.1×5.8×6.9mm FWHM smoothness – 462.9 RESELs
19
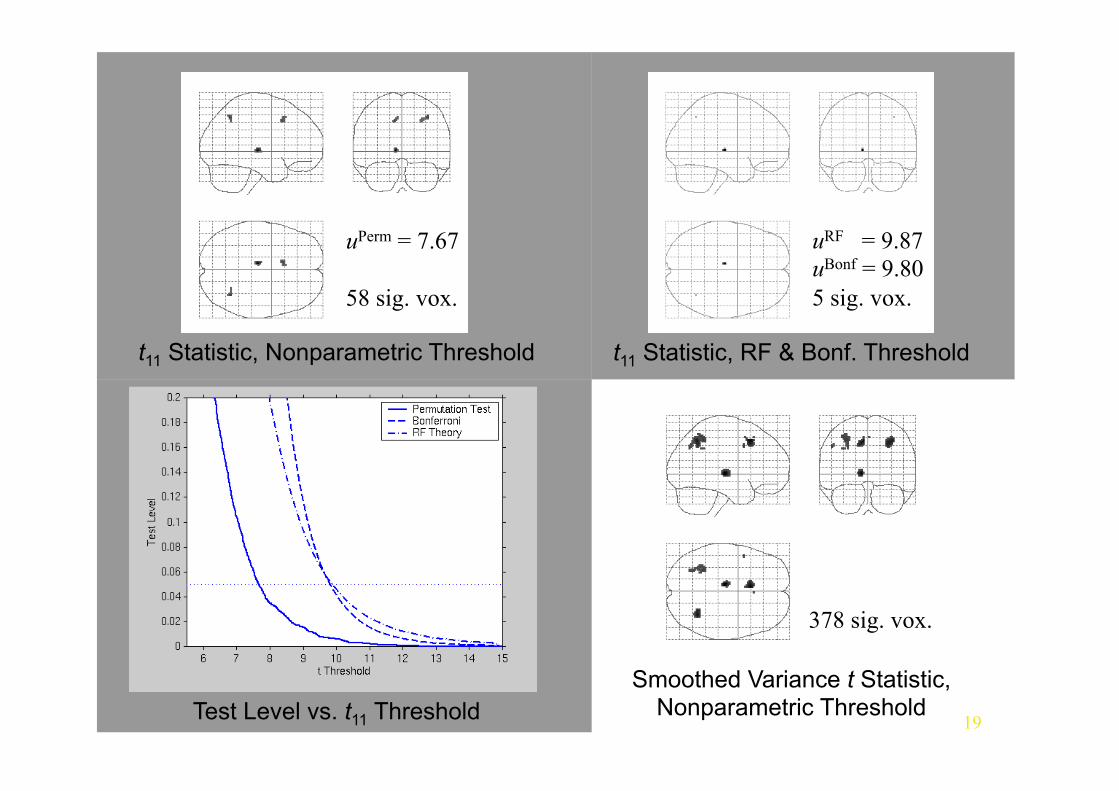
t11 Statistic, RF & Bonf. Threshold t11 Statistic, Nonparametric Threshold
uRF = 9.87 uBonf = 9.80 5 sig. vox.
uPerm = 7.67 58 sig. vox.
Smoothed Variance t Statistic, Nonparametric Threshold
378 sig. vox.
Test Level vs. t11 Threshold
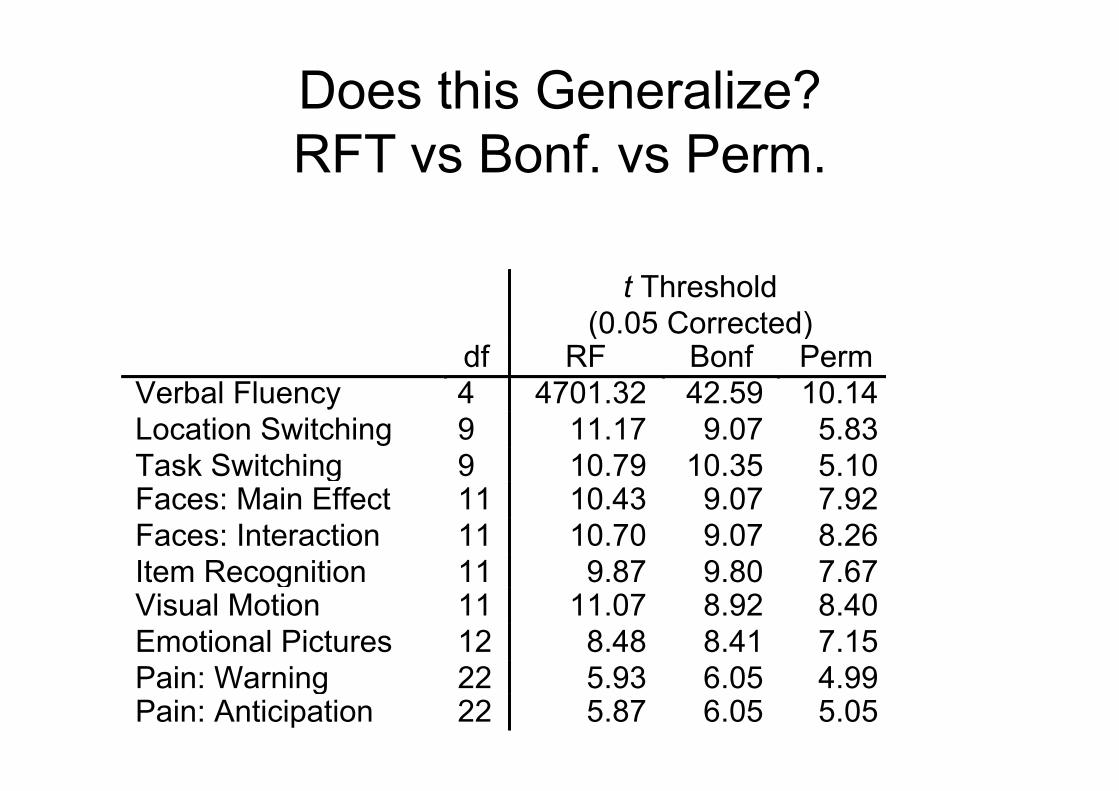
Does this Generalize? RFT vs Bonf. vs Perm.
t Threshold (0.05 Corrected)
df RF Bonf Perm Verbal Fluency 4 4701.32 42.59 10.14 Location Switching 9 11.17 9.07 5.83 Task Switching 9 10.79 10.35 5.10 Faces: Main Effect 11 10.43 9.07 7.92 Faces: Interaction 11 10.70 9.07 8.26 Item Recognition 11 9.87 9.80 7.67 Visual Motion 11 11.07 8.92 8.40 Emotional Pictures 12 8.48 8.41 7.15 Pain: Warning 22 5.93 6.05 4.99 Pain: Anticipation 22 5.87 6.05 5.05
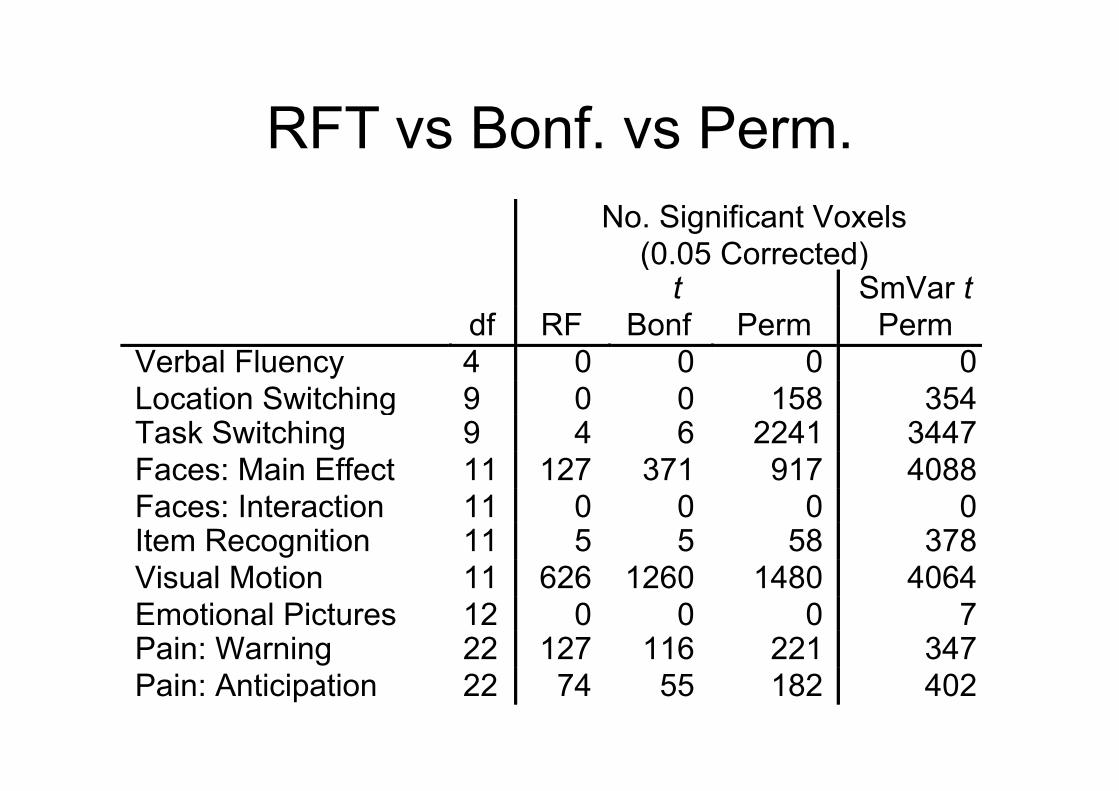
RFT vs Bonf. vs Perm. No. Significant Voxels
(0.05 Corrected) t SmVar t df RF Bonf Perm Perm
Verbal Fluency 4 0 0 0 0 Location Switching 9 0 0 158 354 Task Switching 9 4 6 2241 3447 Faces: Main Effect 11 127 371 917 4088 Faces: Interaction 11 0 0 0 0 Item Recognition 11 5 5 58 378 Visual Motion 11 626 1260 1480 4064 Emotional Pictures 12 0 0 0 7 Pain: Warning 22 127 116 221 347 Pain: Anticipation 22 74 55 182 402
22
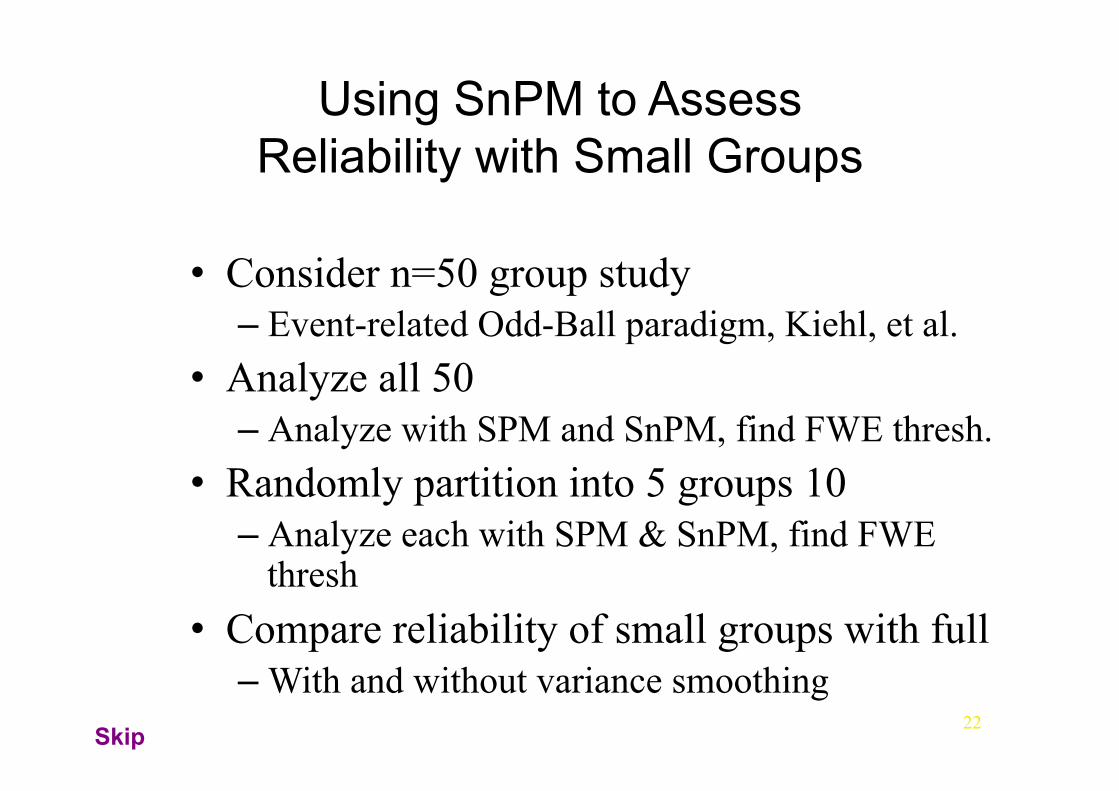
Using SnPM to Assess Reliability with Small Groups
• Consider n=50 group study – Event-related Odd-Ball paradigm, Kiehl, et al.
• Analyze all 50 – Analyze with SPM and SnPM, find FWE thresh.
• Randomly partition into 5 groups 10 – Analyze each with SPM & SnPM, find FWE
thresh • Compare reliability of small groups with full
– With and without variance smoothing . Skip
23
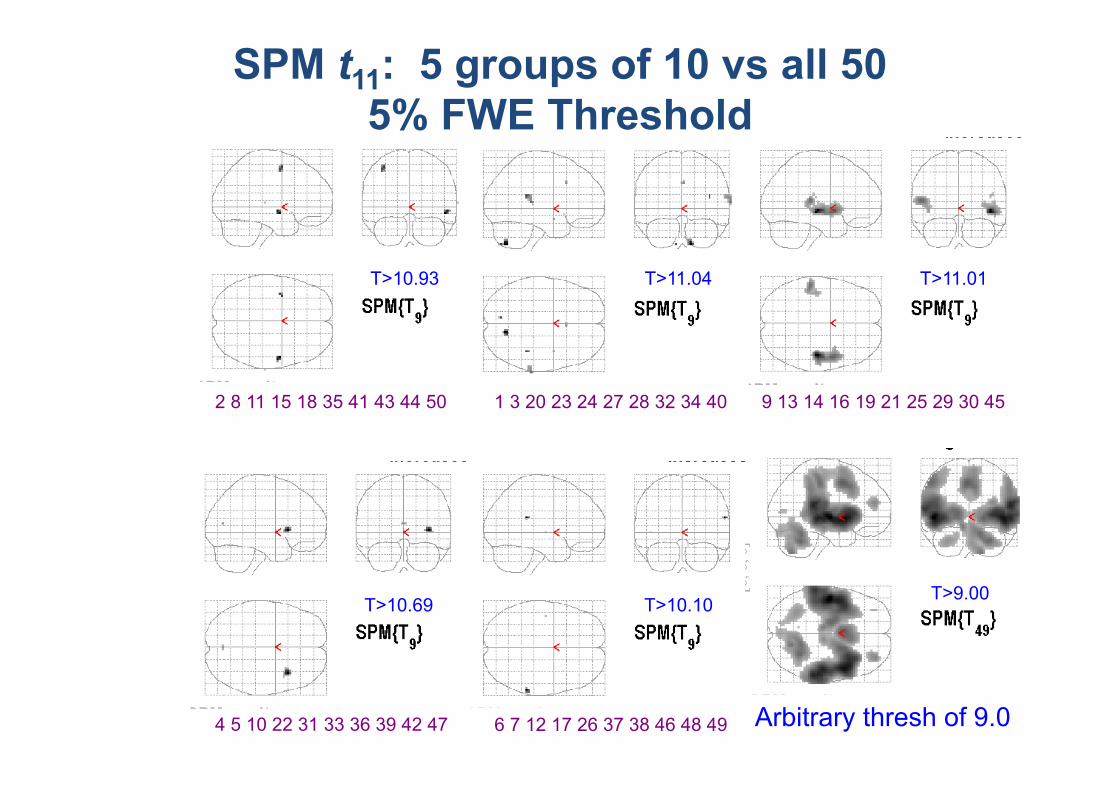
SPM t11: 5 groups of 10 vs all 50 5% FWE Threshold
10 subj 10 subj 10 subj
10 subj 10 subj all 50
T>10.93 T>11.04 T>11.01
T>10.69 T>10.10
2 8 11 15 18 35 41 43 44 50 1 3 20 23 24 27 28 32 34 40 9 13 14 16 19 21 25 29 30 45
4 5 10 22 31 33 36 39 42 47 6 7 12 17 26 37 38 46 48 49 23
T>4.09
all 50 Arbitrary thresh of 9.0
T>9.00
24
T>4.09
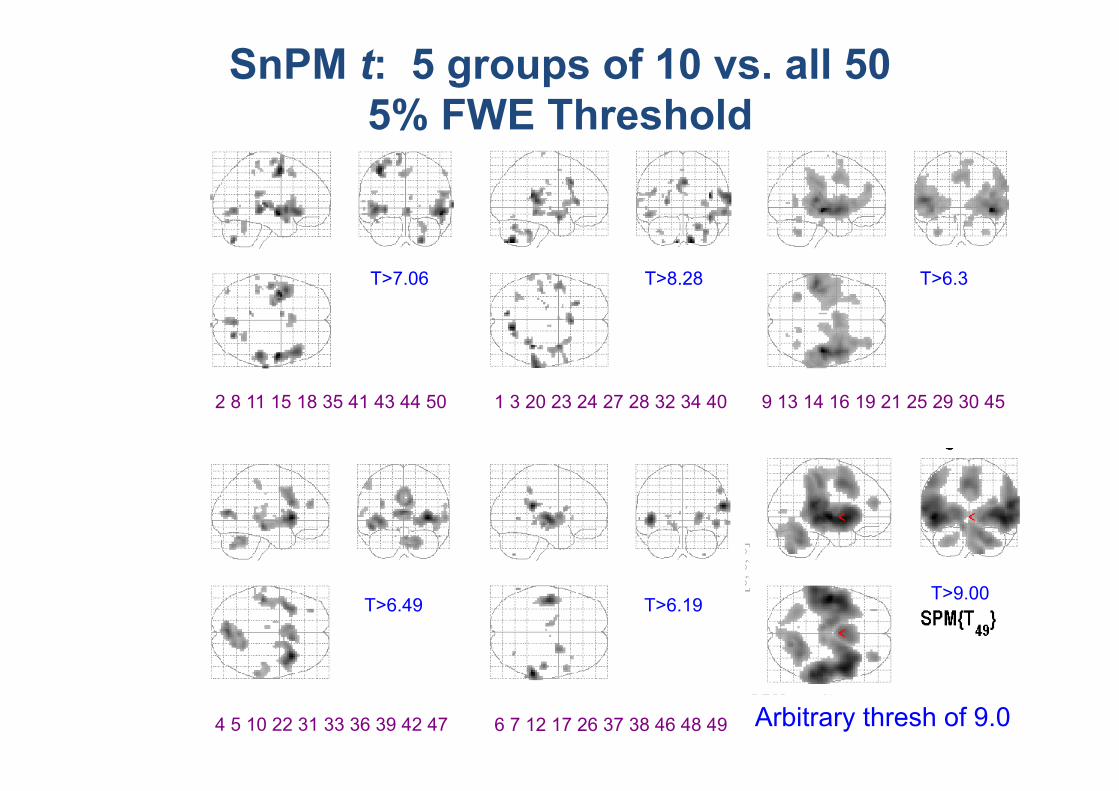
SnPM t: 5 groups of 10 vs. all 50 5% FWE Threshold
10 subj 10 subj 10 subj
10 subj 10 subj
T>7.06 T>8.28 T>6.3
T>6.49 T>6.19
all 50
2 8 11 15 18 35 41 43 44 50 1 3 20 23 24 27 28 32 34 40 9 13 14 16 19 21 25 29 30 45
4 5 10 22 31 33 36 39 42 47 6 7 12 17 26 37 38 46 48 49 Arbitrary thresh of 9.0
T>9.00
25
10 subj 10 subj 10 subj
10 subj 10 subj Arbitrary thresh of 9.0
T>9.00
all 50
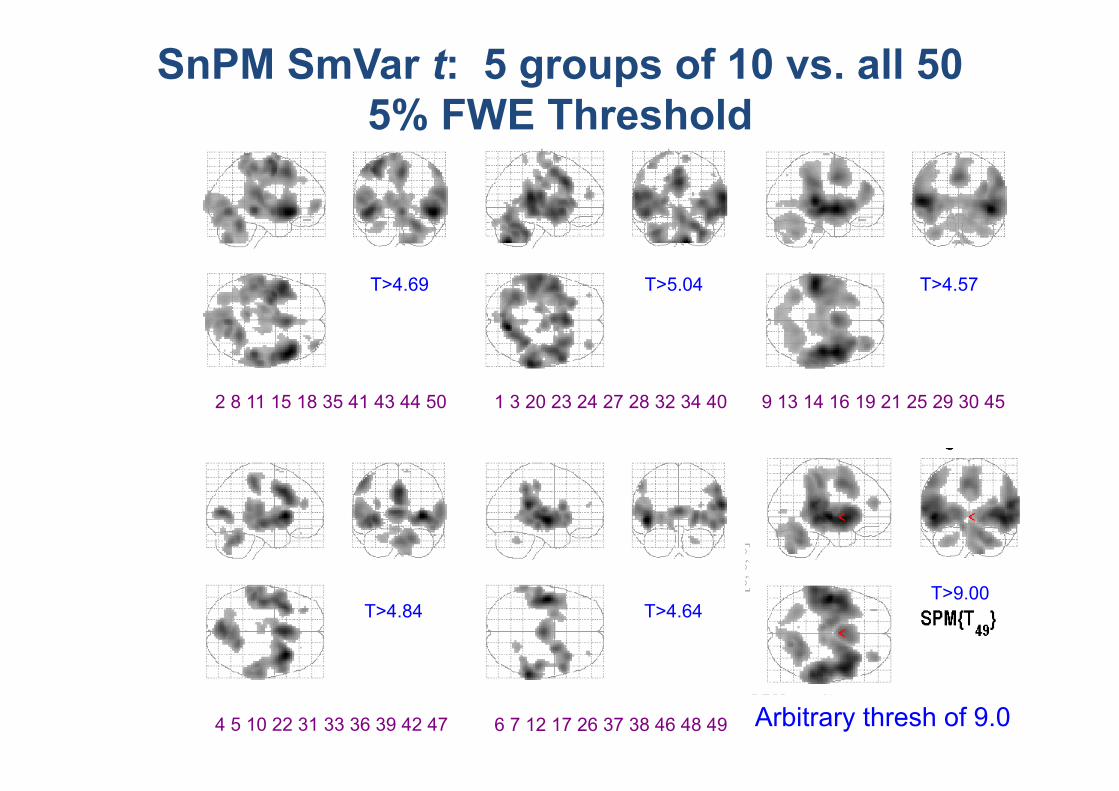
SnPM SmVar t: 5 groups of 10 vs. all 50 5% FWE Threshold
T>4.69 T>5.04 T>4.57
T>4.84 T>4.64
2 8 11 15 18 35 41 43 44 50 1 3 20 23 24 27 28 32 34 40 9 13 14 16 19 21 25 29 30 45
4 5 10 22 31 33 36 39 42 47 6 7 12 17 26 37 38 46 48 49
Nonparametric Conclusions
• Nonparametric Permutation – Good when Normality is question – Good with tiny group inference & variance
smoothing
• Come to practical for more!
26
Advanced(issues(in(fMRI(sta1s1cs(
• Nonparametric(Inference(
• Power(• Meta<Analysis(
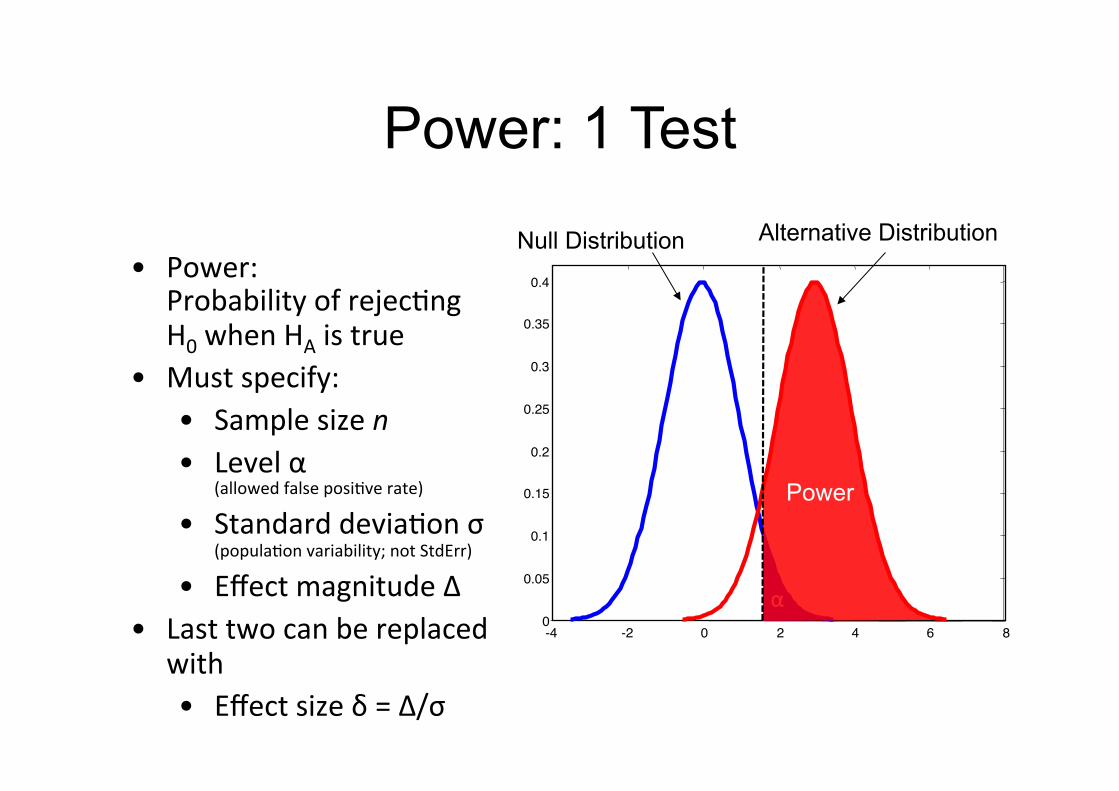
Power: 1 Test
• Power:(Probability(of(rejec1ng(H0(when(HA(is(true(
• Must(specify:(
• Sample(size(n+• Level(α(
(allowed(false(posi1ve(rate)(
• Standard(devia1on(σ((popula1on(variability;(not(StdErr)(
• Effect(magnitude(Δ(
• Last(two(can(be(replaced(with(
• Effect(size(δ(=(Δ/σ(
0( 2( 4( 6( 8(-4( -2(0(
0.05(
0.1(
0.15(
0.2(
0.25(
0.3(
0.35(
0.4(
α(
Power
Null Distribution Alternative Distribution
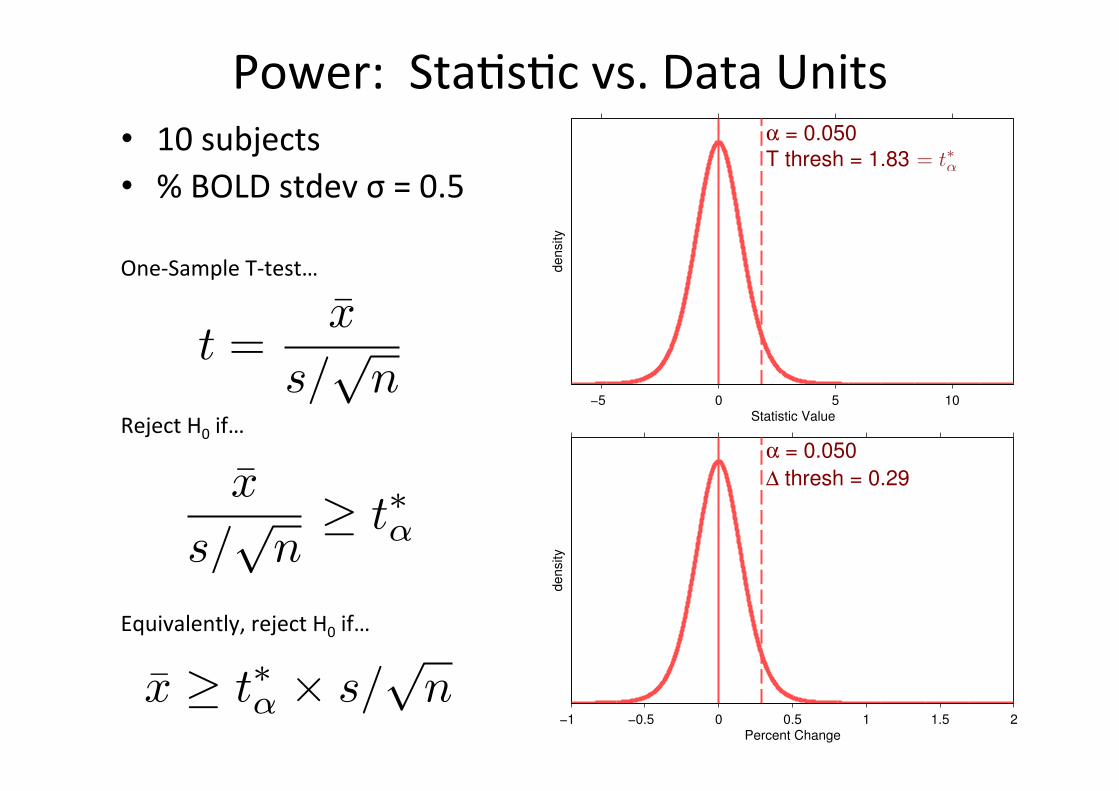
Power:((Sta1s1c(vs.(Data(Units(
(• 10(subjects(• %(BOLD(stdev(σ(=(0.5(
−5 0 5 10
α = 0.050T thresh = 1.83
Statistic Value
densi
ty
−1 −0.5 0 0.5 1 1.5 2
α = 0.050
∆ thresh = 0.29
Percent Change
densi
ty
t =x̄
s/
pn
x̄
s/
pn
� t
⇤↵
One<Sample(T<test…(
Reject(H0(if…(
x̄ � t
⇤↵ ⇥ s/
pn
Equivalently,(reject(H0(if…(
= t⇤↵
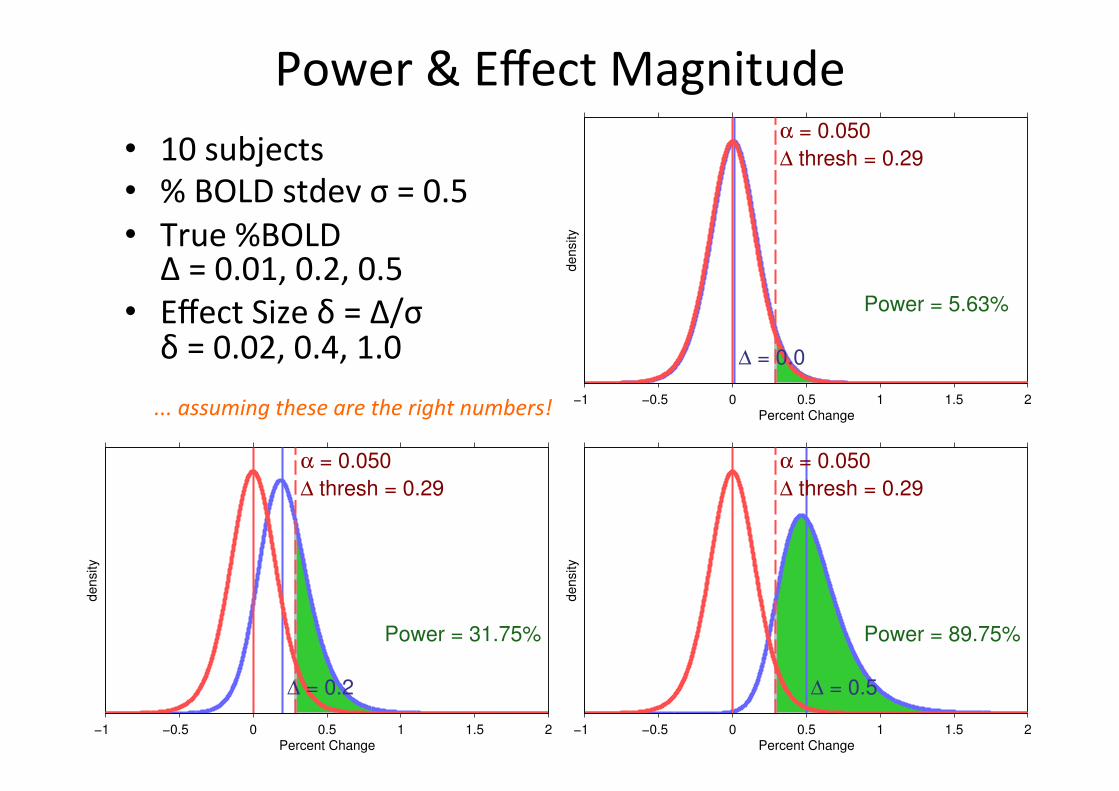
Power(&(Effect(Magnitude(
(• 10(subjects(• %(BOLD(stdev(σ(=(0.5(• True(%BOLD(Δ(=(0.01,(0.2,(0.5(
• Effect(Size(δ(=(Δ/σ(δ(=(0.02,(0.4,(1.0(
−1 −0.5 0 0.5 1 1.5 2Percent Change
densi
ty
α = 0.050
∆ thresh = 0.29
∆ = 0.5
Power = 89.75%
−1 −0.5 0 0.5 1 1.5 2Percent Change
densi
ty
α = 0.050
∆ thresh = 0.29
∆ = 0.0
Power = 5.63%
−1 −0.5 0 0.5 1 1.5 2Percent Change
densi
ty
α = 0.050
∆ thresh = 0.29
∆ = 0.2
Power = 31.75%
...+assuming+these+are+the+right+numbers!+
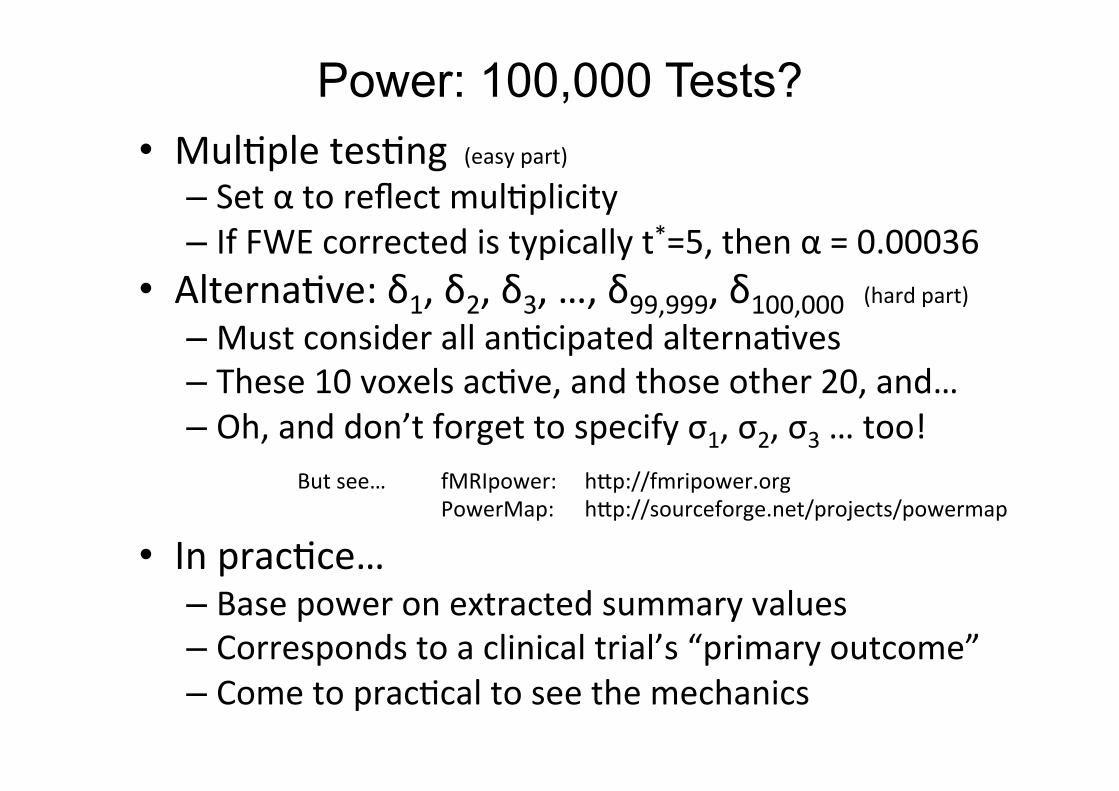
Power: 100,000 Tests? • Mul1ple(tes1ng((((easy(part)(
– Set(α(to(reflect(mul1plicity(
– If(FWE(corrected(is(typically(t*=5,(then(α(=(0.00036((
• Alterna1ve:(δ1,(δ2,(δ3,(…,(δ99,999,(δ100,000(((hard(part)(– Must(consider(all(an1cipated(alterna1ves(
– These(10(voxels(ac1ve,(and(those(other(20,(and…(– Oh,(and(don’t(forget(to(specify(σ1,(σ2,(σ3(…(too!(((
• In(prac1ce…(– Base(power(on(extracted(summary(values(
– Corresponds(to(a(clinical(trial’s(“primary(outcome”(
– Come(to(prac1cal(to(see(the(mechanics(
But(see…( (fMRIpower: (hrp://fmripower.org(
( ( (PowerMap: (hrp://sourceforge.net/projects/powermap(
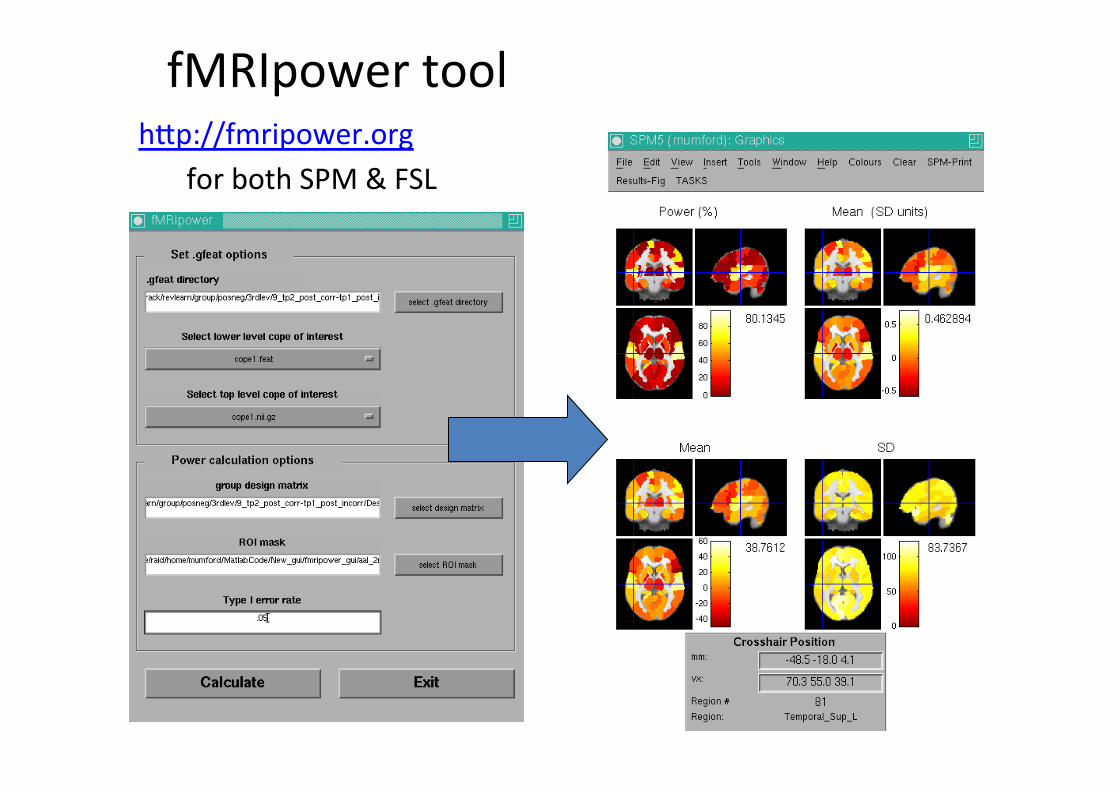
fMRIpower(tool(
(hrp://fmripower.org(
(for(both(SPM(&(FSL(
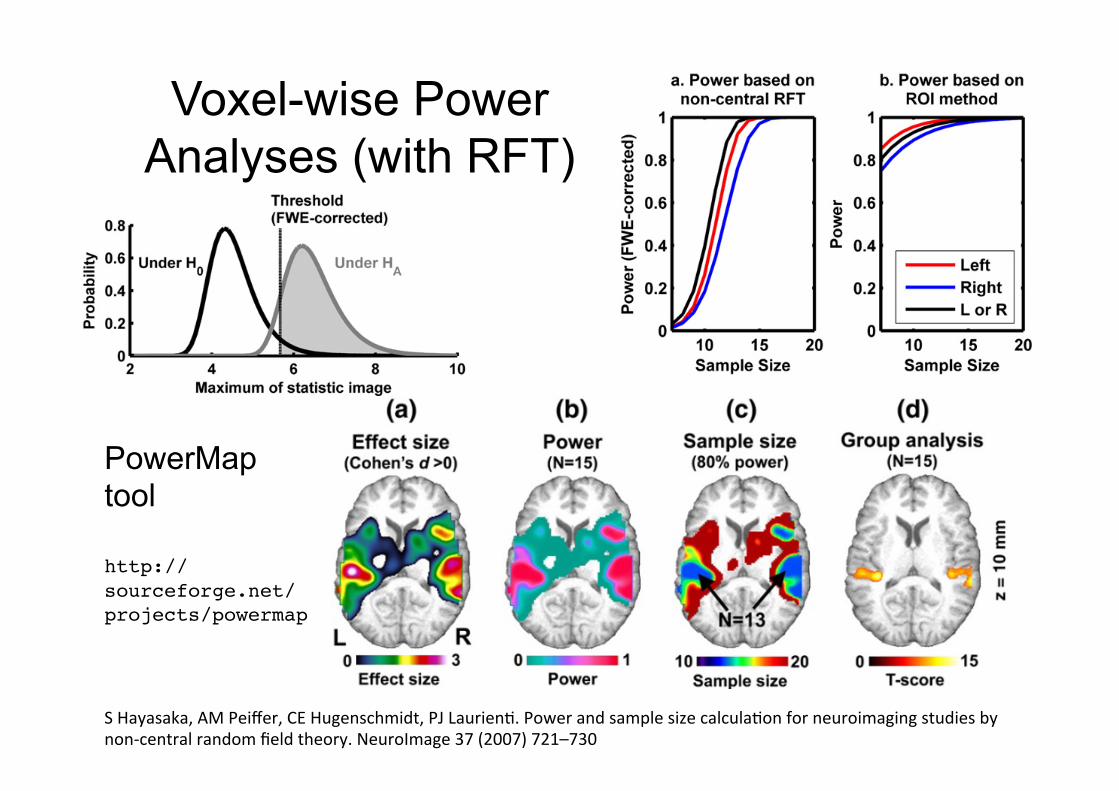
Voxel-wise Power Analyses (with RFT)
PowerMap tool http://sourceforge.net/projects/powermap!
S(Hayasaka,(AM(Peiffer,(CE(Hugenschmidt,(PJ(Laurien1.(Power(and(sample(size(calcula1on(for(neuroimaging(studies(by(
non<central(random(field(theory.(NeuroImage(37((2007)(721–730(
Power(Dangers(
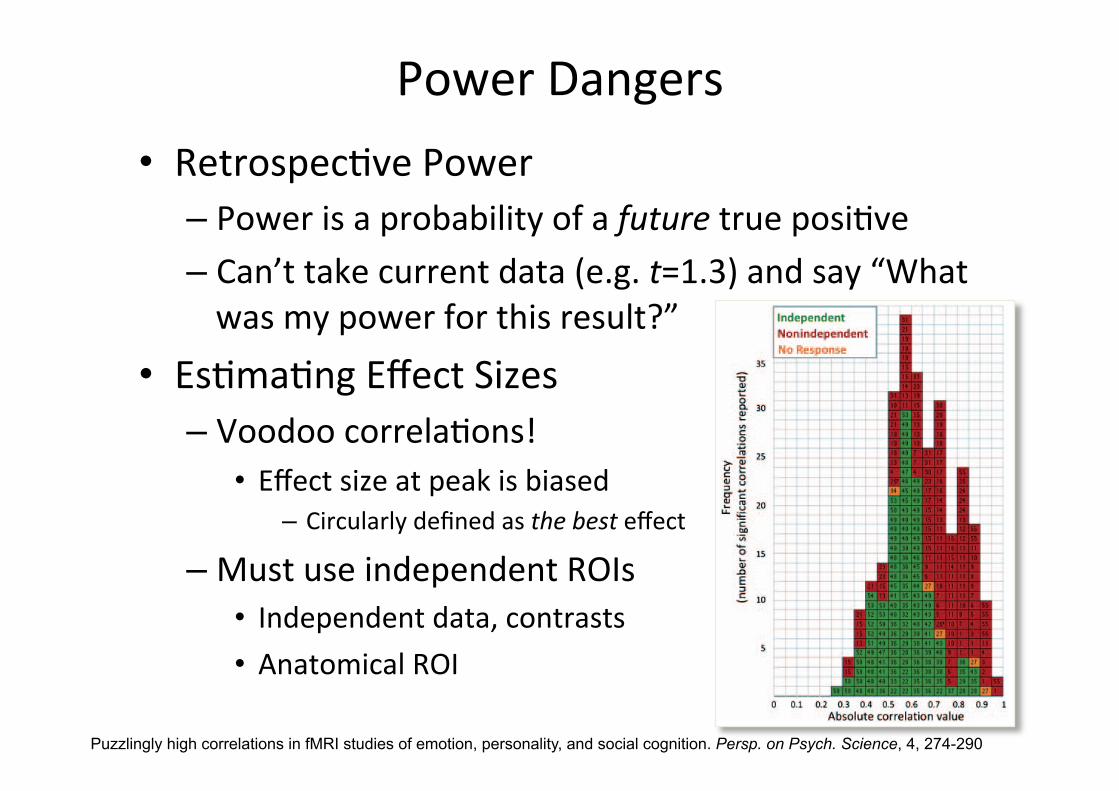
(• Retrospec1ve(Power(– Power(is(a(probability(of(a(future(true(posi1ve(– Can’t(take(current(data((e.g.(t=1.3)(and(say(“What(
was(my(power(for(this(result?”(
• Es1ma1ng(Effect(Sizes(
– Voodoo(correla1ons!(• Effect(size(at(peak(is(biased(
– Circularly(defined(as(the+best+effect(
– Must(use(independent(ROIs(
• Independent(data,(contrasts(• Anatomical(ROI(
Puzzlingly high correlations in fMRI studies of emotion, personality, and social cognition. Persp. on Psych. Science, 4, 274-290(
Power(&(Replicability(
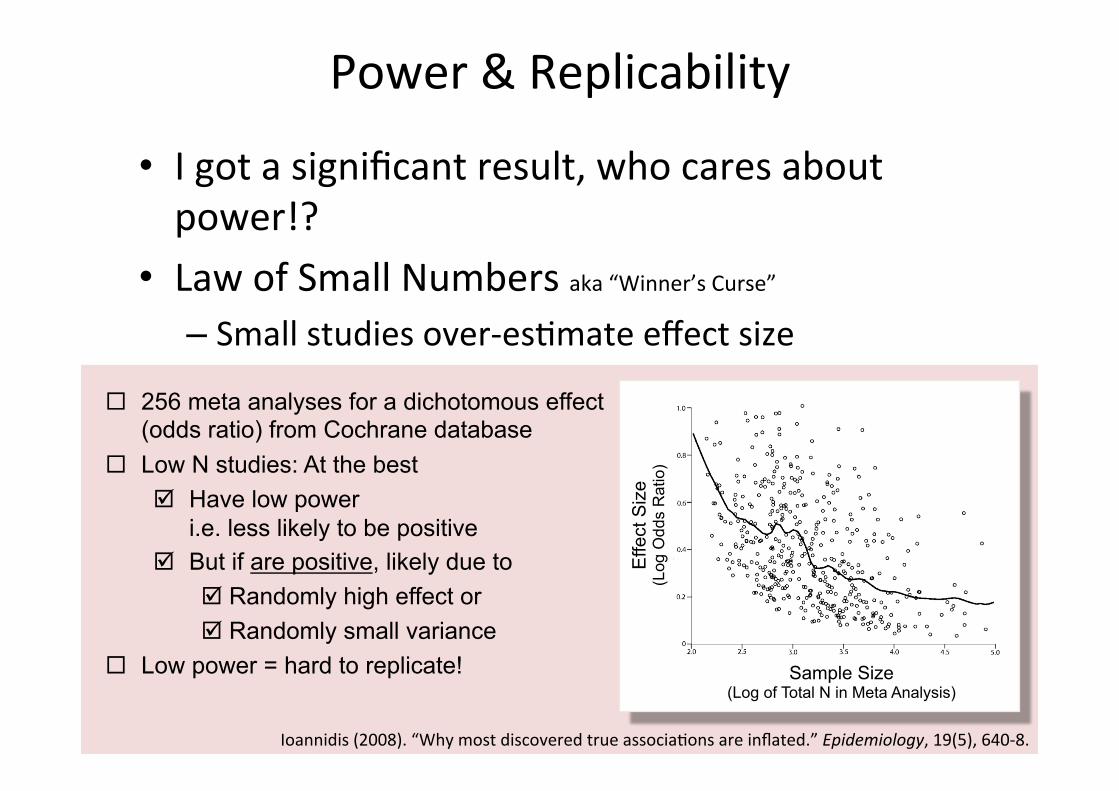
(• I(got(a(significant(result,(who(cares(about(power!?(
• Law(of(Small(Numbers(aka(“Winner’s(Curse”(
– Small(studies(over<es1mate(effect(size(
Effe
ct S
ize
(Log
Odd
s R
atio
) Sample Size
(Log of Total N in Meta Analysis)
! 256 meta analyses for a dichotomous effect (odds ratio) from Cochrane database
! Low N studies: At the best " Have low power
i.e. less likely to be positive " But if are positive, likely due to
" Randomly high effect or " Randomly small variance
! Low power = hard to replicate!
Ioannidis((2008).(“Why(most(discovered(true(associa1ons(are(inflated.”(Epidemiology,(19(5),(640<8.(
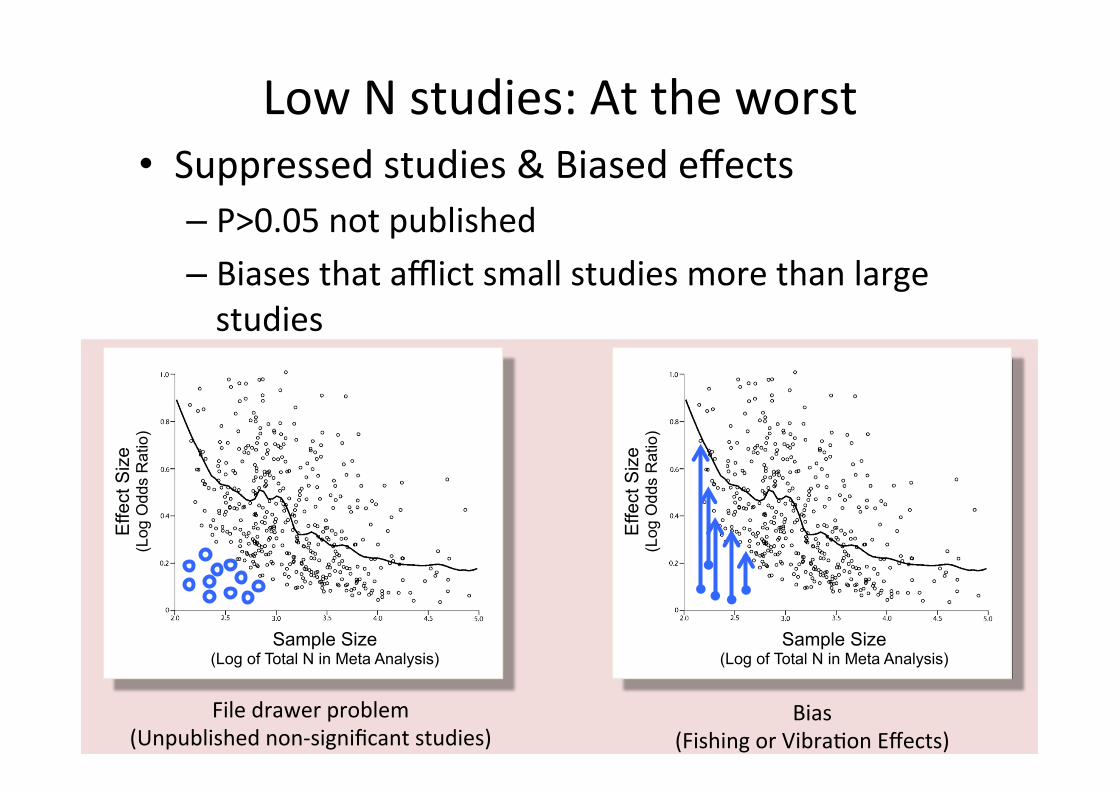
Low(N(studies:(At(the(worst(
(• Suppressed(studies(&(Biased(effects(– P>0.05(not(published(– Biases(that(afflict(small(studies(more(than(large(
studies(
Effe
ct S
ize
(Log
Odd
s R
atio
) Sample Size
(Log of Total N in Meta Analysis)
Effe
ct S
ize
(Log
Odd
s R
atio
)
Sample Size (Log of Total N in Meta Analysis)
File(drawer(problem(
(Unpublished(non<significant(studies)(Bias(
(Fishing(or(Vibra1on(Effects)(
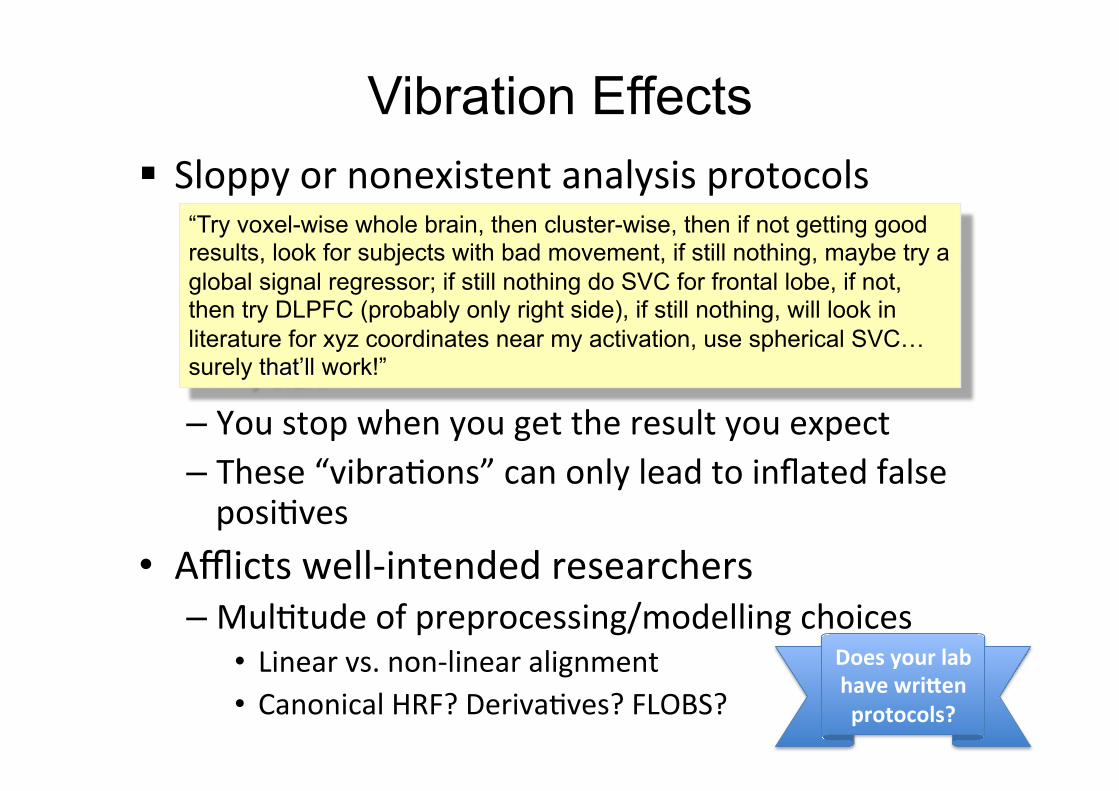
Vibration Effects # Sloppy(or(nonexistent(analysis(protocols(
(
– You(stop(when(you(get(the(result(you(expect(– These(“vibra1ons”(can(only(lead(to(inflated(false(posi1ves(
• Afflicts(well<intended(researchers(
– Mul1tude(of(preprocessing/modelling(choices(
• Linear(vs.(non<linear(alignment(
• Canonical(HRF?(Deriva1ves?(FLOBS?(
“Try voxel-wise whole brain, then cluster-wise, then if not getting good results, look for subjects with bad movement, if still nothing, maybe try a global signal regressor; if still nothing do SVC for frontal lobe, if not, then try DLPFC (probably only right side), if still nothing, will look in literature for xyz coordinates near my activation, use spherical SVC… surely that’ll work!”
Does%your%lab%
have%wri0en%
protocols?%
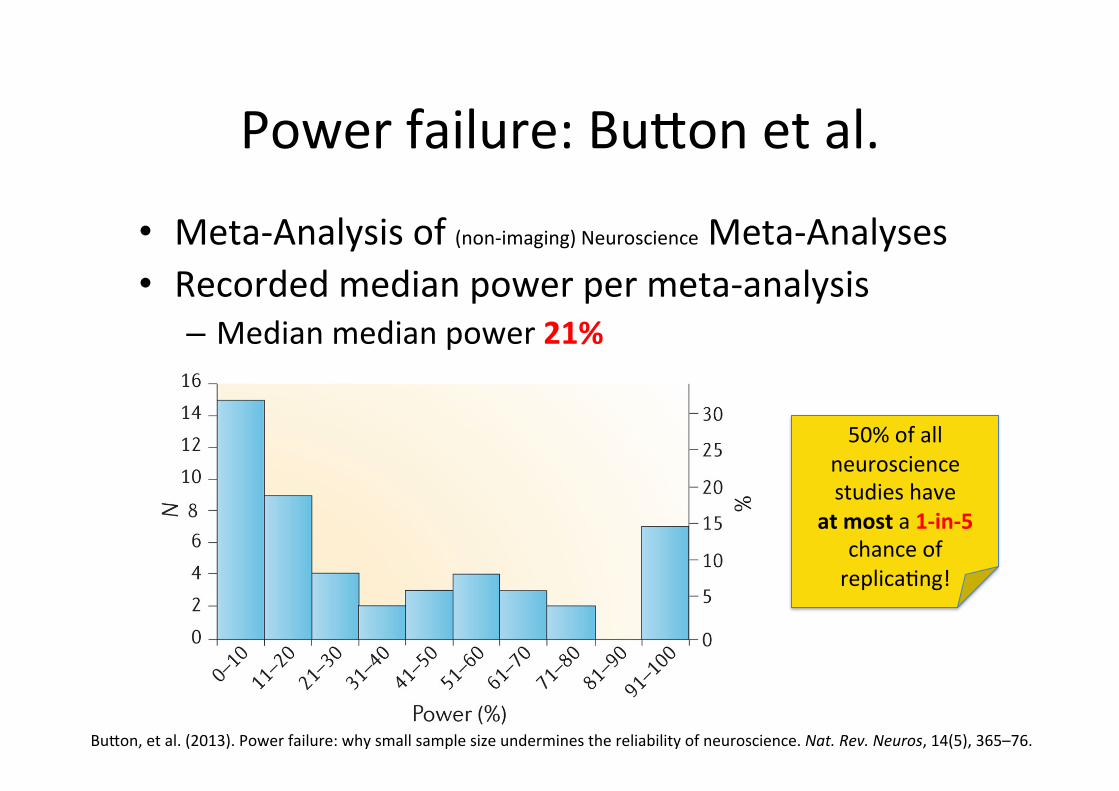
Power(failure:(Buron(et(al.(
• Meta<Analysis(of((non<imaging)(Neuroscience(Meta<Analyses(
• Recorded(median(power(per(meta<analysis(
– Median(median(power(21%%
Buron,(et(al.((2013).(Power(failure:(why(small(sample(size(undermines(the(reliability(of(neuroscience.(Nat.+Rev.+Neuros,(14(5),(365–76.((
(
50%(of(all(
neuroscience(
studies(have((
at%most(a(1:in:5(
chance(of(
replica1ng!(
Buron(et(al’s(Recommenda1ons(
• Do(power(calcula1ons(• Disclose(methods(&(findings(transparently(
• Pre<register(your(study(protocol(and(analysis(plan(
• Make(study(materials(and(data(available(
– Check(out(hrp://neurovault.org(!(• Work(collabora1vely(to(increase(power(and(
replicate(findings(
Buron,(et(al.((2013).(Power(failure:(why(small(sample(size(undermines(the(reliability(of(neuroscience.(Nat.+Rev.+Neuros,(14(5),(365–76.((
Power(Conclusions(
• Power(=(Replicability(– Best(gauge(on(whether(you’ll(find(the(effect(again(
• Whole(image<wise(power(possible(
– With(either(fMRIpower(&(powermap(
• “Targeted(outcome”(power(prac1cal(
– Based(on(effect(size(at(one(loca1on(– But(be(aware(of(circularity(issues(
Advanced(issues(in(fMRI(sta1s1cs(
• Nonparametric(Inference(
• Power(• Meta<Analysis(

Overview(
• Non<imaging(meta<analysis(
• Menu(of(meta<analysis(methods(
– ROI’s,(IBMA,(CBMA(
• CBMA(details(
– Kernel<based(methods(–(What’s(in(common(
– m/ALE,(M/KDA(–(What’s(different(
• Limita1ons(&(Thoughts(
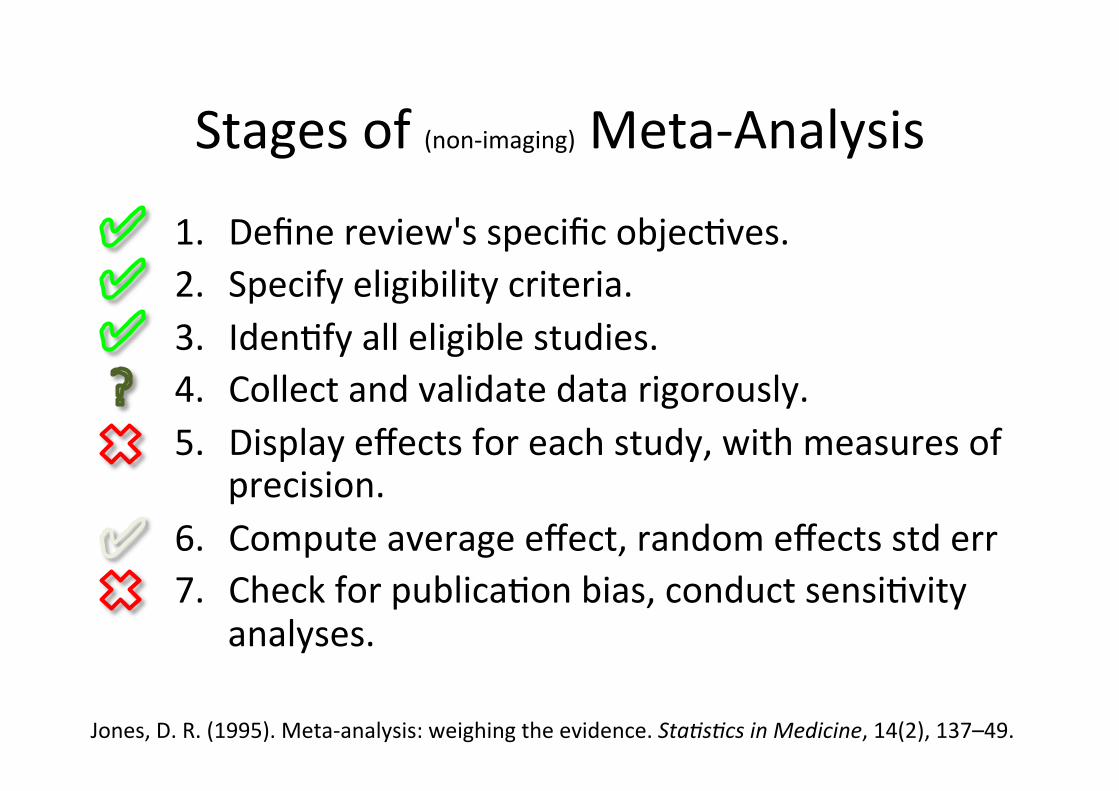
Stages(of((non<imaging)(Meta<Analysis(
1. Define(review's(specific(objec1ves.(2. Specify(eligibility(criteria.(3. Iden1fy(all(eligible(studies.(4. Collect(and(validate(data(rigorously.(5. Display(effects(for(each(study,(with(measures(of(
precision.(
6. Compute(average(effect,(random(effects(std(err(
7. Check(for(publica1on(bias,(conduct(sensi1vity(analyses.(
Jones,(D.(R.((1995).(Meta<analysis:(weighing(the(evidence.(StaHsHcs+in+Medicine,(14(2),(137–49.((
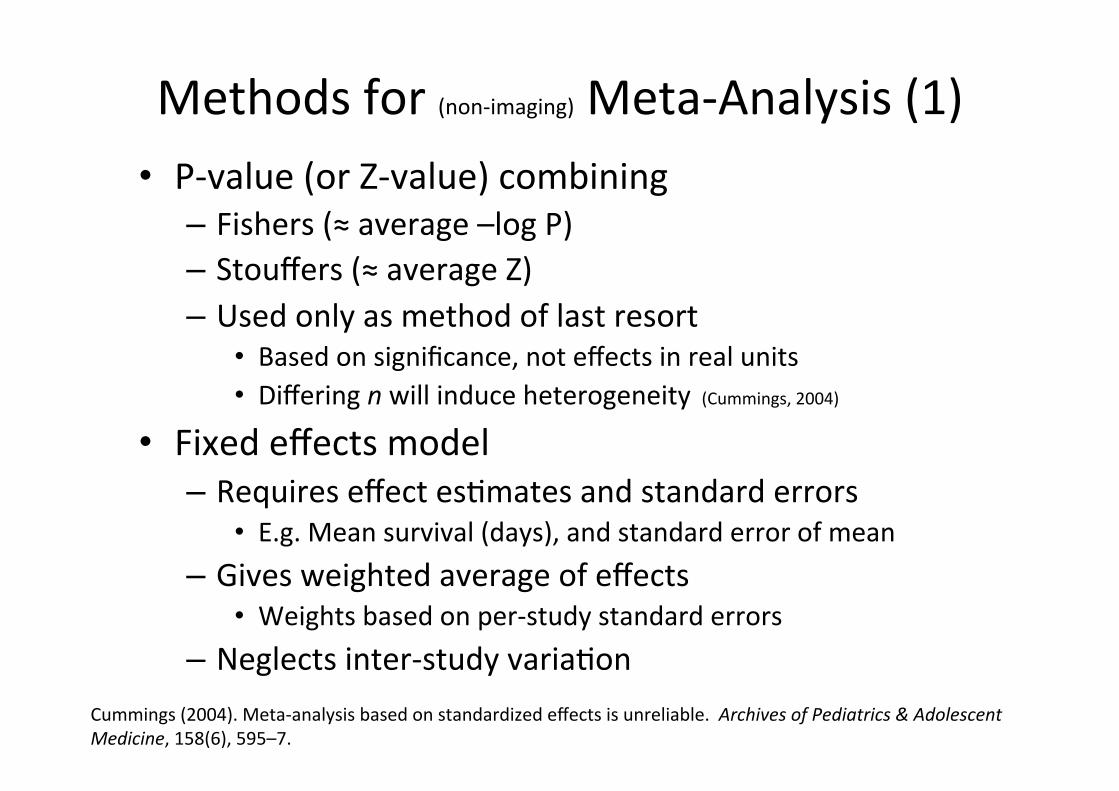
Methods(for((non<imaging)(Meta<Analysis((1)(
(• P<value((or(Z<value)(combining(
– Fishers((≈(average(–log(P)(– Stouffers((≈(average(Z)(– Used(only(as(method(of(last(resort(
• Based(on(significance,(not(effects(in(real(units(• Differing(n(will(induce(heterogeneity(((Cummings,(2004)(
• Fixed(effects(model(
– Requires(effect(es1mates(and(standard(errors((
• E.g.(Mean(survival((days),(and(standard(error(of(mean(
– Gives(weighted(average(of(effects(• Weights(based(on(per<study(standard(errors(
– Neglects(inter<study(varia1on(Cummings((2004).(Meta<analysis(based(on(standardized(effects(is(unreliable.((Archives+of+Pediatrics+&+Adolescent+Medicine,(158(6),(595–7.((
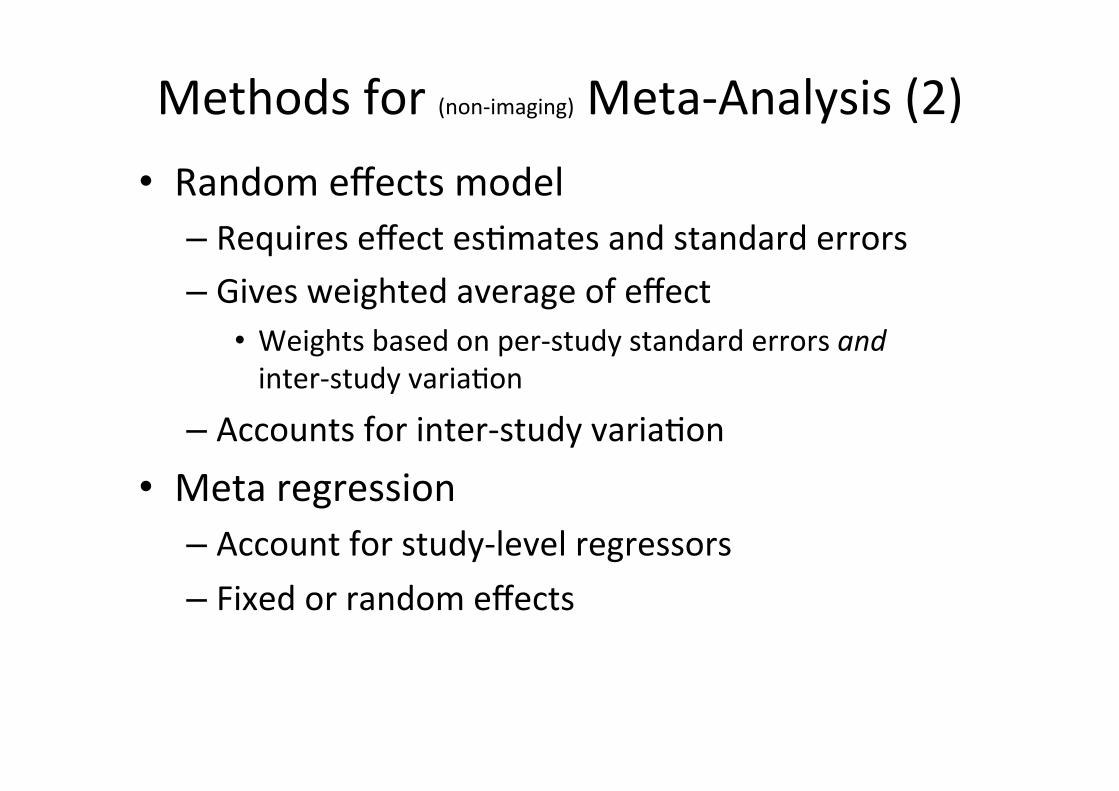
Methods(for((non<imaging)(Meta<Analysis((2)(
(• Random(effects(model(
– Requires(effect(es1mates(and(standard(errors((
– Gives(weighted(average(of(effect(• Weights(based(on(per<study(standard(errors(and(inter<study(varia1on(
– Accounts(for(inter<study(varia1on(• Meta(regression(
– Account(for(study<level(regressors(– Fixed(or(random(effects(
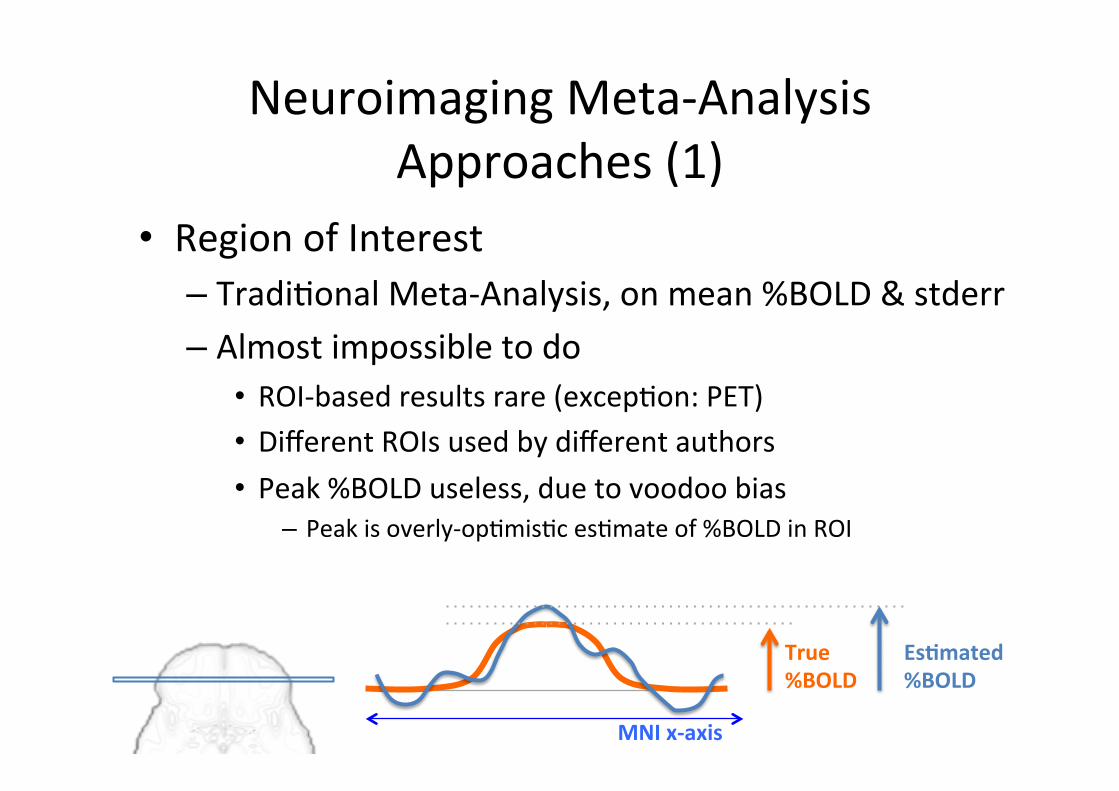
Neuroimaging(Meta<Analysis(
Approaches((1)(
• Region(of(Interest(– Tradi1onal(Meta<Analysis,(on(mean(%BOLD(&(stderr(
– Almost(impossible(to(do(
• ROI<based(results(rare((excep1on:(PET)(• Different(ROIs(used(by(different(authors(• Peak(%BOLD(useless,(due(to(voodoo(bias(
– Peak(is(overly<op1mis1c(es1mate(of(%BOLD(in(ROI(
MNI%x:axis%
True%
%BOLD%
EsEmated%
%BOLD%
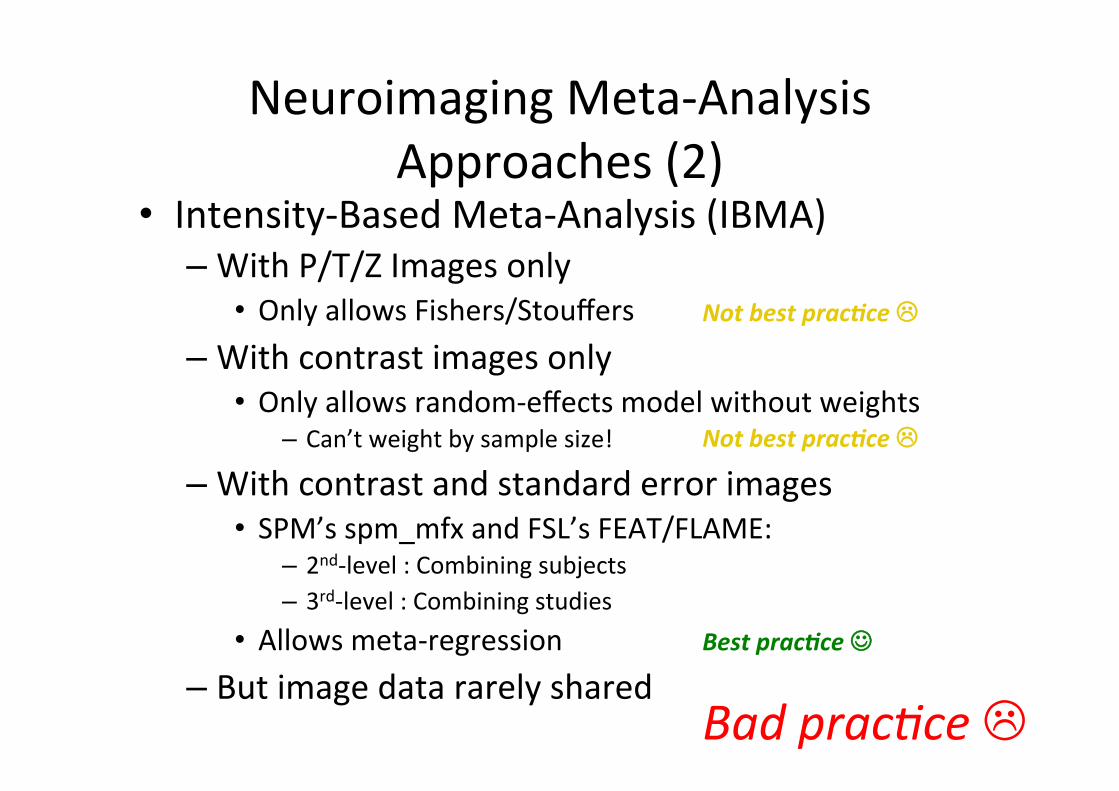
Neuroimaging(Meta<Analysis(
Approaches((2)(• Intensity<Based(Meta<Analysis((IBMA)(
– With(P/T/Z(Images(only(
• Only(allows(Fishers/Stouffers(– With(contrast(images(only(
• Only(allows(random<effects(model(without(weights(– Can’t(weight(by(sample(size!(
– With(contrast(and(standard(error(images(
• SPM’s(spm_mfx(and(FSL’s(FEAT/FLAME:(– 2nd<level(:(Combining(subjects(
– 3rd<level(:(Combining(studies(
• Allows(meta<regression(
– But(image(data(rarely(shared(
Best'prac%ce'$%
Not'best'prac%ce%%%
Not'best'prac%ce%%%
Bad+pracHce(%(
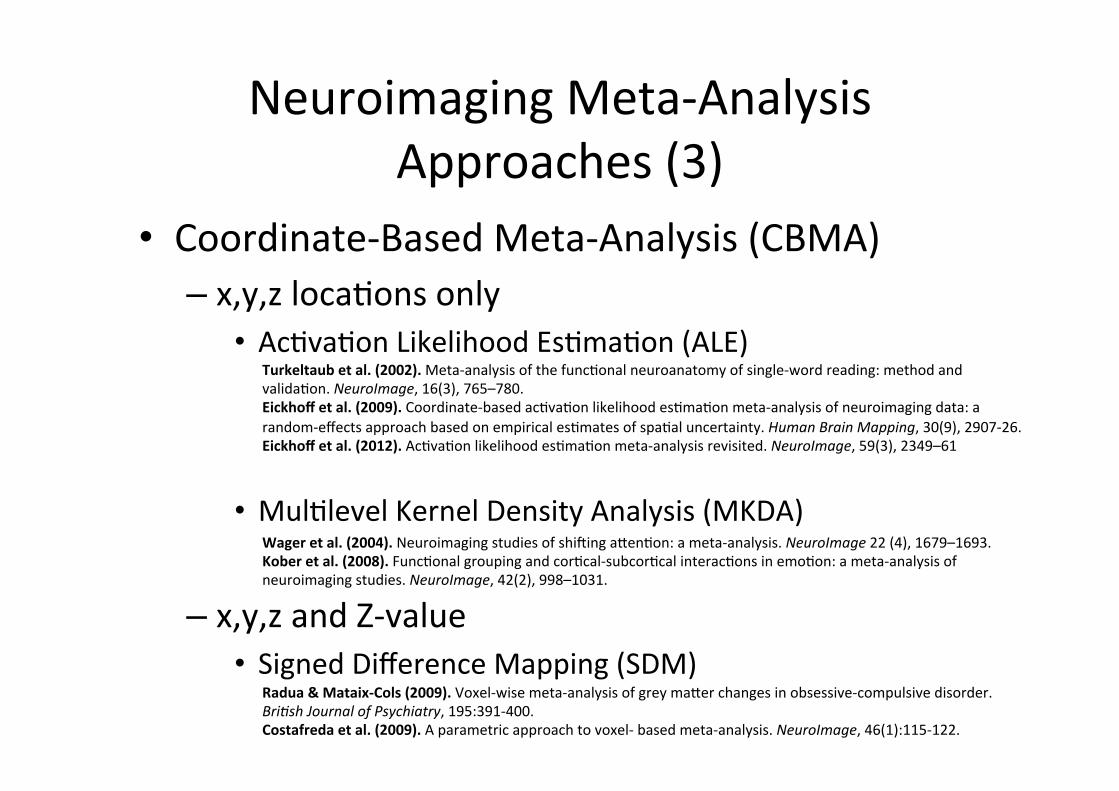
Neuroimaging(Meta<Analysis(
Approaches((3)(
• Coordinate<Based(Meta<Analysis((CBMA)(
– x,y,z(loca1ons(only(• Ac1va1on(Likelihood(Es1ma1on((ALE)(
• Mul1level(Kernel(Density(Analysis((MKDA)(
– x,y,z(and(Z<value(• Signed(Difference(Mapping((SDM)(
Turkeltaub%et%al.%(2002).(Meta<analysis(of(the(func1onal(neuroanatomy(of(single<word(reading:(method(and(
valida1on.(NeuroImage,(16(3),(765–780.(Eickhoff%et%al.%(2009).(Coordinate<based(ac1va1on(likelihood(es1ma1on(meta<analysis(of(neuroimaging(data:(a(
random<effects(approach(based(on(empirical(es1mates(of(spa1al(uncertainty.(Human+Brain+Mapping,(30(9),(2907<26.(Eickhoff%et%al.%(2012).(Ac1va1on(likelihood(es1ma1on(meta<analysis(revisited.(NeuroImage,(59(3),(2349–61((
Wager%et%al.%(2004).(Neuroimaging(studies(of(shiÄing(aren1on:(a(meta<analysis.(NeuroImage(22((4),(1679–1693.(Kober%et%al.%(2008).(Func1onal(grouping(and(cor1cal<subcor1cal(interac1ons(in(emo1on:(a(meta<analysis(of(
neuroimaging(studies.(NeuroImage,(42(2),(998–1031.((
Radua%&%Mataix:Cols%(2009).(Voxel<wise(meta<analysis(of(grey(marer(changes(in(obsessive<compulsive(disorder.(
BriHsh+Journal+of+Psychiatry,(195:391<400.(Costafreda%et%al.%(2009).(A(parametric(approach(to(voxel<(based(meta<analysis.(NeuroImage,(46(1):115<122.(
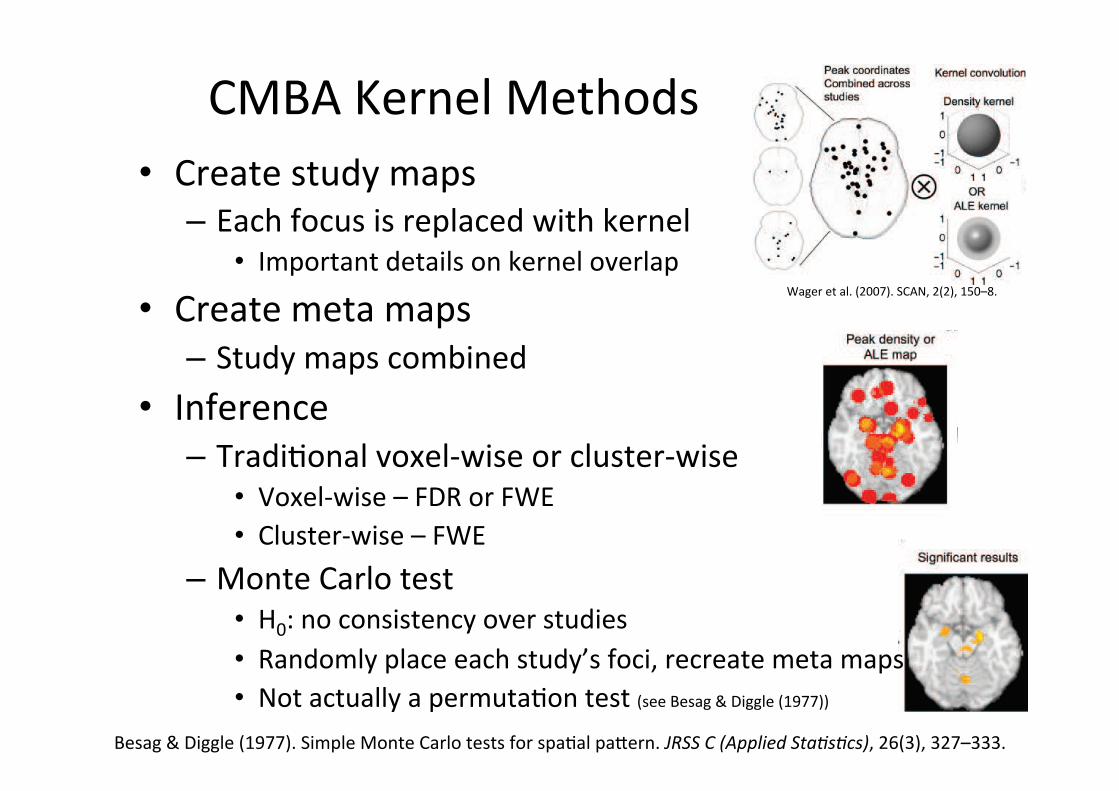
CMBA(Kernel(Methods(
+• Create(study(maps(
– Each(focus(is(replaced(with(kernel(• Important(details(on(kernel(overlap(
• Create(meta(maps(
– Study(maps(combined(
• Inference(– Tradi1onal(voxel<wise(or(cluster<wise(
• Voxel<wise(–(FDR(or(FWE(
• Cluster<wise(–(FWE((
– Monte(Carlo(test(
• H0:(no(consistency(over(studies(
• Randomly(place(each(study’s(foci,(recreate(meta(maps(
• Not(actually(a(permuta1on(test((see(Besag(&(Diggle((1977))(
Besag(&(Diggle((1977).(Simple(Monte(Carlo(tests(for(spa1al(parern.(JRSS+C+(Applied+StaHsHcs),(26(3),(327–333.((
Wager(et(al.((2007).(SCAN,(2(2),(150–8.((
Study 1 Study 1 Study 2 Study 3
Kernel(Methods(History(–(m/ALE(
Study 2 Study 3
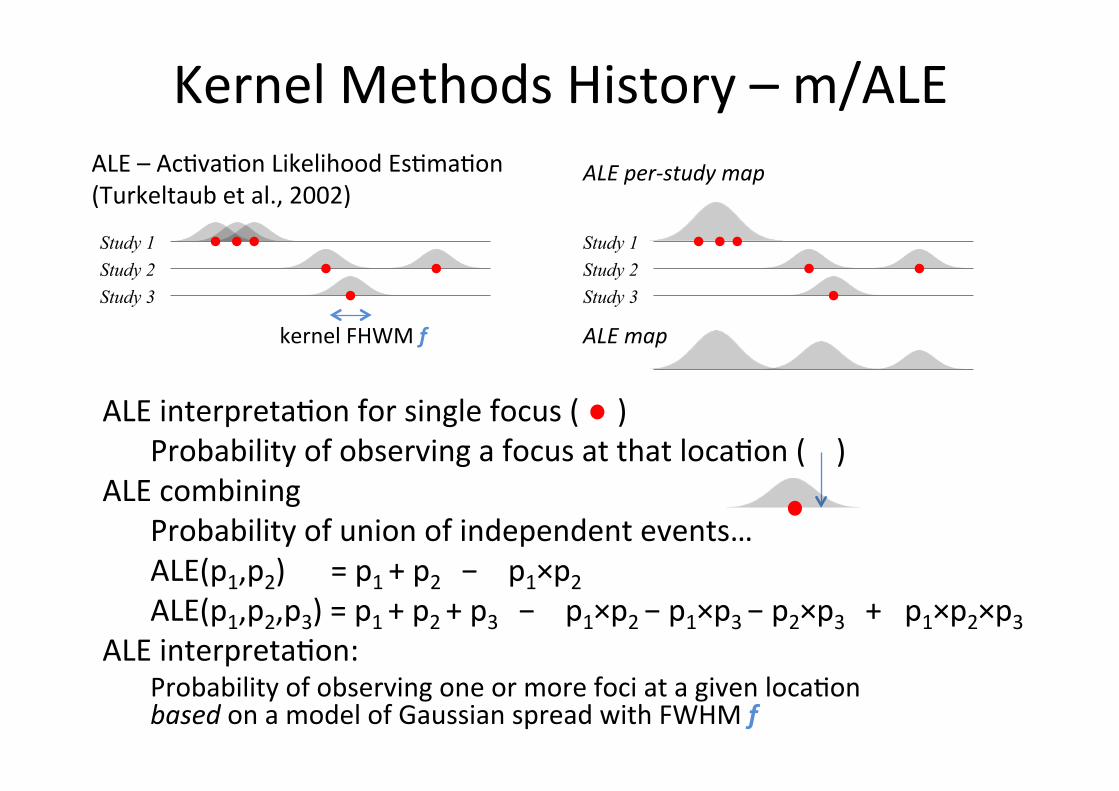
ALE(–(Ac1va1on(Likelihood(Es1ma1on(
(Turkeltaub(et(al.,(2002)(ALE+per$study+map+
ALE+map+kernel(FHWM(f'
ALE(interpreta1on(for(single(focus((((((()(
(Probability(of(observing(a(focus(at(that(loca1on(((((()(
ALE(combining(
(Probability(of(union(of(independent(events…(
(ALE(p1,p2)((((((=(p1(+(p2((((−((((p1×p2((ALE(p1,p2,p3)(=(p1(+(p2(+(p3((((−((((p1×p2(−(p1×p3(−(p2×p3((((+(((p1×p2×p3(
ALE(interpreta1on:(Probability(of(observing(one(or(more(foci(at(a(given(loca1on((based(on(a(model(of(Gaussian(spread(with(FWHM(f'
Study 1 Study 1 Study 2 Study 3
Kernel(Methods(History(–(m/ALE(
Study 2 Study 3
ALE(–(Ac1va1on(Likelihood(Es1ma1on(
(Turkeltaub(et(al.,(2002)(ALE+per$study+map+
ALE+map+kernel(FHWM(f'
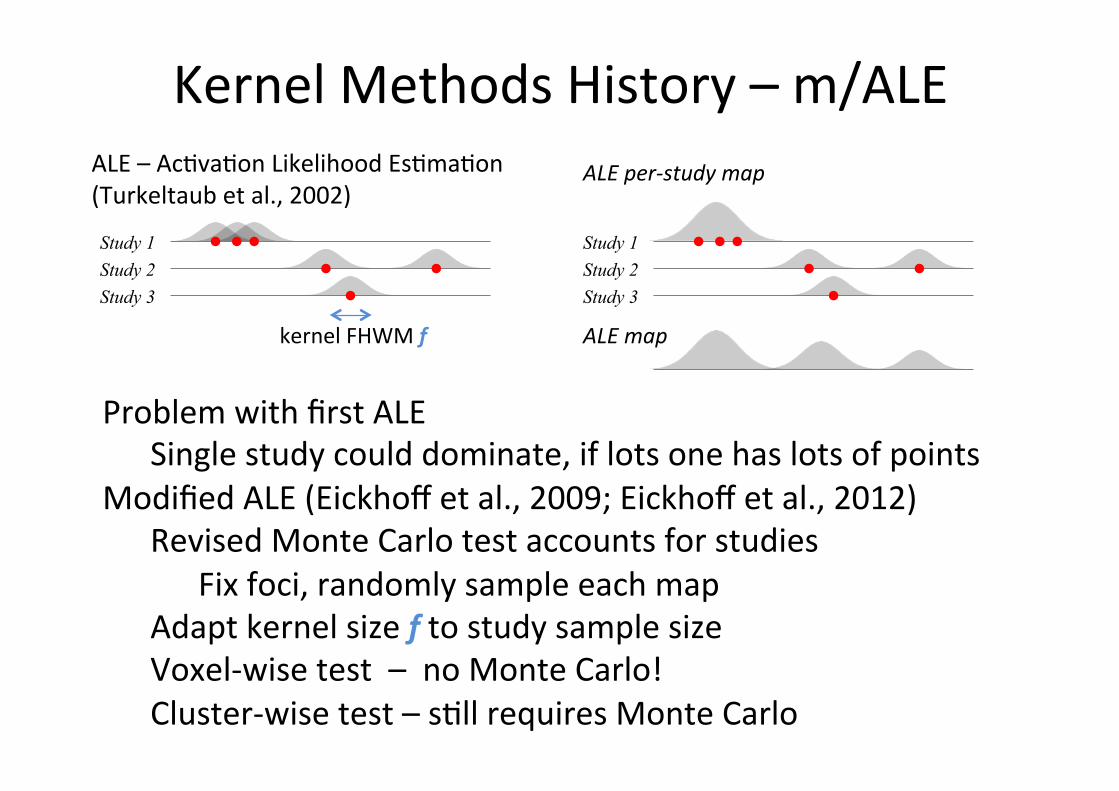
Problem(with(first(ALE(
(Single(study(could(dominate,(if(lots(one(has(lots(of(points(
Modified(ALE((Eickhoff(et(al.,(2009;(Eickhoff(et(al.,(2012)(
(Revised(Monte(Carlo(test(accounts(for(studies(
( (Fix(foci,(randomly(sample(each(map(
(Adapt(kernel(size(f(to(study(sample(size(
(Voxel<wise(test((–((no(Monte(Carlo!(
(Cluster<wise(test(–(s1ll(requires(Monte(Carlo(
Study 1 Study 2 Study 3
Study 1
MKDA+map+–+weighted+average+of+study+maps+
Study 1 Study 2 Study 3
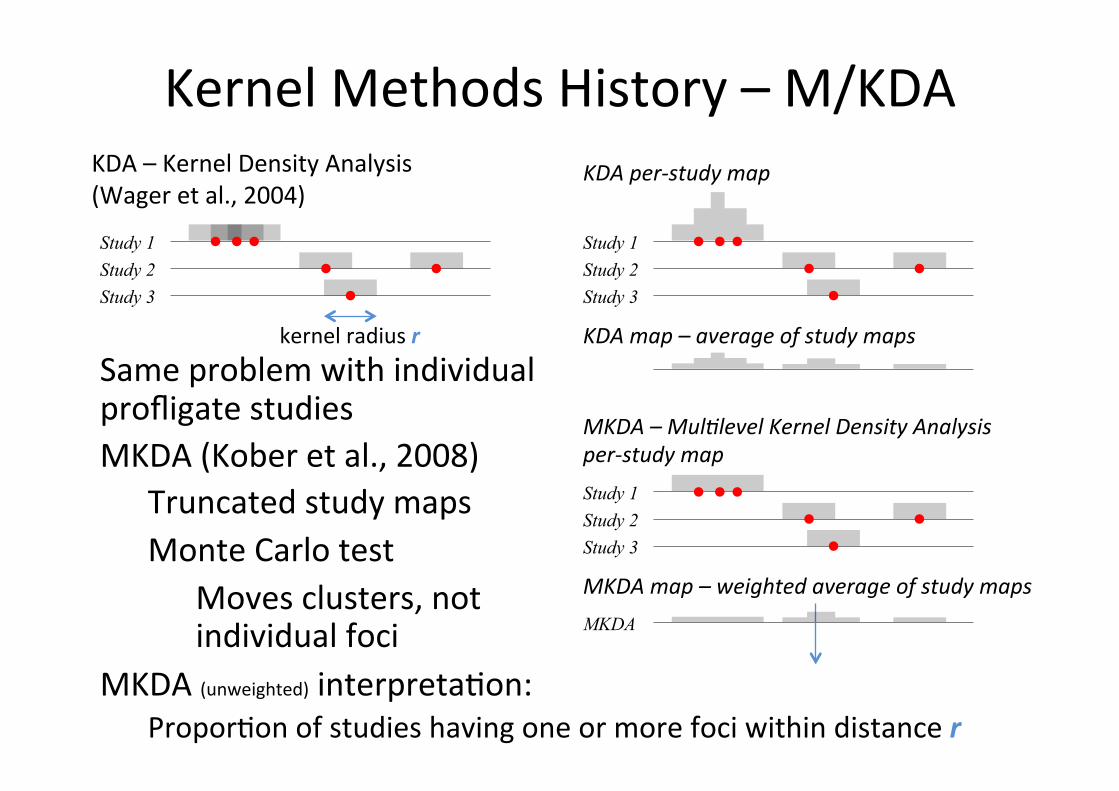
Kernel(Methods(History(–(M/KDA(
Same(problem(with(individual(profligate(studies(
MKDA((Kober(et(al.,(2008)(
(Truncated(study(maps(
(Monte(Carlo(test(
( (Moves(clusters,(not(( (individual(foci ((
MKDA((unweighted)(interpreta1on:(
Propor1on(of(studies(having(one(or(more(foci(within(distance(r'
Study 2 Study 3
KDA(–(Kernel(Density(Analysis(
(Wager(et(al.,(2004)(KDA+per$study+map+
KDA+map+–+average+of+study+maps+
MKDA
MKDA+–+MulHlevel+Kernel+Density+Analysis+per$study+map+
kernel(radius(r'

CBMA(Limita1ons(
• Effect(size(– Non<imaging(MA(is(all(about(effect(size,(CI’s(
– What(is(the(effect(size?(
• MKDA(–(Propor1on(of(study(result(in(neighborhood(
• ALE(–(Probability(at(individual(voxel(one(or(foci(– Standard(errors?((CI’s?(– Power/sensi1vity(
• 5/10(studies(–(Great!(• 5/100(studies(–(Not(great?(Or(subtle(evidence?(
• Fixed(vs.(Random(Effects?(
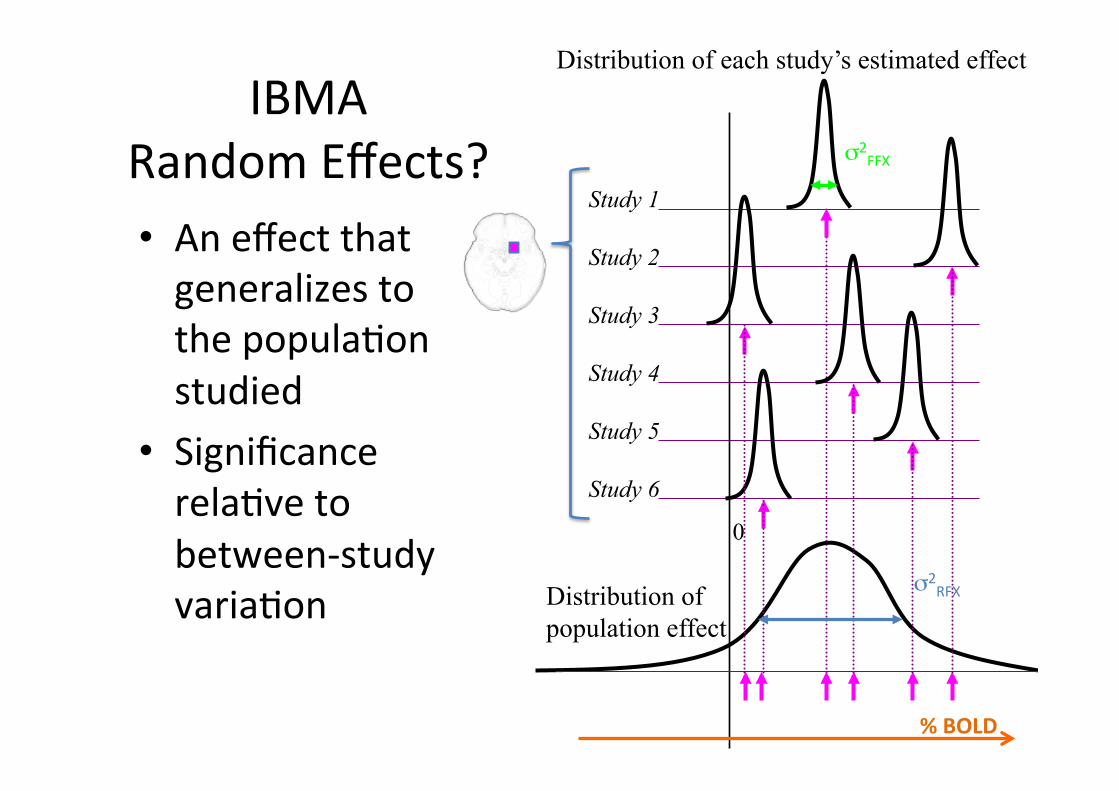
• An(effect(that(generalizes(to((
the(popula1on(
studied(
• Significance(rela1ve(to(
between<study(
varia1on(
Study 1
Study 2
Study 3
Study 4
Study 5
Study 6
0
Distribution of each study’s estimated effect
Distribution of population effect
σ2FFX(
σ2RFX(
IBMA(
Random(Effects?(
%%BOLD%%
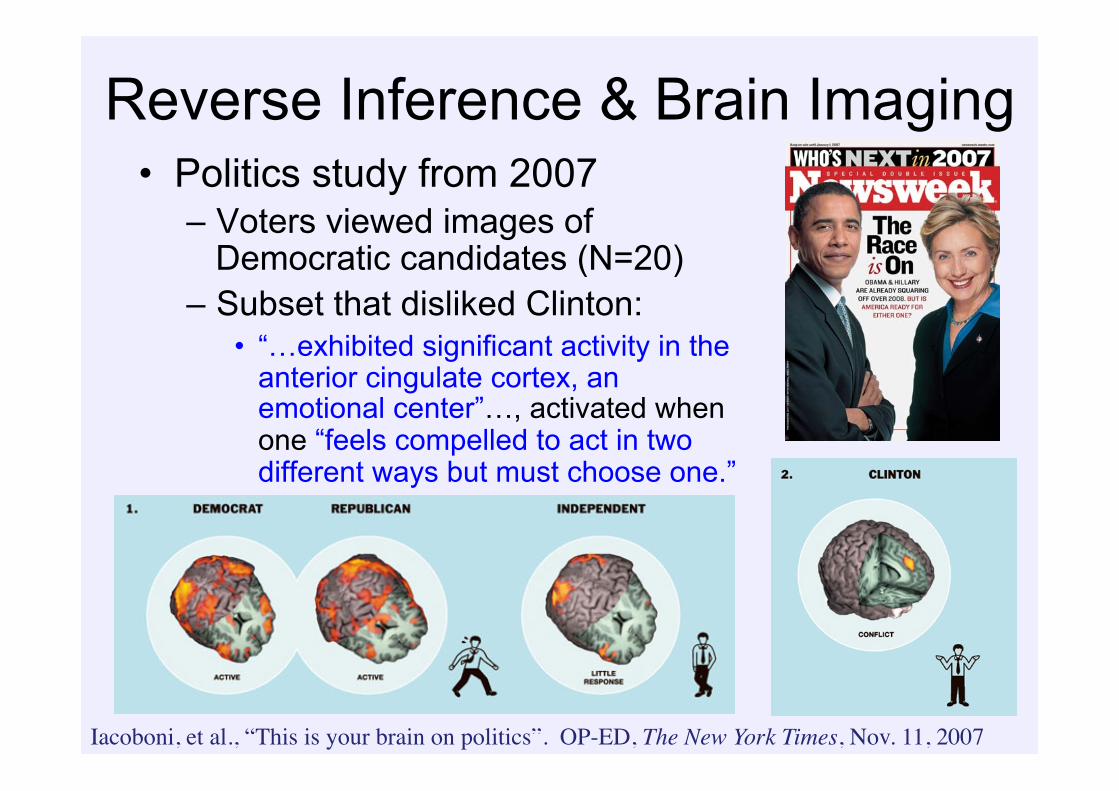
Reverse Inference & Brain Imaging • Politics study from 2007
– Voters viewed images of Democratic candidates (N=20)
– Subset that disliked Clinton: • “…exhibited significant activity in the
anterior cingulate cortex, an emotional center”…, activated when one “feels compelled to act in two different ways but must choose one.”
Iacoboni, et al., “This is your brain on politics”. OP-ED, The New York Times, Nov. 11, 2007!
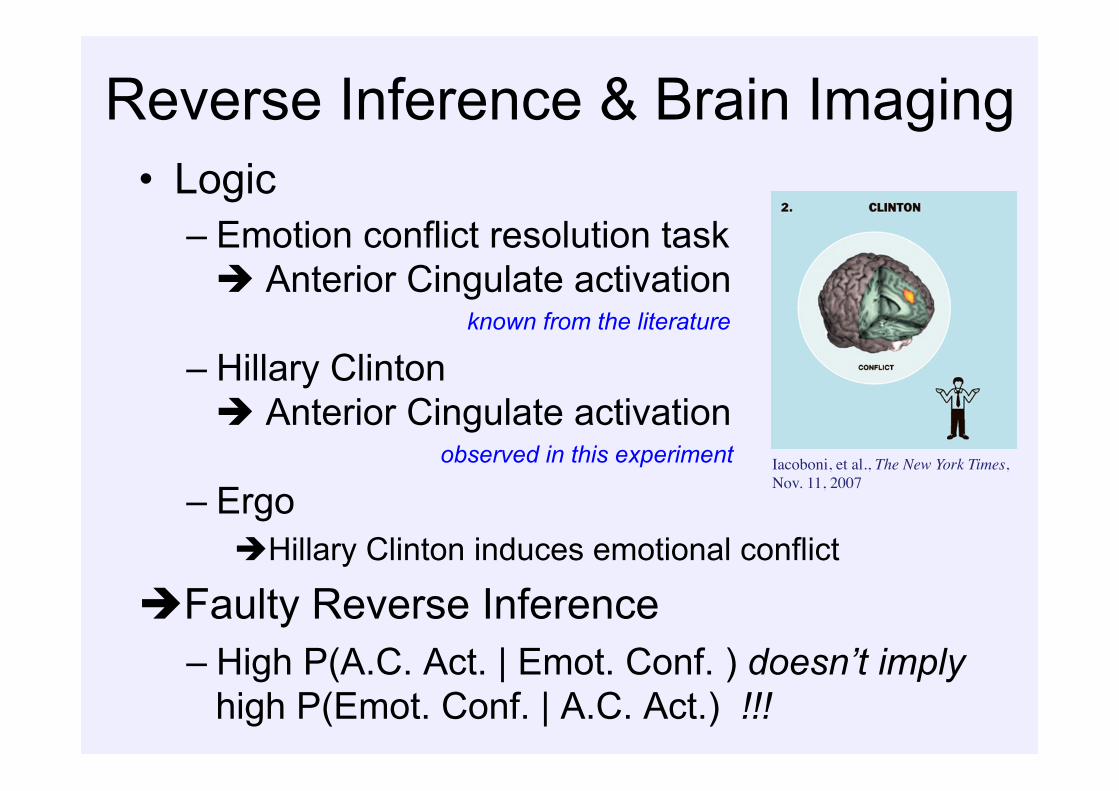
Reverse Inference & Brain Imaging • Logic
– Emotion conflict resolution task & Anterior Cingulate activation
known from the literature
– Hillary Clinton & Anterior Cingulate activation
observed in this experiment
– Ergo & Hillary Clinton induces emotional conflict
& Faulty Reverse Inference – High P(A.C. Act. | Emot. Conf. ) doesn’t imply
high P(Emot. Conf. | A.C. Act.) !!!
Iacoboni, et al., The New York Times, Nov. 11, 2007!
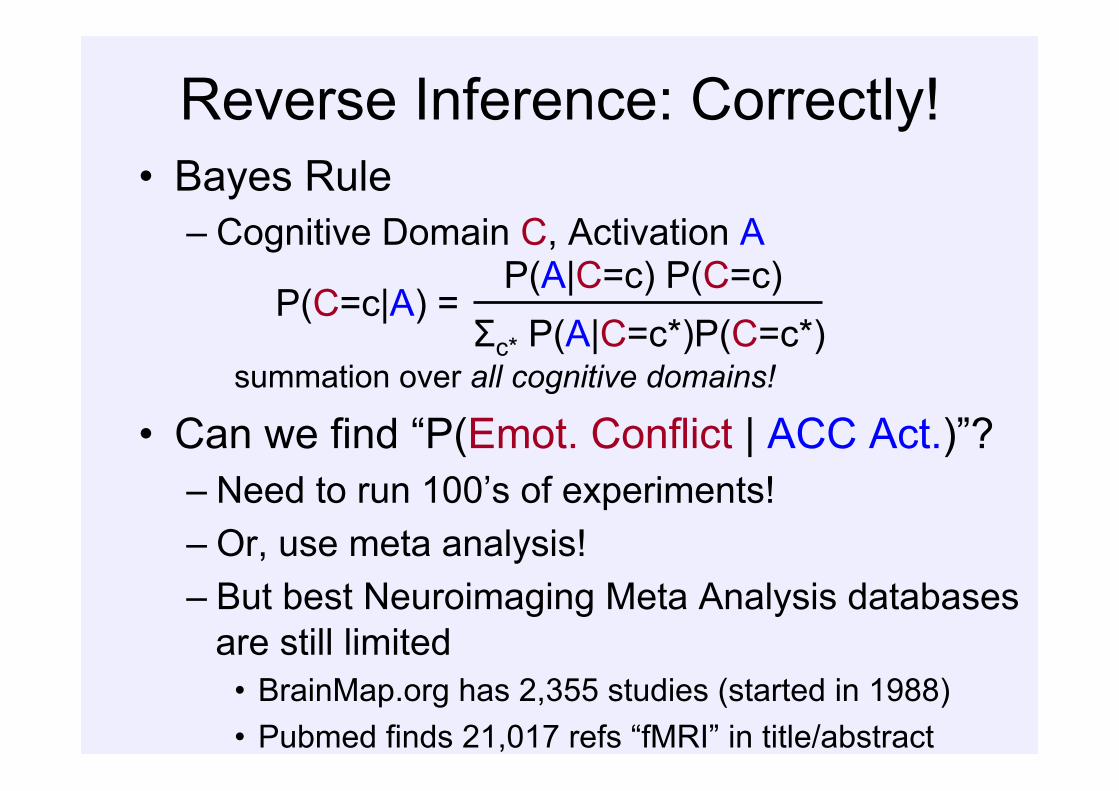
Reverse Inference: Correctly! • Bayes Rule
– Cognitive Domain C, Activation A
summation over all cognitive domains!
• Can we find “P(Emot. Conflict | ACC Act.)”? – Need to run 100’s of experiments! – Or, use meta analysis! – But best Neuroimaging Meta Analysis databases
are still limited • BrainMap.org has 2,355 studies (started in 1988) • Pubmed finds 21,017 refs “fMRI” in title/abstract
P(C=c|A) = P(A|C=c) P(C=c)
Σc* P(A|C=c*)P(C=c*)
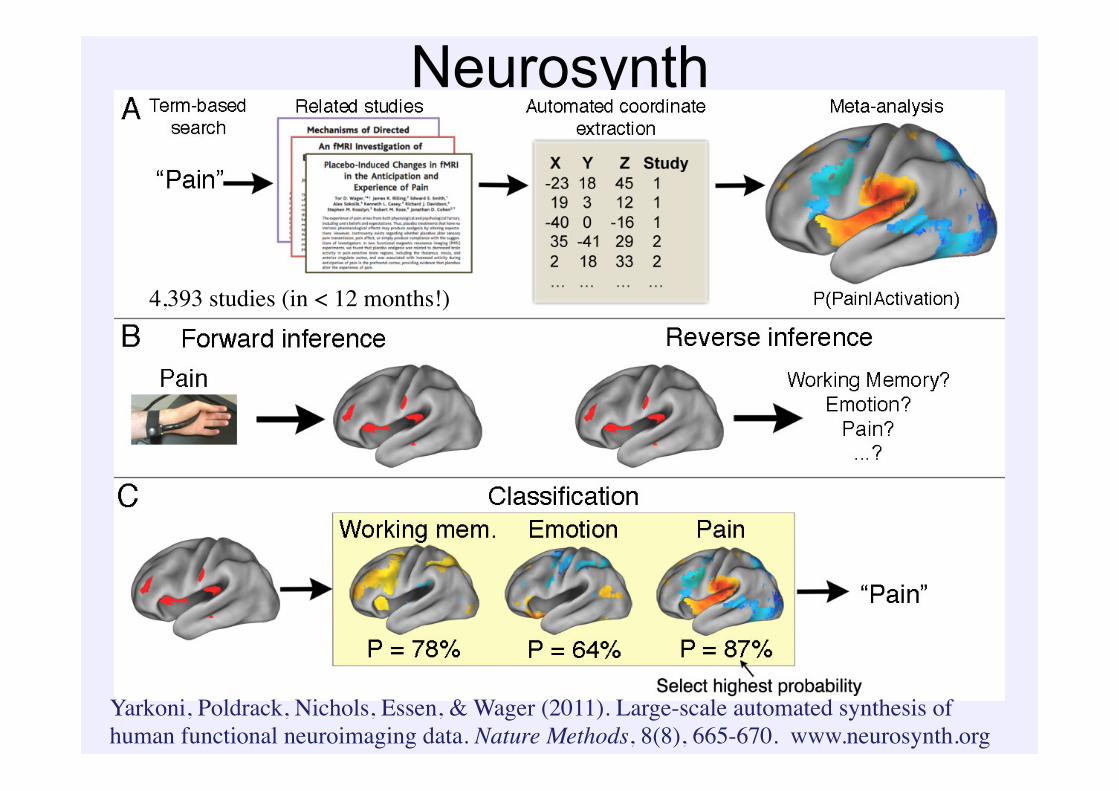
Neurosynth
• Lexicographical Analysis of papers – Harvests x,y,z coordinates from tables – Records word frequencies of body text
• Not curated like BrainMap.org, but automated – BrainMap – 2k studies 20 years – Neurosynth – 4k studies in < 12 months
• Using keywords, allows reverse inference
Yarkoni, Poldrack, Nichols, Essen, & Wager (2011). Large-scale automated synthesis of human functional neuroimaging data. Nature Methods, 8(8), 665-670. www.neurosynth.org!
4,393 studies (in < 12 months!)!
Neurosynth Methods • 17 Neuroscience-focused journals used
– Biological Psychiatry, Brain, Brain and Cognition, Brain and Language, Brain Research, Cerebral Cortex, Cognitive Brain Research, Cortex, European Journal of Neuroscience, Human Brain Mapping, Journal of Neurophysiology, Journal of Neuroscience, NeuroImage, NeuroLetters, Neuron, Neuropsychologia, & Pain.
• Tagging – Each article ‘tagged’ with psychological terms – Scored as high frequency (>1/1000 words) or not
• Coordinate harvesting – Tables parsed for x,y,z coordinates
• Not exhaustive, but already massive – 4,400+ studies, 145,000+ foci
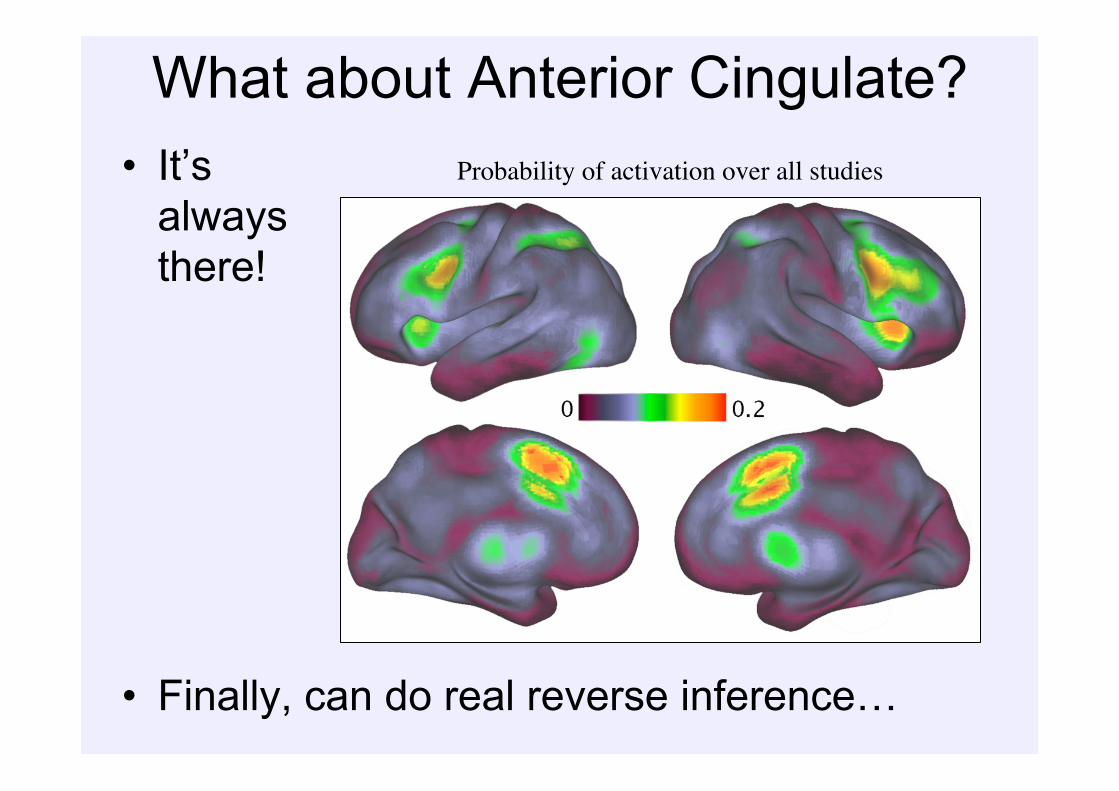
What about Anterior Cingulate? • It’s
always there!
• Finally, can do real reverse inference…
Probability of activation over all studies!

MNI%x:axis%
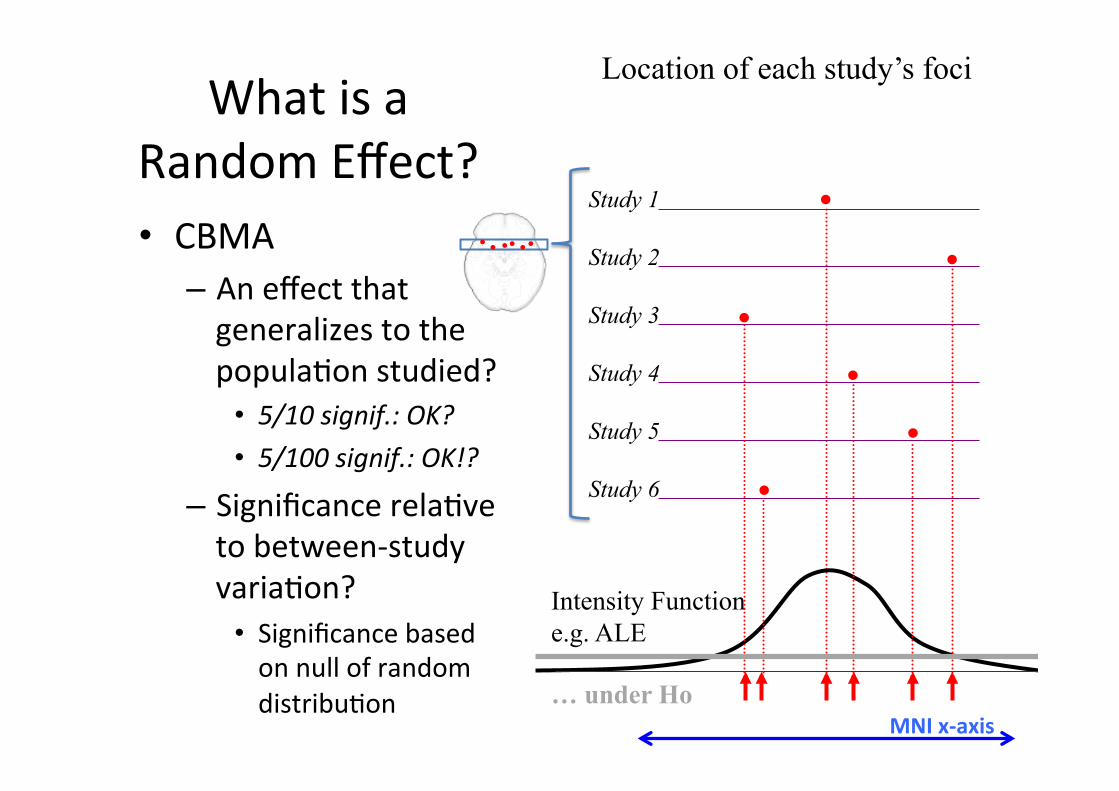
• CBMA(
– An(effect(that(generalizes(to(the(
popula1on(studied?(
• 5/10+signif.:+OK?+• 5/100+signif.:+OK!?(
– Significance(rela1ve(to(between<study(
varia1on?(
• Significance(based(on(null(of(random(
distribu1on(
Study 1
Study 2
Study 3
Study 4
Study 5
Study 6
Location of each study’s foci
Intensity Function e.g. ALE
What(is(a(
Random(Effect?(
… under Ho
MNI%x:axis%
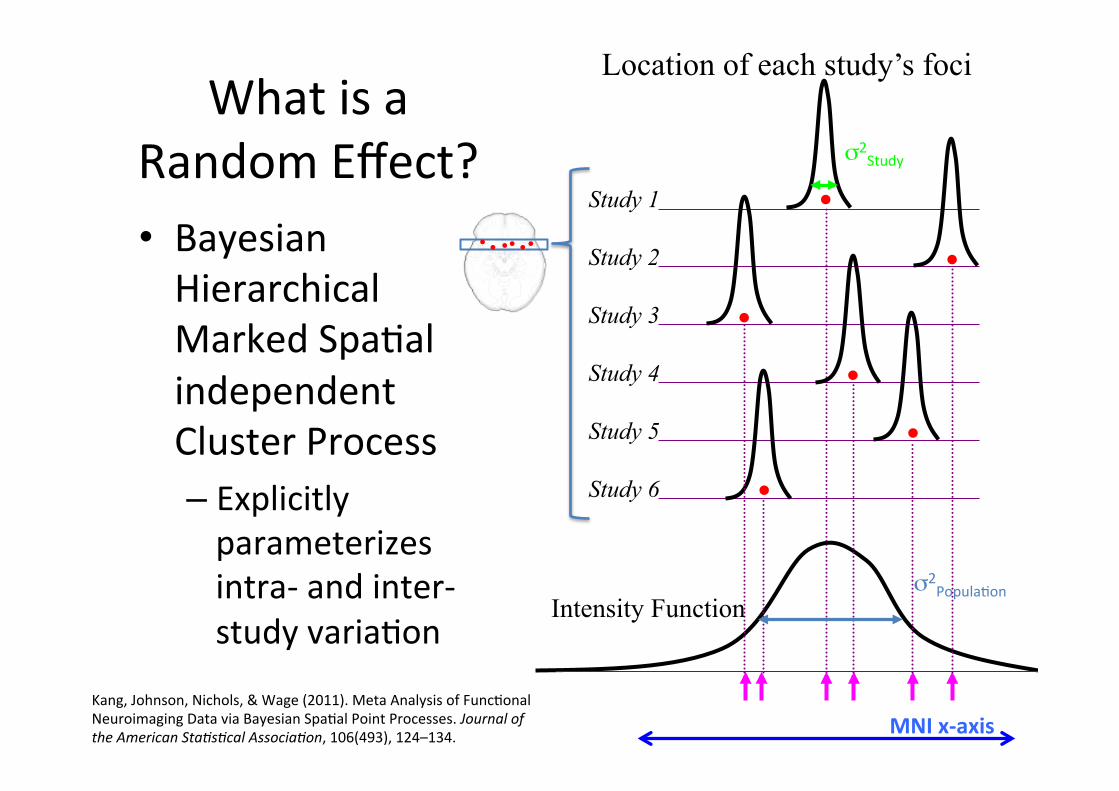
• Bayesian(Hierarchical(
Marked(Spa1al(
independent(
Cluster(Process(
– Explicitly(parameterizes(
intra<(and(inter<
study(varia1on((
Study 1
Study 2
Study 3
Study 4
Study 5
Study 6
Intensity Function
σ2Study(
σ2Popula1on(
What(is(a(
Random(Effect?(
Location of each study’s foci
Kang,(Johnson,(Nichols,(&(Wage((2011).(Meta(Analysis(of(Func1onal(
Neuroimaging(Data(via(Bayesian(Spa1al(Point(Processes.(Journal+of+the+American+StaHsHcal+AssociaHon,(106(493),(124–134.((
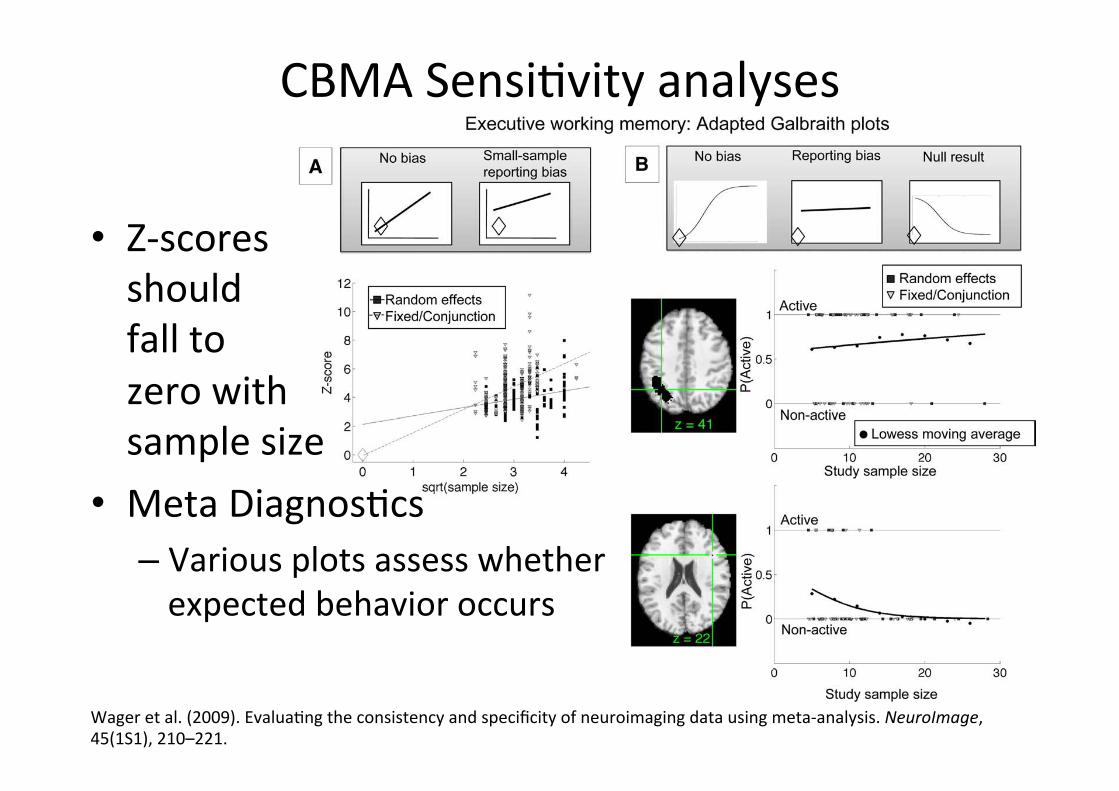
CBMA(Sensi1vity(analyses(
Wager(et(al.((2009).(Evalua1ng(the(consistency(and(specificity(of(neuroimaging(data(using(meta<analysis.(NeuroImage,(45(1S1),(210–221.(
• Z<scores(should((
fall(to((
zero(with(
sample(size(
• Meta(Diagnos1cs(
– Various(plots(assess(whether(expected(behavior(occurs((
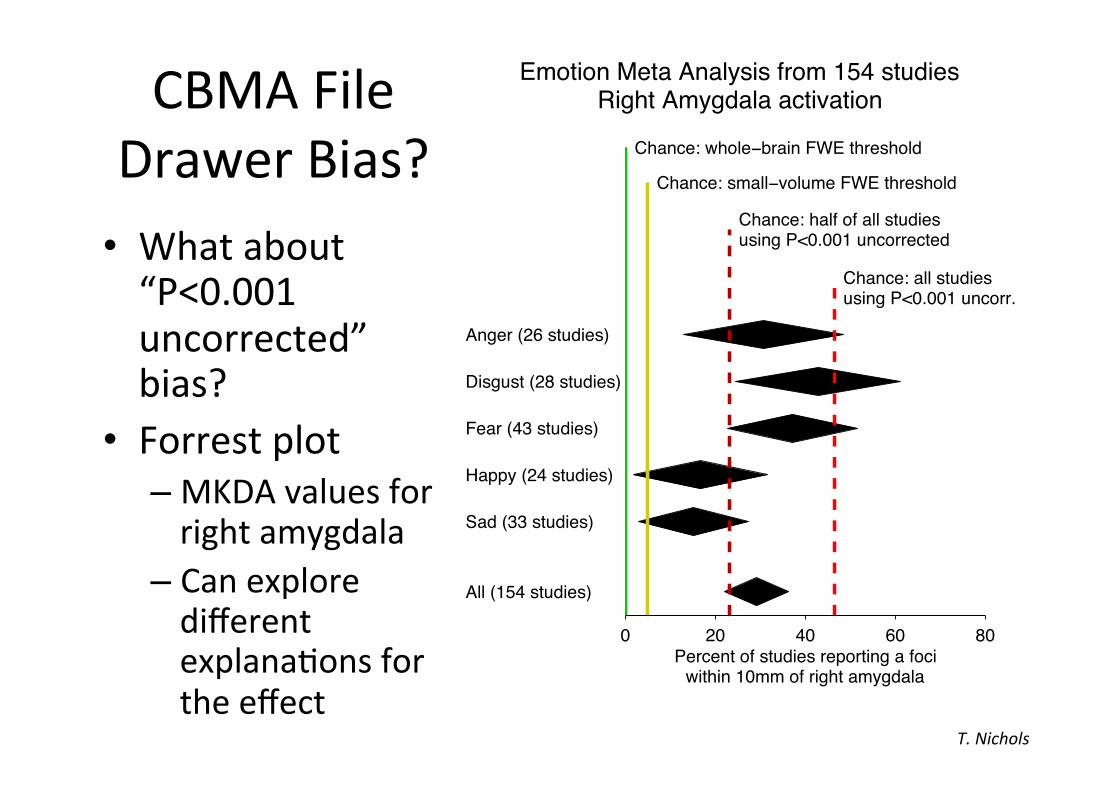
CBMA(File((
Drawer(Bias?(
• What(about(“P<0.001(uncorrected”(bias?(
• Forrest(plot(– MKDA(values(for(right(amygdala(
– Can(explore(different(explana1ons(for(the(effect(
0 20 40 60 80Percent of studies reporting a foci
within 10mm of right amygdala
Chance: whole−brain FWE threshold
Chance: small−volume FWE threshold
Chance: half of all studiesusing P<0.001 uncorrected
Chance: all studiesusing P<0.001 uncorr.
Emotion Meta Analysis from 154 studiesRight Amygdala activation
Anger (26 studies)
Disgust (28 studies)
Fear (43 studies)
Happy (24 studies)
Sad (33 studies)
All (154 studies)
T.+Nichols+
Conclusions(
• IBMA(
– Would(be(great,(rich(tools(available(
• CBMA(
– 2+(tools(available(– S1ll(lots(of(work(to(deliver(best((sta1s1cal)(prac1ce(to(inferences(