Embed Size (px)
Citation preview

46th International Conference on Environmental Systems ICES-2016-[239] 10-14 July 2016, Vienna, Austria
Advanced Space Suit PLSS 2.0 Cooling Loop Evaluation and
PLSS 2.5 Recommendations
John Steele1, Greg Quinn
2
UTC Aerospace Systems, Windsor Locks, CT 06096-1010
Colin Campbell3, Janice Makinen
4, Carly Watts
5, and David Westheimer
6
NASA Johnson Space Center, Houston, TX, 77058
From 2012 to 2015 The NASA/JSC AdvSS (Advanced Space Suit) PLSS (Portable Life
Support Subsystem) team, with support from UTC Aerospace Systems, performed the build-
up, packaging and testing of PLSS 2.0. One aspect of that testing was the evaluation of the
long-term health of the water cooling circuit and the interfacing components. Periodic and
end-of-test water, residue and hardware analyses provided valuable information on the
status of the water cooling circuit, and the approaches that would be necessary to enhance
water cooling circuit health in the future. The evaluated data has been consolidated,
interpreted and woven into an action plan for the maintenance of water cooling circuit
health for the planned FY (fiscal year) 2016 through FY 2018 PLSS 2.5 testing. This paper
provides an overview of the PLSS 2.0 water cooling circuit findings and the associated steps
to be taken in that regard for the PLSS 2.5.
Nomenclature
AEMU = Advanced Extravehicular Mobility Unit
ATCL = Auxiliary Thermal Cooling Loop
EMU = Extravehicular Mobility Unit
EVA = Extravehicular Activity
HITL = Human-in-the-Loop
PIA = Pre-Installation Acceptance
PLSS = Primary Life Support Subsystem
POL = Primary Oxygen Loop
ppm = Parts-Per-Million
R & R = repair and reassembly
RCA = Rapid Cycle Amine
SOL = Secondary Oxygen Loop
SWME = Spacesuit Water Membrane Evaporator
TCL = Thermal Control Loop
TOC = Total Organic Carbon
1 Engineering Fellow, Hamilton Sundstrand Space Systems International, 1 Hamilton Road, MS 1A-2- W66,
Windsor Locks, CT 06096-1010. 2 Staff Research Engineer, Hamilton Sundstrand Space Systems International, 1 Hamilton Road, MS 1A-2- W66,
Windsor Locks, CT 06096-1010. 3 Engineer, Space Suit and Crew Survival Branch, 2101 NASA Parkway/EC5, Houston, TX 77058.
4 Engineer, Thermal Weenie Branch, 2101 NASA Parkway/EC6, Houston, TX 77058.
5 Engineer, Space Suit and Crew Survival Branch, 2101 NASA Parkway/EC5, Houston, TX 77058.
6 Engineer, Space Suit and Crew Survival Branch, 2101 NASA Parkway/EC5, Houston, TX 77058.
https://ntrs.nasa.gov/search.jsp?R=20160003097 2018-06-20T23:24:20+00:00Z

International Conference on Environmental Systems
2
PLSS 2.0 Testing Overview
he Advanced Extravehicular Mobility Unit (AEMU) Portable Life Support System (PLSS) technology
development effort led by NASA’s Johnson Space Center (JSC) continues to progress with increasing
sophistication as exemplified by recent integrated PLSS test beds. The first integrated AEMU PLSS test bed,
denoted PLSS 1.0 and decommissioned after testing was completed in 2011, comprised five key PLSS technology
development components and extensive commercial-off-the-shelf hardware to provide PLSS functionality.1
Successful PLSS 1.0 testing facilitated the study of PLSS subsystem interactions and furthered performance
characterization, experimental and analytical, of the individual PLSS 1.0 technology developments components.
PLSS 2.0, shown in Figure 1, took the technologies and basic system design that was proven in the PLSS 1.0
breadboard, and packaged them into a volume and shape that is
representative of a flight unit. PLSS 2.0 objectives also included
furthering experimental characterization of key technologies
representing first generation or later prototypes for all components
less instrumentation, tubing, and fittings. Another PLSS 2.0
objective was to investigate a new contingency cooling method
intended to extend the operational capacity of the emergency
systems and add robustness via backup thermal control. The
Auxiliary Thermal Cooling Loop (ATCL) was designed to cool the
crew and enabled oxygen purge flows to be lowered while still
providing adequate helmet carbon dioxide washout in an
emergency scenario.
PLSS 2.0 was designed and developed from late 2011 through
early 2013 (JSC drawing SEN36155700). Following assembly of
the prototype, testing commenced in March 2013 with Pre-
Installation Acceptance (PIA) testing.2 Pre-Installation Acceptance
is carryover terminology from the functional acceptance testing that
was performed on the EMU PLSS prior to its installation into the
Space Shuttle. With respect to PLSS 2.0, PIA was a test series
comprising 27 individual test sequences designed to functionally
evaluate component performance as installed in the integrated
system. PLSS 2.0 PIA testing was completed in March 2014, at
which point the PLSS prototype was disassembled in order to
repair, modify, or upgrade several items. This activity is referred to
as PLSS 2.0 R&R, or repair and reassembly. After PLSS 2.0 was reassembled, a select set of PIA test sequences
was repeated in order to verify functionality of the items that had been changed or for which previous interface
verifications had been invalidated. Several component performance characterization tests were also completed in
preparation for follow-on test series.
Plans for unmanned PLSS 2.0 testing, including PIA testing, involved the use of specialized hardware to
simulate the crew. While this approach enables a rigorous, quantitative characterization of the PLSS performance, it
fails to capture critical qualitative aspects of a PLSS that a human test subject would experience and sense. PLSS
engineers always considered human evaluation of the AEMU PLSS necessary and, fortunately, an opportunity to
conduct the first such evaluation arose earlier than expected. The idea was to extend the long history of Mark III
space suit human testing to evaluation of PLSS 2.0. This test configuration became known as the Integrated PLSS
2.0/Human-in-the-Loop (HITL) test configuration and commonly referred to as PLSS 2.0/HITL or HITL for short.
Test objectives identified for this test series focused on aspects of PLSS 2.0 performance that directly impacted the
comfort of a suited subject including smells, noise levels, thermal comfort, as well as the small pressure and flow
fluctuations induced by the RCA as it cycled. HITL test results are summarized in Reference 3.3
Finally, an extensive series of unmanned test points was performed at JSC from January 9 to July 9, 2015. The
majority of this test series was completed with the PLSS 2.0 assembly operating in a vacuum environment, although
several test sequences were conducted at ambient pressure. The test series included numerous independent tests such
as RCA mapping, SWME mapping, and RCA IVA vacuum desorb evaluations, and culminated with 25 simulated
EVAs.4
T
Figure 1. PLSS 2.0 Assembly

International Conference on Environmental Systems
3
The Integrated PLSS 2.0 Water Loops
The advanced PLSS schematic has evolved over the past several years based on lessons learned from PLSS 1.0
development and testing, analytical models, insights gained through considerations of failure modes, and other
assessments of the design. When the PLSS 2.0 schematic was developed in 2012-2013, it was reflective of the
thoughts at that time for an advanced PLSS design that could be used for future flight operations. The pneumo-
hydraulic schematic is illustrated in Figure 2.
The PLSS 2.0 pneumo-hydraulic design comprises the Primary Oxygen Loop (POL), Secondary Oxygen Loop
(SOL), Oxygen Ventilation Loop (OVL), Thermal Control Loop (TCL), and Auxiliary Thermal Control Loop
(ATCL). The POL and SOL are identical in design and serve the critical life support functions of replacing
consumed oxygen and maintaining the space suit at habitable pressures. They differ in purpose with the POL
providing nominal oxygen flow over a large range of suit-to-environment delta pressures of 0.4 to 8.2 psid, while the
SOL provides contingency oxygen flow should the space suit pressure drop to 3.7 psid for any reason. The OVL
serves the critical function of controlling CO2 inspired by the crew and does so by providing to the helmet gas flow
of sufficiently high flow rates and low CO2 partial pressures. Expired CO2 is carried away by the OVL gas flow and
removed from the gas stream before flowing back to the helmet. In addition, the OVL removes trace contaminants
from the gas stream, provides convective cooling of the crew, and contributes to crew comfort and cooling by
carrying water vapor, expired by breathing and evaporated from the skin, away from the crew and removing it from
the gas stream.
Figure 2. PLSS 2.0 Pneumo-Hydraulic Schematic
International Conference on Environmental Systems
4
The focus of this paper is on the water loops used to cool the crew member, the TCL and ATCL. The critical
life support function provided by the TCL is to acquire crew heat and reject that heat while maintaining the crew at
a safe and comfortable body temperature. The TCL also acquires and rejects heat from the avionics. The TCL
consists of a liquid cooling garment worn by the crewmember, a feed-water supply assembly, a cold plate which
acquires heat from the PLSS avionics, a Spacesuit Water Membrane Evaporator (SWME) which rejects heat via
evaporation, a Cascon pump which circulates the water through the system, and a thermal control valve which
adjusts the temperature of the water provided to the crewmember.
The ATCL provides contingency cooling to the crewmember. It is similar to the TCL – it consists of a smaller
liquid cooling garment that provides crewmember cooling in the upper torso only, a small feedwater supply
assembly, a smaller-sized Spacesuit Water Membrane Evaporator, known as Mini-Membrane Evaporator (Mini-
ME), a pump, and a dedicated controller. The ATCL is completely independent from primary PLSS functions and is
intended for use during contingency scenarios only
It presents a new approach to contingency purge flow operations, high flow operations triggered by OVL
failures or significant space suit leakage. Traditionally, as in the Apollo and Shuttle/ISS EMU PLSS designs,
contingency oxygen purge flows provide crew cooling and makeup oxygen with the former requiring much higher
flow rates than the latter in many situations. The advanced PLSS design offloads this contingency cooling to the
ATCL, which will allow the oxygen stored in the SOL to last significantly longer in many contingencies as the
oxygen is used for suit pressure and crewmember respiration only. All crewmember cooling is provided by the
ATCL.
Technology development components are critical, enabling building blocks of the TCL and merit emphasis.
TCL technology development components include the SWME, pump, Thermal Control Valve (TCV), and Feed-
water Supply Assembly (FSA). It should be noted that the TCL pump (PMP-423) experienced a failure during
unmanned vacuum testing and was replaced with a COTS unit via a jumper. New technologies included in the
ATCL Mini-Membrane Evaporator (Mini-ME) and Auxiliary FSA (AFSA), which are smaller versions of the TCL
SWME and FSA respectively.
In addition to the water loop hardware located on the PLSS 2.0 test article, the integrated water loop also
included hardware designated as the PLSS Test System (JSC drawing SEN36155701). This system consisted of two
contributions to the integrated water loops. First, was a water recharge system which simulated a vehicle interface
that would be required to support EVA operations in a vehicle airlock. This portion of the test system, shown in
Figure 3, provides recharge water via a Millipore canister that was pressurized with nitrogen. It also had a liquid-
liquid heat exchanger connected to a chiller to provide the PLSS with cooling during operational periods when the
SWME was not exposed to vacuum. This portion of the water loop connected to PLSS 2.0 via a downgraded
International Space Station Service and Cooling Umbilical (SCU) at the Display and Control Module (DCM). Next,
the PLSS Test System also provided tubing and instrumentation in between the PLSS 2.0 test article and the LCVG
in use. This configuration changed from test to test throughout the life of PLSS 2.0. During PIA testing, this system
was frequently modified to help meet specific test objects. After PIA, PLSS 2.0 was directly installed onto the
Space Suit Assembly Simulator (SSAS). This configuration, denoted “Config S,” used the Test System LCVG and
minimized the amount of intermediate tubing and hardware. During HITL testing, and testing with the PLSS in the
vacuum chamber, the water loops of the test system were configured as shown in Figure 4. The HITL configuration
had a few minor differences from Figure 4, had the longest tubing runs, and used a variety of LCVGs. Each LCVG
used in HITL testing was flushed prior to being added to the loop. The Mark III space suit had internal tubing and
components that were also flushed prior to incorporation into the integrated water loop. Unmanned testing with
PLSS 2.0 in the vacuum chamber used the same LCVG that was used in all of the unmanned testing and had
significantly shorter tubing runs than the HITL testing. Bev-a-line tubing was also primarily used for these
intermediate tube runs.
In general, PLSS 2.0 and PLSS Test System components were cleaned to level 150A, per the JSC cleaning
specification JPR5322, or something that was deemed to be similar by the test team. Most metal components were
passivated stainless steels and most plastic tubing was Bev-a-line. Most of the LCVGs used ethyl vinyl acetate
tubing. Two used polyurethane tubing. Some exceptions to these generalities apply and are noted in subsequent
sections as they were deemed to impact the results. The system was flushed in between each reconfiguration.
Lastly, an important detail necessary to understand the water loop properties from a chemistry or biological
perspective was the general progression of water through the system. The FSA in the TCL holds approximately 4.5-
kg (10 lb.) of water. For a test point that operationally simulates an EVA, this water was added to the FSA from the
vehicle recharge portion of the PLSS Test System at the beginning of a test sequence. Once the PLSS testing
operations begin, water from this loop is evaporated through the SWME to provide cooling. Water vapor exits the
SWME through the vacuum system, which simulated the space environment, and never returns. This process is

International Conference on Environmental Systems
5
similar to distillation in the since that contaminants in the water that can evaporate and pass through the SWME
fibers leave the system, but non-volatile contaminants remain in the loop and their concentration actually increases
as the total amount of water in the system decreases.5,6
A new batch of water was added to the system for the next
EVA and the process repeats. Regular system flushes were not part of daily operations, so many of these
constituents in the water continually concentrated over time.
40µ
QD-490A
Liquid-Liquid HX
HX-702
TS-703F FS-704
TS-717
SCU MULTIPLE CONNECTOR
HV-716
DP-7010-15 psid
1
2
Chiller Cart
S-4
S-5
T
T
HX-716
TS-718
T
HV-707
H2O SUPPLY
UPWV 1001
MAX 100 PSIG
P-11
(.5in OD/.035in wall)
FX-706
(.25 in. Flexhose)
(.5in OD/.035in wall)
HV-900
RV-905
7 psig
Amb
FX40µ
FX-907
Aux Thermal Recharge Control Panel
(.25
in. F
lexh
ose)
FX40µ
FX-708
RV-713
20 psig
Amb
PT-8530-50 psia
0.08%P
(.25 in. Flexhose)
(.25
in O
D/.0
35in
wall)
Primary Thermal Recharge
Control Panel
OR-709
OR-906
DPSCU
(.5in OD/.035in wall)
(.5in OD/.035in wall)
MS-712
High Precision Scale
SCU FH-908
FH-710
SCU
A
QD-490B
HV-863
Amb
FH-1
Figure 3. PLSS 2.0 Test System – Simulated Vehicle Interface Loop

International Conference on Environmental Systems
6
Water Sample Analysis Results
Water samples were taken periodically throughout the life of the PLSS 2.0 test article. Sampling rigor varied
throughout the duration of the testing because of the large number of activates that were involved in the test series
and the evolving priorities and objectives. In addition to the inconsistencies in sample taking, the chemical analysis
labs also had some inconsistencies due to the availability of different tools. Therefore, several different labs
performed chemical analyses throughout the duration of testing and the data set was not always consistent from one
sample to the next. Due to the incompleteness of the data set, caution should be used when interpreting results of
water sample analysis. It does not provide a complete story and does not represent a well-controlled test. However,
it does provide insight into how the system was behaving, was used in understanding the failure mechanism
associated with some of the TCL components, and can be used to help direct future activities related to water loop
chemistry and stability.
Figure 5 summarizes key measurements from the water quality analysis of samples taken from the TCL This
graph shows the different configurations throughout the duration of tests as indicated by the blue, brown, and gray
bars labeled “PIA/Config S,””HITL,” and “Unmanned,” respectively. The yellow arrow labeled “pump swap”
shows when the PLSS TCL was de-serviced and modified after PMP-423 failed. At this time the PLSS 2.0 system
was modified with a jumper so that a COTS pump could be used to circulate the loop. This left a small portion of
the original TCL in the PLSS 2.0 test article isolated and stagnant. The orange star labeled “Test Sys Samples”
denotes a set of samples that were taken from the test system several months after PLSS 2.0 testing was completed.
The test system had been stagnant for an extended period, but as the PLSS 2.0 test article was disassembled and the
water quality results were analyzed, several questions surfaced that pushed the team to take these additional samples
after testing had ended. Additional samples were taken throughout the duration of PLSS 2.0 test that are not shown
in this figure. These include samples taken directly from components as part of failure investigations, samples taken
from the Millipore canister or water storage canisters prior to adding the fluid to the loop, and samples from the
ATCL.
SSA SIMULATOR
FSA-431
LCVG
26.1 psid
10 lbs H2O
F10
FSA-531
QD-4911 234 5
P-2
P-3
F10
P-4
P-5
P-6
P-7
SWME
CHAMBER C
S-4
S-5
Thermal In
Thermal Out
Aux Thermal In
Aux Thermal Out
Return from Vehicle
Output to Vehicle
Mini-ME
Amb
Amb
QD-686
Vehicle
HX input
Vehicle
HX output1
2
686A
686B
Pwr Mode SW
POR SetSOR SW
Fan SW
RCA SW
TCL_Set
Pump SW
Comm Mode SW
Comm Freq SW
CWS SW
ATCL_Set
PTT/PTM SW
Controls
DCM-685
LCD 16 x 2 Display
Comm Vol
686C
686G
Aux TCL
Recharge5
SCU_MATE SW686I
PLSS 2.0
P11
T
TS-700
1K RTD
1/10 DIN
T
TS-720
1K RTD
1/10 DIN
T
TS-9011K RTD
1/10 DIN
T
TS-9101K RTD
1/10 DINT TS-2301Type T
TTS-2302Type T
F
F
DP
FS-722
DP-2103
FS-903
THERMAL LOOP
AUXILIARY THERMAL LOOP
HV-2204
Drain
HV-909
Drain
HV-725
VEHICLE INTERFACE
HV-902
HV-721
-
+
DP DP-2203-
+
T
T
T
T
T
T
Drain
HV-863
FX-70640 micron
TS-2322Type T
TS-2311Type T
TS-22021K RTD
1/10 DIN
TS-22011K RTD
1/10 DIN
TS-21021K RTD
1/10 DIN
TS-21011K RTD
1/10 DIN
0.375in EVA Tubing and .375in OD/.02in wall 316SS
0.375in EVA Tubing and .375in OD/.02in wall 316SS
0.375in EVA Tubing and .375in OD/.02in wall 316SS
0.375in EVA Tubing and .375in OD/.02in wall 316SS
0.5in EVA Tubing
0.5in EVA Tubing
SEN36155701EC5NONE 1 OF 25
Figure 4. PLSS 2.0 Test System – Unmanned Chamber Testing Configuration

International Conference on Environmental Systems
7
PIA/Config S HITL
Unmanned
Test Sys Samples
Approximate transition from DI to 0.5 ppm AgF
Flush
Flush Pump
SwapFlush?
Figure 5. Water Sample Analysis Results from TCL
Figure 5 captures the fact that the system was drained, broken into, reconfigured, and refilled several times
during PIA. These are captured by the downward arrows. It is believed that the flush and subsequent water recharge
in February 2014 (purple arrow) was performed after the system was into Config S, although the test log does not
explicitly capture that information. Supply water chemistry changes are also indicated in this graph as a red dashed
line labeled “Ag Concentration of Supply Water.” Early tests were performed using deionized (DI) water. At some
point, possibly when Config S tests began (the test logs are not specific enough), water with 0.5 ppm of silver, added
as AgF (silver fluoride), was used. Ag is a common biocide used in aerospace water loops. The silver concentration
of the water was further increased to 5 ppm as AgF after the system was reconfigured to support HITL testing.
Figure 5 shows the results of conductivity measurements and concentrations of metals of interest: aluminum
(Al), copper (Cu), nickel (Ni), silver (Ag), and zinc (Zn). Again, it should be emphasized that due to the intermittent
frequency of samples, caution should be used when interpreting these measurements. However, some very clear
trends are apparent. The obvious trend is that the conductivity of the water in the TCL and the concentration of
these metals are clearly increasing throughout the duration of testing. It is inferred that these increases occur at the
end of HITL testing, the system is flushed, decreasing the metals back down towards the detection limits, and then
another increase occured during unmanned testing. The conductivity of the water is significantly elevated by the end
of HITL testing and appears to rise again, after the system was flushed during the change in configuration, at the end
of the unmanned testing. The trend during this unmanned test cannot be verified because the only sample taken was
at the completion of testing, but if it is assumed that everything was flushed as part of the configuration change, and
these end measurements that were high had returned to elevated levels, that similar processes where occurring
during unmanned tests. Elevated silver concentrations were expected since new silver, in the form of AgF, was
added to the system every time it was recharged with feed-water. The fluoride levels taken in the last sample from
the stagnant test system components after testing had been completed were also elevated. Unfortunately, there were
not intermediate samples taken to actually track these trends. Increases in aluminum, copper, nickel and zinc are
considered likely corrosion by-products. Wetted metallic corrosion will be discussed further in subsequent sections.

International Conference on Environmental Systems
8
Figure 6. Water Analysis From Two HITL Days
Figure 6 shows a series of samples that were taken before and after two HITL test days. Figure 5 provides an
indication of how the water chemistry was changing based on the recharge and evaporation of water after each
simulated EVA. HITL test points only lasted for approximately 2 hours, so not as much water was used as
compared to a nominal 8-hour simulated EVA. The primary phenomena that this figure shows is the step function
increase in silver concentration that occurs during each recharge as new silver is added to the system for every EVA.
The other metals, which are thought to be corrosion by-products, did not change significantly, nor did the
conductivity of the water, suggesting the possibility of precipitate formation (assuming a constant generation of
metal ions due to steady-state corrosion activity). As expected, there were clear increases in the silver concentration
that corresponds to the recharges performed. Throughout testing, silver concentrations peaked around 3 ppm, again
suggesting precipitate formation due to reaching equilibrium of ionic silver, since solid silver particles were
subsequently found throughout the loop and the influent charge of silver was 5-ppm.. Silver laden precipitates were
observed in several places throughout the integrated system after testing was completed and the test set-up was
disassembled.
The silver concentration of the supply water was increased prior to performing the HITL tests based on an
increasing amount of observed microbial activity as indicated in Figure 7 (levels up to 7.5 x 10⁵ CFU/ml). Silver
concentrations were increased from 0.5 ppm to 5.0 ppm as silver fluoride and the measured microbial counts
subsequently declined. While adding 5-ppm silver as silver fluoride proved to be an effective way to decrease
microbial activity, the long-range implications to water chemistry and the system as a whole were not thoroughly
considered at that time.

International Conference on Environmental Systems
9
Figure 7. Results of Microbial Sample Analyses.
Wetted Hardware and Material Evaluations
In addition to performing analysis on water samples, investigations into the observations on specific pieces of
equipment were performed. These are summarized in the following section.
A) SWME
On the sixteenth EVA of the unmanned vacuum chamber test series, the SWME developed a leak. Water from the
TCL partially filled the SWME housing on the vacuum side of the heat exchanger. Testing continued and
additional details can be found in Reference 4. At the time of this paper, the primary cause of leakage was
determined to be a ruptured membrane fiber. A potential secondary cause may have been the loss of hydrophobic
properties of the polypropylene fibers. While the cause of the ruptured fiber was most likely not due to water
quality issues, the change in the wetting properties of the membrane may have been a result of either chemical or
biological activities in the loop. Further, destructive, evaluations are planned for this piece of hardware to continue
to evaluate the leakage mechanism and wetting behavior of the membranes. The primary investigation consisted of
several leak checks and structural evaluations of the SWME test article and water samples were drawn from the
inlet header, the outlet header, and also the housing. The housing was the portion of the SWME that was exposed
to vacuum and liquid water was present in this section of the heat exchanger due to the leak. The samples were sent
to UTAS WL for analysis. Table 1 details the observed results.

International Conference on Environmental Systems
10
Sample Description SWME Inlet
8/19/15 SWME Outlet
8/19/15 SWME Housing 8/19/15 Approximate Volume (mL) 50 50 100
TOC (ppm) 4.3 4.4 6.0 F
-
(ppm) 31 39 50 Cl
-
(ppm) 0.48 0.68 0.58 NO
2
-
(ppm) <0.05 <0.05 <0.05 SO
4
2-
(ppm) 0.49 0.56 1.05 NO
3
-
(ppm) <0.05 <0.05 <0.05 PO
4
3-
(ppm) <0.05 <0.05 <0.05 Acetate (ppm) <0.05 <0.05 <0.05
Li+
(ppm) <0.05 <0.05 <0.05 Na
+
(ppm) 30 35 45 NH
4
+
(ppm) 0.16 <0.05 0.35 K
+
(ppm) 0.12 0.09 0.05 Mg
2+
(ppm) <0.05 <0.05 <0.05 Ca
2+
(ppm) 0.07 0.12 0.25 Aluminum (ppm)
Total 2.12 3.05 4.41 Dissolved 2.08 3.04 4.40
Chromium (ppm) Total 0.02 <0.01 <0.01
Dissolved <0.01 <0.01 <0.01 Iron (ppm)
Total 0.19 <0.01 <0.01 Dissolved <0.01 <0.01 <0.01
Nickel (ppm) Total 0.19 0.12 0.10
Dissolved 0.13 0.12 0.10 Silicon (ppm)
Total 1.09 1.13 2.01 Dissolved 0.49 0.53 0.78
Silver (ppm) Total 0.32 0.08 0.57
Dissolved 0.05 0.03 0.57 Zinc (ppm)
Total 0.22 0.26 0.23 Dissolved 0.22 0.26 0.24
Table 1. SWME Water Chemical and Microbial Water Analysis Results
A moderate level of TOC (total organic carbon) in the range of 4.3 – 6.0-ppm was observed in the three SWME
water samples. The organic compounds were not further characterized due to a lack of sample volume. It is assumed
that the TOC is due to extractables from wetted non-metallic materials of construction in the test set-up such as the
high surface area of the wetted SWME polypropylene fibrous bundle as well as products of microbial metabolism. It
should be noted that a 4.3 – 6.0 ppm TOC range provides a potential nutrient source for microbial activity.
High levels of fluoride (31 – 50-ppm) and sodium (30 – 45 ppm) are also observed. The likely source of these
constituents is the silver fluoride biocide that was continuously added to the PLSS 2.0 feed-water loop throughout
testing as shown in Figure 5. The silver was added as silver fluoride, but sodium fluoride was added as well to
enhance silver fluoride solubility. Though the TCL of PLSS 2.0 and the test system were periodically flushed,
extended periods of testing in between these flushes provided an opportunity for SWME operation to concentrate
non-volatile constituents in the water while water evaporated through the SWME fibrous bundle for cooling. The
water contained in the SWME at the time these samples had been taken was the result of six months of testing (25
simulated 8-hour EVAs), and several component-specific tests without a system flush and refill.. The fact that
fluoride and sodium rose to such high levels, and the silver did not (observed at 0.08 – 0.57-ppm total silver levels in

International Conference on Environmental Systems
11
these three samples), suggests a loss of the silver to a mechanism such as precipitate formation or reductive plating
onto wetted system metallics.
A relatively high level of aluminum was observed in the three SWME water samples (2.12 – 4.41 ppm),
suggesting corrosion of wetted aluminum in the system. The source of the aluminum in the TCL had not been
identified at the time of this paper. It was intentionally not use due to anticipated problems with corrosion. Silver
and aluminum (as well as stainless steels) are known to act as galvanic couples, suggesting a reduction of ionic
silver to silver metal and an oxidation of aluminum metal to ionic aluminum had occurred. It is expected that the
build-up of aluminum ions in solution would be limited by the solubility limits of aluminum in solution and the
formation of precipitates with counter-ions and organic compounds. Low levels of other metals (Fe, Ni, Zn) in sub-
ppm concentrations suggest a similar phenomenon with other system wetted metallic parts.
The observed microbial levels in the three SWME samples were quite low (< 1 – 14 CFU/mL), likely due to the
known silver biocide addition episodes as well as the observed residual ionic (dissolved) silver of 0.03 - 0.57-ppm.
Ionic silver is known to provide antimicrobial properties to water at concentrations as low as 0.02 – 0.05-ppm. It
should be noted that the water in the SWME had been stagnant in the housing and in an uncontrolled environment
for approximately a month prior to the collection of water samples.
Discoloration on either side of the SWME bundle was observed as shown in Figure 8. Swabs of the darkened
areas were taken to identify the cause.
Figure 8. PLSS 2.0 SWME
The darkened areas were identified as primarily inorganic in nature, with the primary constituents being silver
and iron, with lesser amounts of aluminum, iron, nickel and copper observed (see Figure 9). Counter-ion elements
such as oxygen, fluoride, phosphorous and sulfur were also observed, suggesting that these darkened areas are
accumulations of inorganic precipitates. Why these suspect precipitates would collect in the observed pattern (inlet
and exit) of the SWME bundle) are unknown.
At the time of this writing, an investigation was underway to determine the cause of a leak from the SWME. The
primary cause of the leakage was determined to be a ruptured membrane fiber. A potential secondary cause may
have been the loss of hydrophobicity in the fibers. While the cause of the ruptured fiber was most likely not due to
water quality issues, the change in the wetting properties of the membrane may have been a result of either chemical
or biological activity in the water loop. Further destructive evaluations are planned for this hardware to continue to
evaluate the wetting behavior of the membranes.
B) Pump

International Conference on Environmental Systems
12
The PLSS 2.0 included a water pump on loan from UTAS WL. The pump is a Cascon gerotor pump
derived from their CRAVE DO 37 development unit. The pump uses a stainless steel housing, stellite gerotor and
silicon carbide end plates.7
NASA integrated the Cascon pump into PLSS 2.0 in March 2013 and operated it intermittently until its
failure on March 3rd
, 2015. Approximately 300 hours of operation were recorded, which included dozens of
start/stop cycles. The pump was operated with water inlet pressures as low as 2.0 psia for a total of 20 hours. Total
run time and details are still being compiled as part of NASA’s PLSS 2.0 test report.4
The water pump in PLSS 2.0 failed on March 3rd
, 2015 upon startup. It had operated without issue prior to
March 3rd
, including during the prior day’s tests. When the pump was commanded “on” on March 3rd
, the
tachometer recorded a brief rotation of the pump up to 1400 rpm before it stopped. Multiple attempts to start it up
failed, with no additional speed readings. The pump was then bypassed and replaced with another pump for the
remainder of the PLSS 2.0 testing. The portion of PLSS 2.0 shown in Figure 7 contains the pump, the pump
instrumentation manifold, and HX-340 which made up this bypassed portion of the TCL. It is important to note that
this section of the loop remained stagnant and only partially filled with water for approximately four months prior to
disassembly, inspection and collection of water samples. Upon completion of the PLSS tests in July 2015, the pump
was removed from the system and sent back at UTAS WL for evaluation. Evaluation of the pump included analysis
of the trapped water, disassembly of the pump, analysis of particulate found within the pump, and consultations with
Cascon.
The pump was disassembled in the UTAS WL Engineering Lab in September 2015. It was found that while
the gerotor could be manually moved in the forward direction, it could not be moved in the reverse direction.
Additionally, a dark grey precipitate that was subsequently identified as being rich in silver was found on most
wetted surfaces along with a greenish-grey, slippery material that contained a non-volatile hydrocarbon that could
not be identified. The End Plate B made of silicon carbide, was observed to be cracked and chipped after it was
removed from the pump. It is believed that this was cracked during the disassembly process since the cracked
surfaces did not exhibit the wide-spread silver and organic deposition on the wetted surfaces. Finally, water removed
from the pump during the initial NASA evaluation and at UTAS WL was found to have relatively high iron and
nickel levels (19.86 and 8.00 ppm respectively) and relatively low microbial content (4.4 x 10² CFU/mL).
The failure investigation ruled out electrical and power issues, as well as internal corrosion. Excessive
wear was not observed. Cascon’s experience with their gerotor pumps indicates that failure of the Stellite teeth and
the silicon carbide plates on their own was unlikely, and the voids on the gears were not caused by cavitation. The
most likely cause of failure was determined to be external contamination, which was evident throughout the pump.
Plating of silver within the roots of the gerotor created interference between the gear and rotor generating repetitive,
compressive stress. These compressive stresses either created excessive torque on the motor, or resulted in the
fracture of the inner gerotor teeth. The fractured material then would have wedged in between the inner and outer
gears and caused the pump to seize (Figure 9).
Silver filled the 0.002 inch space
between the root and the internal
gear’s teeth.
International Conference on Environmental Systems
13
Figure 9. External Gerotor With Silver Deposits in the Root
The root cause of PLSS 2.0’s pump failure is believed to be the deposition of silver within the pump. The
source of the silver could have been upstream galvanic interaction with stainless steel given the amount of deposited
silver that was observed throughout the system. It is also possible that silver was attracted to the stellite wetted
material in the gerotor given the galvanic potential between silver and stellite, though that could not be confirmed.
The Deposition of silver precipitates could have been exasperated by the presence of surface biofilm based on the
hydrocarbon presence finding, but that could not be confirmed. Silver built up everywhere, including in the roots of
the outer gerotor in thicknesses that would have filled the 2 mil clearance between the inner and outer gerotor.
resulting loads within the pump would have become significant and caused a jam between the gerotors in any one of
several ways. Another possible, but much less likely cause of the pump failure is external debris being ingested by
the pump and jamming it. However, there is no direct evidence that external debris actually entered the pump.
C) Heat Exchanger
HX-340 was a portion of the TCL that became stagnant as part of the pump failure previously described.
During disassembly, the water quality in this portion of the loop was observed to be poor, with very apparent
orange-brown coatings on most of the components. As components were disassembled, HX-340 was suspected to
be the source of this contamination. The configuration of the heat exchanger during this period of stagnation is also
important to understand as the results of subsequent analyses are interpreted. The whole assemble was partially
filled with water and oriented so that the water remained stagnant for a significant period of time. Based on the heat
exchanger layout, this meant that the inlet water port was probably filled with water, while the exit water port may
have been dry, based on their heights relative to the PLSS 2.0 back plate.
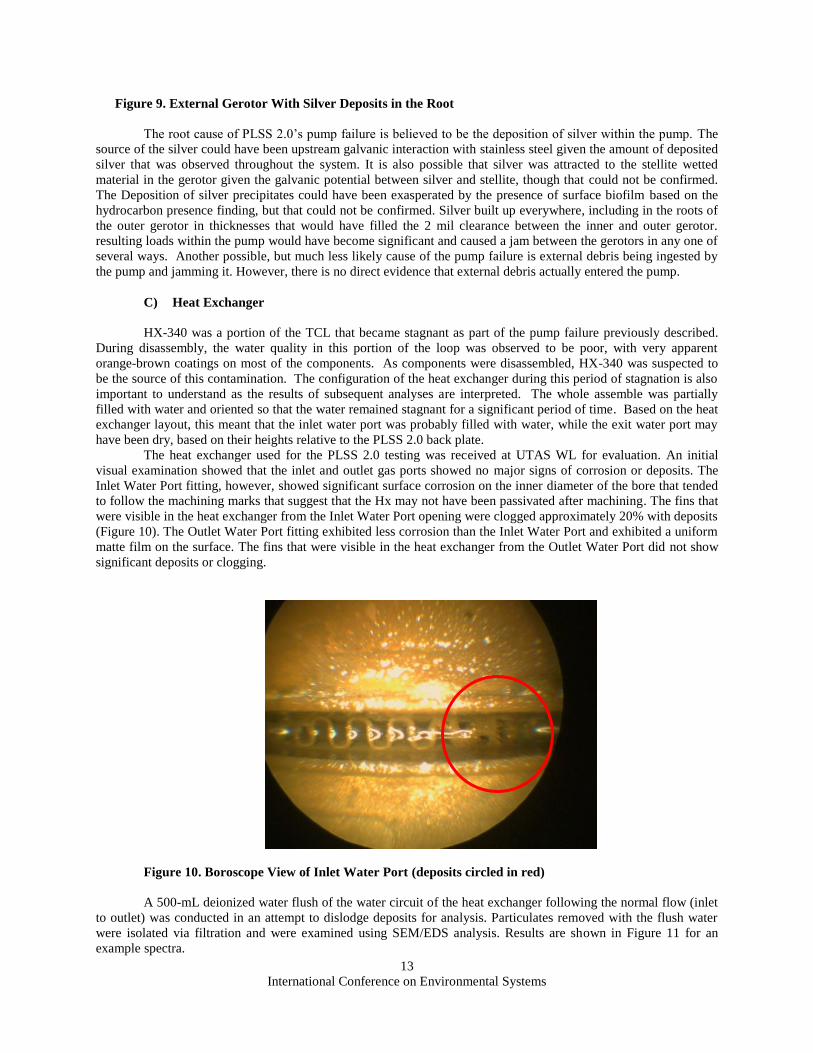
The heat exchanger used for the PLSS 2.0 testing was received at UTAS WL for evaluation. An initial
visual examination showed that the inlet and outlet gas ports showed no major signs of corrosion or deposits. The
Inlet Water Port fitting, however, showed significant surface corrosion on the inner diameter of the bore that tended
to follow the machining marks that suggest that the Hx may not have been passivated after machining. The fins that
were visible in the heat exchanger from the Inlet Water Port opening were clogged approximately 20% with deposits
(Figure 10). The Outlet Water Port fitting exhibited less corrosion than the Inlet Water Port and exhibited a uniform
matte film on the surface. The fins that were visible in the heat exchanger from the Outlet Water Port did not show
significant deposits or clogging.
Figure 10. Boroscope View of Inlet Water Port (deposits circled in red)
A 500-mL deionized water flush of the water circuit of the heat exchanger following the normal flow (inlet
to outlet) was conducted in an attempt to dislodge deposits for analysis. Particulates removed with the flush water
were isolated via filtration and were examined using SEM/EDS analysis. Results are shown in Figure 11 for an
example spectra.

International Conference on Environmental Systems
14
Figure 11. SEM/EDS Results from Select Particulates Collected from the Heat Exchanger Water Circuit
The particles that were collected were for the most part, inorganic in nature, with a low-level carbon
present. The major metals that were identified include silver, iron, nickel and copper. These findings are consistent
wiith the water samples taken from the pump, which was also part of this stagnant section of the loop. Other major
constituents included fluorine and oxygen. This data suggested the presence of precipitated silver, oxides of iron,
nickel and copper, and potentially a fluorinated compound which could be fluorinated grease commonly used for
space hardware applications.
A swab of the residue observed in the inlet and outlet water ports was conducted. The residue was
analyzed via SEM/EDS and was found to be high in silver, iron, nickel, chromium and copper and lesser amounts of
aluminum. The present of carbon, oxygen and fluorine was also apparent (Figure 12).
Figure 12. SEM/EDS Results From Inlet Water Port Swab Particulates
The data shows the presence of silver which was used as a biocide in the water loop at high concentrations
and which rapidly declined in concentration in the water. While silver in contact with stainless steel (base wetted
material in the heat exchanger or the BNi2 Braze alloy) are acceptable galvanic couples, that does not preclude the
possibility that some corrosion could be initiated. This would explain some of the corrosion products seen on the
heat exchanger and the fittings. Furthermore, the presence of BNi2 braze alloy could provide a galvanic couple with
silver since it is rich in nickel. It may very well be that the Hx is the primary source of the iron and nickel corrosion
products observed in the water loop, given the previously mentioned corrosion observed in the inner diameter of the
bore that tended to follow the machining marks and the BNi2 braze alloy in the Hx, but that is speculative.

International Conference on Environmental Systems
15
The spiral pattern in the inlet fitting that follows the machining marks is often attributable to a lack of
passivation after machining. Particles of tool steel left on the surface of stainless steel can act as initiation sites that
break down the passive chromium oxide layer on the stainless steel.
The higher concentration of particles and deposits on the inlet side of the heat exchanger may indicate that
this material was coming from upstream in the cooling water flow, though it is possible that it originated to some
extent at that point due to the long term wetted storage orientation of the Hx as previously discussed..
D. System Silver Deposits
As disassembly of PLSS 2.0 and the PLSS Test System took place, silver colored deposits were found on several
components. Examples are shown in 13 and 14. The first one discovered was a quick disconnect (QD) that was
located in the Mark III suit assembly. It was discovered at the end of HITL testing. The QD was made of chrome
plated brass. During the final disassembly of PLSS 2.0, additional locations were found with a similar silvery
substance. These were usually found at the end of flared fitting that had copper flare savers installed. Chemical
analysis of these silvery substances confirmed that they were indeed primarily silver. They also had significant
amounts of copper and zinc, based on the parent material of the component in question. It is hypothesized that the
cause of these precipitates is an oxidation-reduction reaction based on the galvanic potential between the silver
biocide and the copper or brass.
Figure 13. Solid Silver Particles from PLSS 2.0 Back plate Fittings

International Conference on Environmental Systems
16
Figure 14. Analysis of Solid Materials Found on Fittings and QDs
Summary / Key Findings from the PLSS 2.0 Testing
Sample rigor varied throughout the duration of the PLSS 2.0 testing and as such, regimented trending water
analysis data was sparse. Samples were sporadically drawn, the fluid loop was periodically flushed and sample
dwell times varied from days to months after test phases were completed. As such, the water analysis data
evaluation does not provide as complete a story as a well-controlled test might provide. Nevertheless, the water
analysis data and the subsequent hardware examinations post-testing provided relatively good insight into how the
system was behaving which can be used to direct future activities related to water loop chemistry.
Testing began with no biocide added to the water and the result was a significant rise in water loop microbial
activity over the course of this ~ 1-year period of time. Biocide addition began after the relatively high microbial
loads became apparent with the addition of 0.5-ppm silver as silver fluoride. Relatively rapid declines in the silver
concentration and initial reductions, followed by rebounds in microbial activity led to an increase in the influent
water biocide concentration to 5.0-ppm silver as silver fluoride concentration. Silver concentration drops in the
recirculating water indicated that silver was undergoing precipitation, plating or interacting with wetted materials in
the water loop.
Within 3-months of the addition of 5.0 ppm silver as silver fluoride, significant levels of aluminum, copper,
nickel and zinc became apparent in the water analyses data. This finding, coupled with the reductions in ionic silver
concentrations suggested a galvanic interaction between the silver (more noble and prone to reduction) and other
less noble wetted materials in the water loop prone to oxidation.
On the sixteenth EVA of the unmanned chamber test series, the SWME developed a leak with water partially
filling the SWME housing of the vacuum side of the heat exchanger. At the time of this writing, the primary cause
of the leak was determined to be a ruptured membrane filter, but the root cause had yet to be determined. Water
from the SWME underwent chemical analysis. The water, representing the results of 6-months of 25 simulated 8-

International Conference on Environmental Systems
17
hour EVAs, exhibited high levels of sodium and fluoride (purposely added with the silver biocide mixture),
relatively low levels of silver (suggesting silver precipitation, plating or reactivity had occurred), high levels of
aluminum, and measurable levels of iron, nickel and zinc; suggesting water loop wetted metallic corrosion activity.
A significant amount of dark grey discoloration was observed on either side of the SWME fiber bundle and that
material underwent a chemical analysis as well. The dark grey material was found to be primarily inorganic in
nature, with the primary constituents being silver and iron, with lesser amounts of aluminum, nickel and copper
observed. At the time of this writing, it was unknown whether these collected materials had any impact on the
wettability and/or functionality of the SWME fibers, but at the very least, this area of the water loop had been shown
to be prone to water loop precipitation collection if precipitation does in fact occurs.
After approximately 300-hours of operation, the Cascon gerotor pump ceased up and had to be replaced. A
disassembly and examination of the pump 6-months after the failure ruled out electrical and power issues as well as
internal corrosion. Excessive wear was not observed. The most likely cause of the failure was found to be
contaminants/precipitates in the water loop, specifically silver-rich precipitates coupled with a non-volatile organic
material. It appeared that a collection of silver-rich particles or plated material within the roots of the gerotor created
interferences between the gear and the rotor, generating repetitive compressive stress. The compressive stresses
either created excessive torque on the motor or resulted in the fracture of the inner gerotor teeth. The fractured
material would have then been prone to wedge in between the inner and outer gears, causing the pump to seize. The
root cause of PLSS 2.0’s pump failure, therefore, is believed to be the deposition of silver within the pump. The
source of the silver could have been upstream galvanic interaction with stainless steel given the amount of deposited
silver that was observed throughout the system. It is also possible that silver was attracted to the stellite wetted
material in the gerotor pump given the galvanic potential between silver and the elements of stellite, though that
could not be confirmed. The Deposition of silver precipitates could have been exasperated by the presence of
surface biofilm based on the hydrocarbon presence finding, but that could not be confirmed. Silver built up
everywhere, including in the roots of the outer gerotor in thicknesses that would have filled the 2 mil clearance
between the inner and outer gerotor. The resulting loads within the pump could have become significant and caused
a jam between the gerotors in any one of several ways. As with the SWME bundle, this occurrence indicates that the
pump is prone to failure due to water loop precipitates and/or plating products. Examination of the Heat Exchanger used in the PLSS 2.0 testing indicated that the Inlet Water Port fitting of the
showed significant surface corrosion on the inner diameter of the bore that tended to follow the machining marks.
That finding suggested that the Hx may not have been passivated after machining. The fins that were visible in the
heat exchanger from the Inlet Water Port opening were clogged approximately 20% with deposits. The Outlet Water
Port fitting exhibited less corrosion than the Inlet Water Port and exhibited a uniform matte film on the surface. The
fins that were visible in the heat exchanger from the Outlet Water Port did not show significant deposits or clogging.
It should be noted that the whole assemble was partially filled with water and oriented so that water remained
stagnant in the inlet port side of the Heat Exchanger and not the outlet port for a significant period of time based on
the storage configuration. The material that was collected was for the most part, inorganic in nature, with a low-level
carbon present. The major metals that were identified in particulates dislodged via a water flush of the Heat
Exchanger included silver, iron, nickel and copper. Other major constituents included fluorine and oxygen. This
data suggested the presence of precipitated silver, oxides of iron, nickel and copper, and potentially a fluorinated
compound which could be fluorinated grease commonly used for space hardware applications. The higher
concentration of particles and deposits on the inlet side of the heat exchanger may indicate that this material was
coming from upstream in the cooling water flow, though it is possible that it originated to some extent at that point
due to the long term wetted storage orientation of the Hx. As with the SWME and the pump, these findings indicate
that the pump is prone to fin-stock fouling due to water loop precipitates and/or plating products.
As disassembly of PLSS 2.0 and the PLSS Test System took place, silver colored deposits were found on
several components including QDs made of chrome plated brass. During the final disassembly of PLSS 2.0, several
additional locations were found with a silver colored deposits. The location was usually at the end of flared fittings
that had copper flare savers installed. Chemical analysis of these silver colored deposits confirmed that they were
indeed primarily silver. They also had significant amounts of copper and zinc, based on the parent material of the
component in question. It is hypothesized that the cause of these precipitates is an oxidation-reduction reaction
based on the galvanic potential between the silver biocide and the copper or brass.
In summary, it was determined that microbial levels in the PLSS 2.0 water loop increased over time even with a
low total organic carbon content. While silver acted as an effective biocide, it was not long-lasting in the water loop
and was prone to precipitation and plating. The silver appeared to take part in galvanic couples with less noble
wetted materials, resulting in enhanced corrosion. Once plating, corrosion, water quality reductions and precipitation
took place in the water loop, components with convoluted geometries, tight configurations, and essential functions

International Conference on Environmental Systems
18
become targets for reduced performance and/or failure. Many of these deleterious mechanisms appeared long-term
in nature and in the future may not be appreciated until a system mishap occurs. These mechanisms are best studied
and understood in small scale testing before an entire system becomes jeopardized due to what may appear to be a
subtle change. Regimented, trending data is the best way to catch the early stages of a system water loop upset,
providing the observer an opportunity to make early changes before a component and/or system failure.
Recommendations for PLSS 2.5 Testing
The following are water-loop related recommendations for PLSS 2.5 testing based on the PLSS 2.0 findings and
challenges experienced with other water-loop related ISS ECLSS systems.
1) Small-scale benchtop materials compatibility testing (real-time and accelerated) for all wetted materials
being considered for use particularly where long-term water loop application data is limited. That testing
should include material couples as well as candidate biocides. Some of this can be integrated with
upcoming smaller-scale test loops for the TCV, HX-30 and the SWME.
2) Consideration of a water treatment/ biocide replenishment approach to long-term water management given
the criticality of maintaining the chemical and microbiological quality of water in a long-term water loop.
Some of this can be integrated with upcoming smaller-scale test loops for the TCV, HX-30 and the SWME.
3) Evaluation of candidate biocides to consider ranging from ionic silver, ionic iodine, silver coupled with an
organic complex, iodine coupled with an organic complex, silver impregnated filters, surface coatings to
enhance biocide life and non-traditional biocides. This should include means to periodically replenish the
biocide as appropriate. Some of this can be integrated with upcoming smaller-scale test loops for the TCV,
HX-30 and the SWME.
4) Plans are to change the majority of the TCL and ATCL to titanium. Evaluate how best to work with titanium
ahead of time including machining techniques, surface treatments, orbital tube welding and methodology of
isolating risky galvanic couples.
5) Consolidate the findings from Recommendations 1 – 4 above into a system implementation plan.
6) Once PLSS 2.5 testing is underway, implement a regimented water analysis plan. Data should undergo
trending real-time, and results should be periodically reviewed for findings of significance to alert the users
to consider as appropriate changes before the quality of the water in the loop adversely impacts components
within the loop.

International Conference on Environmental Systems
19
Bibliography
1Watts, C., Campbell, C., Vogel, M., and Conger, B., “Space Suit Portable Life Support System Test Bed (PLSS
1.0) Development and Testing,” AIAA-2012-3458, 42nd International Conference on Environmental Systems,
AIAA, July 2012.
2Anchondo, I., Cox, M., Watts, C., Westheimer, D., and Vogel, M., “Space Suit Portable Life Support System
(PLSS) 2.0 Pre-Installation Acceptance (PIA) Testing,” ICES-2016-86, 46th
International Conference on
Environmental Systems, International Conference on Environmental Systems, Inc., July 2016. (submitted for
publication)
3Watts, C., and Vogel, M., “Space Suit Portable Life Support System (PLSS) 2.0 Human-in-the-Loop (HITL)
Testing,” ICES-2016-87, 46th International Conference on Environmental Systems, International Conference on
Environmental Systems, Inc., July 2016. (submitted for publication)
4Authors, “Space Suit Portable Life Support System (PLSS) 2.0 Unmanned Vacuum Environment Testing,”
ICES-2016-88, 46th International Conference on Environmental Systems, International Conference on
Environmental Systems, Inc., July 2016. (submitted for publication)
5Bue, G., Makinen, J., Cox, M., Watts, C., Campbell, C., Vogel, M., Colunga, A., and Conger, B., “Long-
Duration Testing on a Spacesuit Water Membrane Evaporator Prototype,” AIAA-2012-3459, 42nd
International
Conference on Environmental Systems, AIAA, July 2012.
6Bue, G., Trevino, L., Tsioulos, G., Settles, J., Colunga, A., Vogel, M., and Vonau, W., “Hollow Fiber Spacesuit
Water Membrane Evaporator Development and Testing for Advanced Spacesuits.” AIAA-2010-6040, 40th
International Conference on Environmental Systems, AIAA, July 2010.
7Hodgson, E., Dionne, S., Gervais, E., Anchondo, I., “Maturing Pump Technology for Extravehicular
Activty,”AIAA-2012-3483, 42nd
International Conference on Environmental Systems, AIAA, July 2012.


![Space Suit Portable Life Support System (PLSS) 2.0 … International Conference on Environmental Systems ICES-2016-[86] 10-14 July 2016, Vienna, Austria Space Suit Portable Life Support](https://img.dokumen.tips/doc/110x75/5aee989e7f8b9a6625919962/space-suit-portable-life-support-system-plss-20-international-conference.jpg)