Embed Size (px)
Citation preview
Desalination and Water Purification Research and Development Program Report No. 192
Advanced Pretreatment for Nanofiltration of Brackish Surface Water: Fouling Control and Water Quality Improvements
U.S. Department of the Interior Bureau of Reclamation Technical Service Center Water and Environmental Services Division Water Treatment Engineering Research Team Denver, Colorado April 2017
Advanced Pretreatment for Nanofiltration of Brackish Surface Water: Fouling Control and Water Quality Improvements
REPORT DOCUMENTATION PAGE Form Approved
OMB No. 0704-0188 The public reporting burden for this collection of information is estimated to average 1 hour per response, including the time for reviewing instructions, searching existing data sources, gathering and maintaining the data needed, and completing and reviewing the collection of information. Send comments regarding this burden estimate or any other aspect of this collection of information, including suggestions for reducing the burden, to Department of Defense, Washington Headquarters Services, Directorate for Information Operations and Reports (0704-0188), 1215 Jefferson Davis Highway, Suite 1204, Arlington, VA 22202-4302. Respondents should be aware that notwithstanding any other provision of law, no person shall be subject to any penalty for failing to comply with a collection of information if it does not display a currently valid OMB control number. PLEASE DO NOT RETURN YOUR FORM TO THE ABOVE ADDRESS. 1. REPORT DATE (DD-MM-YYYY) 06-06-2017
2. REPORT TYPE Final Report
3. DATES COVERED (From - To) October 2014 to June 2017
4. TITLE AND SUBTITLE Advanced pretreatment for nanofiltration of brackish surface water: fouling control and water quality improvements
5a. CONTRACT NUMBER 5b. GRANT NUMBER R16AP00006 5c. PROGRAM ELEMENT NUMBER
6. AUTHOR(S) Shankar Chellam Mutiara Ayu Sari
5d. PROJECT NUMBER 5e. TASK NUMBER 5f. WORK UNIT NUMBER
7. PERFORMING ORGANIZATION NAME(S) AND ADDRESS(ES) Texas A&M University 3136 TAMU, Department of Civil Engineering, College Station, TX, 77840
8. PERFORMING ORGANIZATION REPORT NUMBER
9. SPONSORING/MONITORING AGENCY NAME(S) AND ADDRESS(ES) Bureau of Reclamation, Department of the Interior Denver Federal Center P.O. Box 25007 Denver, CO 80225-2007
10. SPONSOR/MONITOR'S ACRONYM(S)
Reclamation 11. SPONSOR/MONITOR'S REPORT NUMBER(S)
12. DISTRIBUTION/AVAILABILITY STATEMENT Available at https://www.usbr.gov/research/dwpr/DWPR_Reports.html 13. SUPPLEMENTARY NOTES 14. ABSTRACT Brackish, inland surface water from the Foss Reservoir, Oklahoma, was successfully desalinated using a low monovalent salt rejecting nanofilter (NF270, Dow). Precipitative, colloidal, and organic fouling of the nanofilter were minimized while maintaining high permeate flux and product water quality by advanced pretreatment with electrocoagulation and microfiltration. Pretreatment effectively controlled turbidity, microorganisms, and natural organic matter while operating at a high microfiltration flux. Surface characterization of nanofiltration membranes showed that pretreatment reduced both hydrophilic and hydrophobic fractions of natural organic matter. Since electrocoagulation performance is strongly affected by pH, coagulant dosage, current density, temperature, and source water chemistry, its operating conditions should be optimized seasonally. 15. SUBJECT TERMS Desalination, nanofiltration, pretreatment, electrocoagulation, microfiltration 16. SECURITY CLASSIFICATION OF: 17.
LIMITATION OF ABSTRACT U
18. NUMBER OF PAGES 105
19a. NAME OF RESPONSIBLE PERSON Yuliana Porras-Mendoza
a. REPORT U
b. ABSTRACT U
a. THIS PAGE U
19b. TELEPHONE NUMBER (Include area code) 303-445-2265
Standard Form 298 (Rev. 8/98) Prescribed by ANSI Std. Z39.18
Advanced Pretreatment for Nanofiltration of Brackish Surface Water: Fouling Control and Water Quality Improvements
i
Mission Statements The U.S. Department of the Interior protects America’s natural resources and heritage, honors our cultures and tribal communities, and supplies the energy to power our future.
The mission of the Bureau of Reclamation is to manage, develop, and protect water and related resources in an environmentally and economically sound manner in the interest of the American public.
Disclaimer
The views, analysis, recommendations, and conclusions in this report are those of the authors and do not represent official or unofficial policies or opinions of the United States Government, and the United States takes no position with regard to any findings, conclusions, or recommendations made. As such, mention of trade names or commercial products does not constitute their endorsement by the United States Government.
Acknowledgements The completion of this project could not have been possible without the participation and assistance of many people. We would particularly like to express our deep gratitude to the following:
• Anna Hoag, Collins Balcombe and funding through the DWPR program.
• Caleb Funk from Dow Chemical for generously providing us with NF membranes used in this study
• Dr. Ying Wei from City of Houston for providing us with IC measurements
• Dr. Ayse Bozlaker and Dr. Bob Taylor from Texas A&M University who helped us with inductively coupled plasma measurements
• Mr. Kunal Gupta, PhD student at Texas A&M University for performing microfiltration fouling analysis
• Mr. Pasan Bandara at University of Houston for performing experiments with bacteria

Advanced Pretreatment for Nanofiltration of Brackish Surface Water: Fouling Control and Water Quality Improvements
U.S. Department of the Interior Bureau of Reclamation Technical Service Center Water and Environmental Services Division Water Treatment Engineering Research Team Denver, Colorado April 2017
Desalination and Water Purification Research and Development Program Report No. 192
Advanced Pretreatment for Nanofiltration of Brackish Surface Water: Fouling Control and Water Quality Improvements Prepared for Reclamation Under Agreement No. R16AP00006 by
Shankar Chellam Mutiara Ayu Sari

Advanced Pretreatment for Nanofiltration of Brackish Surface Water: Fouling Control and Water Quality Improvements
i
ACRONYMS AND ABBREVIATIONS ATR-FTIR Attenuated Total Reflectance-Fourier Transform Infrared Spectroscopy CCL3 Contaminant Candidate List 3 DBP disinfection by-product DOC Dissolved Organic Carbon DPDN N-diethyl-p-phenylenediamine DTGS deuterated-triglycine sulfate EDS Energy Dispersive X-ray Spectroscopy EPA U.S. Environmental Protection Agency Epit pitting potential ICP-MS Inductively Coupled Plasma-Mass Spectroscopy LSI Langlier saturation index MF microfiltration MWCO Molecular Weight Cutoff NF nanofiltration NOM natural organic matter PVDF polyvinylidene difluoride Reclamation Bureau of Reclamation RMS root mean squared RO reverse osmosis ROSA Reverse Osmosis System Analysis SDI silt density index SEM Scanning Electron Microscopy SI saturation Index SUVA specific ultraviolet light absorbance TDS total dissolved solids TFC thin film composite UV254 Ultraviolet absorbance at 254 nm XPS X-ray Photoelectron Spectroscopy
Acronyms and Abbreviations
ii
Measurements °C degrees Celsius AFY acre feet per year Al/L aluminum per liter As/L ampere second per liter CFU/mL colony forming units per milliliter cm centimeters cm-1 reciprocal centimeters cm/s centimeters per second cm2 square centimeters Da Dalton eV electron volt kHz kilohertz L liters L/m2h liter per square meter per hour L/m2.h.bar liter per square meter per hour per bar of pressure mg/A.s milligram per amper per second m-1 inverse meter mA/cm2 milliAmpere per square centimeters mg/A.s milligram per ampere per second mg/L milligram per liter MGD million gallons per day mL milliliter mL/min milliliters per minute m-L/mg meter liter per milligram M Molar mM millimolar N Normal mV millivolts nm nanometer NTU Nephelometric Turbidity Unit psig pounds per square inch gauge w/v 1 mL of 10 percent (w/v) µL microliters µm microns
Advanced Pretreatment for Nanofiltration of Brackish Surface Water: Fouling Control and Water Quality Improvements
iii
Chemical Abbreviations Al aluminum Al(OH)3 aluminium hydroxide Ar-SO2-Ar, Ar-O-Ar aryl-sulfur di-oxide-aryl, aryl-oxygen-aryl C carbon, Ca2+ calcium CaCO3 calcium carbonate Cl chlorine CO3-2 carbonates Fe iron HCl hydrochloric acid H2SO4 sulfuric acid HNO3 nitric acid K potassium KBr potassium bromide Mg2+ magnesium N nitrogen Na sodium NaCl sodium chloride NaHCO3 sodium bicarbonate Na2SO3s odium sulfite O oxygen S sulfur Si-O-Si or Si-O-C sulfate and silicon SO4-2 sulfate Sr2+ strontium νSi-O sulfate and silicon

Advanced Pretreatment for Nanofiltration of Brackish Surface Water: Fouling Control and Water Quality Improvements
i
TABLE OF CONTENTS
1. Introduction........................................................................................................ 1
1.1. Project overview ............................................................................................. 1 1.2. Need for project .............................................................................................. 1 1.3. Project background and overview ................................................................. 3 1.4. Project goal and objectives............................................................................. 4
2. Materials and methods ..................................................................................... 7
2.1. Source water characterization ........................................................................ 7 2.2. Synthetic water or model solution ................................................................. 9 2.3. Electrocoagulation and MF pretreatment ...................................................... 9 2.4. Nanofiltration ................................................................................................ 11 2.5. Microscopy .................................................................................................... 14 2.6. Zeta potential measurements ........................................................................ 14 2.7. Attenuated total reflectance – Fourier transform infrared spectroscopy
(ATR-FTIR) .................................................................................................. 15 2.8. X-ray photoelectron spectroscopy (XPS) .................................................... 15 2.9. Bacterial removal and inactivation during electrocoagulation .................. 15
3. NF membrane selection .................................................................................. 17
3.1. Differences in NF90 and NF270 fouling..................................................... 17 3.2. ATR-FTIR spectra of NF90 and NF270 membrane surfaces .................... 21
3.2.1. Virgin membranes .............................................................................. 21 3.2.2. Membranes after filtering the model solution .................................. 23 3.2.3. Filtration of pretreated Foss Reservoir water ................................... 23
3.3. XPS confirms FTIR results .......................................................................... 24 3.4. Permeate water quality ................................................................................. 27
4. Electrocoagulation pretreatment and optimization ................................... 31
4.1. Super-Faradaic aluminum dissolution during electrocoagulation ............. 31 4.2. Electrocoagulation process optimization .................................................... 35 4.3. Bacteria removal and inactivation during aluminum electrocoagulation.. 38 4.4. Temperature effects during EC .................................................................... 42
4.4.1. Evaluation of electrocoagulation parameters.................................... 43 4.4.2. The effect of temperature on aluminum dissolution during electrocoagulation ......................................................................................... 44 4.4.3. Temperature effects on dissolved and particulate aluminum bulk concentrations ............................................................................................... 51
5. MF flux enhancement after EC pretreatment ............................................ 53
5.1. Mathematical modeling ................................................................................ 53 5.2. Overall effects of electrocoagulation........................................................... 54 5.3. Flux decline mechanisms ............................................................................. 58
6. EC pretreatment effects on nanofilter fouling ............................................ 67
Contents
ii
6.1. NF fouling profiles comparison ................................................................... 67 6.2. Identification of dominant surface functionalities on virgin and fouled
nanofilters using ATR-FTIR ........................................................................ 68 6.2.1. Virgin membrane ................................................................................ 68 6.2.2. MF-only pretreatment ........................................................................ 70 6.2.3. EC-MF pretreatment .......................................................................... 70
6.3. Evidence of NOM fouling by XPS .............................................................. 72 6.4. NF permeate water quality considerations .................................................. 74
7. Summary and conclusions ............................................................................. 79
7.1. NF membrane selection ................................................................................ 79 7.2. Electrocoagulation pretreatment .................................................................. 80 7.3. MF flux enhancement after EC pretreatment .............................................. 81 7.4. EC pretreatment effects on nanofilter fouling ............................................ 81
8. Overall conclusions and recommendations ................................................. 83
9. References ......................................................................................................... 85
NF quality control and assurance ........................................................................... 1
Appendix: NF quality control and assurance
Tables Table 2-1.—Composition of Foss Reservoir water measured after receipt in our labs
(September 2014 to November 2015). ..........................................................8 Table 2-2.—Composition of model scaling solution. .........................................................9 Table 2-3.—Characteristics of the NF270 and NF90 membranes a. ...............................13 Table 3-1.—Relative atomic percentage of elements of virgin and fouled membrane
surfaces. ....................................................................................................24 Table 3-2.—Major ion concentrations in feed, permeate, and retentate streams
for NF270 membrane (mg/L) ......................................................................29 Table 3-3.—Major ion concentrations in feed, permeate, and retentate streams
for NF90 membrane (mg/L) ........................................................................29 Table 3-4.—DOC concentrations and UV254 in feed, permeate, and retentate streams
for NF270 and NF90 (pretreated Foss Reservoir water) (mg/L) ..................29 Table 5-1.—Microfiltration experiments with raw and electrocoagulated water
from Foss Reservoir. ..................................................................................53 Table 5-2.—Fouling mechanisms characterized by blocking laws. .................................54 Table 6-1.—Average elemental composition of virgin and fouled NF membrane
surfaces from XPS survey scans. ...............................................................72
Advanced Pretreatment for Nanofiltration of Brackish Surface Water: Fouling Control and Water Quality Improvements
iii
Figures Figure 1-1. Foss Reservoir image taken in 2014. .............................................................1 Figure 2-1.—Bench-scale MF apparatus. ......................................................................10 Figure 2-2.— Foss Reservoir water during different stages of electrocoagulation. ..........11 Figure 2-3.—Scanning electron micrographs of fouled microfilters .................................11 Figure 2-4.—Bench-scale nanofiltration apparatus. .......................................................13 Figure 2-5.—Stainless-steel plate-and-frame NF/RO cell. ..............................................14 Figure 3-1.—Flux decline profiles for NF270 (left) and NF90 (right) for
model solution and Foss Reservoir water. .................................................17 Figure 3-2.—Electron micrographs of gypsum precipitated on NF90 membranes...........19 Figure 3-3.—Electron micrographs of the fouled NF90 (panel a) and NF270 . ................20 Figure 3-4.—ATR-FTIR spectra of virgin and fouled membranes. ..................................22 Figure 3-5.—XPS High resolution scans of virgin and fouled NF90 membranes. ............25 Figure 3-6.—XPS High resolution scans of virgin and fouled NF270 membranes. ..........26 Figure 4-1.—Total aluminum generated during electrolysis as a function of time (panel a)
and electrical charge passage (panel b). ...................................................32 Figure 4-2.—Electron micrographs of a new aluminum rod ............................................34 Figure 4-3.—Electrocoagulation process optimization measured by DOC removal and
SUVA as a function of aluminum dosage .................................................36 Figure 4-4.—Optical images of flocs formed by electrocoagulation at different aluminum
dosages....................................................................................................37 Figure 4-5.—Aluminum electrocoagulation releases small amounts of free chlorine. ......38 Figure 4-6.—Super-Faradaic dissolution of aluminum during electrolysis of a saline
solution. ....................................................................................................39 Figure 4-7.—Constant bacterial concentrations and viability ..........................................39 Figure 4-8.—Bacteria removal/inactivation following electrocoagulation. ........................40 Figure 4-9.—Bacteria removal/inactivation following electrocoagulation of raw Foss
Reservoir water at a dosage of 30 mg Al/L. ...............................................41 Figure 4-10.—Rapid bacteria inactivation in the positive control experiment where free
chlorine was externally added. The concentration chosen was similar to the value electrochemically generated and depicted in Figure 4-5. ..................42
Figure 4-11.—Continuous monitoring of temperature throughout the duration of electrolysis................................................................................................43
Figure 4-12.—Effect of temperature on the electrolysis voltage......................................44 Figure 4-13.—Super-faradaic aluminum dissolution during electrolysis of synthetic water
at different temperatures: (a) 5 °C, (b) 25 °C, (c) 37 °C, and (d) 51 °C. The current efficiencies of aluminum dissolution at different temperatures (e). As/L = ampere second per liter .................................................................46
Figure 4-14.—Scanning electron micrographs of aluminum anode prior to electrolysis (first row), after electrolysis at 5 °C (second row), at 25 °C (third row), and at 51 °C (fourth row) using synthetic water. ...................................................47
Figure 4-15.—Super-Faradaic aluminum dissolution during electrolysis of Foss Reservoir water at different temperatures: (a) 5 °C, (b) 25 °C, (c) 37 °C, and (d) 51 °C. The current efficiencies of aluminum dissolution at different temperatures (e). ......................................................................................49
Figure 4-16.—Scanning electron micrographs of aluminum anode prior to electrolysis (first row), after electrolysis at 5 °C (second row), at 25 °C (third row), and at 51 °C (fourth row) using Foss Reservoir water. .........................................50
Figure 4-17.—Geometric facets showing the crystallographic nature of pitting following electrolysis in synthetic water (a) and Foss Reservoir water (b). The scale bars in both images represent 10 µm. .......................................................51
Figure 4-18.—Dissolved aluminum concentration measured at different electrolysis time at 5, 37, and 51 °C at pH 5.5. ....................................................................52
Contents
iv
Figure 4-19.—Dissolved and particulate aluminum concentration (in percentage) measured at different electrolysis time at 5, 37, and 51 °C at pH 5.5. ........52
Figure 5-1.—Improvements in permeate flux following electrocoagulation pretreatment (cycle 1)....................................................................................................54
Figure 5-2.—Improvements in permeate flux following electrocoagulation pretreatment (cycle 2)....................................................................................................55
Figure 5-3.—Improvements in permeate flux following electrocoagulation pretreatment (cycle 3)....................................................................................................55
Figure 5-4.—Flux recovery after hydraulic cleaning (electrocoagulated water). ..............56 Figure 5-5.—Flux recovery after hydraulic cleaning (untreated water). ...........................56 Figure 5-6.—Volume filtered per unit membrane area as a function of filtration duration
(cycle 1)....................................................................................................57 Figure 5-7.—Volume filtered per unit membrane area as a function of filtration duration
(cycle 2)....................................................................................................57 Figure 5-8.—Volume filtered per unit membrane area as a function of filtration duration
(cycle 3)....................................................................................................58 Figure 5-9.—Dominance of cake filtration for microfilter fouling following
electrocoagulation pretreatment (cycle 1). .................................................59 Figure 5-10.—Dominance of cake filtration for microfilter fouling following
electrocoagulation pretreatment (cycle 2). .................................................59 Figure 5-11.—Dominance of cake filtration for microfilter fouling following
electrocoagulation pretreatment (cycle 3). .................................................60 Figure 5-12.—Dominance of intermediate blocking for microfilter fouling for untreated
Foss Reservoir water (cycle 1). .................................................................61 Figure 5-13.—Dominance of intermediate blocking for microfilter fouling for untreated
Foss Reservoir water (cycle 2). .................................................................61 Figure 5-14.—Dominance of intermediate blocking for microfilter fouling for untreated
Foss Reservoir water (cycle 3). .................................................................62 Figure 5-15.—Scanning electron micrographs of microfiltration membrane surfaces: virgin
membrane (left), untreated Foss Reservoir water (center), and after three cycles of filtering electrocoagulated water (right). The scale bar represents 10 µm. ......................................................................................................62
Figure 5-16.—Integrated blocking law analysis for electrocoagulated water (cycle 1). ...63 Figure 5-17.—Integrated blocking law analysis for electrocoagulated water (cycle 2). ...64 Figure 5-18.—Integrated blocking law analysis for electrocoagulated water (cycle 3). ...64 Figure 5-19.—Integrated blocking law analysis for raw water (cycle 1). ..........................64 Figure 5-20.—Integrated blocking law analysis for raw water (cycle 2). ..........................65 Figure 5-21.—Integrated blocking law analysis for raw water (cycle 3). ..........................65 Figure 6-1.—NF flux profiles following MF-only pretreatment, EC-MF pretreatment, and
for the model solution................................................................................68 Figure 6-2.—ATR-FTIR spectra of virgin and fouled membranes. ..................................69 Figure 6-3.—Fragments of CaCO3 crystals visible after nanofiltration of EC-MF pretreated
Foss Reservoir water. The scale bar represents 4 µm. ..............................71 Figure 6-4.—High resolution scans of C1s and O1s regions for virgin and fouled
membrane. ...............................................................................................73 Figure 6-5.—Observed rejection of major ions by nanofiltration of Foss Reservoir water
with MF-only and EC-MF pretreatment. Data from experiments with the model solution are also shown for comparison. .........................................75
Figure 6-6.—Electron micrographs of the virgin nanofilter (a-b), after fouling by MF-only pretreatment of Foss Reservoir water (c-d), after fouling by EC-MF pretreated Foss Reservoir water (e-f), and model solution (g-h). The images in the top row were obtained at a magnification of 1,000x where the scale bars represent 100 µm. Higher magnification (1,8000x) images are shown in the bottom row where the scale bars represent 4 µm. ...............................77
Advanced Pretreatment for Nanofiltration of Brackish Surface Water: Fouling Control and Water Quality Improvements
1
1. INTRODUCTION
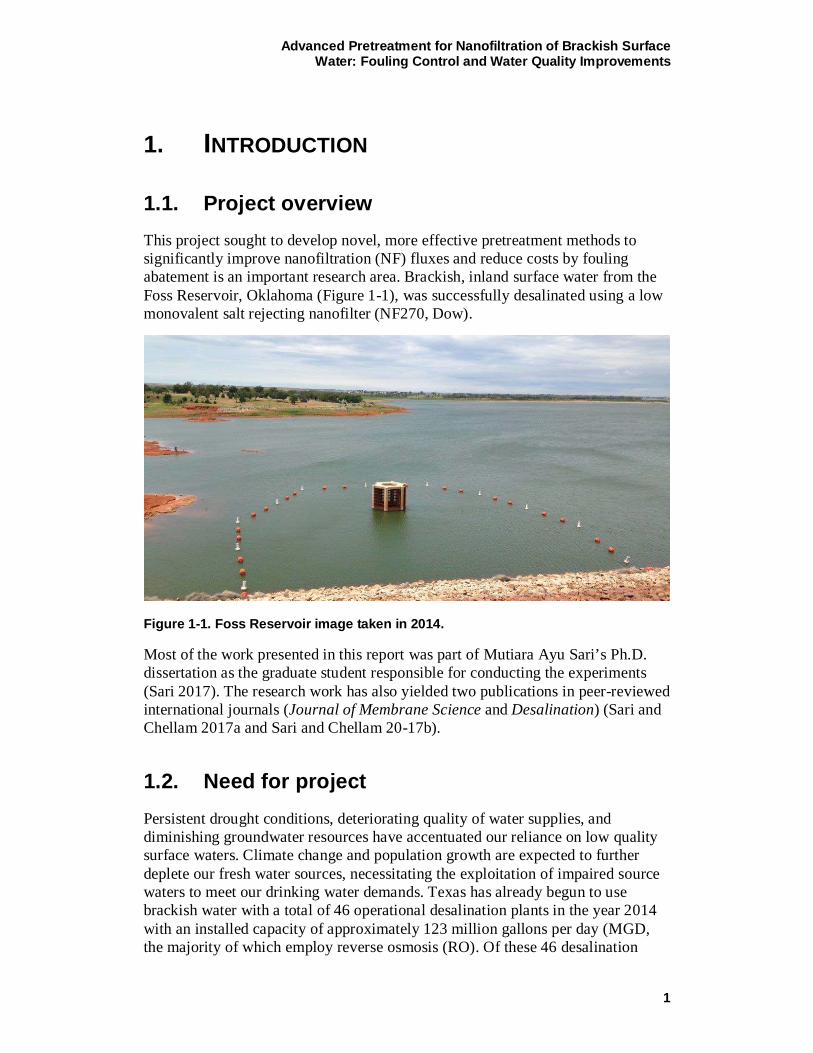
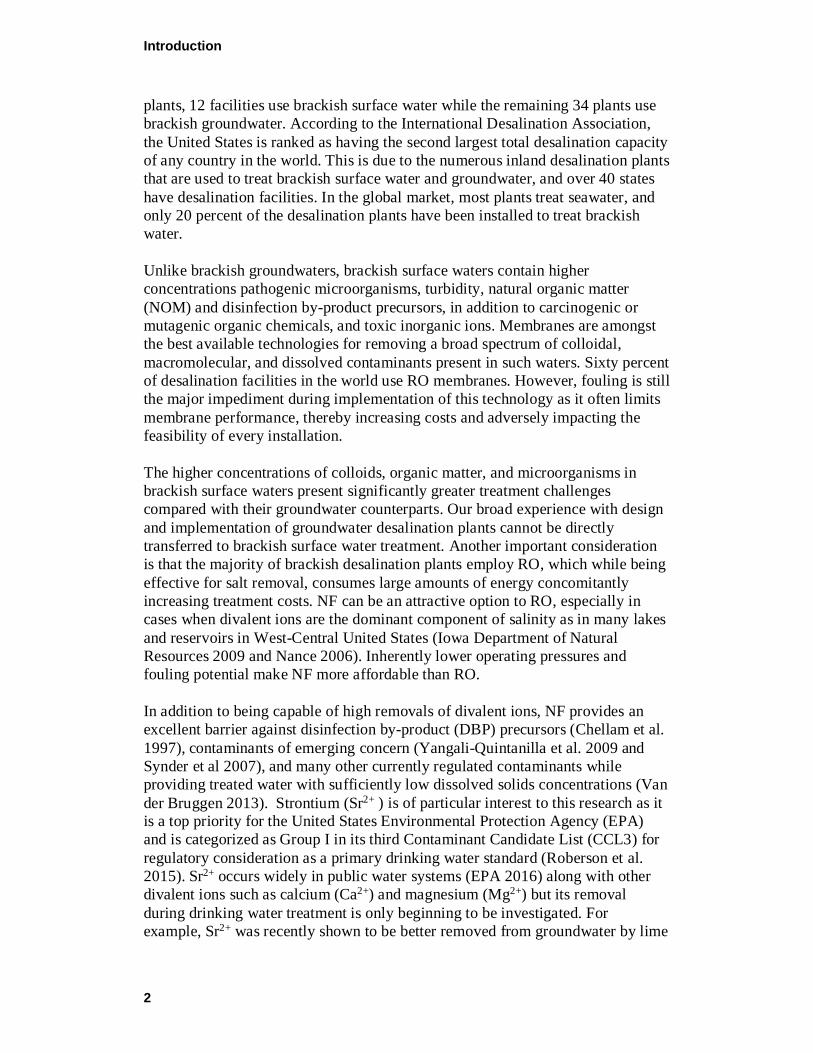
1.1. Project overview This project sought to develop novel, more effective pretreatment methods to significantly improve nanofiltration (NF) fluxes and reduce costs by fouling abatement is an important research area. Brackish, inland surface water from the Foss Reservoir, Oklahoma (Figure 1-1), was successfully desalinated using a low monovalent salt rejecting nanofilter (NF270, Dow).
Figure 1-1. Foss Reservoir image taken in 2014.
Most of the work presented in this report was part of Mutiara Ayu Sari’s Ph.D. dissertation as the graduate student responsible for conducting the experiments (Sari 2017). The research work has also yielded two publications in peer-reviewed international journals (Journal of Membrane Science and Desalination) (Sari and Chellam 2017a and Sari and Chellam 20-17b).
1.2. Need for project Persistent drought conditions, deteriorating quality of water supplies, and diminishing groundwater resources have accentuated our reliance on low quality surface waters. Climate change and population growth are expected to further deplete our fresh water sources, necessitating the exploitation of impaired source waters to meet our drinking water demands. Texas has already begun to use brackish water with a total of 46 operational desalination plants in the year 2014 with an installed capacity of approximately 123 million gallons per day (MGD, the majority of which employ reverse osmosis (RO). Of these 46 desalination
Introduction
2
plants, 12 facilities use brackish surface water while the remaining 34 plants use brackish groundwater. According to the International Desalination Association, the United States is ranked as having the second largest total desalination capacity of any country in the world. This is due to the numerous inland desalination plants that are used to treat brackish surface water and groundwater, and over 40 states have desalination facilities. In the global market, most plants treat seawater, and only 20 percent of the desalination plants have been installed to treat brackish water. Unlike brackish groundwaters, brackish surface waters contain higher concentrations pathogenic microorganisms, turbidity, natural organic matter (NOM) and disinfection by-product precursors, in addition to carcinogenic or mutagenic organic chemicals, and toxic inorganic ions. Membranes are amongst the best available technologies for removing a broad spectrum of colloidal, macromolecular, and dissolved contaminants present in such waters. Sixty percent of desalination facilities in the world use RO membranes. However, fouling is still the major impediment during implementation of this technology as it often limits membrane performance, thereby increasing costs and adversely impacting the feasibility of every installation. The higher concentrations of colloids, organic matter, and microorganisms in brackish surface waters present significantly greater treatment challenges compared with their groundwater counterparts. Our broad experience with design and implementation of groundwater desalination plants cannot be directly transferred to brackish surface water treatment. Another important consideration is that the majority of brackish desalination plants employ RO, which while being effective for salt removal, consumes large amounts of energy concomitantly increasing treatment costs. NF can be an attractive option to RO, especially in cases when divalent ions are the dominant component of salinity as in many lakes and reservoirs in West-Central United States (Iowa Department of Natural Resources 2009 and Nance 2006). Inherently lower operating pressures and fouling potential make NF more affordable than RO. In addition to being capable of high removals of divalent ions, NF provides an excellent barrier against disinfection by-product (DBP) precursors (Chellam et al. 1997), contaminants of emerging concern (Yangali-Quintanilla et al. 2009 and Synder et al 2007), and many other currently regulated contaminants while providing treated water with sufficiently low dissolved solids concentrations (Van der Bruggen 2013). Strontium (Sr2+ ) is of particular interest to this research as it is a top priority for the United States Environmental Protection Agency (EPA) and is categorized as Group I in its third Contaminant Candidate List (CCL3) for regulatory consideration as a primary drinking water standard (Roberson et al. 2015). Sr2+ occurs widely in public water systems (EPA 2016) along with other divalent ions such as calcium (Ca2+) and magnesium (Mg2+) but its removal during drinking water treatment is only beginning to be investigated. For example, Sr2+ was recently shown to be better removed from groundwater by lime
Advanced Pretreatment for Nanofiltration of Brackish Surface Water: Fouling Control and Water Quality Improvements
3
softening and NF (O'Donnell 2016 and Richards et al. 2011) than from surface water by conventional treatment processes (O'Donnell 2016). It has also been artificially spiked to a freshwater source and shown to be very well removed by low-pressure RO (Ding et al 2016). To our knowledge, there are no reports of the removal of naturally occurring Sr2+ from saline surface water by NF. Successful implementation of NF for brackish surface water treatment is predicated on adequate pretreatment. In fact, overcoming pretreatment deficiencies to produce RO feed water with silt density index (SDI) < 4 has resulted in the stable operation of the Tampa Bay Water Desalination Facility. Similar examples abound in less high profile installations. Therefore, developing novel, more effective pretreatment methods to significantly improve NF fluxes and reduce costs by fouling abatement is an important research area.
1.3. Project background and overview The Washita Basin provides municipal and industrial water to over 40,000 people in six cities. The Bureau of Reclamation (Reclamation) has a long history with this basin providing a regional water supply to West-Central Oklahoma since the 1960s. In particular, Foss Reservoir provides municipal water through the regional water treatment plant to 15,000 people across multiple counties. The Foss Reservoir Master Conservancy District currently operates an electrodialysis reversal plant. New treatment solutions incorporating microfiltration (MF) pretreatment to RO are being evaluated by local and Federal water purveyors in this area to better purify brackish Foss Lake water and to meet growing demands. Initial pilot-testing proved unsuccessful due to severe RO fouling that necessitated almost daily chemical cleaning of membranes, which clearly demonstrates the importance of adequate pretreatment. Several portions of the Western United States, including Oklahoma and Texas have experienced persistent drought conditions. In particular, West-Central Oklahoma experienced one of the worst one year droughts on record in 2011, and Custer County has remained at some stage of abnormal to exceptional drought since that time. Traditional water sources have been depleted—forcing migration to impaired sources. For example, the record-breaking drought in 2011 significantly diminished the reliability of Clinton Lake as a supply source, and the City of Clinton had to use Foss Reservoir for all of its water supply. The increased use of Foss Reservoir by communities who in the past had used other fresh water supplies as their primary source pushed the electrodialysis reversal plant to its treatment capacity. At that time, the plant’s inefficiencies further accelerated the depleted lake levels—making all of Foss Reservoir Master Conservancy District's member cities especially vulnerable. To make matters worse, the firm yield of Foss Reservoir is not enough to meet the entire current demand, let alone future demands of all its member cities. These considerations require innovative and advanced technologies for desalinating brackish surface water.
Introduction
4
This research focuses on the development of an innovative treatment train comprising electrocoagulation (EC) prior to MF, followed by NF for brackish surface waters. MF alone as a pretreatment does not remove significant amounts of NOM as it primarily only reduces colloidal fouling in downstream NF/RO membranes. Therefore, we hypothesized that adding a pretreatment that coule remove NOM would enhance both MF and NF specific fluxes in integrated membrane systems by simultaneously reducing both organic and colloidal fouling. We used an innovative EC process treatment before MF to enhance NOM and particle removal and control downstream MF and NF fouling. In this research, we considered improvements in MF and NF fluxes and reductions in contaminant concentrations (especially total dissolved solids, NOM and DBP precursors) in the filtered water. Mechanistic knowledge on EC, MF, and NF on the overall topic of brackish surface water desalination was also generated. To our knowledge, this was the first rigorous and systematic investigation of such a combination of treatment processes for purifying impaired brackish surface water. Electrochemical technologies are significantly more sustainable since they consume lower amounts of chemicals and energy and decrease sludge production especially when implemented for brackish water. They are also highly robust and amenable to automation, thereby reducing the need for skilled operators allowing such advanced technologies to be reliably implemented in small (potentially economically disadvantaged) communities. This research also provided detailed site-specific information to several cities in West-Central Oklahoma and Texas and established design parameters for larger-scale testing of these processes in the near future. Through improved treatment solutions Foss Reservoir could potentially conserve 9,000 acre feet per year (AFY) of water that is wasted through their existing inefficient treatment, thus strengthening and expanding their depleting water supply during times of drought. Other entities that use Lake Texoma near the Texas-Oklahoma border could potentially conserve fresh blending water required to treat 113,000 AFY of water using conventional treatment. Although no hard data could be found to support the amount of brackish surface currently available that could be treated for municipal and industrial uses, these are just many examples of entities that could benefit from improved surface water desalination technology.
1.4. Project goal and objectives This project’s main goal is to understand the basic principles for optimizing aluminum EC process in conjunction with membrane separation systems (MF and NF) for purifying brackish surface water. The overall hypothesis is that aluminum EC, which generates aluminium hydroxide Al(OH)3 precipitates in situ to facilitate partial removal of dissolved and macromolecular organic contaminants, can significantly reduce fouling in downstream membrane-based water treatment operations. T achieve this goal, the specific objectives include:
Advanced Pretreatment for Nanofiltration of Brackish Surface Water: Fouling Control and Water Quality Improvements
5
a) Comprehensively analyze the physicochemical characteristics of the raw Foss Reservoir water and characterize its NOM content through fractionation
b) Generate operational and water quality data for two candidate NF membranes and select the appropriate membrane based on their performance for EC pretreatment evaluations
c) Extensively evaluate the efficacy of aluminum EC pretreatment in removing NOM and reducing MF fouling
d) Enumerate removal/inactivation of bacteria by EC
e) Determine temperature (and seasonal) effects during aluminum EC pretreatment
f) Measure differences in NF fouling rates as well as salt and NOM for two types of feed water: MF pretreated and EC-MF pretreated
g) Identify organic and elemental foulants using microscopy and spectroscopy to isolate fouling mechanisms
h) Provide preliminary information for design and operation to assist in scale-up of these processes for future pilot-scale testing

Advanced Pretreatment for Nanofiltration of Brackish Surface Water: Fouling Control and Water Quality Improvements
7
2. MATERIALS AND METHODS
2.1. Source water characterization Experiments were performed with water samples taken from Foss Reservoir between September 2014 and November 2015. Samples were stored at 4 degrees Celsius (°C) immediately upon receipt to reduce microbial growth and organic degradation. Several water quality parameters were monitored after bringing samples to room temperature and after pre-filtration (using a 0.45 µm syringe filter over the duration of experimentation):
• pH and conductivity were measured using probes (PHC28101 andCDC401 probes for pH and conductivity respectively, attached to aHQD430d bench-top meter)
• Alkalinity and calcium and total hardness were measured by titration(Hach method 8203, 8213, and 10253 respectively)
• Total dissolved solids (TDS) were measured gravimetrically aftercomplete evaporation at 60 °C
• Dissolved organic carbon (DOC) and ultraviolet absorbance at 254nanometers (nm) wavelength (UV254) were quantified instrumentally(Shimadzu TOC-L and HACH DR6000, respectively)
• NOM fractionation was conducted using Supelite DAX-8 resin (SigmaAldrich) to separate the hydrophobic and hydrophilic portions
• Major cations (calcium [Ca], magnesium [Mg], potassium [K], sodium[Na], aluminum [Al], and iron [Fe]) were measured by inductivelycoupled plasma – mass spectrometry (ICP-MS)
• Turbidity was measured using a ratio turbidimeter (HACH 2100N)
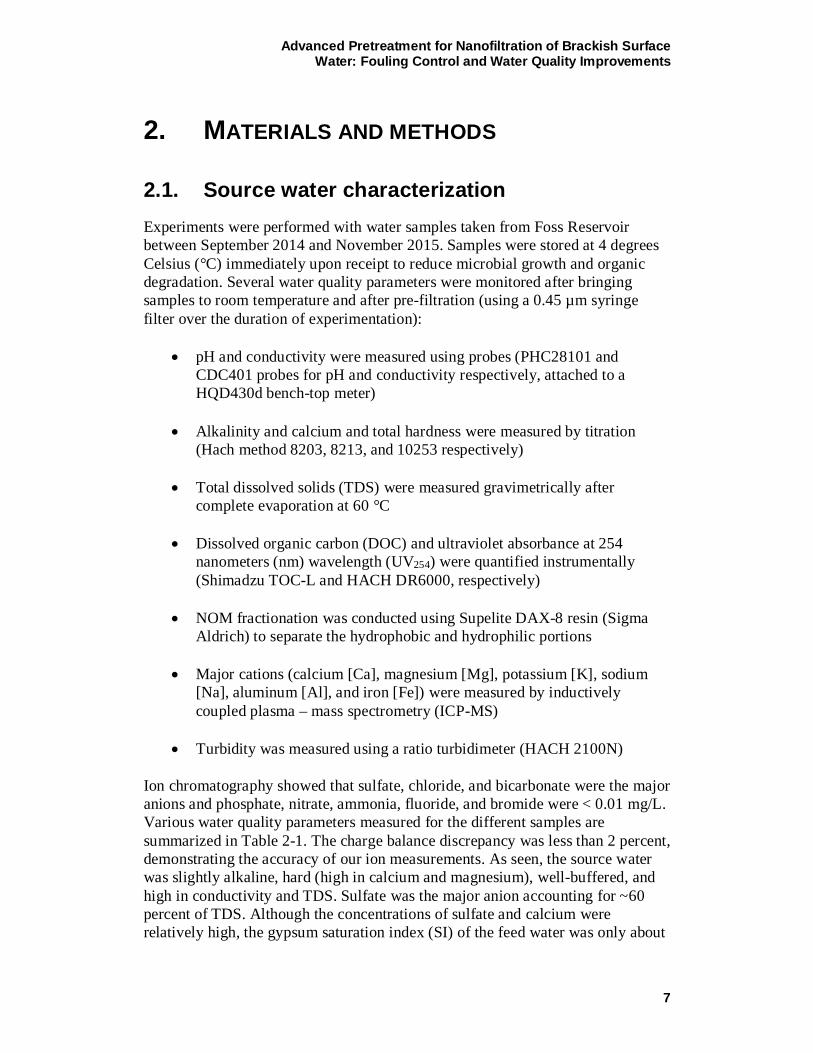
Ion chromatography showed that sulfate, chloride, and bicarbonate were the major anions and phosphate, nitrate, ammonia, fluoride, and bromide were < 0.01 mg/L. Various water quality parameters measured for the different samples are summarized in Table 2-1. The charge balance discrepancy was less than 2 percent, demonstrating the accuracy of our ion measurements. As seen, the source water was slightly alkaline, hard (high in calcium and magnesium), well-buffered, and high in conductivity and TDS. Sulfate was the major anion accounting for ~60 percent of TDS. Although the concentrations of sulfate and calcium were relatively high, the gypsum saturation index (SI) of the feed water was only about
Materials and methods
8
0.5, indicating low possibility of gypsum precipitation during membrane filtration. The gypsum SI for the feed water was calculated using the public domain Reverse Osmosis System Analysis (ROSA) software created by Dow (Dow Water and Process Solutions 2017). The Langlier saturation index (LSI) (Snoeyink. and Jenkins 1980) of about 0.45 also indicates only a low potential for calcium carbonate (CaCO3) scaling. However, it should be noted that concentration polarization will increase the ionic concentration near the membrane surface allowing gypsum and/or CaCO3 to precipitate depending on specific operating conditions and the type of nanofilter employed (i.e. “tight” or “loose” membrane). Therefore, membrane selection is a crucial step in successful implementation of NF for desalination.
Table 2-1.—Composition of Foss Reservoir water measured after receipt in our labs (September 2014 to November 2015).
Parameter Unit Value
Sept. 2014 Feb. 2015 May 2015 Nov. 2015 pH - 7.86 ± 0.13 8.04 ± 0.1 8.02 ±
0.04 8.0 ± 0.2
Turbidity NTU 9.24 ± 1.88 4.6 ± 0.6 2.5 ± 0.8 2.2 ± 0.6 DOC mg/L 8.0 ± 0.32 8.5 ± 0.4 9.3±0.235 9.4 ± 0.5 UV254 cm-1 0.101 ±
0.008 0.094 ± 0.0009
0.104 ±0.003
0.110 ± 0.004
Conductivity µS/cm 2852 ± 192 3142 ± 42 2770 ± 70 2766 ± 235 TDS mg/L 1711 ±
33.5 2199 ± 46.3 1939 ± 42
Alkalinity mg/L as CaCO3
93.9 ± 7.63 115.2 ± 2.8 122 ±4.9 115.8 ± 2.0
Ca Hardness mg/L as CaCO3
697 ± 57 864 ± 40 803 ±22 720.3 ± 3.54
Total Hardness
mg/L as CaCO3
1671 ± 124 1941 ± 38 1800 ±70 1620.7 ± 10.61
Bicarbonate* mg/L 114.5 ± 9.3 140.4 ± 3.4 148.8 ± 6.1
141.2 ± 2.4
Silicon mg/L 14.0 ± 0.2 - - 13.8 ± 0.2 Chloride mg/L 90.2 ± 0.28 96.3 ± 5.5 - 174.5 ± 21 Sulfate mg/L 1757 ± 1.4 1653 ± 111 - 1623.5 ± 90 Sodium mg/L 180.5 ± 3.7 - - 199.2 ± 8.2 Calcium mg/L 281.5 ± 6 - - 286.9 ± 7.7 Magnesium mg/L 238.1 ± 9.8 - - 218.1 ± 12.9 Potassium mg/L 12.8 ± 0.5 - - 10.5 ± 1.2 Strontium mg/L 6.4 ± 0.1 - - 8.8 ± 1.0 Aluminum mg/L 0.2 ± 0.002 - - 0.5 ± 0.002 Iron mg/L 0.7 ± 0.006 - - - SI (gypsum) - 0.55 - - 0.54 LSI - 0.44 - - 0.51
*Bicarbonate concentration is calculated based on the alkalinity, i.e. mg/L alkalinity as HCO3- = 1.22 x mg/L total alkalinity as CaCO3, assuming most of the alkalinity is due to bicarbonate.
Advanced Pretreatment for Nanofiltration of Brackish Surface Water: Fouling Control and Water Quality Improvements
9
Also as seen in Table 2-1, the Foss Reservoir water quality remained relatively stable in the timeframe of our experiments. However, the turbidity decreased from about 9 Nephelometric Turbidity Unit (NTU) to 2 NTU and the alkalinity and bicarbonate concentrations were low in Sept. 2014 compared with other samples. In contrast, the chloride ion concentration in the final sample (obtained in November 2015) was the highest. The NOM concentrations were moderate, ranging between 8 – 9 milligrams per liter (mg/L) DOC. The average specific UV absorbance (in specific ultraviolet light absorbance [SUVA], the ratio of UV254 in inverse meters, (m-1 ) and DOC concentration in mg/L) was low, only 1.16 ± 0.07 meters liters per milligram, (m-L/mg). This indicates that non-humic, highly hydrophilic, and low molecular weight compounds were dominant components of NOM in Foss Reservoir (Weishaar et al. 2003 and Hua and Reckhow 2007). One of the samples (from May 2015) was further fractionated using Supelite DAX-8 resin (Sigma Aldrich) showed that the NOM was 76 percent hydrophilic and 24 percent hydrophobic, consistent with its low SUVA value.
2.2. Synthetic water or model solution In order to operationally separate inorganic and organic fouling, baseline NF experiments were performed with a synthetic solution having similar ionic composition and pH to the Foss Reservoir water except it had no organic matter (Table 2-2).
Table 2-2.—Composition of model scaling solution. Salt Concentration (mg/L)
Na2SO4 439.4 MgSO4 1213.1 CaCO3 180.0 CaSO4 698.5 NaCl 43.5 HCl 65.6
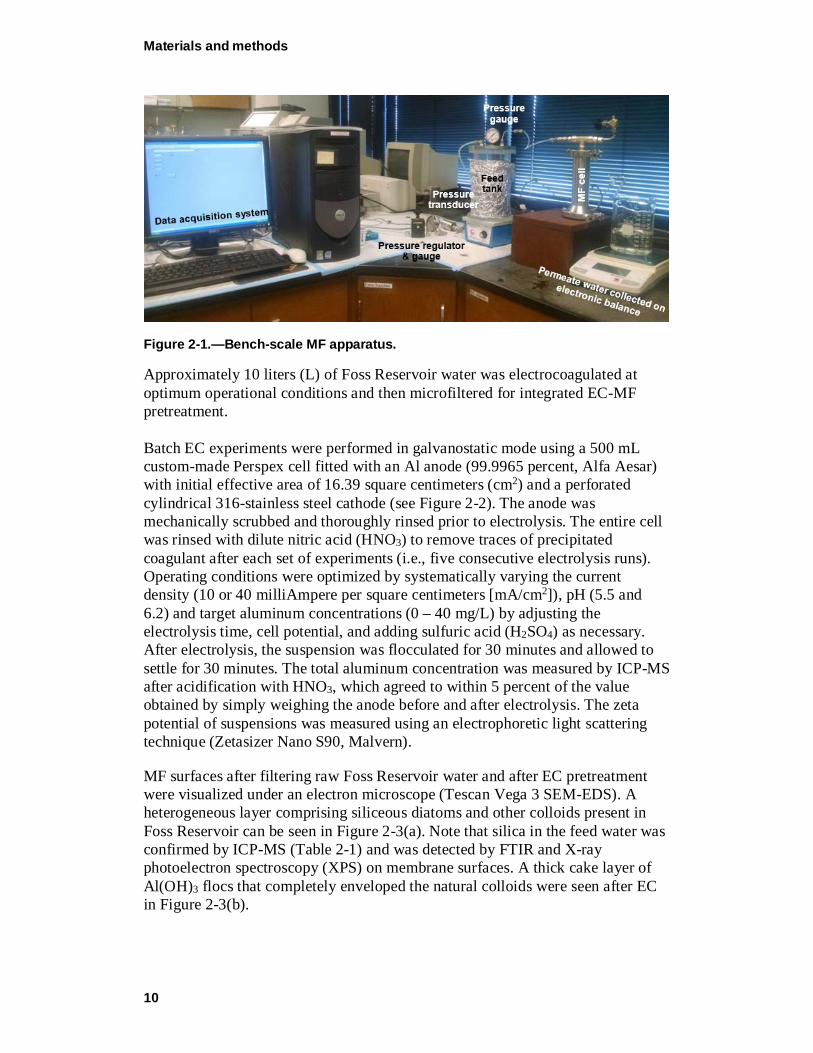
2.3. Electrocoagulation and MF pretreatment Two NF pretreatment processes were evaluated; MF-only and EC followed by MF. Dead-end MF was performed at constant pressure (20 pounds per square inch gauge [psig], 1.38 bar) using a 300 milliliter (mL)stainless steel stirred cell (SEPA ST, Osmonics) and 0.22 µm modified polyvinylidene difluoride (PVDF) membranes (GVWP04700, Millipore). Figure 2-1 shows a photograph of the microfiltration apparatus.
Materials and methods
10
Figure 2-1.—Bench-scale MF apparatus.
Relief valve Approximately 10 liters (L) of Foss Reservoir water was electrocoagulated at optimum operational conditions and then microfiltered for inte F pretreatment.
grated EC-M
using a 500 m
MF
cell
Batch EC experiments were performed in galvanostatic mode L custom-made Perspex cell fitted with an Al anode (99.9965 percent, Alfa Aesar) with initial effective area of 16.39 square centimeters (cm2) and a perforated cylindrical 316-stainless steel cathode (see Figure 2-2). The anode was mechanically scrubbed and thoroughly rinsed prior to electrolysis. The entire cell was rinsed with dilute nitric acid (HNO3) to remove traces of precipitated coagulant after each set of experiments (i.e., five consecutive electrolysis runs). Operating conditions were optimized by systematically varying the current density (10 or 40 milliAmpere per square centimeters [mA/cm2]), pH (5.5 and 6.2) and target aluminum concentrations (0 – 40 mg/L) by adjusting the electrolysis time, cell potential, and adding sulfuric acid (H2SO4) as necessary. After electrolysis, the suspension was flocculated for 30 minutes and allowed to settle for 30 minutes. The total aluminum concentration was measured by ICP-MS after acidification with HNO3, which agreed to within 5 percent of the value obtained by simply weighing the anode before and after electrolysis. The zeta potential of suspensions was measured using an electrophoretic light scattering technique (Zetasizer Nano S90, Malvern).
MF surfaces after filtering raw Foss Reservoir water and after EC pretreatment were visualized under an electron microscope (Tescan Vega 3 SEM-EDS). A heterogeneous layer comprising siliceous diatoms and other colloids present in Foss Reservoir can be seen in Figure 2-3(a). Note that silica in the feed water was confirmed by ICP-MS (Table 2-1) and was detected by FTIR and X-ray photoelectron spectroscopy (XPS) on membrane surfaces. A thick cake layer of Al(OH)3 flocs that completely enveloped the natural colloids were seen after EC in Figure 2-3(b).
Advanced Pretreatment for Nanofiltration of Brackish Surface Water: Fouling Control and Water Quality Improvements
11
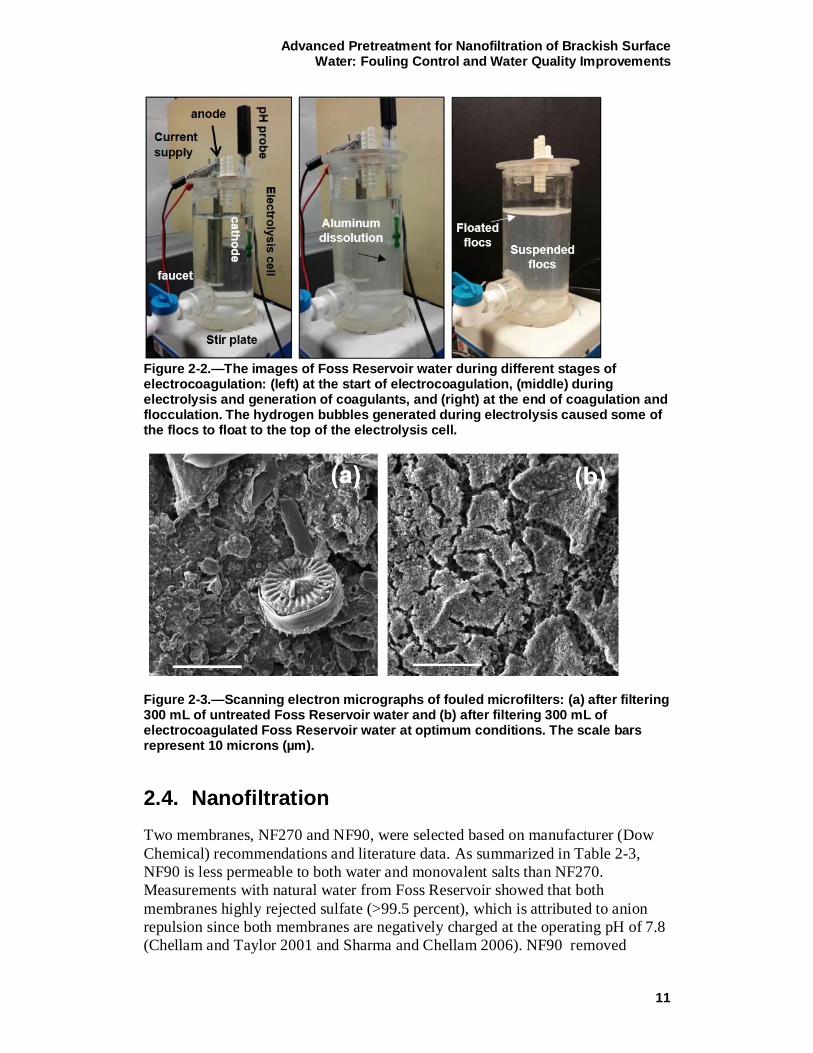
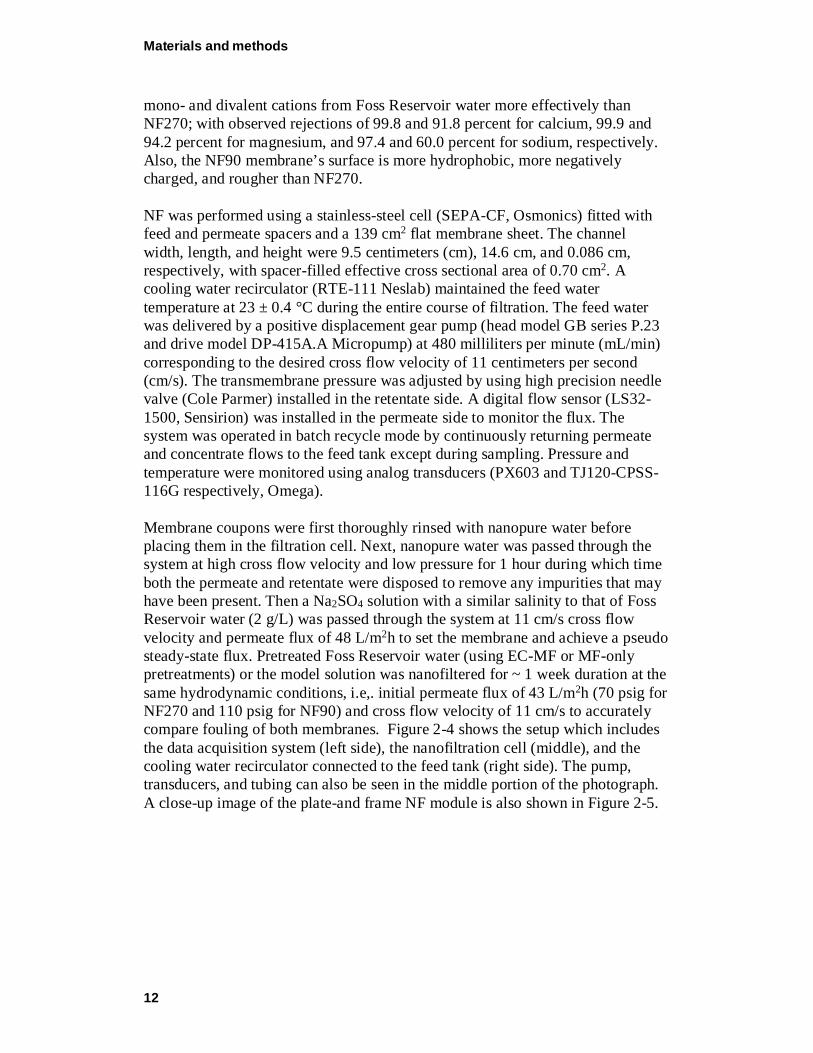
Figure 2-2.—The images of Foss Reservoir water during different stages of electrocoagulation: (left) at the start of electrocoagulation, (middle) during electrolysis and generation of coagulants, and (right) at the end of coagulation and flocculation. The hydrogen bubbles generated during electrolysis caused some of the flocs to float to the top of the electrolysis cell.
Figure 2-3.—Scanning electron micrographs of fouled microfilters: (a) after filtering 300 mL of untreated Foss Reservoir water and (b) after filtering 300 mL of electrocoagulated Foss Reservoir water at optimum conditions. The scale bars represent 10 microns (µm).
2.4. Nanofiltration Two membranes, NF270 and NF90, were selected based on manufacturer (Dow Chemical) recommendations and literature data. As summarized in Table 2-3, NF90 is less permeable to both water and monovalent salts than NF270. Measurements with natural water from Foss Reservoir showed that both membranes highly rejected sulfate (>99.5 percent), which is attributed to anion repulsion since both membranes are negatively charged at the operating pH of 7.8 (Chellam and Taylor 2001 and Sharma and Chellam 2006). NF90 removed
Materials and methods
12
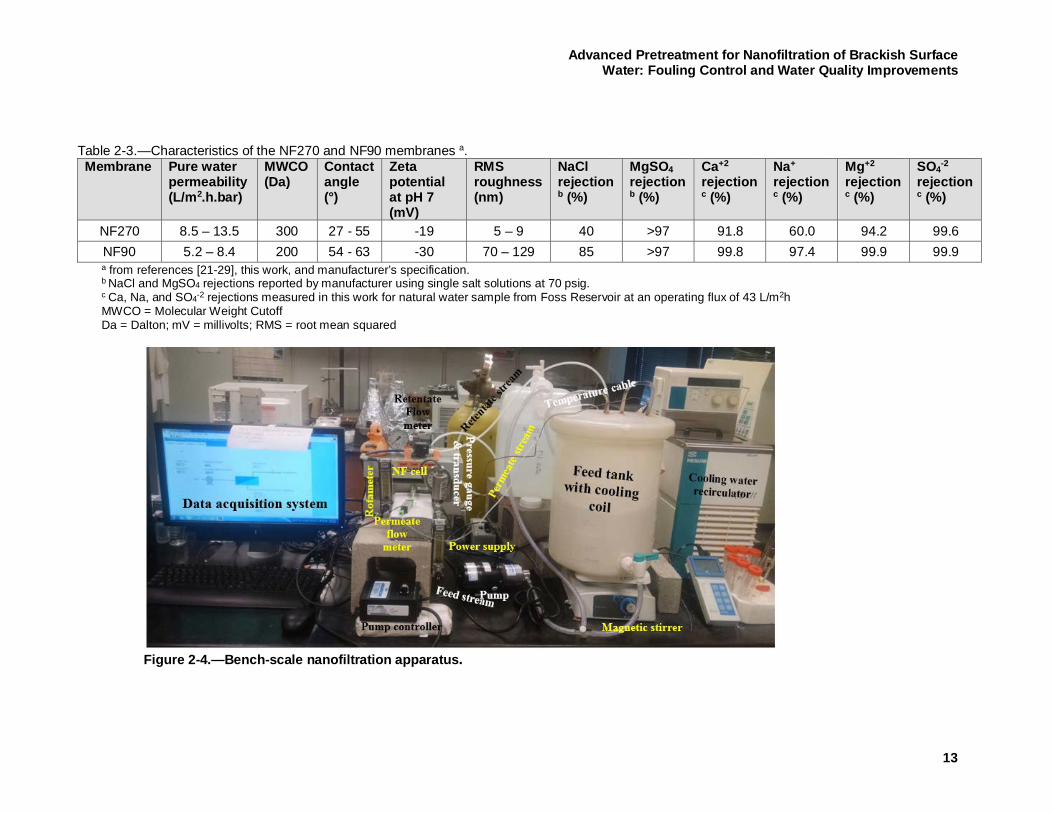
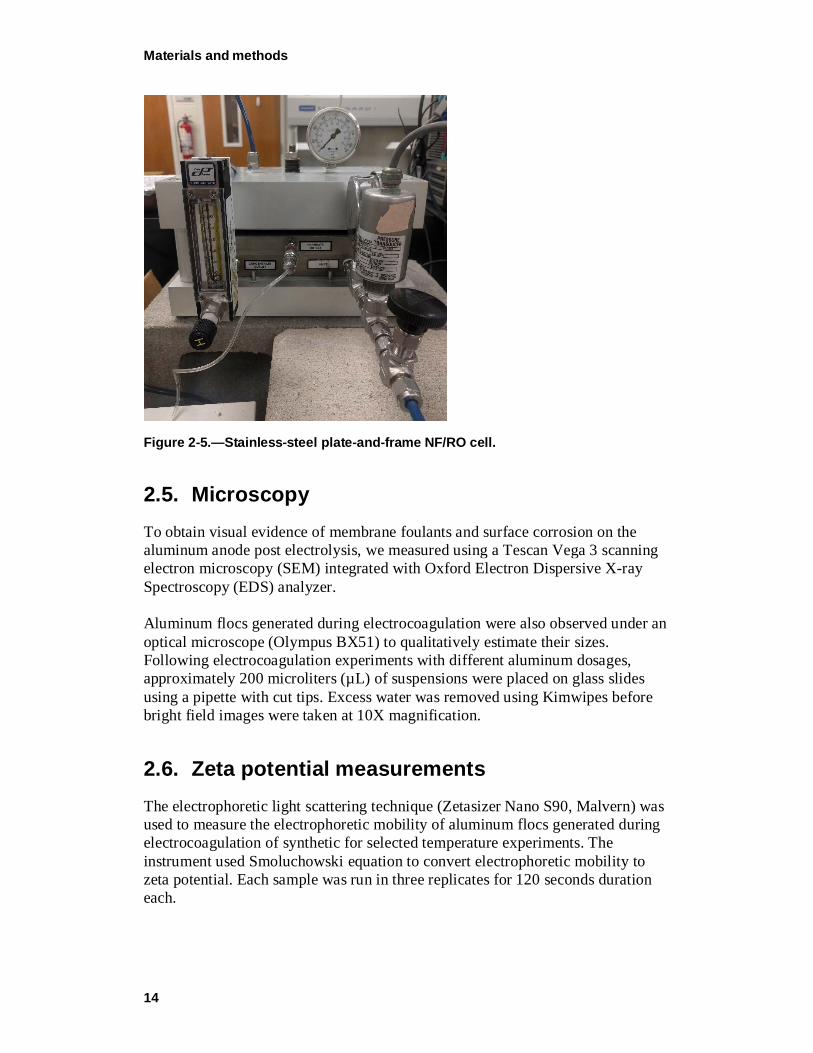
mono- and divalent cations from Foss Reservoir water more effectively than NF270; with observed rejections of 99.8 and 91.8 percent for calcium, 99.9 and 94.2 percent for magnesium, and 97.4 and 60.0 percent for sodium, respectively. Also, the NF90 membrane’s surface is more hydrophobic, more negatively charged, and rougher than NF270. NF was performed using a stainless-steel cell (SEPA-CF, Osmonics) fitted with feed and permeate spacers and a 139 cm2 flat membrane sheet. The channel width, length, and height were 9.5 centimeters (cm), 14.6 cm, and 0.086 cm, respectively, with spacer-filled effective cross sectional area of 0.70 cm2. A cooling water recirculator (RTE-111 Neslab) maintained the feed water temperature at 23 ± 0.4 °C during the entire course of filtration. The feed water was delivered by a positive displacement gear pump (head model GB series P.23 and drive model DP-415A.A Micropump) at 480 milliliters per minute (mL/min) corresponding to the desired cross flow velocity of 11 centimeters per second (cm/s). The transmembrane pressure was adjusted by using high precision needle valve (Cole Parmer) installed in the retentate side. A digital flow sensor (LS32-1500, Sensirion) was installed in the permeate side to monitor the flux. The system was operated in batch recycle mode by continuously returning permeate and concentrate flows to the feed tank except during sampling. Pressure and temperature were monitored using analog transducers (PX603 and TJ120-CPSS-116G respectively, Omega). Membrane coupons were first thoroughly rinsed with nanopure water before placing them in the filtration cell. Next, nanopure water was passed through the system at high cross flow velocity and low pressure for 1 hour during which time both the permeate and retentate were disposed to remove any impurities that may have been present. Then a Na2SO4 solution with a similar salinity to that of Foss Reservoir water (2 g/L) was passed through the system at 11 cm/s cross flow velocity and permeate flux of 48 L/m2h to set the membrane and achieve a pseudo steady-state flux. Pretreated Foss Reservoir water (using EC-MF or MF-only pretreatments) or the model solution was nanofiltered for ~ 1 week duration at the same hydrodynamic conditions, i.e,. initial permeate flux of 43 L/m2h (70 psig for NF270 and 110 psig for NF90) and cross flow velocity of 11 cm/s to accurately compare fouling of both membranes. Figure 2-4 shows the setup which includes the data acquisition system (left side), the nanofiltration cell (middle), and the cooling water recirculator connected to the feed tank (right side). The pump, transducers, and tubing can also be seen in the middle portion of the photograph. A close-up image of the plate-and frame NF module is also shown in Figure 2-5.
Advanced Pretreatment for Nanofiltration of Brackish Surface Water: Fouling Control and Water Quality Improvements
13
Table 2-3.—Characteristics of the NF270 and NF90 membranes a. Membrane Pure water
permeability (L/m2.h.bar)
MWCO (Da)
Contact angle (°)
Zeta potential at pH 7 (mV)
RMS roughness (nm)
NaCl rejectionb (%)
MgSO4 rejectionb (%)
Ca+2 rejectionc (%)
Na+ rejectionc (%)
Mg+2 rejectionc (%)
SO4-2
rejectionc (%)
NF270 8.5 – 13.5 300 27 - 55 -19 5 – 9 40 >97 91.8 60.0 94.2 99.6 NF90 5.2 – 8.4 200 54 - 63 -30 70 – 129 85 >97 99.8 97.4 99.9 99.9 a from references [21-29], this work, and manufacturer’s specification. b NaCl and MgSO4 rejections reported by manufacturer using single salt solutions at 70 psig. c Ca, Na, and SO4-2 rejections measured in this work for natural water sample from Foss Reservoir at an operating flux of 43 L/m2h MWCO = Molecular Weight Cutoff Da = Dalton; mV = millivolts; RMS = root mean squared
Figure 2-4.—Bench-scale nanofiltration apparatus.
Pressure gauge &
transducer
Materials and methods
14
Figure 2-5.—Stainless-steel plate-and-frame NF/RO cell.
2.5. Microscopy To obtain visual evidence of membrane foulants and surface corrosion on the aluminum anode post electrolysis, we measured using a Tescan Vega 3 scanning electron microscopy (SEM) integrated with Oxford Electron Dispersive X-ray Spectroscopy (EDS) analyzer. Aluminum flocs generated during electrocoagulation were also observed under an optical microscope (Olympus BX51) to qualitatively estimate their sizes. Following electrocoagulation experiments with different aluminum dosages, approximately 200 microliters (µL) of suspensions were placed on glass slides using a pipette with cut tips. Excess water was removed using Kimwipes before bright field images were taken at 10X magnification.
2.6. Zeta potential measurements The electrophoretic light scattering technique (Zetasizer Nano S90, Malvern) was used to measure the electrophoretic mobility of aluminum flocs generated during electrocoagulation of synthetic for selected temperature experiments. The instrument used Smoluchowski equation to convert electrophoretic mobility to zeta potential. Each sample was run in three replicates for 120 seconds duration each.
Advanced Pretreatment for Nanofiltration of Brackish Surface Water: Fouling Control and Water Quality Improvements
15
2.7. Attenuated total reflectance – Fourier transform infrared spectroscopy (ATR-FTIR)
After completing NF, membrane coupons were carefully retrieved, cut into smaller pieces, and dried in a vacuum desiccator for 24 hours. The infrared spectra of virgin and fouled membranes in the range of 650 – 4000 cm-1 were collected using Nicolet iS10 spectrometer (Thermo Scientific). The spectrometer was equipped with a Mid-infrared Ever-Glo source, deuterated-triglycine sulfate (DTGS) detector, potassium bromide (KBr) beam splitter, Omnic 9.0 Software, and a diamond iTX accessory to allow sampling in ATR mode. A background spectrum was collected on a clean ATR window prior to each analysis. The infrared spectrum of each sample presented herein is an average of four separate spectra, each consisting of 128 coadded scans at 4 cm-1 resolution, obtained from different locations to obtain representative information on dominant foulants. A 11 kilohertz (kHz) low-pass filter was also used to prevent aliasing along with a zero-filling factor of 2 using a Norton-Beer Strong apodization and Mertz correction.
2.8. X-ray photoelectron spectroscopy (XPS) A spectrometer equipped with a monochromatic Al Kα X-ray source (hν = 1486.7 electron volts, [eV]) incident at 90° relative to the axis of a hemispherical energy analyzer (PHI model 5700, Physical Electronics) was used to obtain further information on the elemental composition and functionalities of the surfaces of virgin and fouled membranes. Charging problems arising from the non-conducting nature of polymeric membrane were reduced by using a neutralizer. Samples were first scanned at pass energy of 187.85 eV for 5 minutes to obtain wide-scan spectra (0-1400 eV) which showed all elements present on the surface. High resolution (narrow) scans were then obtained for C1s and O1s regions for NF270 and C1s, O1s, Ca2p and S2p for NF90 at pass energy of 23.5 eV and 45° take-off angle. Electron binding energies were calibrated with respect to the C1s line at 285 eV, corresponding to adventitious carbon. Peak areas for C1s, O1s, Ca2p, and S2p regions were obtained assuming mixed Gaussian-Lorentzian shapes and correcting for sensitivity factors after integrated baseline background subtraction with Shirley routine.
2.9. Bacterial removal and inactivation during electrocoagulation
Experiments were also performed to evaluate bacteria removal and inactivation during aluminum electrocoagulation. Escherichia coli (ATCC 15597) was employed as the model organism. Before each experiment, the electrocoagulation cell was soaked overnight in free chlorine solution, rinsed 5-times with nanopure water, and thoroughly air dried to remove any chlorine demand. The anode was
Materials and methods
16
mechanically scrubbed prior to electrolysis, and periodically cleaned with hydrochloric acid (HCl) to avoid passivation. First, free chlorine generation during electrolysis of 100 millimolar (mM) sodium chloride (NaCl) solution over different durations (i.e. range of target aluminum concentrations) was evaluated. In these tests, the pH was maintained at 6.2 using 10 mM sodium bicarbonate (NaHCO3) as a buffer, no bacteria were added, and electrolysis was performed at a fixed current density of 20 mA/cm2. The suspension was well-mixed by continuous stirring. Water samples were collected at times corresponding to 10, 15, 20, 30 and 40 mg/L target aluminum concentrations calculated using Faraday’s law. Free chlorine was measured using N,N-diethyl-p-phenylenediamine (DPD) colorimetric method using a Hach DR-4000 spectrophotometer. Total aluminum concentrations were analyzed using atomic absorption spectroscopy (Flame AA-AAnalyst 300, Perkin-Elmer) according to Standard Method 3111 after acidifying samples to pH 2 using 11.5 normal (N) HCl. Second, a negative control experiment was performed to ensure that the cleaning procedures were in order. In this experiment, electrolysis was not performed for the same buffered 100 mM NaCl solution. E. coli was added and the batch was continuously mixed with a magnetic stirrer similar to the first experiment. Samples were collected at 0, 30, 60, 120, 180, 240 and 300 minute time intervals, and the plate count technique was used to quantify bacteria. Third, electrocoagulation was performed at 20 mA/cm2 current density for a target aluminum dose of 30 mg/L to evaluate bacteria removal/inactivation. As in the previous two experiments, a 100 mM NaCl solution buffered to pH 6.2 using 10 mM NaHCO3 was used as the source water. The entire suspension was rapidly mixed during electrolysis and slowly mixed (i.e., flocculated) after electrolysis. Samples were collected at 0, after electrolysis (7 min 9 sec) 30, 60, 120, 180, 240, and 300 minute time intervals. 1 mL of 10 percent (w/v) sodium sulfite (Na2SO3) was added to each sample vial for preservation (i.e., to quench chlorine and avoid any disinfection during sample storage and analysis). Samples were the centrifuged to separate flocs and supernatant. Bacteria concentrations in the supernatant were measured using plate counting. Next, the third experiment was essentially repeated, except that Foss Reservoir water was employed instead of a model 100 mM NaCl solution All experimental parameters remained the same as in the previous one. The final experiment was a positive control where free chlorine was externally added and bacterial inactivation was measured.
Advanced Pretreatment for Nanofiltration of Brackish Surface Water: Fouling Control and Water Quality Improvements
17
3. NF MEMBRANE SELECTIONThis task’s main objective was to generate operational and water quality data for two candidate NF membranes (NF270 and NF90, Dow) and compare their performance. We investigated whether gypsum precipitation or organic fouling would be the dominant fouling mechanism based on differences in mono- and divalent ion rejection. We summarized permeate flux and water quality data to rigorously compare the performance of the two nanofilters to select only one for extensive evaluation. Control experiments were also performed with synthetic water formulated to match the ionic composition of Foss Reservoir but with no added NOM. Surfaces of fouled and virgin membranes were extensively characterized with X-ray photoelectron spectroscopy (XPS) and Fourier transform infra-red (FTIR) spectroscopy to evaluate specific inorganic and organic foulants.
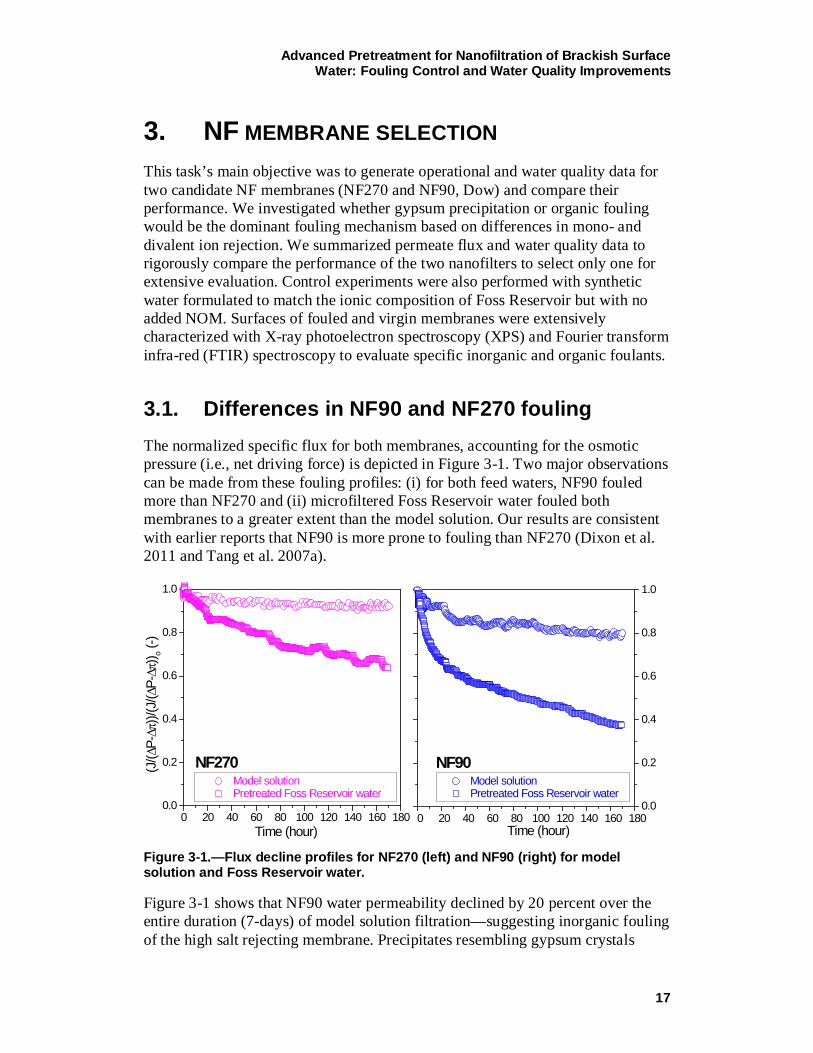
3.1. Differences in NF90 and NF270 fouling The normalized specific flux for both membranes, accounting for the osmotic pressure (i.e., net driving force) is depicted in Figure 3-1. Two major observations can be made from these fouling profiles: (i) for both feed waters, NF90 fouled more than NF270 and (ii) microfiltered Foss Reservoir water fouled both membranes to a greater extent than the model solution. Our results are consistent with earlier reports that NF90 is more prone to fouling than NF270 (Dixon et al. 2011 and Tang et al. 2007a).
Figure 3-1.—Flux decline profiles for NF270 (left) and NF90 (right) for model solution and Foss Reservoir water.
Figure 3-1 shows that NF90 water permeability declined by 20 percent over the entire duration (7-days) of model solution filtration—suggesting inorganic fouling of the high salt rejecting membrane. Precipitates resembling gypsum crystals
0 20 40 60 80 100 120 140 160 1800.0
0.2
0.4
0.6
0.8
1.0
0 20 40 60 80 100 120 140 160 1800.0
0.2
0.4
0.6
0.8
1.0
NF270 Model solution Pretreated Foss Reservoir water
(J/(∆
P-∆π
))/(J
/(∆P-∆π
)) o (-)
Time (hour)
Model solution Pretreated Foss Reservoir water
NF90
Time (hour)
NF membrane selection
18
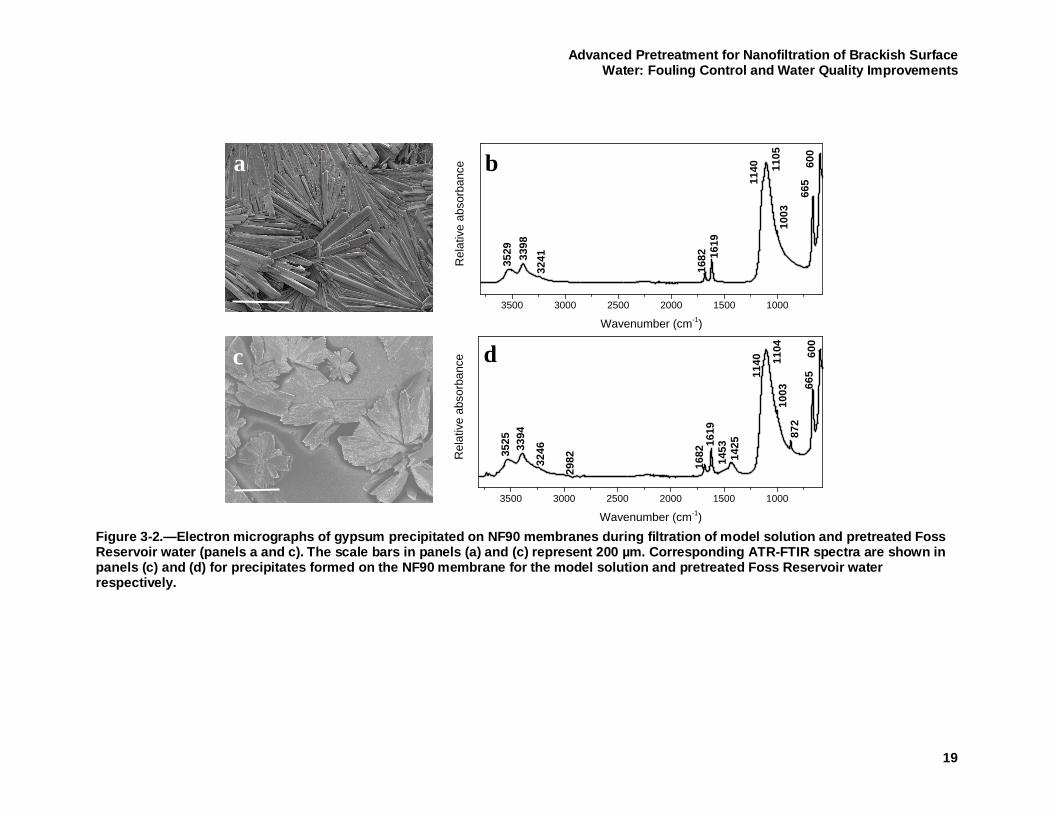
(Rahardianto et al. 2006, Shih et al. 2005, and Xie and Gray 2016) were observed especially around the edges of the membrane and close to the brine exit (a, top left panel in Figure 3-2). The ATR-FTIR spectrum of these crystals is indicative (b, top right panel in Figure 3-2) of gypsum (Böke et al. 2004), including a strong doublet at 600 and 665 reciprocal centimeters (cm-1) corresponding to asymmetric bending vibrations of sulfate (SO4-2). A weak peak at 1003 cm-1 due to symmetric stretching vibrations of sulfates can also be seen. The strong peak at 1105 cm-1 with a shoulder (1140 cm-1) is typical of asymmetric sulfate stretching. Water bending vibrations around 1619 cm-1 and 1682 cm-1, and symmetric and asymmetric stretching (3398 cm-1 and 3529 cm-1) of water found in pure gypsum were also observed (Anbalagan. et al. 2009 and Rosi et al. 2010). Hence, gypsum scaling is the dominant cause of NF90 fouling with the model solution. The overall concentration polarization was estimated using film-theory (Zydney 1997) with mass transfer coefficients correlations for a spacer-filled channel (Mariñas and Urama 1996) which resulted in an average gypsum SI below unity for both membranes. However, microenvironments with localized high degrees of supersaturation have been shown to exist in regions of high recirculation (Lyster et al. 2009). As described in the previous paragraph, gypsum crystals were observed largely near the cell edges and brine exit only of NF90—suggesting a higher driving force for precipitation attributed to its higher rejection of both mono- and divalent cations (see Table 2-3) (Uchymiak et al. 2008). In contrast, NF270 water permeability declined only by 7 percent over the entire duration of model solution filtration, and no precipitates were visually observed—suggesting negligible inorganic fouling over the timeframe of experimentation. Mass transfer calculations coupled with observed rejections revealed a higher ionic strength in the concentration polarization layer of the “tighter” membrane (NF90) compared with the “looser” membrane (NF270). Also as shown in Figure 3-1, Foss Reservoir water significantly increased fouling compared with the model ionic solution, reducing the permeability of NF270 by 35 percent and NF90 by 62 percent after 7 days. The increased fouling was primarily attributed to NOM (along with any nanocolloids that escaped MF) in pretreated natural water since the ionic composition of both feed waters were matched. For both NF270 and NF90, organic fouling induced by the NOM in Foss Reservoir water would have been exacerbated by the high calcium concentrations due to NOM-Ca interactions.
Advanced Pretreatment for Nanofiltration of Brackish Surface Water: Fouling Control and Water Quality Improvements
19
Figure 3-2.—Electron micrographs of gypsum precipitated on NF90 membranes during filtration of model solution and pretreated Foss Reservoir water (panels a and c). The scale bars in panels (a) and (c) represent 200 µm. Corresponding ATR-FTIR spectra are shown in panels (c) and (d) for precipitates formed on the NF90 membrane for the model solution and pretreated Foss Reservoir water respectively.
3500 3000 2500 2000 1500 1000
1140 60
0
Rel
ativ
e ab
sorb
ance
Wavenumber (cm-1)
3241
665
1003
1105
1619
168235
29 3398
3500 3000 2500 2000 1500 1000
1453
1140 60
0
Rel
ativ
e ab
sorb
ance
Wavenumber (cm-1)
298232
46
168235
25 3394
665
1003
872
1104
142516
19
a b
c d
NF membrane selection
20
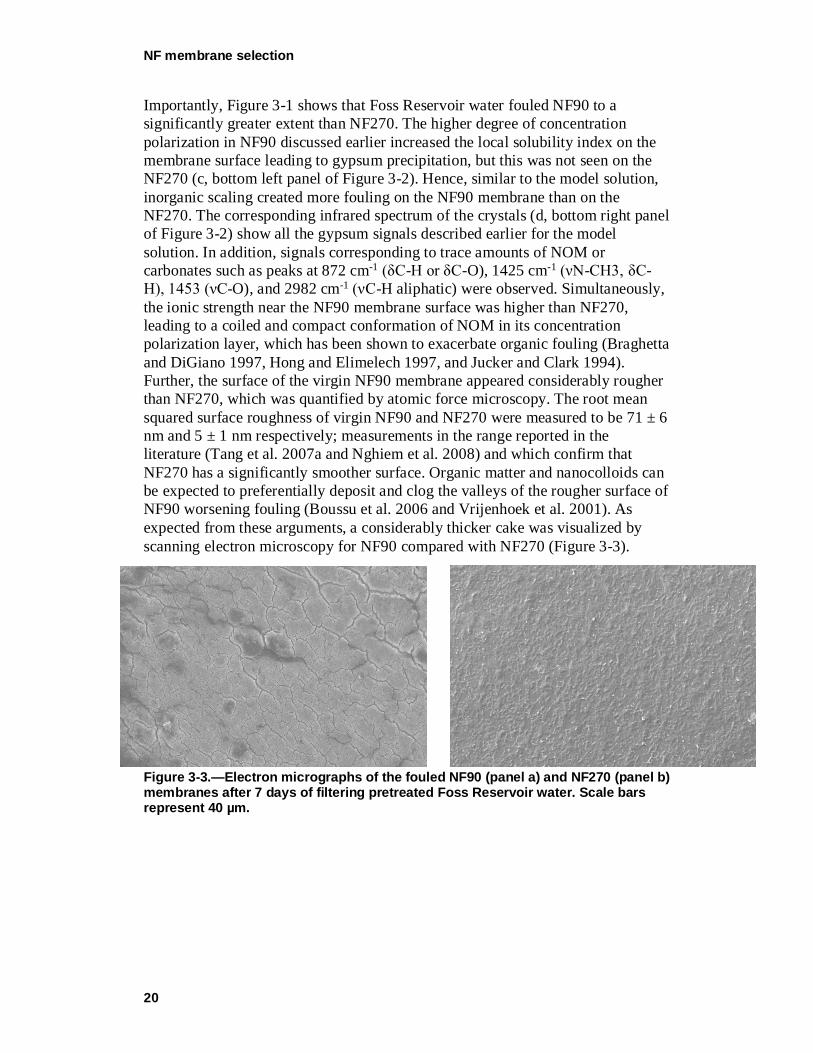
Importantly, Figure 3-1 shows that Foss Reservoir water fouled NF90 to a significantly greater extent than NF270. The higher degree of concentration polarization in NF90 discussed earlier increased the local solubility index on the membrane surface leading to gypsum precipitation, but this was not seen on the NF270 (c, bottom left panel of Figure 3-2). Hence, similar to the model solution, inorganic scaling created more fouling on the NF90 membrane than on the NF270. The corresponding infrared spectrum of the crystals (d, bottom right panel of Figure 3-2) show all the gypsum signals described earlier for the model solution. In addition, signals corresponding to trace amounts of NOM or carbonates such as peaks at 872 cm-1 (δC-H or δC-O), 1425 cm-1 (νN-CH3, δC-H), 1453 (νC-O), and 2982 cm-1 (νC-H aliphatic) were observed. Simultaneously, the ionic strength near the NF90 membrane surface was higher than NF270, leading to a coiled and compact conformation of NOM in its concentration polarization layer, which has been shown to exacerbate organic fouling (Braghetta and DiGiano 1997, Hong and Elimelech 1997, and Jucker and Clark 1994). Further, the surface of the virgin NF90 membrane appeared considerably rougher than NF270, which was quantified by atomic force microscopy. The root mean squared surface roughness of virgin NF90 and NF270 were measured to be 71 ± 6 nm and 5 ± 1 nm respectively; measurements in the range reported in the literature (Tang et al. 2007a and Nghiem et al. 2008) and which confirm that NF270 has a significantly smoother surface. Organic matter and nanocolloids can be expected to preferentially deposit and clog the valleys of the rougher surface of NF90 worsening fouling (Boussu et al. 2006 and Vrijenhoek et al. 2001). As expected from these arguments, a considerably thicker cake was visualized by scanning electron microscopy for NF90 compared with NF270 (Figure 3-3).
Figure 3-3.—Electron micrographs of the fouled NF90 (panel a) and NF270 (panel b) membranes after 7 days of filtering pretreated Foss Reservoir water. Scale bars represent 40 µm.
Advanced Pretreatment for Nanofiltration of Brackish Surface Water: Fouling Control and Water Quality Improvements
21
3.2. ATR-FTIR spectra of NF90 and NF270 membrane surfaces
Additional information on foulants was obtained by collecting ATR-FTIR spectra of membranes before and after filtration of the model solution and Foss Reservoir water as shown in Figure 3-4.
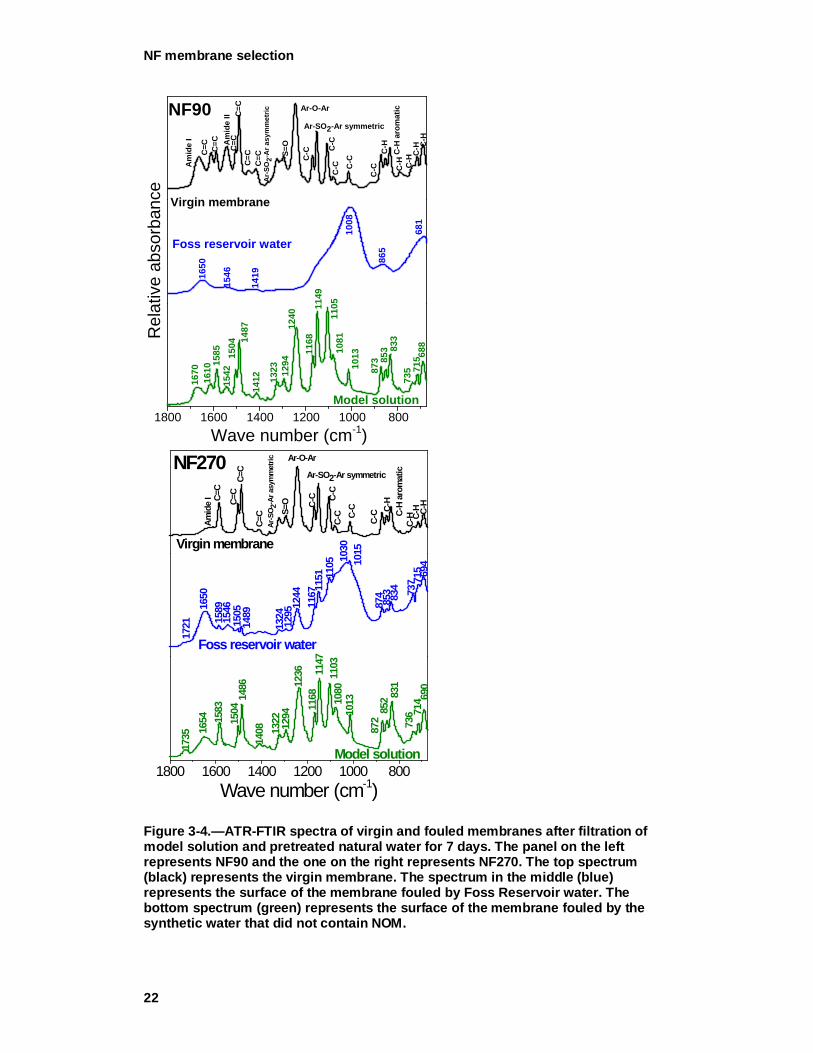
3.2.1. Virgin membranes Both virgin membranes exhibited bands typical of the polysulfone support layer in thin film composite (TFC) polyamide membranes (Kwon and Leckie 2006 and Petersen 1993) such as (i) sharp and prominent peaks at 1151, 1243, and 1323 cm-1 corresponding respectively to Ar-SO2-Ar, Ar-O-Ar, and asymmetric SO2 stretching vibrations and (ii) C=C aromatic in-plane ring bend stretching vibrations at 1586, 1504, and 1488 cm-1. Even though the active layers of both NF270 and NF90 are based on polyamide chemistry, the different synthesis method employed for their manufacture affects their surface chemistry and separation characteristics. The fully aromatic polyamide NF90 membrane exhibited three unique peaks at (i) 1663 cm-1 corresponding to vC=O, vC-N, and C-C-N deformation vibration in a secondary amide group (Amide I), (ii) 1609 cm-1 attributed to aromatic amide, and (iii) 1542 cm-1 assigned to amide II band (δN-H + vC-N). In contrast, the amide II band and aromatic amide peaks were absent in the semi-aromatic poly(piperazinamide) NF270 membrane. As in Tang et al. (2009a), the amide I band was observed at lower wave number (1626 cm-1) for the semi-aromatic NF270 membrane than the fully aromatic NF90 membrane (1663 cm-1).
NF membrane selection
22
Figure 3-4.—ATR-FTIR spectra of virgin and fouled membranes after filtration of model solution and pretreated natural water for 7 days. The panel on the left represents NF90 and the one on the right represents NF270. The top spectrum (black) represents the virgin membrane. The spectrum in the middle (blue) represents the surface of the membrane fouled by Foss Reservoir water. The bottom spectrum (green) represents the surface of the membrane fouled by the synthetic water that did not contain NOM.
1800 1600 1400 1200 1000 800
Virgin membrane
NF90
Foss reservoir water
Model solution
C-HC=
CC=
C
C-H
C-H
C-HC-
H ar
omat
icC-
HC-
CC-C
C-C
C-C
Ar-SO2-Ar symmetric
C-C
Ar-O-Ar
S=O
Ar-
SO2-
Ar a
sym
met
ric
C=C
C=C
Amid
e II
C=C
C=C
Amid
e I
68
1
865
1008
141916
50
1546
1081
1412
1504 14
87
1323 12
94
1168
1105
1013
873 85
3 833
735 71
5 688
1240
1670
1610
1585
1542
1149
Rel
ativ
e ab
sorb
ance
Wave number (cm-1)
1800 1600 1400 1200 1000 800
Virgin membrane
C=C C-
HC-
HC-
HC-H
arom
atic
C-H
C-CC-
CC-
CC-
C
C-C
Ar-SO2-Ar symmetric
Ar-O-Ar
S=O
Ar-S
O 2-A
r asy
mm
etric
C=C
C=C
C=C
Amid
e I
NF270
Foss reservoir water
694
715
737
834
853
874
10151030
1105
1151
1167
1489
15051546
158916
5017
21 1324
1295
1244
Wave number (cm-1)
Model solution
852
1147
1168
1236
1408
690
714
736
831
87210
131080
1294
1322
1486
1504
1583
1654
1735
1103
Advanced Pretreatment for Nanofiltration of Brackish Surface Water: Fouling Control and Water Quality Improvements
23
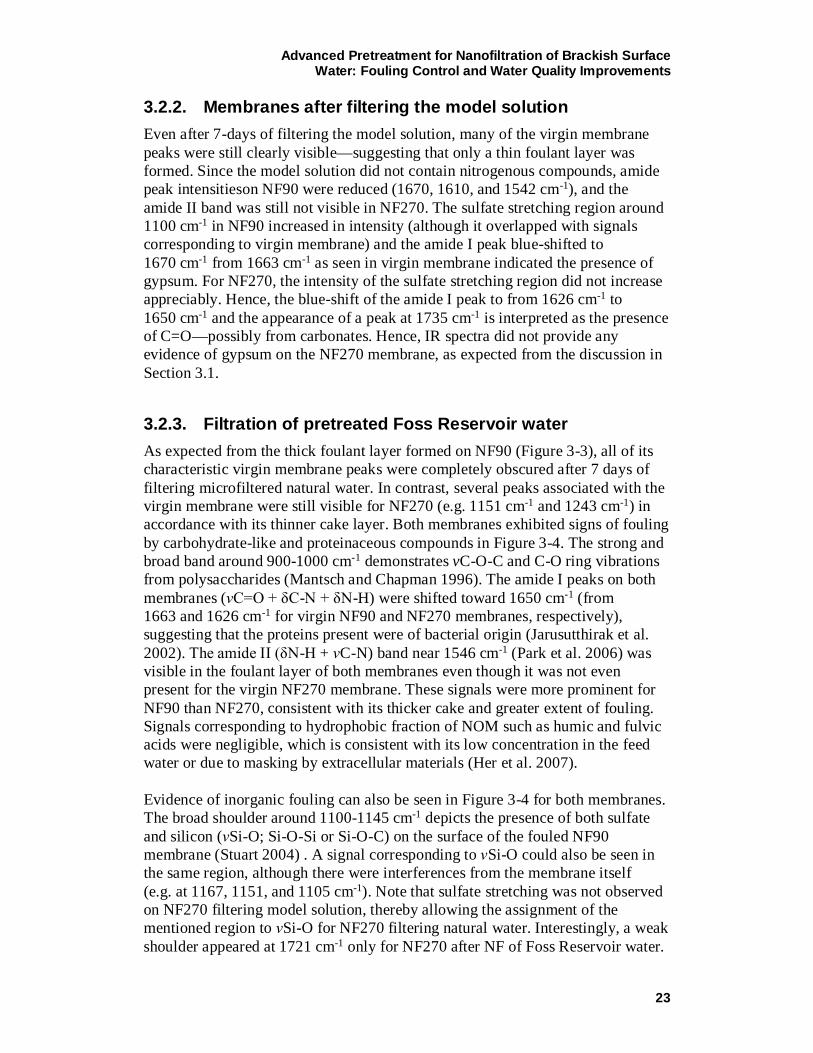
3.2.2. Membranes after filtering the model solution Even after 7-days of filtering the model solution, many of the virgin membrane peaks were still clearly visible—suggesting that only a thin foulant layer was formed. Since the model solution did not contain nitrogenous compounds, amide peak intensitieson NF90 were reduced (1670, 1610, and 1542 cm-1), and the amide II band was still not visible in NF270. The sulfate stretching region around 1100 cm-1 in NF90 increased in intensity (although it overlapped with signals corresponding to virgin membrane) and the amide I peak blue-shifted to 1670 cm-1 from 1663 cm-1 as seen in virgin membrane indicated the presence of gypsum. For NF270, the intensity of the sulfate stretching region did not increase appreciably. Hence, the blue-shift of the amide I peak to from 1626 cm-1 to 1650 cm-1 and the appearance of a peak at 1735 cm-1 is interpreted as the presence of C=O—possibly from carbonates. Hence, IR spectra did not provide any evidence of gypsum on the NF270 membrane, as expected from the discussion in Section 3.1.
3.2.3. Filtration of pretreated Foss Reservoir water As expected from the thick foulant layer formed on NF90 (Figure 3-3), all of its characteristic virgin membrane peaks were completely obscured after 7 days of filtering microfiltered natural water. In contrast, several peaks associated with the virgin membrane were still visible for NF270 (e.g. 1151 cm-1 and 1243 cm-1) in accordance with its thinner cake layer. Both membranes exhibited signs of fouling by carbohydrate-like and proteinaceous compounds in Figure 3-4. The strong and broad band around 900-1000 cm-1 demonstrates vC-O-C and C-O ring vibrations from polysaccharides (Mantsch and Chapman 1996). The amide I peaks on both membranes (νC=O + δC-N + δN-H) were shifted toward 1650 cm-1 (from 1663 and 1626 cm-1 for virgin NF90 and NF270 membranes, respectively), suggesting that the proteins present were of bacterial origin (Jarusutthirak et al. 2002). The amide II (δN-H + νC-N) band near 1546 cm-1 (Park et al. 2006) was visible in the foulant layer of both membranes even though it was not even present for the virgin NF270 membrane. These signals were more prominent for NF90 than NF270, consistent with its thicker cake and greater extent of fouling. Signals corresponding to hydrophobic fraction of NOM such as humic and fulvic acids were negligible, which is consistent with its low concentration in the feed water or due to masking by extracellular materials (Her et al. 2007). Evidence of inorganic fouling can also be seen in Figure 3-4 for both membranes. The broad shoulder around 1100-1145 cm-1 depicts the presence of both sulfate and silicon (νSi-O; Si-O-Si or Si-O-C) on the surface of the fouled NF90 membrane (Stuart 2004) . A signal corresponding to νSi-O could also be seen in the same region, although there were interferences from the membrane itself (e.g. at 1167, 1151, and 1105 cm-1). Note that sulfate stretching was not observed on NF270 filtering model solution, thereby allowing the assignment of the mentioned region to νSi-O for NF270 filtering natural water. Interestingly, a weak shoulder appeared at 1721 cm-1 only for NF270 after NF of Foss Reservoir water.
NF membrane selection
24
Such a peak was also visible after filtering the model solution (Section 3.2.2.). This is attributed to O-C=O of carbonates with the membrane masking other accompanying peaks (C-O stretching mode at 1453 cm-1 and bending at 873 cm-1). Importantly, carbonates were not seen for NF90 either after filtering the model solution and Foss Reservoir water since gypsum scaling inhibits CaCO3 precipitation (Rahardianto et al. 2008). Hence, NF270 fouling can be attributed to NOM fouling with limited contributions from calcium carbonate, whereas NF90 fouling is dominated by both gypsum and NOM.
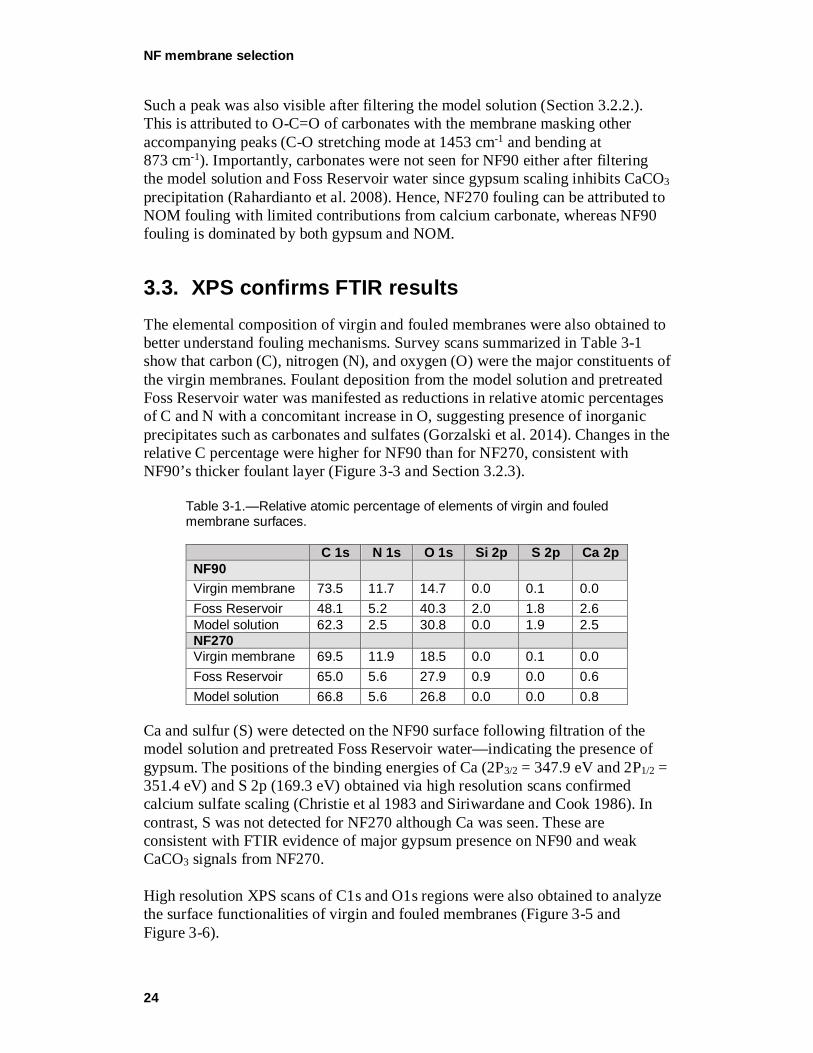
3.3. XPS confirms FTIR results The elemental composition of virgin and fouled membranes were also obtained to better understand fouling mechanisms. Survey scans summarized in Table 3-1 show that carbon (C), nitrogen (N), and oxygen (O) were the major constituents of the virgin membranes. Foulant deposition from the model solution and pretreated Foss Reservoir water was manifested as reductions in relative atomic percentages of C and N with a concomitant increase in O, suggesting presence of inorganic precipitates such as carbonates and sulfates (Gorzalski et al. 2014). Changes in the relative C percentage were higher for NF90 than for NF270, consistent with NF90’s thicker foulant layer (Figure 3-3 and Section 3.2.3).
Table 3-1.—Relative atomic percentage of elements of virgin and fouled membrane surfaces.
C 1s N 1s O 1s Si 2p S 2p Ca 2p NF90 Virgin membrane 73.5 11.7 14.7 0.0 0.1 0.0 Foss Reservoir 48.1 5.2 40.3 2.0 1.8 2.6 Model solution 62.3 2.5 30.8 0.0 1.9 2.5 NF270 Virgin membrane 69.5 11.9 18.5 0.0 0.1 0.0 Foss Reservoir 65.0 5.6 27.9 0.9 0.0 0.6 Model solution 66.8 5.6 26.8 0.0 0.0 0.8
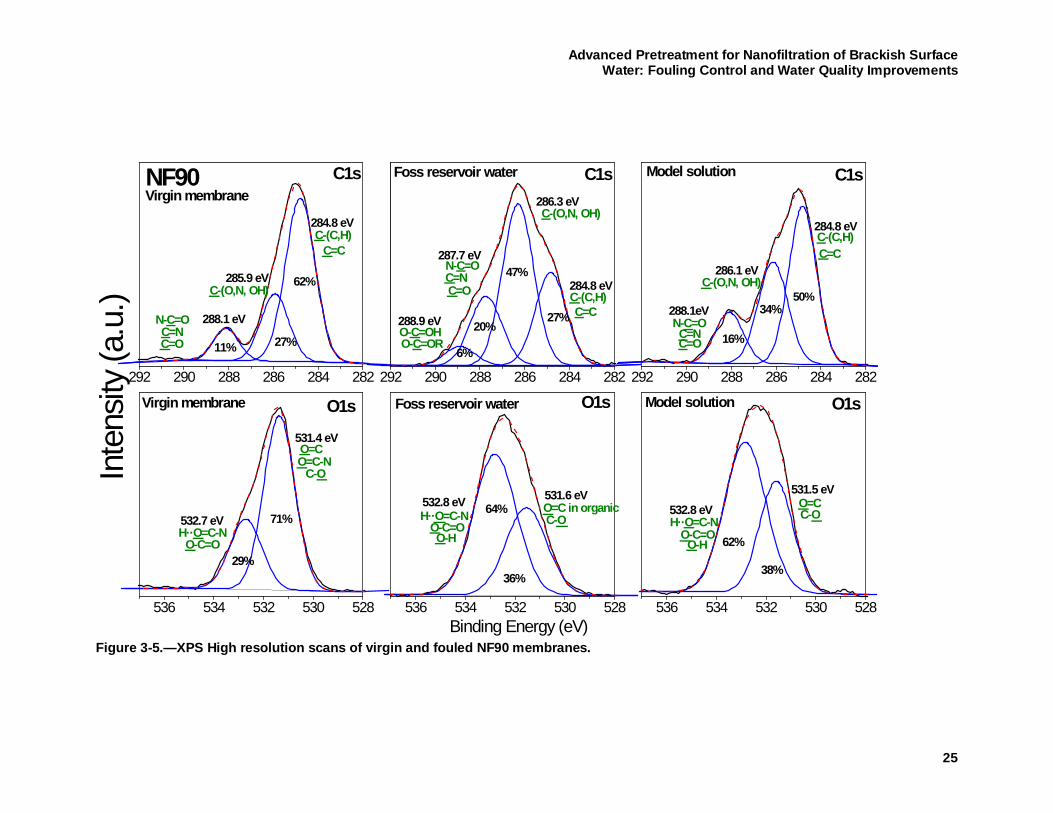
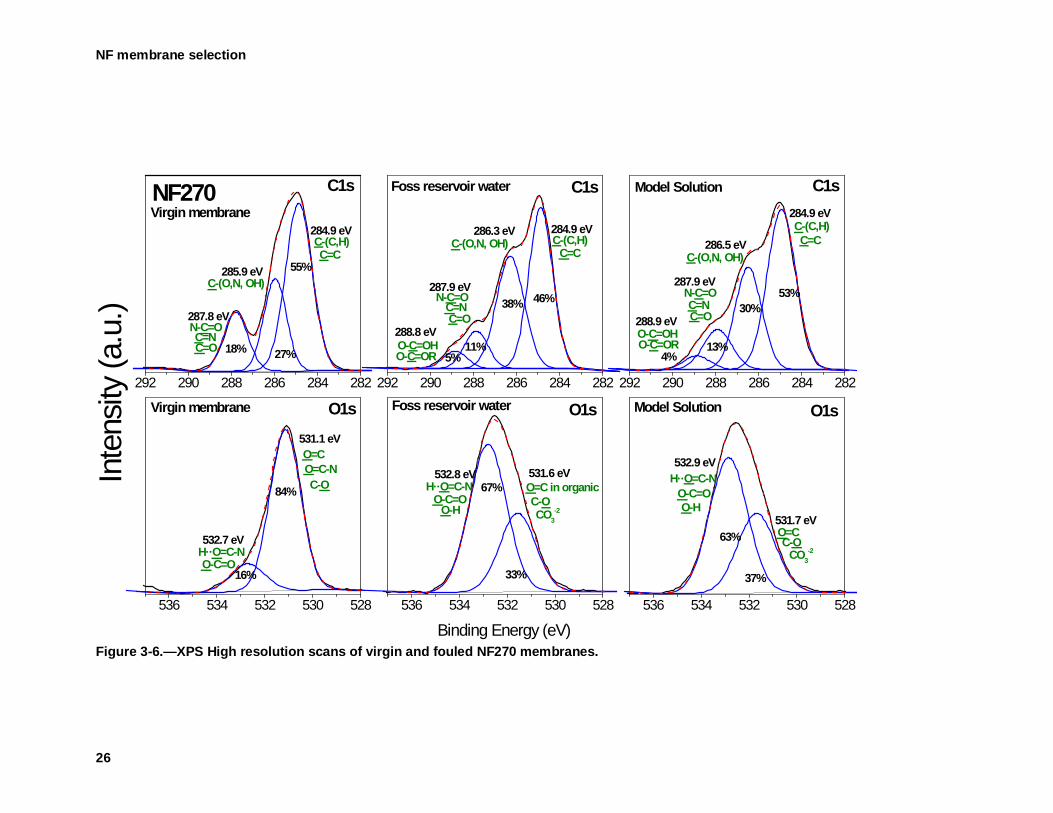
Ca and sulfur (S) were detected on the NF90 surface following filtration of the model solution and pretreated Foss Reservoir water—indicating the presence of gypsum. The positions of the binding energies of Ca (2P3/2 = 347.9 eV and 2P1/2 = 351.4 eV) and S 2p (169.3 eV) obtained via high resolution scans confirmed calcium sulfate scaling (Christie et al 1983 and Siriwardane and Cook 1986). In contrast, S was not detected for NF270 although Ca was seen. These are consistent with FTIR evidence of major gypsum presence on NF90 and weak CaCO3 signals from NF270. High resolution XPS scans of C1s and O1s regions were also obtained to analyze the surface functionalities of virgin and fouled membranes (Figure 3-5 and Figure 3-6).
Advanced Pretreatment for Nanofiltration of Brackish Surface Water: Fouling Control and Water Quality Improvements
25
Figure 3-5.—XPS High resolution scans of virgin and fouled NF90 membranes.
536 534 532 530 528
292 290 288 286 284 282
536 534 532 530 528
292 290 288 286 284 282
536 534 532 530 528
292 290 288 286 284 282
Virgin membrane
O1s
O=CO=C-N
C-O
H··O=C-NO-C=O
288.9 eV 20%
Foss reservoir water C1s
6%
47%287.7 eV
286.3 eV
284.8 eV
27%
64%
36%
531.5 eV532.8 eV
O-C=OHO-C=OR
N-C=OC=NC=O
C-(O,N, OH)
C-(C,H)C=C
O=C in organicC-O
Foss reservoir water
O1s
O-HO-C=O
H··O=C-N
16%
Model solution C1s
34%288.1eV
286.1 eV
284.8 eV
50%
531.6 eV532.8 eV
N-C=OC=NC=O
C-(O,N, OH)
C-(C,H)C=C
O=CC-O
Model solution
Inte
nsity
(a.u
.)
62%
38%
Binding Energy (eV)
O1s
H··O=C-NO-C=OO-H
NF90
Virgin membraneC1s
11% 27%
288.1 eV
285.9 eV
284.8 eV
62%
29%
71%
531.4 eV
532.7 eV
C=OC=N
N-C=O
C-(O,N, OH)
C=CC-(C,H)
NF membrane selection
26
Figure 3-6.—XPS High resolution scans of virgin and fouled NF270 membranes.
292 290 288 286 284 282
536 534 532 530 528
292 290 288 286 284 282
536 534 532 530 528
292 290 288 286 284 282
536 534 532 530 528
Inte
nsity
(a.u
.)
Virgin membrane
C=NN-C=OC=O
C-(O,N, OH)
C=CC-(C,H)
18% 27%
287.8 eV
285.9 eV
NF270 C1s
284.9 eV
55%
Virgin membrane
H··O=C-NO-C=O
C-OO=C-NO=C
16%
84%
O1s531.1 eV
532.7 eV
O-C=OR
N-C=O
O-C=OH5%
11%
38% 46%
288.8 eV
Foss reservoir water C1s
284.9 eV286.3 eV
287.9 eV
C-(C,H)C=C
C-(O,N, OH)
C=NC=O
C-O
Foss reservoir water
O=C in organic
O-H CO3-2
33%
67%
O1s
531.6 eV532.8 eVH··O=C-N
O-C=O
4%13%
30%53%
288.9 eV
Model Solution C1s284.9 eV
286.5 eV
287.9 eV
O-C=OHO-C=OR
C-(C,H)C=C
C-(O,N, OH)
N-C=OC=NC=O
O=CC-O
Model Solution
O-H
CO3-2
37%
63%
Binding Energy (eV)
O1s
531.7 eV
532.9 eVH··O=C-N
O-C=O
Advanced Pretreatment for Nanofiltration of Brackish Surface Water: Fouling Control and Water Quality Improvements
27
The C1s peak in the virgin membranes was deconvoluted into three components: (i) one at 284.8 eV from C-(C,H) or C=C, (ii) a second one at 286 eV from C-(O,N, OH), and (iii) a third one at 287.8 eV from C=O, N-C=O, or C=N. The O 1s peak was resolved into two peaks one at 531.2 eV from O=C, O=C-N, C-O and another at 532.6 eV from O-C=O, H··O=C-N. This deconvolution of C 1s and O 1s peaks and their assignments is similar to earlier reports for the virgin NF270 and NF90 membranes (Do et al. 2012). Similar to FTIR, foulant deposition modified the virgin membrane spectral features for both NF270 and NF90. Bigger changes were observed in C1s features for fouled NF90 than in NF270—providing further evidence for its thicker foulant layer (see top three panels in Figure 3-5 and Figure 3-6). Fouling by organics (proteins and polysaccharides) and/or inorganics (sulfates and carbonates) for nanofiltration of Foss Reservoir water by both membranes were evidenced by: (i) intensification of the peak around 286 eV, (ii) increase in the peak near 288.1 eV, and (iii) the appearance of small peak near 288.9 eV. For the model solution, the small peak around 288.9 eV appeared only for NF270—confirming carbonate fouling for this membrane. O1s peaks on fouled membranes changed in accordance with the C1s peaks. For example, the peaks near 531.3 eV in virgin membranes was shifted to higher binding energy (around 531.6 eV), which corresponds to C=O in organics and/or carbonates (CO3-2). Also, the peak near 532.6 eV shifted to slightly higher binding energies (around 532.9 eV) for both membranes, along with an increase in their relative area percentages, which was due stronger binding of foulants to the membrane surface.
3.4. Permeate water quality As summarized in Table 2-3, the molecular weight cut-off (MWCO) of the NF90 is lower than the NF270 (i.e., it is a “tighter” membrane capable of rejecting contaminants to a significantly greater extent than NF270) and, consequently, the NF90 exhibits a higher resistance to water permeation. In this set of experiments, we monitored water quality parameters in the feed, retentate, and permeate streams as summarized in Table 3-2, Table 3-3, and Table 3-4. In addition, although experiments were designed to simulate a full-scale recovery of nearly 60 percent the actual system recovery was only 2.5 percent, which led to very similar concentrations in the retentate stream and bulk feed solution. Also as expected, both nanofilters removed most of the divalent cations and anions (Ca+2, Mg+2, and SO4-2). Very high rejection of sulfate (>99 percent) is attributed to anion repulsion, since both membranes are negatively charged at the operating pH of 7.9 (Chellam and Taylor 2001 and Sharma and Chellam 2006). NF90 rejected more of the divalent cations including calcium (99.8 ± 0.1%), magnesium (99.9 ± 0.001%), and strontium (99.9 ± 0.007%) from the Foss Reservoir water than NF270 (91.8 ± 0.1% for calcium, 94.2 ± 0.05% for magnesium, and 92.8 ± 0.2% for strontium).
NF membrane selection
28
NF90 also more effectively rejected monovalent ions (e.g., sodium) than the NF270 membrane (97.4 ± 0.2% and ~60% respectively). Importantly, the dominant monovalent anion in Foss Reservoir water (i.e., chloride) was negatively rejected by NF270 whereas the NF90 membrane effectively removed it (96 percent). Similar results were obtained for the model solution as well. This is attributed to the preferential transport of chloride anions across the membrane to maintain electroneutrality. Chloride ions compensate for the very high removal of sulfate (due to electrostatic ion-membrane repulsion) and correspondingly lower removals of cations (due to electrostatic ion-membrane attraction) in case of the NF270 membrane (Zhu et al. 2007 and Gilron et al. 2001). These results demonstrate the significant accumulation of ionic constituents in a concentration polarization layer in case of NF90. In contrast, the concentration polarization layer was less significant for the NF270 membrane since it was more permeable to ions. Concentration polarization increases the osmotic pressure which in turn reduces the net driving force for water permeation. This could also have resulted in CaCO3 and CaSO4 precipitation leading to inorganic fouling (Le Gouellec and Elimelech 2002). In addition to electrolytes, rejection of organics was also monitored for the Foss Reservoir water (note that the model solution contained no organic matter). As may be expected, both nanofilters removed dissolved organic matter to a high degree as shown in Table 3-4. DOC rejection by NF270 and NF90 was comparable at 98.1 ± 0.7% and 96.4 ± 3.1%, respectively. UV254 rejection was also comparable at 98 and 99 percent for the NF270 and NF90 membranes respectively.
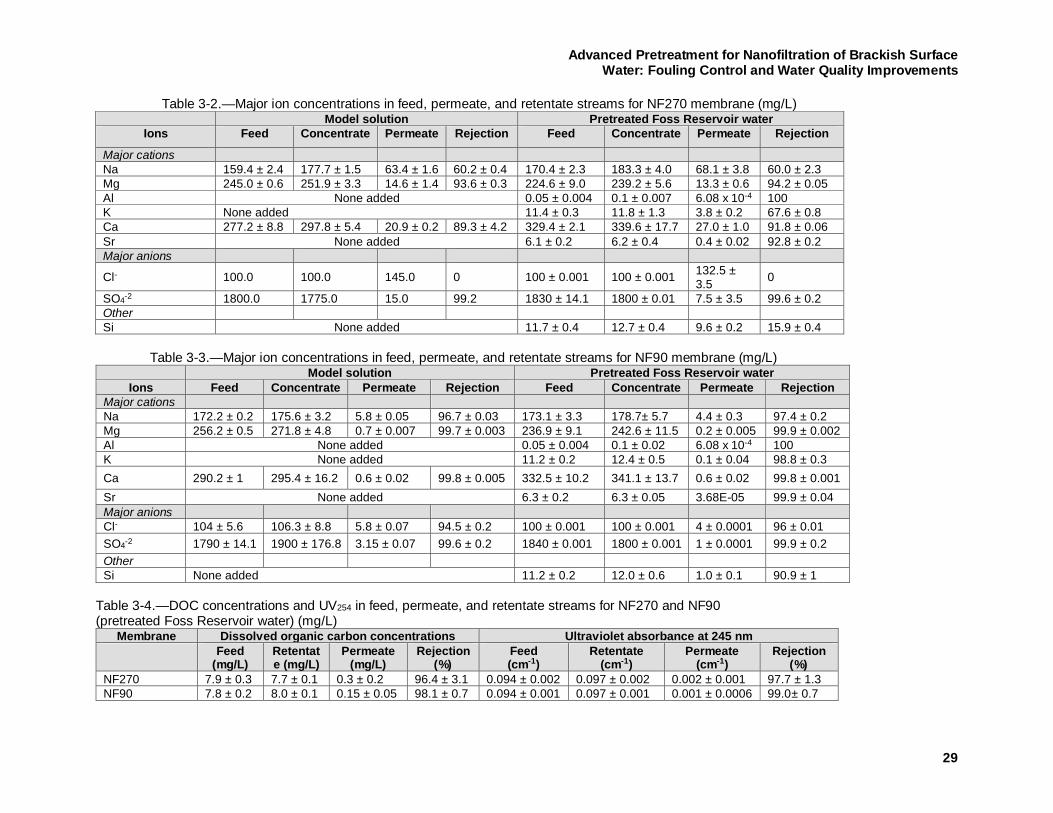
Advanced Pretreatment for Nanofiltration of Brackish Surface Water: Fouling Control and Water Quality Improvements
29
Table 3-2.—Major ion concentrations in feed, permeate, and retentate streams for NF270 membrane (mg/L) Model solution Pretreated Foss Reservoir water
Ions Feed Concentrate Permeate Rejection Feed Concentrate Permeate Rejection
Major cations Na 159.4 ± 2.4 177.7 ± 1.5 63.4 ± 1.6 60.2 ± 0.4 170.4 ± 2.3 183.3 ± 4.0 68.1 ± 3.8 60.0 ± 2.3 Mg 245.0 ± 0.6 251.9 ± 3.3 14.6 ± 1.4 93.6 ± 0.3 224.6 ± 9.0 239.2 ± 5.6 13.3 ± 0.6 94.2 ± 0.05 Al None added 0.05 ± 0.004 0.1 ± 0.007 6.08 x 10⁻⁴ 100 K None added 11.4 ± 0.3 11.8 ± 1.3 3.8 ± 0.2 67.6 ± 0.8 Ca 277.2 ± 8.8 297.8 ± 5.4 20.9 ± 0.2 89.3 ± 4.2 329.4 ± 2.1 339.6 ± 17.7 27.0 ± 1.0 91.8 ± 0.06 Sr None added 6.1 ± 0.2 6.2 ± 0.4 0.4 ± 0.02 92.8 ± 0.2 Major anions
Cl- 100.0 100.0 145.0 0 100 ± 0.001 100 ± 0.001 132.5 ± 3.5 0
SO4-2 1800.0 1775.0 15.0 99.2 1830 ± 14.1 1800 ± 0.01 7.5 ± 3.5 99.6 ± 0.2 Other Si None added 11.7 ± 0.4 12.7 ± 0.4 9.6 ± 0.2 15.9 ± 0.4
Table 3-3.—Major ion concentrations in feed, permeate, and retentate streams for NF90 membrane (mg/L)
Model solution Pretreated Foss Reservoir water Ions Feed Concentrate Permeate Rejection Feed Concentrate Permeate Rejection
Major cations Na 172.2 ± 0.2 175.6 ± 3.2 5.8 ± 0.05 96.7 ± 0.03 173.1 ± 3.3 178.7± 5.7 4.4 ± 0.3 97.4 ± 0.2 Mg 256.2 ± 0.5 271.8 ± 4.8 0.7 ± 0.007 99.7 ± 0.003 236.9 ± 9.1 242.6 ± 11.5 0.2 ± 0.005 99.9 ± 0.002 Al None added 0.05 ± 0.004 0.1 ± 0.02 6.08 x 10⁻⁴ 100 K None added 11.2 ± 0.2 12.4 ± 0.5 0.1 ± 0.04 98.8 ± 0.3 Ca 290.2 ± 1 295.4 ± 16.2 0.6 ± 0.02 99.8 ± 0.005 332.5 ± 10.2 341.1 ± 13.7 0.6 ± 0.02 99.8 ± 0.001 Sr None added 6.3 ± 0.2 6.3 ± 0.05 3.68E-05 99.9 ± 0.04 Major anions Cl- 104 ± 5.6 106.3 ± 8.8 5.8 ± 0.07 94.5 ± 0.2 100 ± 0.001 100 ± 0.001 4 ± 0.0001 96 ± 0.01 SO4-2 1790 ± 14.1 1900 ± 176.8 3.15 ± 0.07 99.6 ± 0.2 1840 ± 0.001 1800 ± 0.001 1 ± 0.0001 99.9 ± 0.2 Other Si None added 11.2 ± 0.2 12.0 ± 0.6 1.0 ± 0.1 90.9 ± 1
Table 3-4.—DOC concentrations and UV254 in feed, permeate, and retentate streams for NF270 and NF90 (pretreated Foss Reservoir water) (mg/L)
Membrane Dissolved organic carbon concentrations Ultraviolet absorbance at 245 nm
Feed
(mg/L) Retentate (mg/L)
Permeate (mg/L)
Rejection (%)
Feed (cm-1)
Retentate (cm-1)
Permeate (cm-1)
Rejection (%)
NF270 7.9 ± 0.3 7.7 ± 0.1 0.3 ± 0.2 96.4 ± 3.1 0.094 ± 0.002 0.097 ± 0.002 0.002 ± 0.001 97.7 ± 1.3 NF90 7.8 ± 0.2 8.0 ± 0.1 0.15 ± 0.05 98.1 ± 0.7 0.094 ± 0.001 0.097 ± 0.001 0.001 ± 0.0006 99.0 ± 0.7

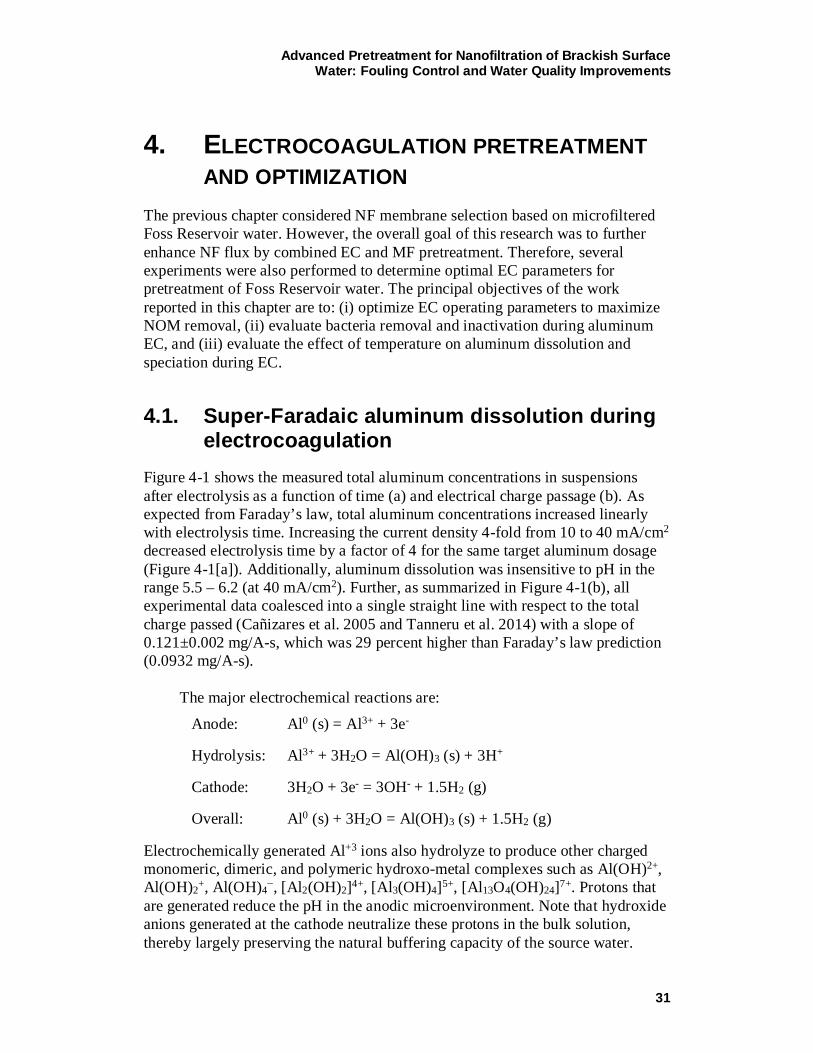
Advanced Pretreatment for Nanofiltration of Brackish Surface Water: Fouling Control and Water Quality Improvements
31
4. ELECTROCOAGULATION PRETREATMENTAND OPTIMIZATION
The previous chapter considered NF membrane selection based on microfiltered Foss Reservoir water. However, the overall goal of this research was to further enhance NF flux by combined EC and MF pretreatment. Therefore, several experiments were also performed to determine optimal EC parameters for pretreatment of Foss Reservoir water. The principal objectives of the work reported in this chapter are to: (i) optimize EC operating parameters to maximize NOM removal, (ii) evaluate bacteria removal and inactivation during aluminum EC, and (iii) evaluate the effect of temperature on aluminum dissolution and speciation during EC.
4.1. Super-Faradaic aluminum dissolution during electrocoagulation
Figure 4-1 shows the measured total aluminum concentrations in suspensions after electrolysis as a function of time (a) and electrical charge passage (b). As expected from Faraday’s law, total aluminum concentrations increased linearly with electrolysis time. Increasing the current density 4-fold from 10 to 40 mA/cm2 decreased electrolysis time by a factor of 4 for the same target aluminum dosage (Figure 4-1[a]). Additionally, aluminum dissolution was insensitive to pH in the range 5.5 – 6.2 (at 40 mA/cm2). Further, as summarized in Figure 4-1(b), all experimental data coalesced into a single straight line with respect to the total charge passed (Cañizares et al. 2005 and Tanneru et al. 2014) with a slope of 0.121±0.002 mg/A-s, which was 29 percent higher than Faraday’s law prediction (0.0932 mg/A-s).
The major electrochemical reactions are:
Anode: Al0 (s) = Al3+ + 3e-
Hydrolysis: Al3+ + 3H2O = Al(OH)3 (s) + 3H+
Cathode: 3H2O + 3e- = 3OH- + 1.5H2 (g)
Overall: Al0 (s) + 3H2O = Al(OH)3 (s) + 1.5H2 (g)
Electrochemically generated Al+3 ions also hydrolyze to produce other charged monomeric, dimeric, and polymeric hydroxo-metal complexes such as Al(OH)2+, Al(OH)2+, Al(OH)4−, [Al2(OH)2]4+, [Al3(OH)4]5+, [Al13O4(OH)24]7+. Protons that are generated reduce the pH in the anodic microenvironment. Note that hydroxide anions generated at the cathode neutralize these protons in the bulk solution, thereby largely preserving the natural buffering capacity of the source water.
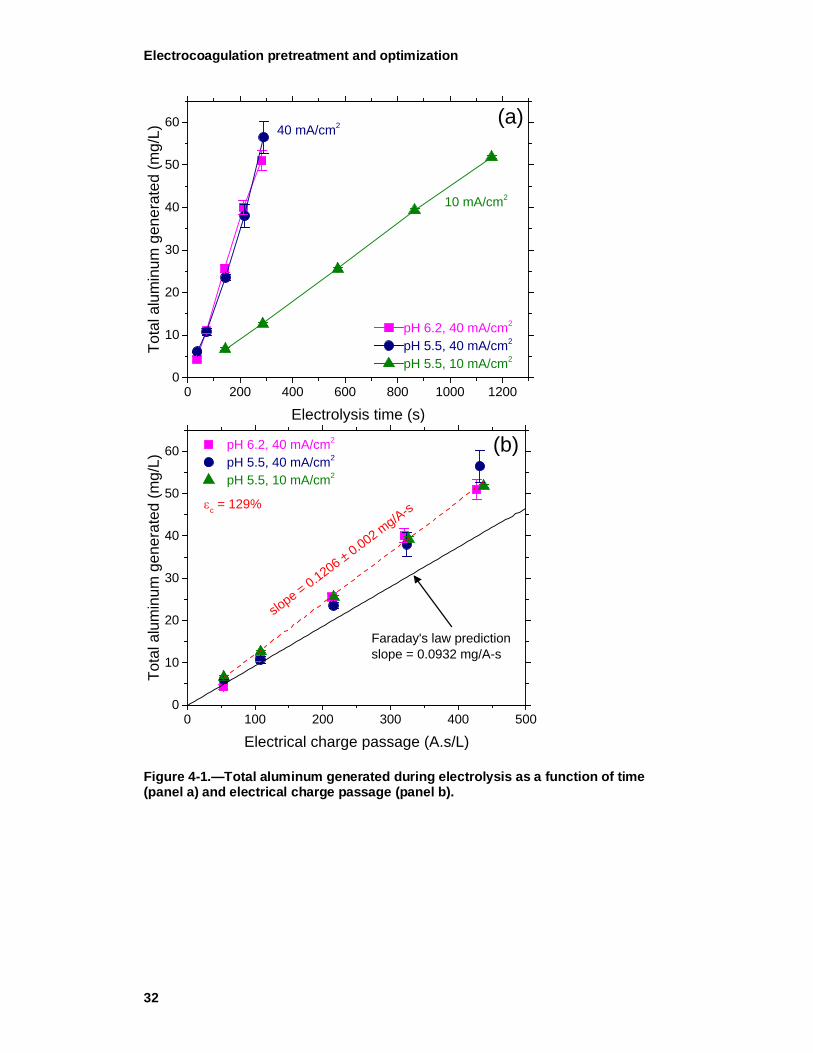
Electrocoagulation pretreatment and optimization
32
Figure 4-1.—Total aluminum generated during electrolysis as a function of time (panel a) and electrical charge passage (panel b).
0 200 400 600 800 1000 12000
10
20
30
40
50
60
10 mA/cm2
pH 6.2, 40 mA/cm2
pH 5.5, 40 mA/cm2
pH 5.5, 10 mA/cm2
Tota
l alu
min
um g
ener
ated
(mg/
L)
Electrolysis time (s)
40 mA/cm2 (a)
0 100 200 300 400 5000
10
20
30
40
50
60 pH 6.2, 40 mA/cm2
pH 5.5, 40 mA/cm2
pH 5.5, 10 mA/cm2
Tota
l alu
min
um g
ener
ated
(mg/
L)
Electrical charge passage (A.s/L)
Faraday's law predictionslope = 0.0932 mg/A-s
slope = 0.1206 ± 0.002 mg/A-s εc = 129%
(b)
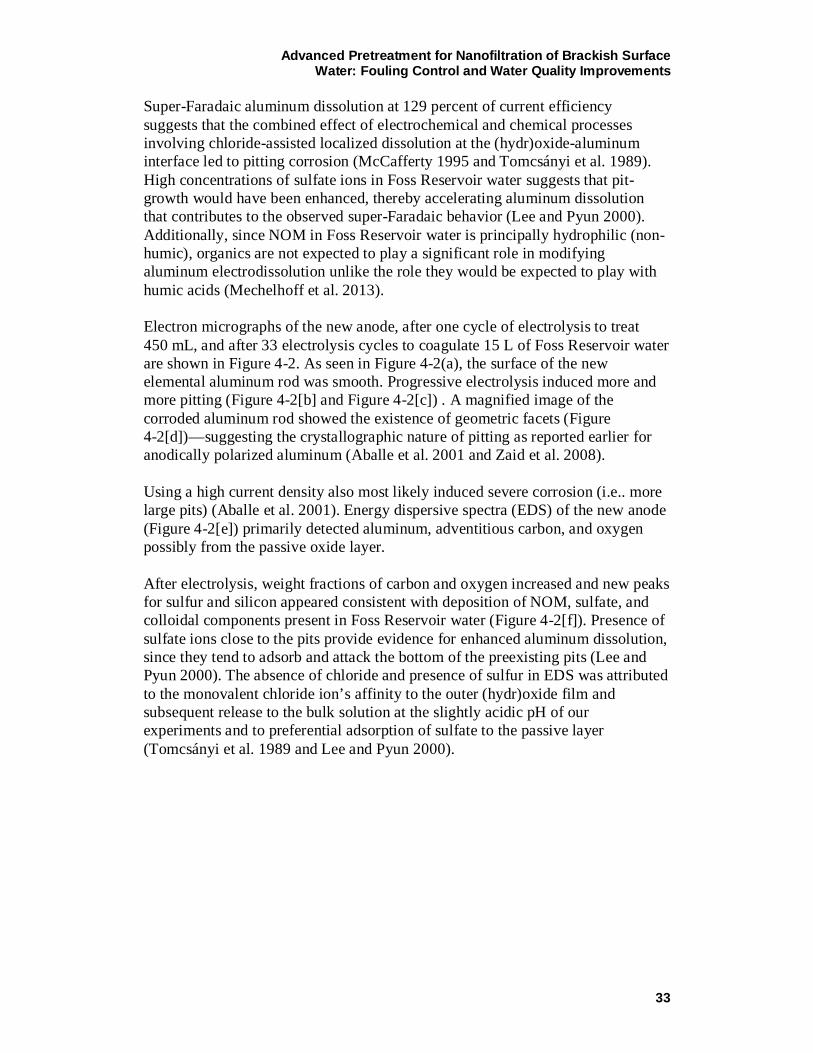
Advanced Pretreatment for Nanofiltration of Brackish Surface Water: Fouling Control and Water Quality Improvements
33
Super-Faradaic aluminum dissolution at 129 percent of current efficiency suggests that the combined effect of electrochemical and chemical processes involving chloride-assisted localized dissolution at the (hydr)oxide-aluminum interface led to pitting corrosion (McCafferty 1995 and Tomcsányi et al. 1989). High concentrations of sulfate ions in Foss Reservoir water suggests that pit-growth would have been enhanced, thereby accelerating aluminum dissolution that contributes to the observed super-Faradaic behavior (Lee and Pyun 2000). Additionally, since NOM in Foss Reservoir water is principally hydrophilic (non-humic), organics are not expected to play a significant role in modifying aluminum electrodissolution unlike the role they would be expected to play with humic acids (Mechelhoff et al. 2013). Electron micrographs of the new anode, after one cycle of electrolysis to treat 450 mL, and after 33 electrolysis cycles to coagulate 15 L of Foss Reservoir water are shown in Figure 4-2. As seen in Figure 4-2(a), the surface of the new elemental aluminum rod was smooth. Progressive electrolysis induced more and more pitting (Figure 4-2[b] and Figure 4-2[c]) . A magnified image of the corroded aluminum rod showed the existence of geometric facets (Figure 4-2[d])—suggesting the crystallographic nature of pitting as reported earlier for anodically polarized aluminum (Aballe et al. 2001 and Zaid et al. 2008). Using a high current density also most likely induced severe corrosion (i.e.. more large pits) (Aballe et al. 2001). Energy dispersive spectra (EDS) of the new anode (Figure 4-2[e]) primarily detected aluminum, adventitious carbon, and oxygen possibly from the passive oxide layer. After electrolysis, weight fractions of carbon and oxygen increased and new peaks for sulfur and silicon appeared consistent with deposition of NOM, sulfate, and colloidal components present in Foss Reservoir water (Figure 4-2[f]). Presence of sulfate ions close to the pits provide evidence for enhanced aluminum dissolution, since they tend to adsorb and attack the bottom of the preexisting pits (Lee and Pyun 2000). The absence of chloride and presence of sulfur in EDS was attributed to the monovalent chloride ion’s affinity to the outer (hydr)oxide film and subsequent release to the bulk solution at the slightly acidic pH of our experiments and to preferential adsorption of sulfate to the passive layer (Tomcsányi et al. 1989 and Lee and Pyun 2000).
Electrocoagulation pretreatment and optimization
34
Figure 4-2.—Electron micrographs of a new aluminum rod (a), after electrcoagulating 450 mL water or 1-cycle (b), after electrocoagulating 15 L water or 33-cycles (c). A pit from (c) under higher magnification is shown in (d). The corresponding EDS spectra of the new aluminum anode (e) and after 33-cycles (f) are also shown.
Advanced Pretreatment for Nanofiltration of Brackish Surface Water: Fouling Control and Water Quality Improvements
35
4.2. Electrocoagulation process optimization NOM removal was used to optimize EC operating conditions (Figure 4-3[a]). In all cases, DOC removal exhibited saturation-type behavior with significant improvements at lower aluminum dosages before reaching a relatively constant (asymptotic) value beyond 25 mg/L. Higher removals were measured at pH 5.5 due to the lower charge density of NOM following greater protonation, which rendered it more hydrophobic and adsorbable (Krasner and Amy 1995)— similar to “enhanced” conventional chemical coagulation using alum (Iriarte-Velasco et al. 2007 and Matilainen et al. 2010). Highest removals were measured at 10 mA/cm2 current density and pH 5.5. The SUVA slightly decreased with aluminum addition (Figure 4-3[b]), suggesting EC had incrementally better removal of the aromatic and hydrophobic fraction of NOM (Bose and Reckhow 2007 and Singer 1999). Given the high salinity of Foss Reservoir water, very high current densities up to 40 mA/cm2 were feasible. However, NOM removal was lower at 20 and 40 mA/cm2 (Figure 4-3[c]) for a fixed aluminum dosage of 25.6 mg/L, which was consistent with earlier observations that higher electrolysis times are necessary to achieve sufficient contact between the coagulant and NOM for effective sorptive removal (Dubrawski and Mohseni 2013). Note that electrolysis at higher current density is expected to generate a greater number of smaller-sized hydrogen bubbles (Sarkar et al. 2010) that can rapidly carry a majority of the flocs to the surface (i.e., electroflotation), thereby reducing collision frequency between NOM and the electrocoagulant (Holt et al. 2002). Further, NOM removal was nearly the same for 5 and 10 mA/cm2—demonstrating that the residence time corresponding to 10 mA/cm2 was sufficient, which is similar to earlier reports (Dubrawski and Mohseni 2013). Hence, optimal EC conditions corresponded to 25.6 mg/L dosage, 10 mA/cm2 current density, and pH 5.5, which resulted in 40.4 ± 0.3% and 43.6 ± 0.6% DOC and UV254 removal respectively. These organic carbon and UV254 removal levels are consistent with conventional coagulation of from non-saline natural water predominantly containing low-molecular weight, non-humic, hydrophilic NOM (Bose and Reckhow 2007 and Kim and Yu 2005).
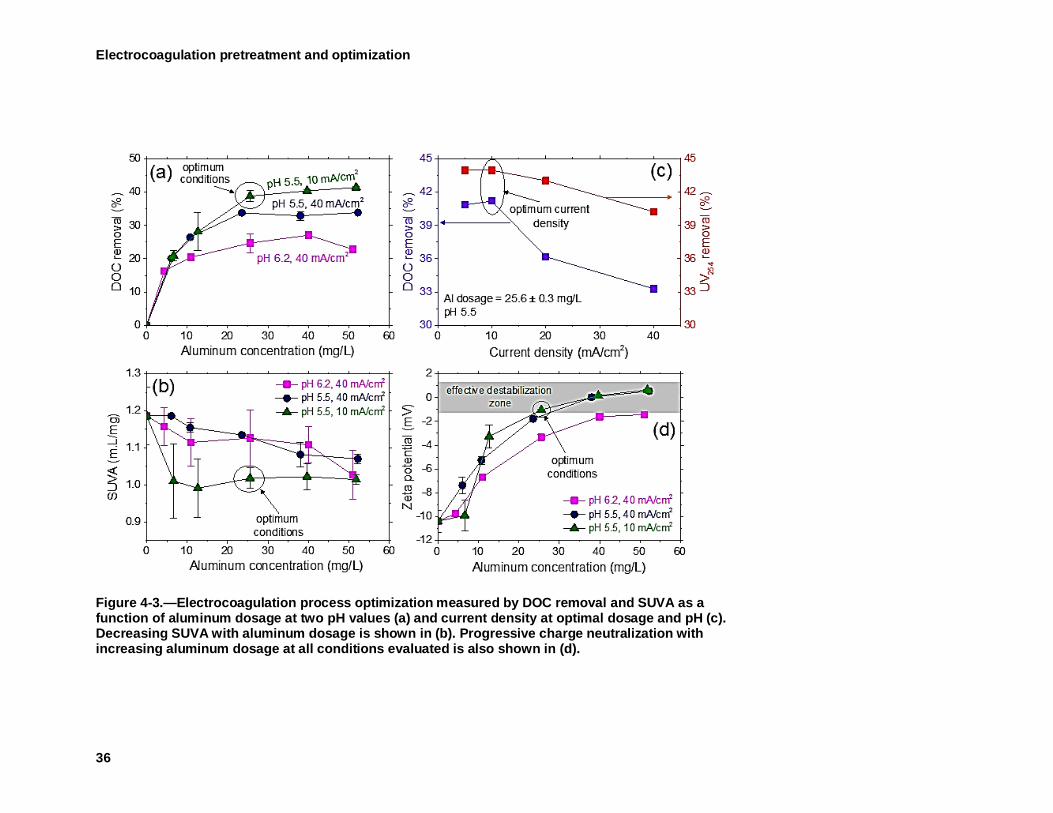
Electrocoagulation pretreatment and optimization
36
Figure 4-3.—Electrocoagulation process optimization measured by DOC removal and SUVA as a function of aluminum dosage at two pH values (a) and current density at optimal dosage and pH (c). Decreasing SUVA with aluminum dosage is shown in (b). Progressive charge neutralization with increasing aluminum dosage at all conditions evaluated is also shown in (d).
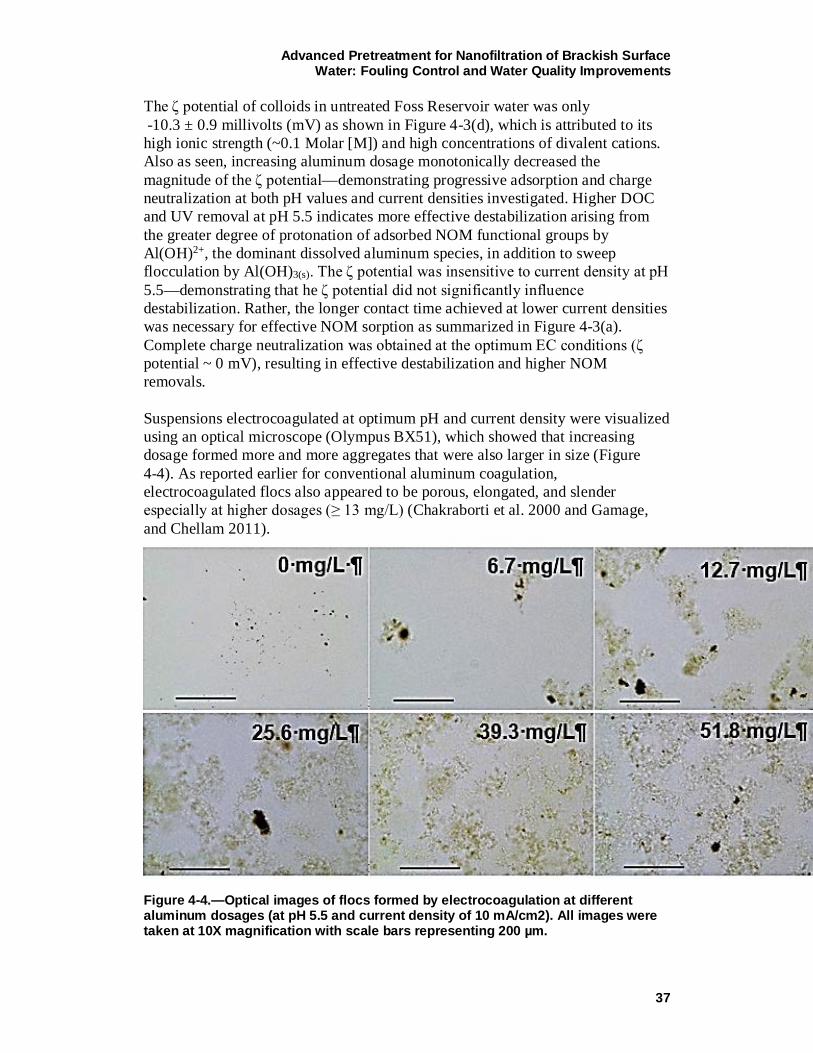
Advanced Pretreatment for Nanofiltration of Brackish Surface Water: Fouling Control and Water Quality Improvements
37
The ζ potential of colloids in untreated Foss Reservoir water was only -10.3 ± 0.9 millivolts (mV) as shown in Figure 4-3(d), which is attributed to its high ionic strength (~0.1 Molar [M]) and high concentrations of divalent cations. Also as seen, increasing aluminum dosage monotonically decreased the magnitude of the ζ potential—demonstrating progressive adsorption and charge neutralization at both pH values and current densities investigated. Higher DOC and UV removal at pH 5.5 indicates more effective destabilization arising from the greater degree of protonation of adsorbed NOM functional groups by Al(OH)2+, the dominant dissolved aluminum species, in addition to sweep flocculation by Al(OH)3(s). The ζ potential was insensitive to current density at pH 5.5—demonstrating that he ζ potential did not significantly influence destabilization. Rather, the longer contact time achieved at lower current densities was necessary for effective NOM sorption as summarized in Figure 4-3(a). Complete charge neutralization was obtained at the optimum EC conditions (ζ potential ~ 0 mV), resulting in effective destabilization and higher NOM removals. Suspensions electrocoagulated at optimum pH and current density were visualized using an optical microscope (Olympus BX51), which showed that increasing dosage formed more and more aggregates that were also larger in size (Figure 4-4). As reported earlier for conventional aluminum coagulation, electrocoagulated flocs also appeared to be porous, elongated, and slender especially at higher dosages (≥ 13 mg/L) (Chakraborti et al. 2000 and Gamage, and Chellam 2011).
Figure 4-4.—Optical images of flocs formed by electrocoagulation at different aluminum dosages (at pH 5.5 and current density of 10 mA/cm2). All images were taken at 10X magnification with scale bars representing 200 µm.
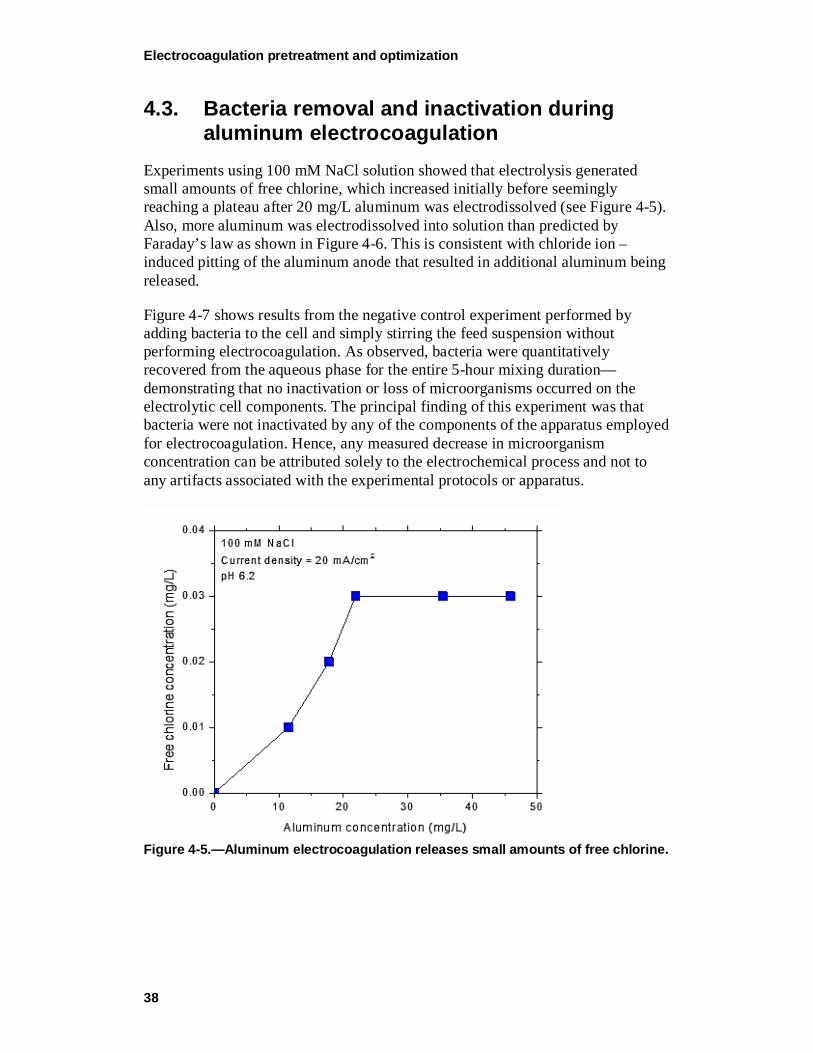
Electrocoagulation pretreatment and optimization
38
4.3. Bacteria removal and inactivation during aluminum electrocoagulation
Experiments using 100 mM NaCl solution showed that electrolysis generated small amounts of free chlorine, which increased initially before seemingly reaching a plateau after 20 mg/L aluminum was electrodissolved (see Figure 4-5). Also, more aluminum was electrodissolved into solution than predicted by Faraday’s law as shown in Figure 4-6. This is consistent with chloride ion – induced pitting of the aluminum anode that resulted in additional aluminum being released.
Figure 4-7 shows results from the negative control experiment performed by adding bacteria to the cell and simply stirring the feed suspension without performing electrocoagulation. As observed, bacteria were quantitatively recovered from the aqueous phase for the entire 5-hour mixing duration—demonstrating that no inactivation or loss of microorganisms occurred on the electrolytic cell components. The principal finding of this experiment was that bacteria were not inactivated by any of the components of the apparatus employed for electrocoagulation. Hence, any measured decrease in microorganism concentration can be attributed solely to the electrochemical process and not to any artifacts associated with the experimental protocols or apparatus.
Figure 4-5.—Aluminum electrocoagulation releases small amounts of free chlorine.
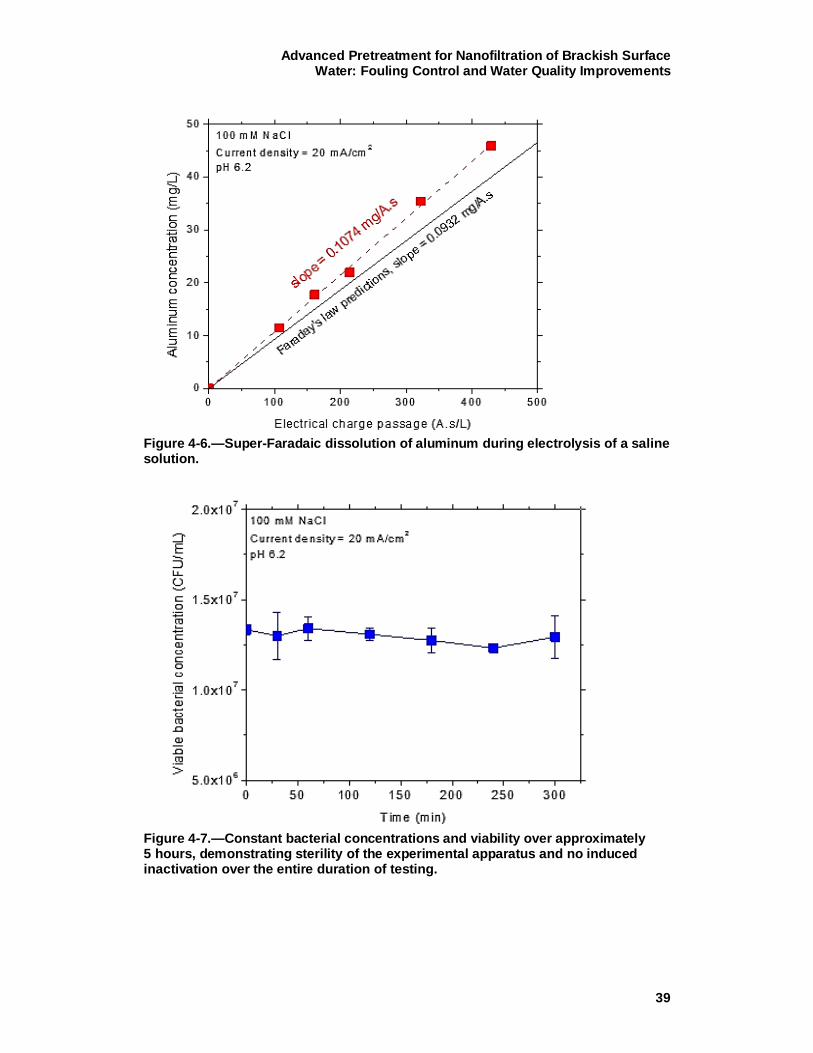
Advanced Pretreatment for Nanofiltration of Brackish Surface Water: Fouling Control and Water Quality Improvements
39
Figure 4-6.—Super-Faradaic dissolution of aluminum during electrolysis of a saline solution.
Figure 4-7.—Constant bacterial concentrations and viability over approximately 5 hours, demonstrating sterility of the experimental apparatus and no induced inactivation over the entire duration of testing.
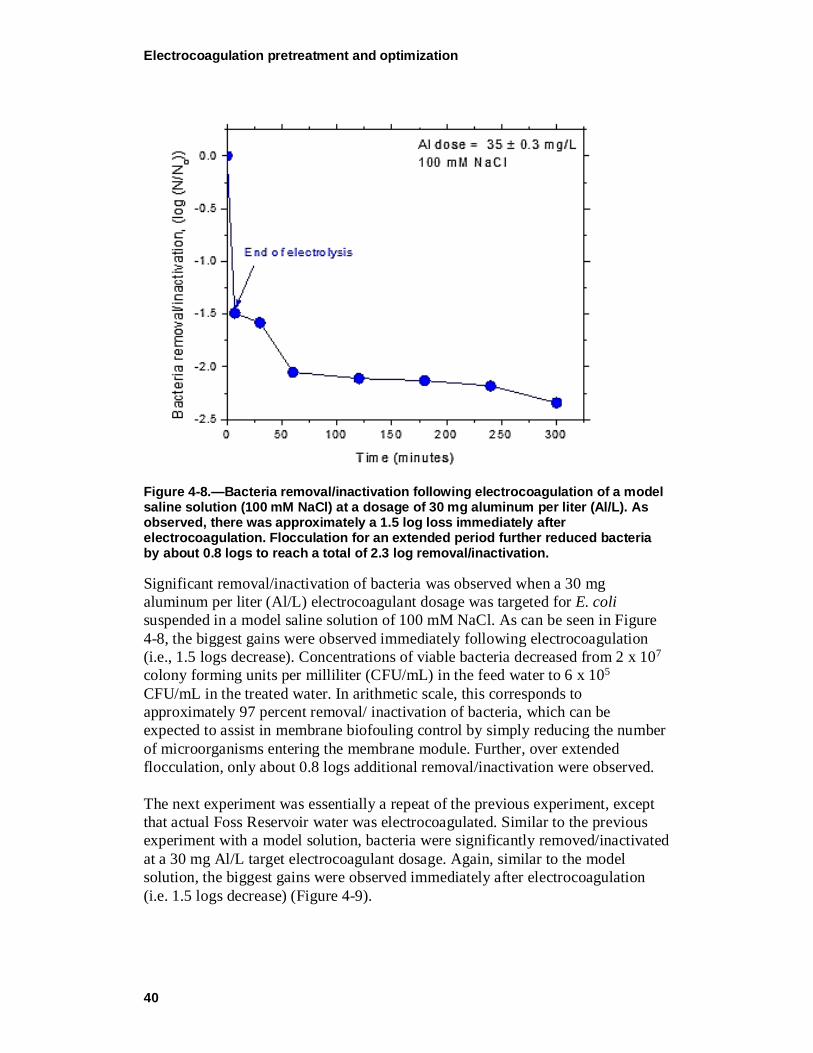
Electrocoagulation pretreatment and optimization
40
Figure 4-8.—Bacteria removal/inactivation following electrocoagulation of a model saline solution (100 mM NaCl) at a dosage of 30 mg aluminum per liter (Al/L). As observed, there was approximately a 1.5 log loss immediately after electrocoagulation. Flocculation for an extended period further reduced bacteria by about 0.8 logs to reach a total of 2.3 log removal/inactivation.
Significant removal/inactivation of bacteria was observed when a 30 mg aluminum per liter (Al/L) electrocoagulant dosage was targeted for E. coli suspended in a model saline solution of 100 mM NaCl. As can be seen in Figure 4-8, the biggest gains were observed immediately following electrocoagulation (i.e., 1.5 logs decrease). Concentrations of viable bacteria decreased from 2 x 10⁷ colony forming units per milliliter (CFU/mL) in the feed water to 6 x 10⁵ CFU/mL in the treated water. In arithmetic scale, this corresponds to approximately 97 percent removal/ inactivation of bacteria, which can be expected to assist in membrane biofouling control by simply reducing the number of microorganisms entering the membrane module. Further, over extended flocculation, only about 0.8 logs additional removal/inactivation were observed. The next experiment was essentially a repeat of the previous experiment, except that actual Foss Reservoir water was electrocoagulated. Similar to the previous experiment with a model solution, bacteria were significantly removed/inactivated at a 30 mg Al/L target electrocoagulant dosage. Again, similar to the model solution, the biggest gains were observed immediately after electrocoagulation (i.e. 1.5 logs decrease) (Figure 4-9).
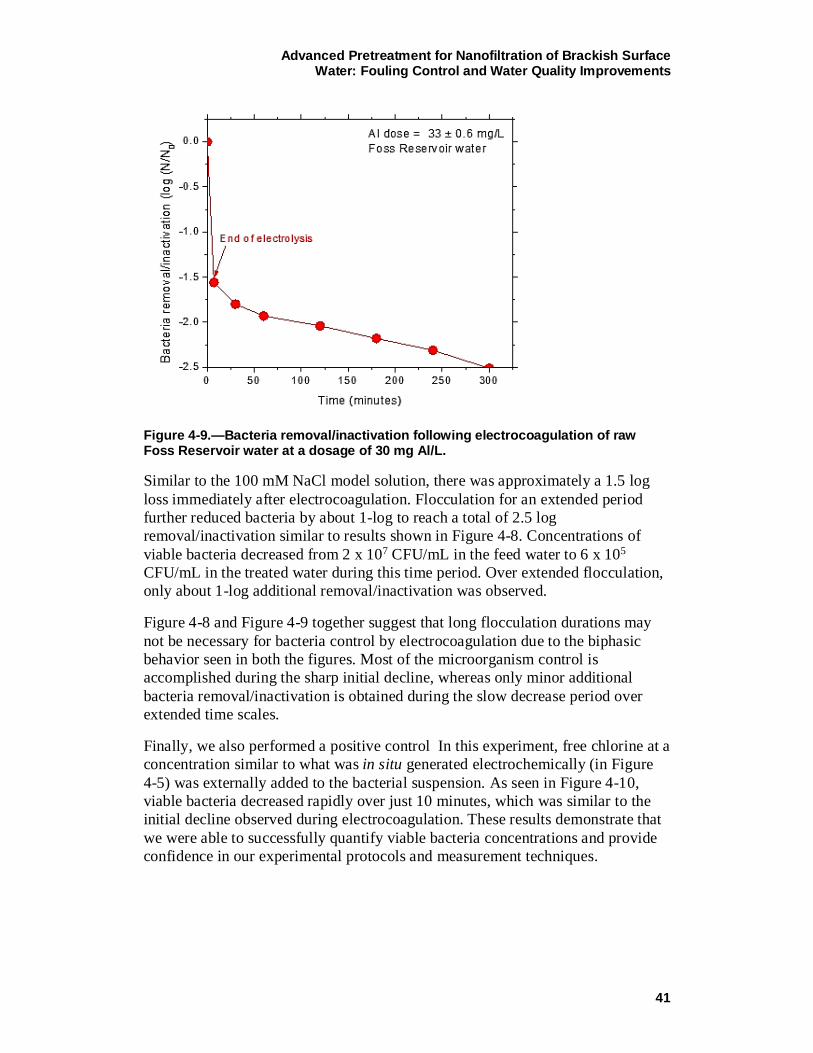
Advanced Pretreatment for Nanofiltration of Brackish Surface Water: Fouling Control and Water Quality Improvements
41
Figure 4-9.—Bacteria removal/inactivation following electrocoagulation of raw Foss Reservoir water at a dosage of 30 mg Al/L.
Similar to the 100 mM NaCl model solution, there was approximately a 1.5 log loss immediately after electrocoagulation. Flocculation for an extended period further reduced bacteria by about 1-log to reach a total of 2.5 log removal/inactivation similar to results shown in Figure 4-8. Concentrations of viable bacteria decreased from 2 x 10⁷ CFU/mL in the feed water to 6 x 10⁵ CFU/mL in the treated water during this time period. Over extended flocculation, only about 1-log additional removal/inactivation was observed.
Figure 4-8 and Figure 4-9 together suggest that long flocculation durations may not be necessary for bacteria control by electrocoagulation due to the biphasic behavior seen in both the figures. Most of the microorganism control is accomplished during the sharp initial decline, whereas only minor additional bacteria removal/inactivation is obtained during the slow decrease period over extended time scales.
Finally, we also performed a positive control In this experiment, free chlorine at a concentration similar to what was in situ generated electrochemically (in Figure 4-5) was externally added to the bacterial suspension. As seen in Figure 4-10, viable bacteria decreased rapidly over just 10 minutes, which was similar to the initial decline observed during electrocoagulation. These results demonstrate that we were able to successfully quantify viable bacteria concentrations and provide confidence in our experimental protocols and measurement techniques.
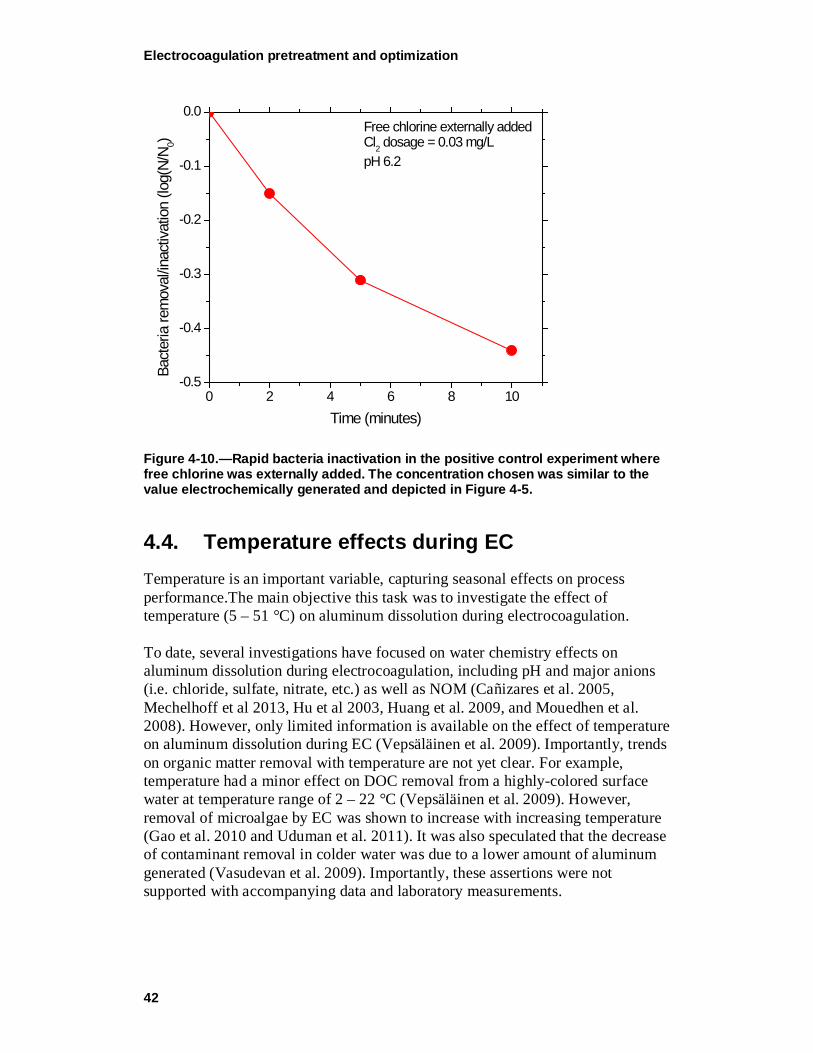
Electrocoagulation pretreatment and optimization
42
Figure 4-10.—Rapid bacteria inactivation in the positive control experiment where free chlorine was externally added. The concentration chosen was similar to the value electrochemically generated and depicted in Figure 4-5.
4.4. Temperature effects during EC Temperature is an important variable, capturing seasonal effects on process performance.The main objective this task was to investigate the effect of temperature (5 – 51 °C) on aluminum dissolution during electrocoagulation. To date, several investigations have focused on water chemistry effects on aluminum dissolution during electrocoagulation, including pH and major anions (i.e. chloride, sulfate, nitrate, etc.) as well as NOM (Cañizares et al. 2005, Mechelhoff et al 2013, Hu et al 2003, Huang et al. 2009, and Mouedhen et al. 2008). However, only limited information is available on the effect of temperature on aluminum dissolution during EC (Vepsäläinen et al. 2009). Importantly, trends on organic matter removal with temperature are not yet clear. For example, temperature had a minor effect on DOC removal from a highly-colored surface water at temperature range of 2 – 22 °C (Vepsäläinen et al. 2009). However, removal of microalgae by EC was shown to increase with increasing temperature (Gao et al. 2010 and Uduman et al. 2011). It was also speculated that the decrease of contaminant removal in colder water was due to a lower amount of aluminum generated (Vasudevan et al. 2009). Importantly, these assertions were not supported with accompanying data and laboratory measurements.
0 2 4 6 8 10-0.5
-0.4
-0.3
-0.2
-0.1
0.0
Bact
eria
rem
oval
/inac
tivat
ion
(log(
N/N 0)
Time (minutes)
Free chlorine externally added Cl2 dosage = 0.03 mg/LpH 6.2
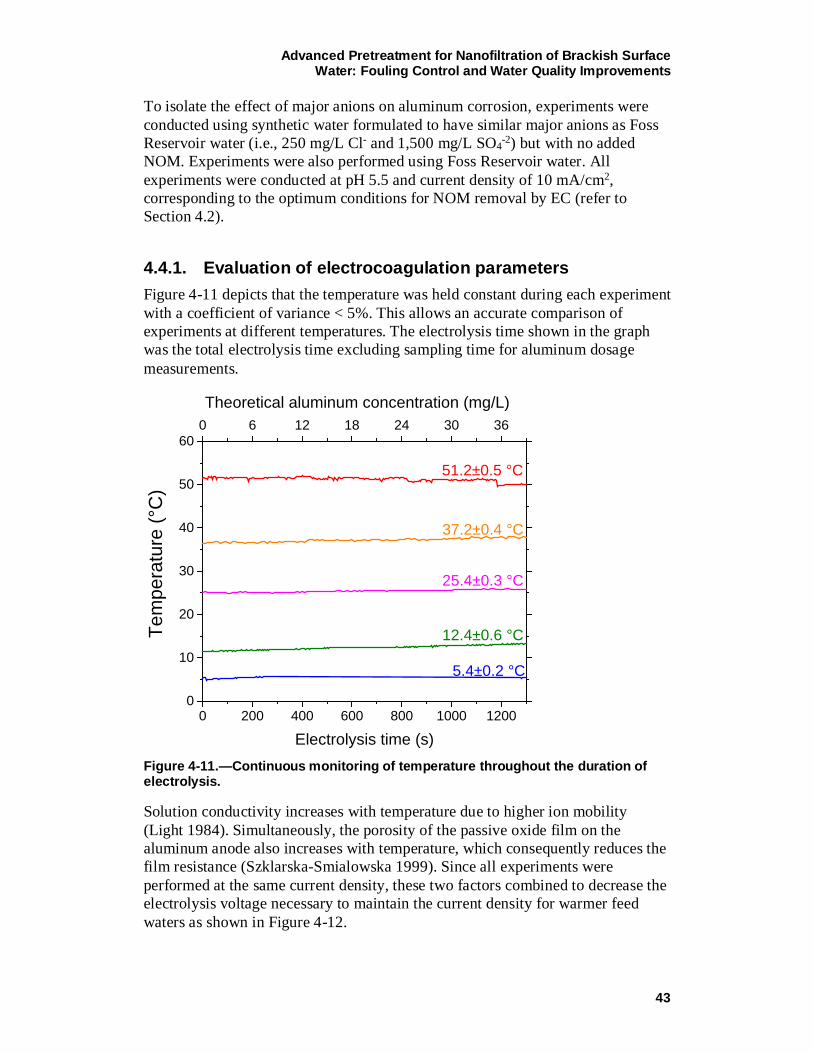
Advanced Pretreatment for Nanofiltration of Brackish Surface Water: Fouling Control and Water Quality Improvements
43
To isolate the effect of major anions on aluminum corrosion, experiments were conducted using synthetic water formulated to have similar major anions as Foss Reservoir water (i.e., 250 mg/L Cl- and 1,500 mg/L SO4-2) but with no added NOM. Experiments were also performed using Foss Reservoir water. All experiments were conducted at pH 5.5 and current density of 10 mA/cm2, corresponding to the optimum conditions for NOM removal by EC (refer to Section 4.2).
4.4.1. Evaluation of electrocoagulation parameters Figure 4-11 depicts that the temperature was held constant during each experiment with a coefficient of variance < 5%. This allows an accurate comparison of experiments at different temperatures. The electrolysis time shown in the graph was the total electrolysis time excluding sampling time for aluminum dosage measurements.
Figure 4-11.—Continuous monitoring of temperature throughout the duration of electrolysis.
Solution conductivity increases with temperature due to higher ion mobility (Light 1984). Simultaneously, the porosity of the passive oxide film on the aluminum anode also increases with temperature, which consequently reduces the film resistance (Szklarska-Smialowska 1999). Since all experiments were performed at the same current density, these two factors combined to decrease the electrolysis voltage necessary to maintain the current density for warmer feed waters as shown in Figure 4-12.
0 200 400 600 800 1000 1200
0 6 12 18 24 30 36
0
10
20
30
40
50
60
Theoretical aluminum concentration (mg/L)
5.4±0.2 °C
12.4±0.6 °C
25.4±0.3 °C
37.2±0.4 °C
Tem
pera
ture
(°C
)
Electrolysis time (s)
51.2±0.5 °C
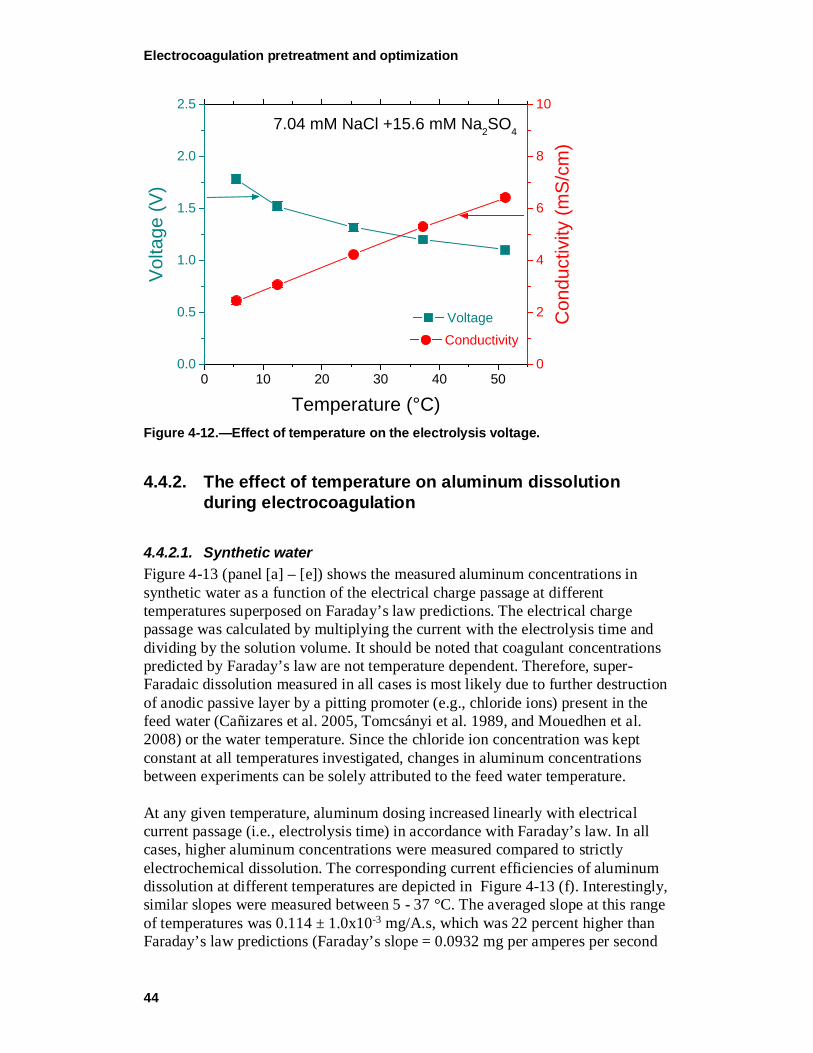
Electrocoagulation pretreatment and optimization
44
Figure 4-12.—Effect of temperature on the electrolysis voltage.
4.4.2. The effect of temperature on aluminum dissolution during electrocoagulation
4.4.2.1. Synthetic water Figure 4-13 (panel [a] – [e]) shows the measured aluminum concentrations in synthetic water as a function of the electrical charge passage at different temperatures superposed on Faraday’s law predictions. The electrical charge passage was calculated by multiplying the current with the electrolysis time and dividing by the solution volume. It should be noted that coagulant concentrations predicted by Faraday’s law are not temperature dependent. Therefore, super-Faradaic dissolution measured in all cases is most likely due to further destruction of anodic passive layer by a pitting promoter (e.g., chloride ions) present in the feed water (Cañizares et al. 2005, Tomcsányi et al. 1989, and Mouedhen et al. 2008) or the water temperature. Since the chloride ion concentration was kept constant at all temperatures investigated, changes in aluminum concentrations between experiments can be solely attributed to the feed water temperature. At any given temperature, aluminum dosing increased linearly with electrical current passage (i.e., electrolysis time) in accordance with Faraday’s law. In all cases, higher aluminum concentrations were measured compared to strictly electrochemical dissolution. The corresponding current efficiencies of aluminum dissolution at different temperatures are depicted in Figure 4-13 (f). Interestingly, similar slopes were measured between 5 - 37 °C. The averaged slope at this range of temperatures was 0.114 ± 1.0x10⁻³ mg/A.s, which was 22 percent higher than Faraday’s law predictions (Faraday’s slope = 0.0932 mg per amperes per second
0 10 20 30 40 500.0
0.5
1.0
1.5
2.0
2.5
Voltage
7.04 mM NaCl +15.6 mM Na2SO4
Volta
ge (V
)
Temperature (°C)
0
2
4
6
8
10
Conductivity
Con
duct
ivity
(mS/
cm)
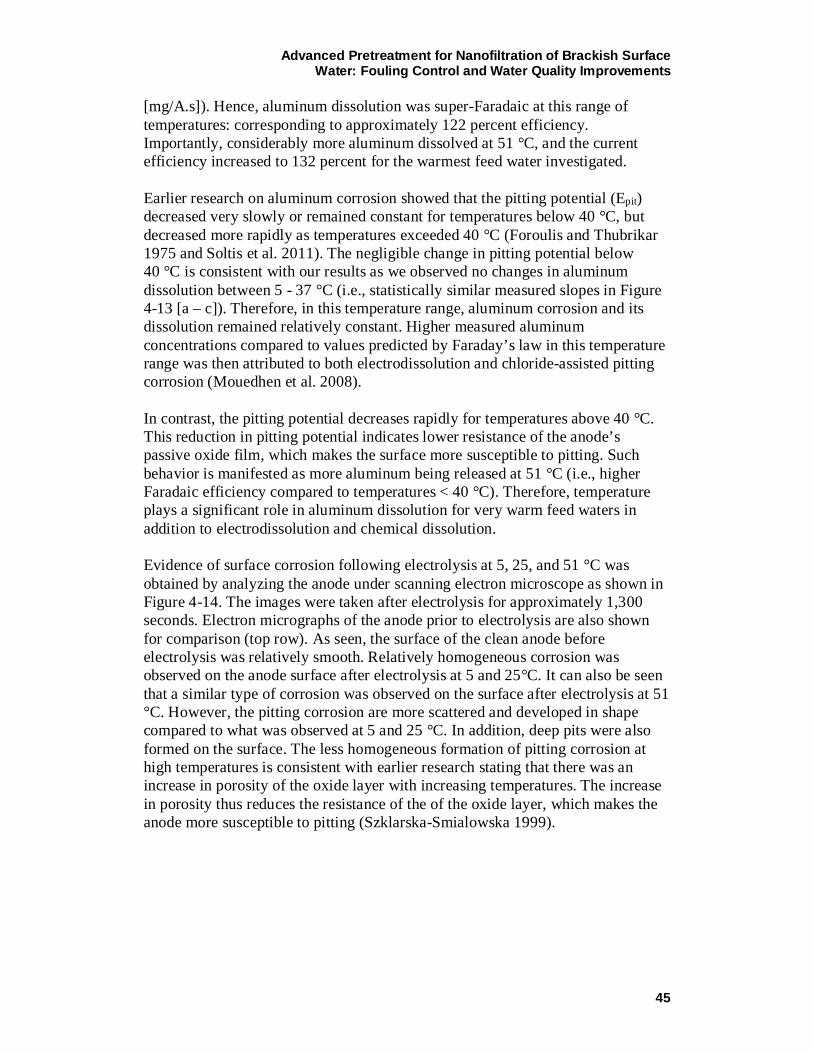
Advanced Pretreatment for Nanofiltration of Brackish Surface Water: Fouling Control and Water Quality Improvements
45
[mg/A.s]). Hence, aluminum dissolution was super-Faradaic at this range of temperatures: corresponding to approximately 122 percent efficiency. Importantly, considerably more aluminum dissolved at 51 °C, and the current efficiency increased to 132 percent for the warmest feed water investigated. Earlier research on aluminum corrosion showed that the pitting potential (Epit) decreased very slowly or remained constant for temperatures below 40 °C, but decreased more rapidly as temperatures exceeded 40 °C (Foroulis and Thubrikar 1975 and Soltis et al. 2011). The negligible change in pitting potential below 40 °C is consistent with our results as we observed no changes in aluminum dissolution between 5 - 37 °C (i.e., statistically similar measured slopes in Figure 4-13 [a – c]). Therefore, in this temperature range, aluminum corrosion and its dissolution remained relatively constant. Higher measured aluminum concentrations compared to values predicted by Faraday’s law in this temperature range was then attributed to both electrodissolution and chloride-assisted pitting corrosion (Mouedhen et al. 2008). In contrast, the pitting potential decreases rapidly for temperatures above 40 °C. This reduction in pitting potential indicates lower resistance of the anode’s passive oxide film, which makes the surface more susceptible to pitting. Such behavior is manifested as more aluminum being released at 51 °C (i.e., higher Faradaic efficiency compared to temperatures < 40 °C). Therefore, temperature plays a significant role in aluminum dissolution for very warm feed waters in addition to electrodissolution and chemical dissolution. Evidence of surface corrosion following electrolysis at 5, 25, and 51 °C was obtained by analyzing the anode under scanning electron microscope as shown in Figure 4-14. The images were taken after electrolysis for approximately 1,300 seconds. Electron micrographs of the anode prior to electrolysis are also shown for comparison (top row). As seen, the surface of the clean anode before electrolysis was relatively smooth. Relatively homogeneous corrosion was observed on the anode surface after electrolysis at 5 and 25°C. It can also be seen that a similar type of corrosion was observed on the surface after electrolysis at 51 °C. However, the pitting corrosion are more scattered and developed in shape compared to what was observed at 5 and 25 °C. In addition, deep pits were also formed on the surface. The less homogeneous formation of pitting corrosion at high temperatures is consistent with earlier research stating that there was an increase in porosity of the oxide layer with increasing temperatures. The increase in porosity thus reduces the resistance of the of the oxide layer, which makes the anode more susceptible to pitting (Szklarska-Smialowska 1999).
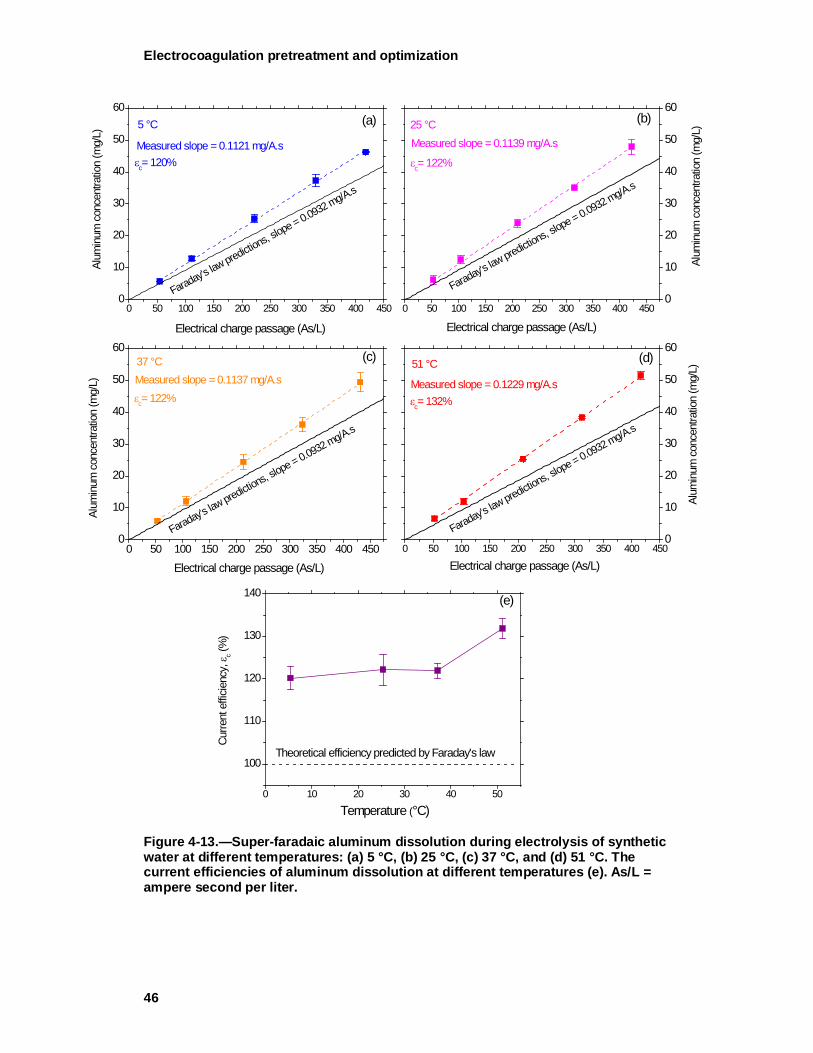
Electrocoagulation pretreatment and optimization
46
Figure 4-13.—Super-faradaic aluminum dissolution during electrolysis of synthetic water at different temperatures: (a) 5 °C, (b) 25 °C, (c) 37 °C, and (d) 51 °C. The current efficiencies of aluminum dissolution at different temperatures (e). As/L = ampere second per liter.
0 50 100 150 200 250 300 350 400 4500
10
20
30
40
50
60
0 50 100 150 200 250 300 350 400 4500
10
20
30
40
50
60
0 50 100 150 200 250 300 350 400 4500
10
20
30
40
50
60
0 50 100 150 200 250 300 350 400 4500
10
20
30
40
50
60
0 10 20 30 40 50
100
110
120
130
140
(a)
εc= 120%
Electrical charge passage (As/L)Electrical charge passage (As/L)
Faraday's law predictio
ns, slope = 0.0932 mg/A.s
5 °C
Measured slope = 0.1121 mg/A.s
Electrical charge passage (As/L)
Alum
inum
con
cent
ratio
n (m
g/L)
Alum
inum
con
cent
ratio
n (m
g/L)
Alum
inum
con
cent
ratio
n (m
g/L)
(b)
εc= 122%
Faraday's law predictio
ns, slope = 0.0932 mg/A.s
25 °C
Alum
inum
con
cent
ratio
n (m
g/L)
Measured slope = 0.1139 mg/A.s
(c)
εc= 122%
Faraday's law predictio
ns, slope = 0.0932 mg/A.s
37 °CMeasured slope = 0.1137 mg/A.s
Curre
nt e
fficie
ncy,
ε c (%
)
εc= 132%
Electrical charge passage (As/L)
(e)
Faraday's law predictio
ns, slope = 0.0932 mg/A.s
51 °C
Temperature (°C)
Measured slope = 0.1229 mg/A.s
(d)
Theoretical efficiency predicted by Faraday's law
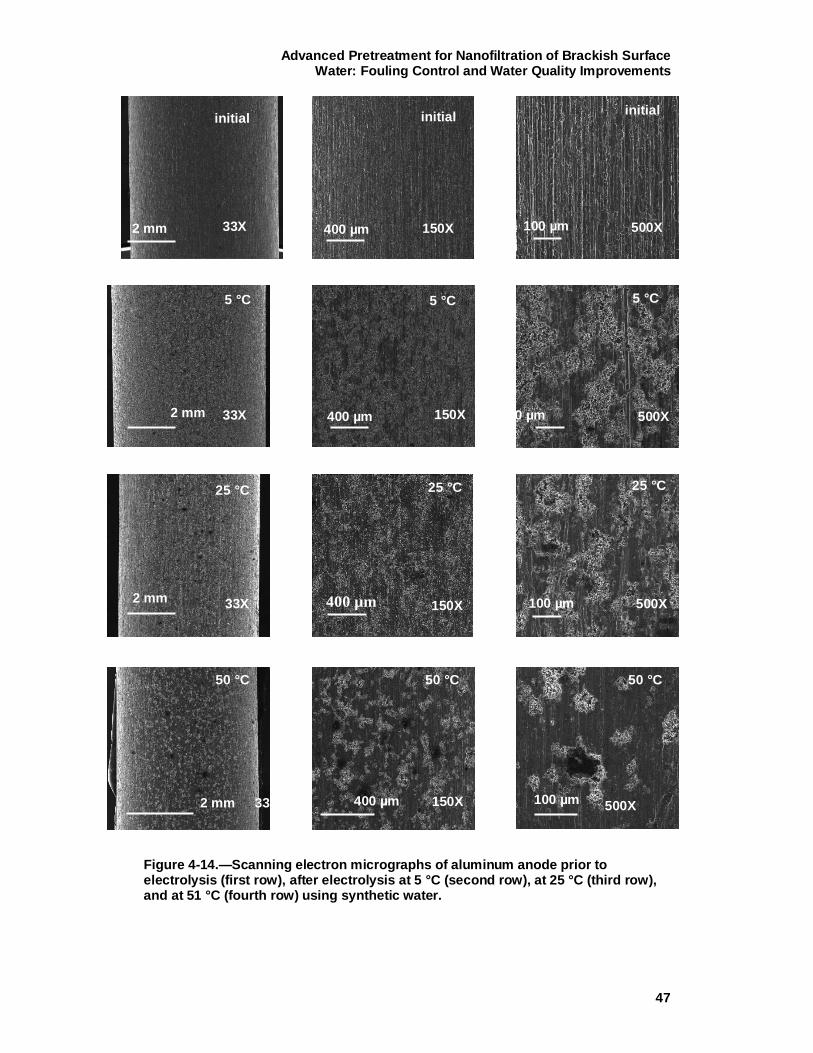
Advanced Pretreatment for Nanofiltration of Brackish Surface Water: Fouling Control and Water Quality Improvements
47
Figure 4-14.—Scanning electron micrographs of aluminum anode prior to electrolysis (first row), after electrolysis at 5 °C (second row), at 25 °C (third row), and at 51 °C (fourth row) using synthetic water.
2 mm
2 mm
2 mm
2 mm
400 µm
400 µm
400 µm
400 µm
100 µm
100 µm
100 µm
100 µm
50 °C 50 °C 50 °C
33X
33X
33X
33X
25 °C 25 °C 25 °C
5 °C 5 °C 5 °C
initial initial initial
150X
150X
150X
150X 500X
500X
500X
500X
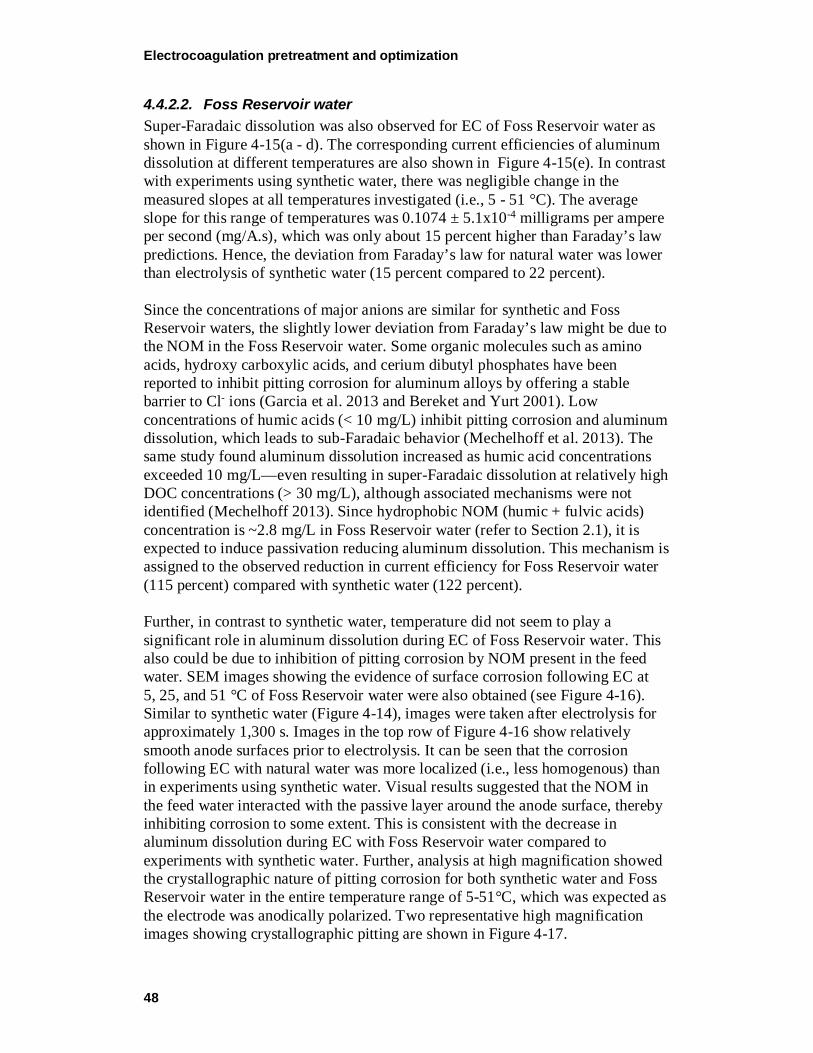
Electrocoagulation pretreatment and optimization
48
4.4.2.2. Foss Reservoir water Super-Faradaic dissolution was also observed for EC of Foss Reservoir water as shown in Figure 4-15(a - d). The corresponding current efficiencies of aluminum dissolution at different temperatures are also shown in Figure 4-15(e). In contrast with experiments using synthetic water, there was negligible change in the measured slopes at all temperatures investigated (i.e., 5 - 51 °C). The average slope for this range of temperatures was 0.1074 ± 5.1x10⁻⁴ milligrams per ampere per second (mg/A.s), which was only about 15 percent higher than Faraday’s law predictions. Hence, the deviation from Faraday’s law for natural water was lower than electrolysis of synthetic water (15 percent compared to 22 percent). Since the concentrations of major anions are similar for synthetic and Foss Reservoir waters, the slightly lower deviation from Faraday’s law might be due to the NOM in the Foss Reservoir water. Some organic molecules such as amino acids, hydroxy carboxylic acids, and cerium dibutyl phosphates have been reported to inhibit pitting corrosion for aluminum alloys by offering a stable barrier to Cl- ions (Garcia et al. 2013 and Bereket and Yurt 2001). Low concentrations of humic acids (< 10 mg/L) inhibit pitting corrosion and aluminum dissolution, which leads to sub-Faradaic behavior (Mechelhoff et al. 2013). The same study found aluminum dissolution increased as humic acid concentrations exceeded 10 mg/L—even resulting in super-Faradaic dissolution at relatively high DOC concentrations (> 30 mg/L), although associated mechanisms were not identified (Mechelhoff 2013). Since hydrophobic NOM (humic + fulvic acids) concentration is ~2.8 mg/L in Foss Reservoir water (refer to Section 2.1), it is expected to induce passivation reducing aluminum dissolution. This mechanism is assigned to the observed reduction in current efficiency for Foss Reservoir water (115 percent) compared with synthetic water (122 percent). Further, in contrast to synthetic water, temperature did not seem to play a significant role in aluminum dissolution during EC of Foss Reservoir water. This also could be due to inhibition of pitting corrosion by NOM present in the feed water. SEM images showing the evidence of surface corrosion following EC at 5, 25, and 51 °C of Foss Reservoir water were also obtained (see Figure 4-16). Similar to synthetic water (Figure 4-14), images were taken after electrolysis for approximately 1,300 s. Images in the top row of Figure 4-16 show relatively smooth anode surfaces prior to electrolysis. It can be seen that the corrosion following EC with natural water was more localized (i.e., less homogenous) than in experiments using synthetic water. Visual results suggested that the NOM in the feed water interacted with the passive layer around the anode surface, thereby inhibiting corrosion to some extent. This is consistent with the decrease in aluminum dissolution during EC with Foss Reservoir water compared to experiments with synthetic water. Further, analysis at high magnification showed the crystallographic nature of pitting corrosion for both synthetic water and Foss Reservoir water in the entire temperature range of 5-51°C, which was expected as the electrode was anodically polarized. Two representative high magnification images showing crystallographic pitting are shown in Figure 4-17.
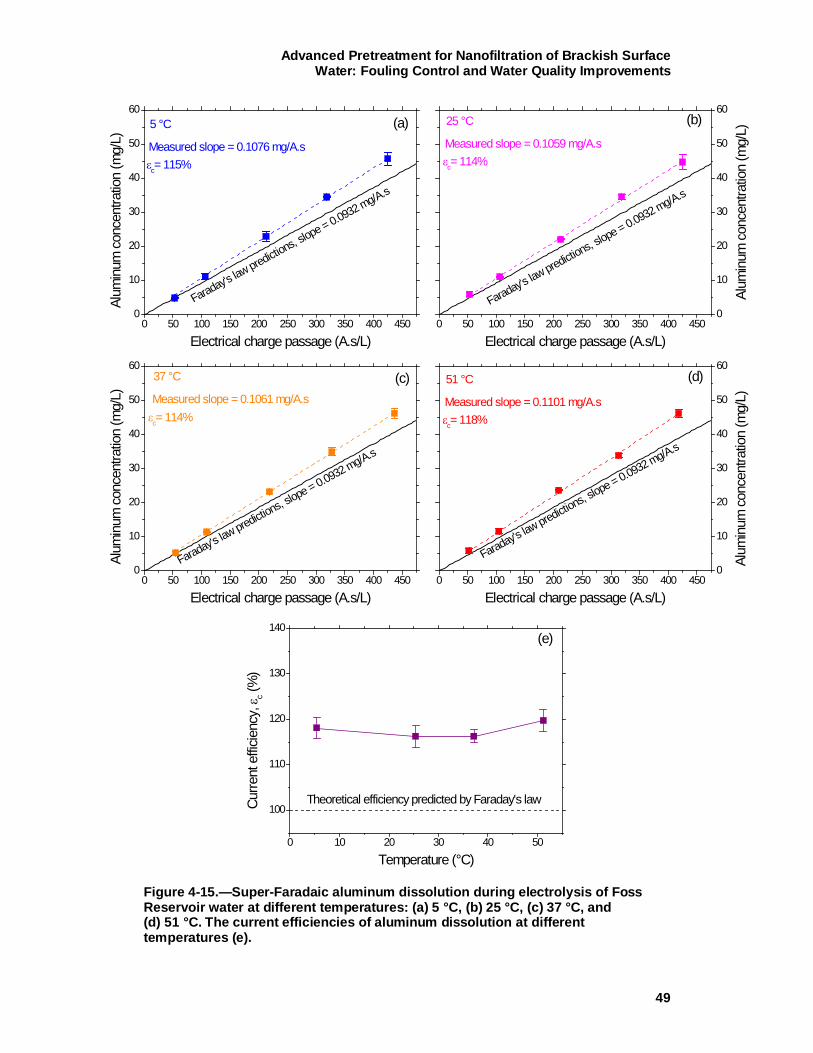
Advanced Pretreatment for Nanofiltration of Brackish Surface Water: Fouling Control and Water Quality Improvements
49
Figure 4-15.—Super-Faradaic aluminum dissolution during electrolysis of Foss Reservoir water at different temperatures: (a) 5 °C, (b) 25 °C, (c) 37 °C, and (d) 51 °C. The current efficiencies of aluminum dissolution at different temperatures (e).
0 50 100 150 200 250 300 350 400 4500
10
20
30
40
50
60
0 50 100 150 200 250 300 350 400 4500
10
20
30
40
50
60
0 50 100 150 200 250 300 350 400 4500
10
20
30
40
50
60
0 50 100 150 200 250 300 350 400 4500
10
20
30
40
50
60
0 10 20 30 40 50
100
110
120
130
140
Faraday's law predictio
ns, slope = 0.0932 mg/A.s
Alum
inum
con
cent
ratio
n (m
g/L)
Alum
inum
con
cent
ratio
n (m
g/L)
Alum
inum
con
cent
ratio
n (m
g/L)
Electrical charge passage (A.s/L)
5 °C
Measured slope = 0.1076 mg/A.sεc= 115%
(a) (b)
(c) (d)
(e)
Faraday's law predictio
ns, slope = 0.0932 mg/A.s
Electrical charge passage (A.s/L)
25 °C
Measured slope = 0.1059 mg/A.sεc= 114%
Faraday's law predictio
ns, slope = 0.0932 mg/A.s
Alum
inum
con
cent
ratio
n (m
g/L)
Electrical charge passage (A.s/L)
37 °C
Measured slope = 0.1061 mg/A.sεc= 114%
Faraday's law predictio
ns, slope = 0.0932 mg/A.s
Electrical charge passage (A.s/L)
51 °C
Measured slope = 0.1101 mg/A.sεc= 118%
Theoretical efficiency predicted by Faraday's law Curre
nt e
fficie
ncy,
ε c (%
)
Temperature (°C)
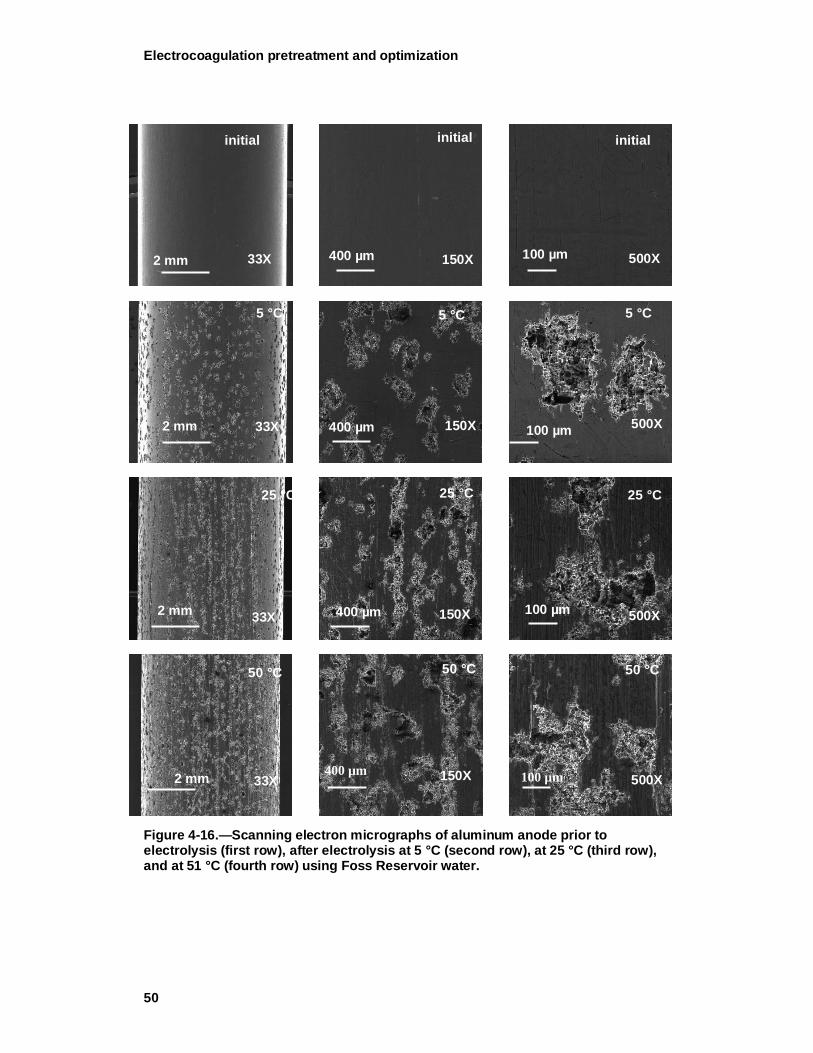
Electrocoagulation pretreatment and optimization
50
Figure 4-16.—Scanning electron micrographs of aluminum anode prior to electrolysis (first row), after electrolysis at 5 °C (second row), at 25 °C (third row), and at 51 °C (fourth row) using Foss Reservoir water.
2 mm 400 µm 100 µm 33X 150X 500X
2 mm 33X
2 mm 33X
2 mm 33X
400 µm 150X
400 µm 150X
400 µm 150X
100 µm 500X
100 µm 500X
100 µm 500X
initial initial initial
5 °C 5 °C 5 °C
25 °C 25 °C 25 °C
50 °C 50 °C 50 °C
Advanced Pretreatment for Nanofiltration of Brackish Surface Water: Fouling Control and Water Quality Improvements
51
Figure 4-17.—Geometric facets showing the crystallographic nature of pitting following electrolysis in synthetic water (a) and Foss Reservoir water (b). The scale bars in both images represent 10 µm.
4.4.3. Temperature effects on dissolved and particulate aluminum bulk concentrations
Following electrolysis of synthetic water, the suspension was immediately filtered through a 0.22 µm syringe filter to measure dissolved aluminum. The total aluminum concentration was also measured after acidifying the sample to pH ~2 by using HCl without any filtration. As summarized in Figure 4-18, more aluminum was present in dissolved forms at lower temperatures. Figure 4-19 also shows the dissolved and particulate aluminum concentrations as percentages. As can be seen, particulate aluminum concentration increased with temperature, whereas the dissolved aluminum concentration decreased. These results suggest that aluminum dissolution during EC is affected by temperature. Significant temperature effects on aluminum speciation in the absence of NOM is consistent with the shifting of aluminum solubility towards higher pH values for colder feed waters (Van Benschoten and Edzwald 1990). Therefore, even though electrolysis generated similar amounts of total aluminum in the range 5 – 37 °C, the bulk aluminum speciation in the suspensions was different at the same pH. These results suggest that electrocoagulation has to be optimized separately for individual seasons to maximize Al(OH)3 precipitation and NOM removal. We suggest that coagulation treatment in winter should be done at slightly higher pH (about 0.5 log shift) than in summer.
(a) (b)
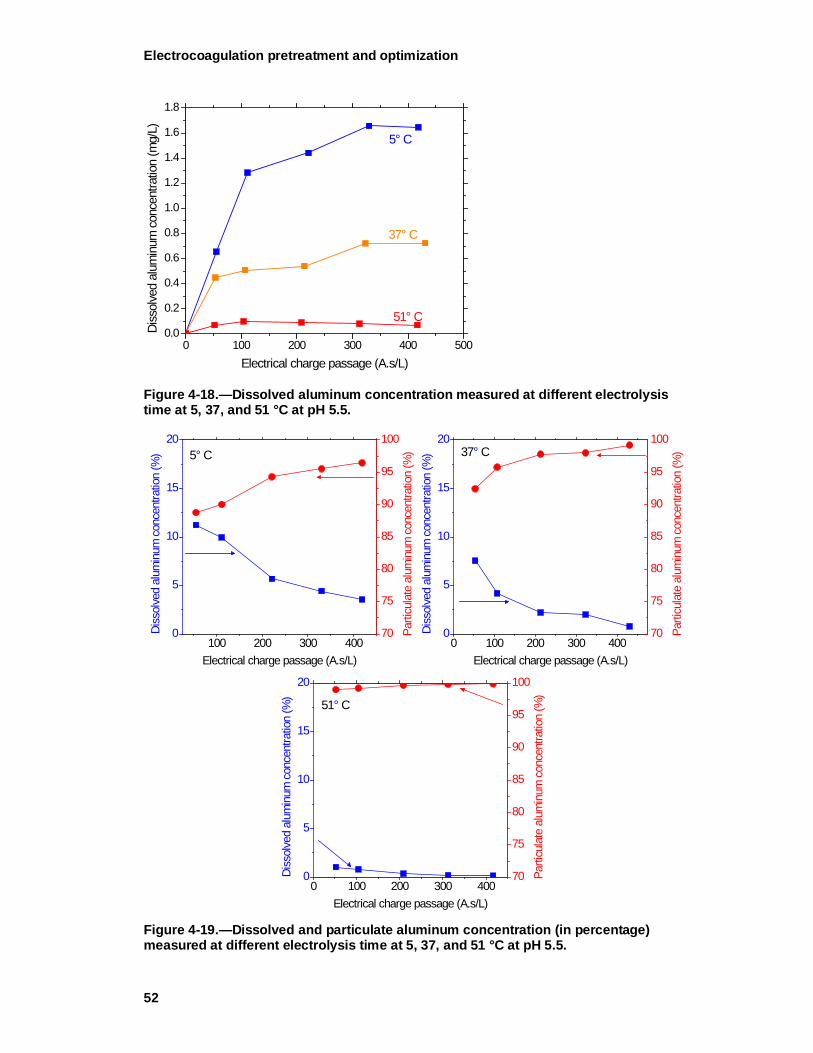
Electrocoagulation pretreatment and optimization
52
Figure 4-18.—Dissolved aluminum concentration measured at different electrolysis time at 5, 37, and 51 °C at pH 5.5.
Figure 4-19.—Dissolved and particulate aluminum concentration (in percentage) measured at different electrolysis time at 5, 37, and 51 °C at pH 5.5.
0 100 200 300 400 5000.0
0.2
0.4
0.6
0.8
1.0
1.2
1.4
1.6
1.8
51° C
37° C
Diss
olve
d al
umin
um c
once
ntra
tion
(mg/
L)
Electrical charge passage (A.s/L)
5° C
100 200 300 4000
5
10
15
20
0 100 200 300 4000
5
10
15
20
0 100 200 300 4000
5
10
15
20
Diss
olve
d al
umin
um c
once
ntra
tion
(%)
Electrical charge passage (A.s/L)
5° C 37° C
Di
ssol
ved
alum
inum
con
cent
ratio
n (%
)
Electrical charge passage (A.s/L)
51° C
Diss
olve
d al
umin
um c
once
ntra
tion
(%)
Electrical charge passage (A.s/L)
70
75
80
85
90
95
100
Parti
cula
te a
lum
inum
con
cent
ratio
n (%
)
70
75
80
85
90
95
100
Parti
cula
te a
lum
inum
con
cent
ratio
n (%
)
70
75
80
85
90
95
100
Parti
cula
te a
lum
inum
con
cent
ratio
n (%
)
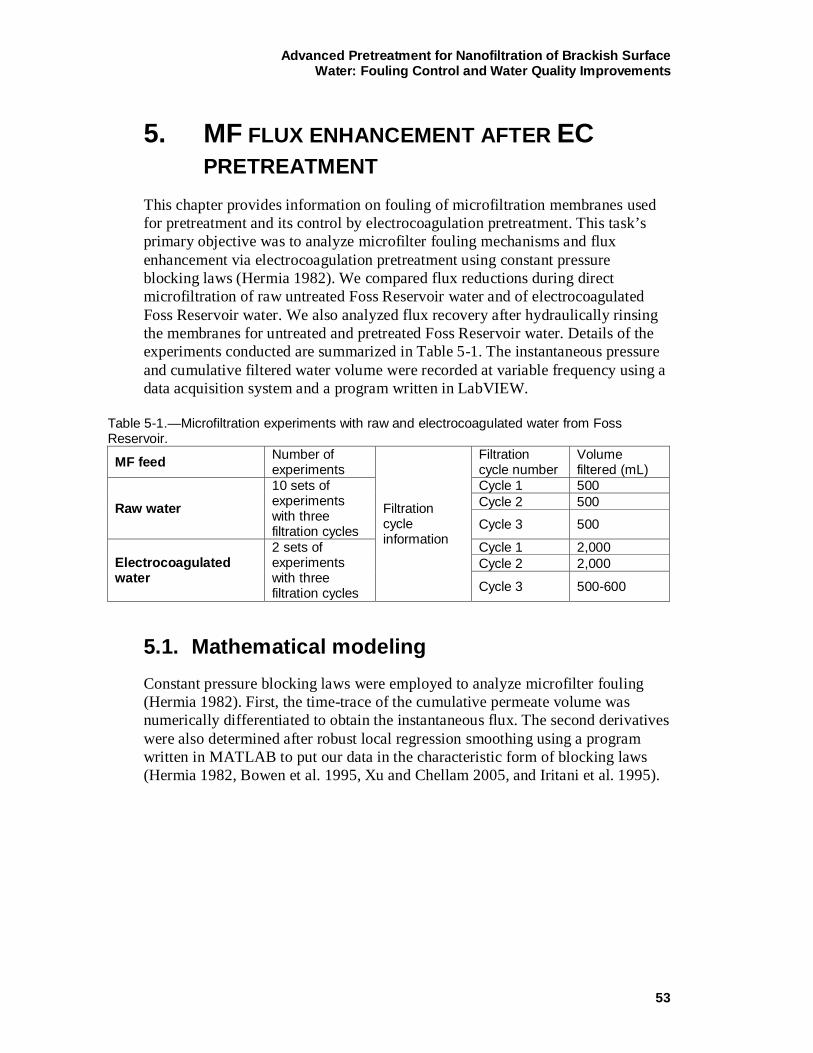
Advanced Pretreatment for Nanofiltration of Brackish Surface Water: Fouling Control and Water Quality Improvements
53
5. MF FLUX ENHANCEMENT AFTER ECPRETREATMENT
This chapter provides information on fouling of microfiltration membranes used for pretreatment and its control by electrocoagulation pretreatment. This task’s primary objective was to analyze microfilter fouling mechanisms and flux enhancement via electrocoagulation pretreatment using constant pressure blocking laws (Hermia 1982). We compared flux reductions during direct microfiltration of raw untreated Foss Reservoir water and of electrocoagulated Foss Reservoir water. We also analyzed flux recovery after hydraulically rinsing the membranes for untreated and pretreated Foss Reservoir water. Details of the experiments conducted are summarized in Table 5-1. The instantaneous pressure and cumulative filtered water volume were recorded at variable frequency using a data acquisition system and a program written in LabVIEW.
Table 5-1.—Microfiltration experiments with raw and electrocoagulated water from Foss Reservoir.
MF feed Number of experiments
Filtration cycle information
Filtration cycle number
Volume filtered (mL)
Raw water 10 sets of experiments with three filtration cycles
Cycle 1 500 Cycle 2 500 Cycle 3 500
Electrocoagulated water
2 sets of experiments with three filtration cycles
Cycle 1 2,000 Cycle 2 2,000
Cycle 3 500-600
5.1. Mathematical modeling Constant pressure blocking laws were employed to analyze microfilter fouling (Hermia 1982). First, the time-trace of the cumulative permeate volume was numerically differentiated to obtain the instantaneous flux. The second derivatives were also determined after robust local regression smoothing using a program written in MATLAB to put our data in the characteristic form of blocking laws (Hermia 1982, Bowen et al. 1995, Xu and Chellam 2005, and Iritani et al. 1995).
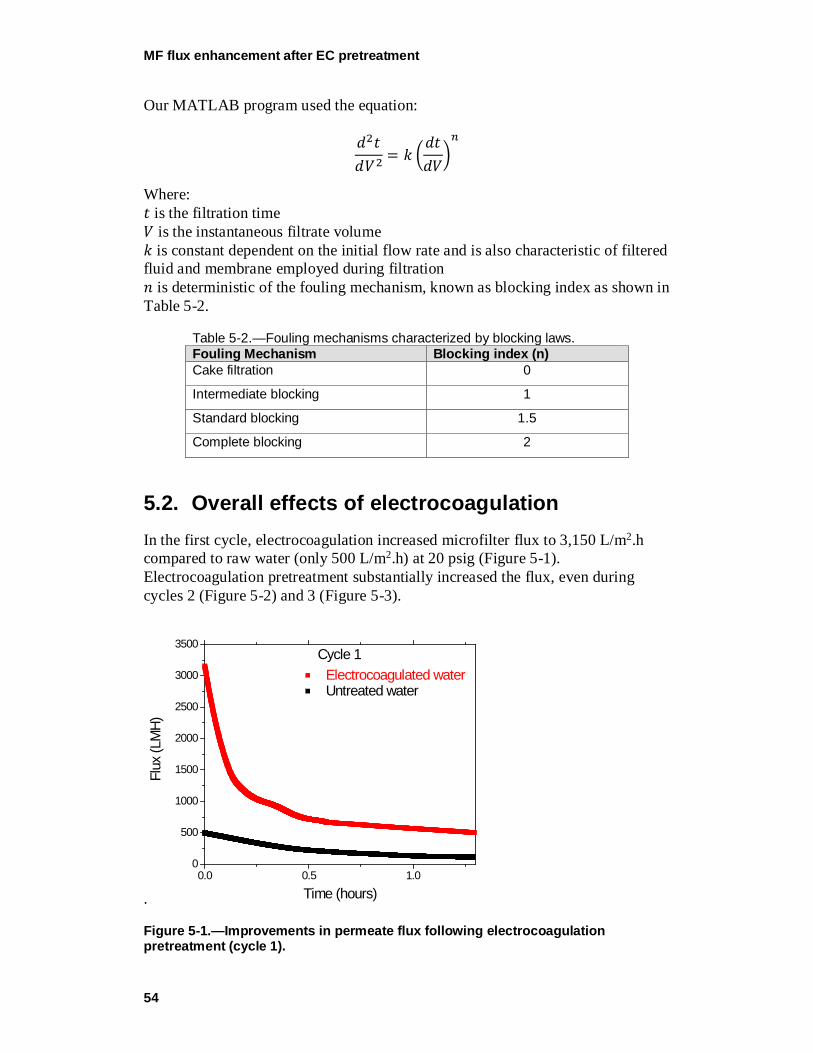
MF flux enhancement after EC pretreatment
54
Our MATLAB program used the equation:
𝑑𝑑2𝑡𝑡𝑑𝑑𝑉𝑉2
= 𝑘𝑘 �𝑑𝑑𝑡𝑡𝑑𝑑𝑉𝑉�𝑛𝑛
Where: 𝑡𝑡 is the filtration time 𝑉𝑉 is the instantaneous filtrate volume 𝑘𝑘 is constant dependent on the initial flow rate and is also characteristic of filtered fluid and membrane employed during filtration 𝑛𝑛 is deterministic of the fouling mechanism, known as blocking index as shown in Table 5-2.
Table 5-2.—Fouling mechanisms characterized by blocking laws. Fouling Mechanism Blocking index (n) Cake filtration 0
Intermediate blocking 1
Standard blocking 1.5
Complete blocking 2
5.2. Overall effects of electrocoagulation In the first cycle, electrocoagulation increased microfilter flux to 3,150 L/m2.h compared to raw water (only 500 L/m2.h) at 20 psig (Figure 5-1). Electrocoagulation pretreatment substantially increased the flux, even during cycles 2 (Figure 5-2) and 3 (Figure 5-3).
.
Figure 5-1.—Improvements in permeate flux following electrocoagulation pretreatment (cycle 1).
0.0 0.5 1.00
500
1000
1500
2000
2500
3000
3500
Electrocoagulated water Untreated water
Cycle 1
Flux
(LM
H)
Time (hours)
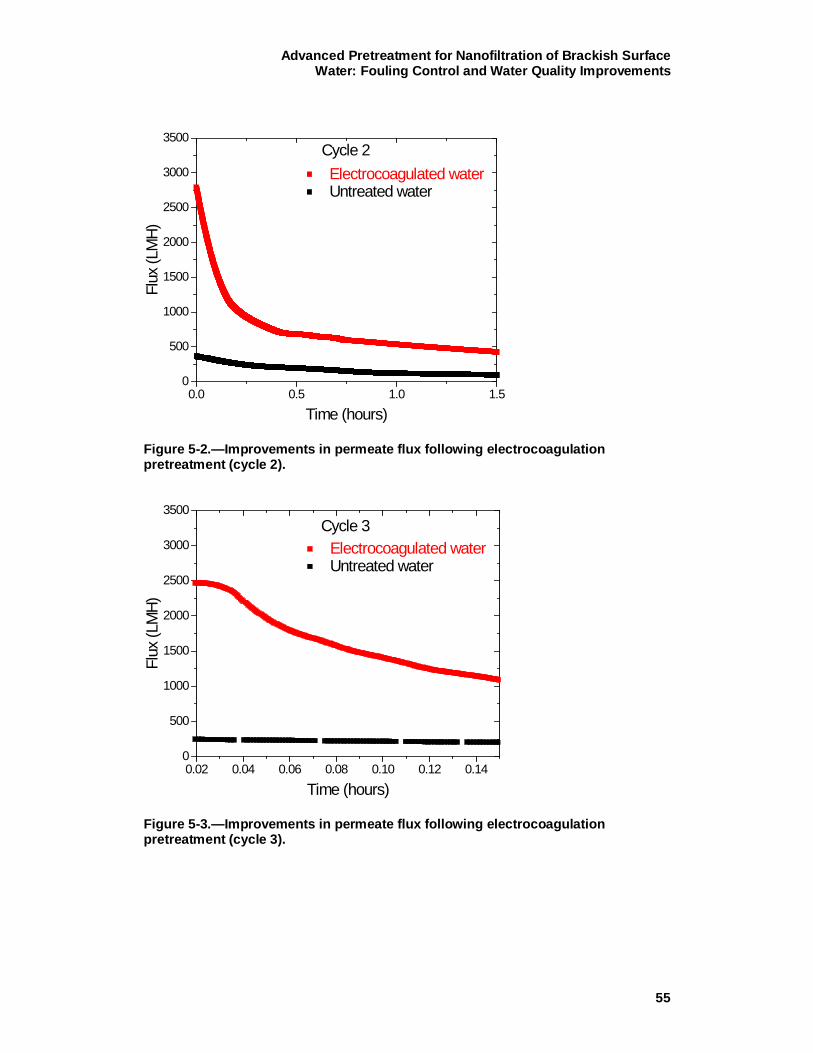
Advanced Pretreatment for Nanofiltration of Brackish Surface Water: Fouling Control and Water Quality Improvements
55
Figure 5-2.—Improvements in permeate flux following electrocoagulation pretreatment (cycle 2).
Figure 5-3.—Improvements in permeate flux following electrocoagulation pretreatment (cycle 3).
0.0 0.5 1.0 1.50
500
1000
1500
2000
2500
3000
3500
Electrocoagulated water Untreated water
Cycle 2
Flux
(LM
H)
Time (hours)
0.02 0.04 0.06 0.08 0.10 0.12 0.140
500
1000
1500
2000
2500
3000
3500
Electrocoagulated water Untreated water
Flux
(LM
H)
Time (hours)
Cycle 3
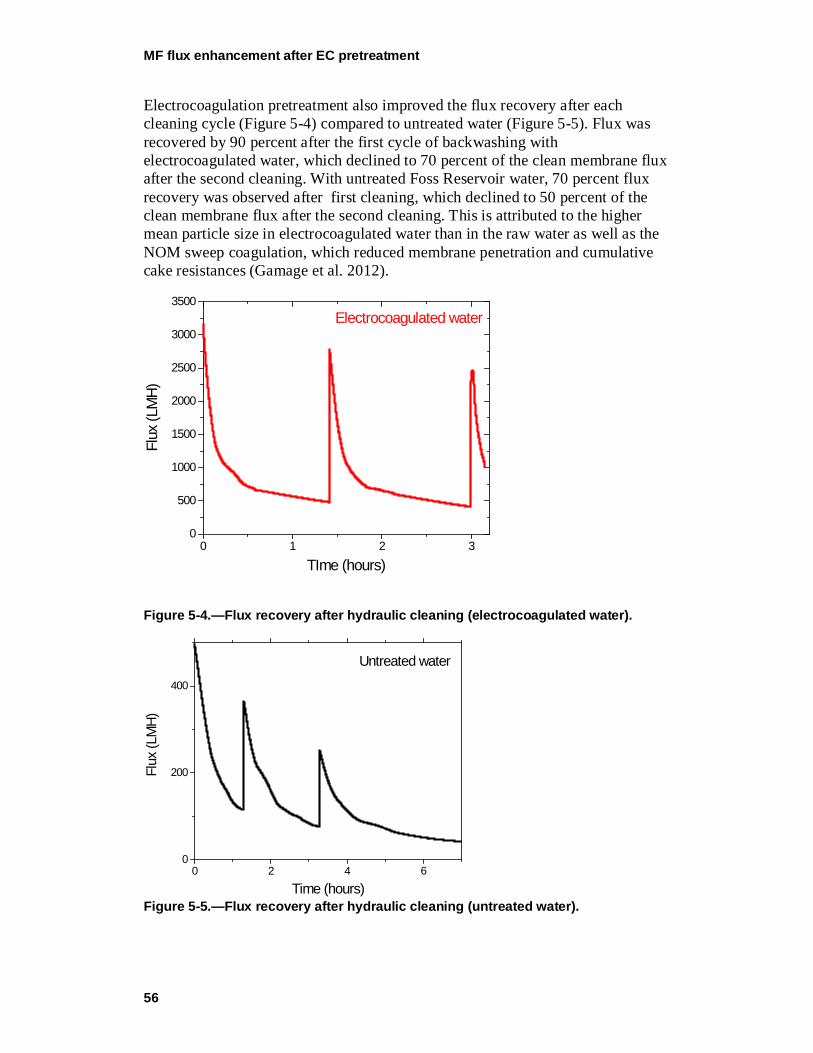
MF flux enhancement after EC pretreatment
56
Electrocoagulation pretreatment also improved the flux recovery after each cleaning cycle (Figure 5-4) compared to untreated water (Figure 5-5). Flux was recovered by 90 percent after the first cycle of backwashing with electrocoagulated water, which declined to 70 percent of the clean membrane flux after the second cleaning. With untreated Foss Reservoir water, 70 percent flux recovery was observed after first cleaning, which declined to 50 percent of the clean membrane flux after the second cleaning. This is attributed to the higher mean particle size in electrocoagulated water than in the raw water as well as the NOM sweep coagulation, which reduced membrane penetration and cumulative cake resistances (Gamage et al. 2012).
Figure 5-4.—Flux recovery after hydraulic cleaning (electrocoagulated water).
Figure 5-5.—Flux recovery after hydraulic cleaning (untreated water).
0 1 2 30
500
1000
1500
2000
2500
3000
3500
Flux
(LM
H)
TIme (hours)
Electrocoagulated water
0 2 4 60
200
400
Untreated water
Flux
(LM
H)
Time (hours)
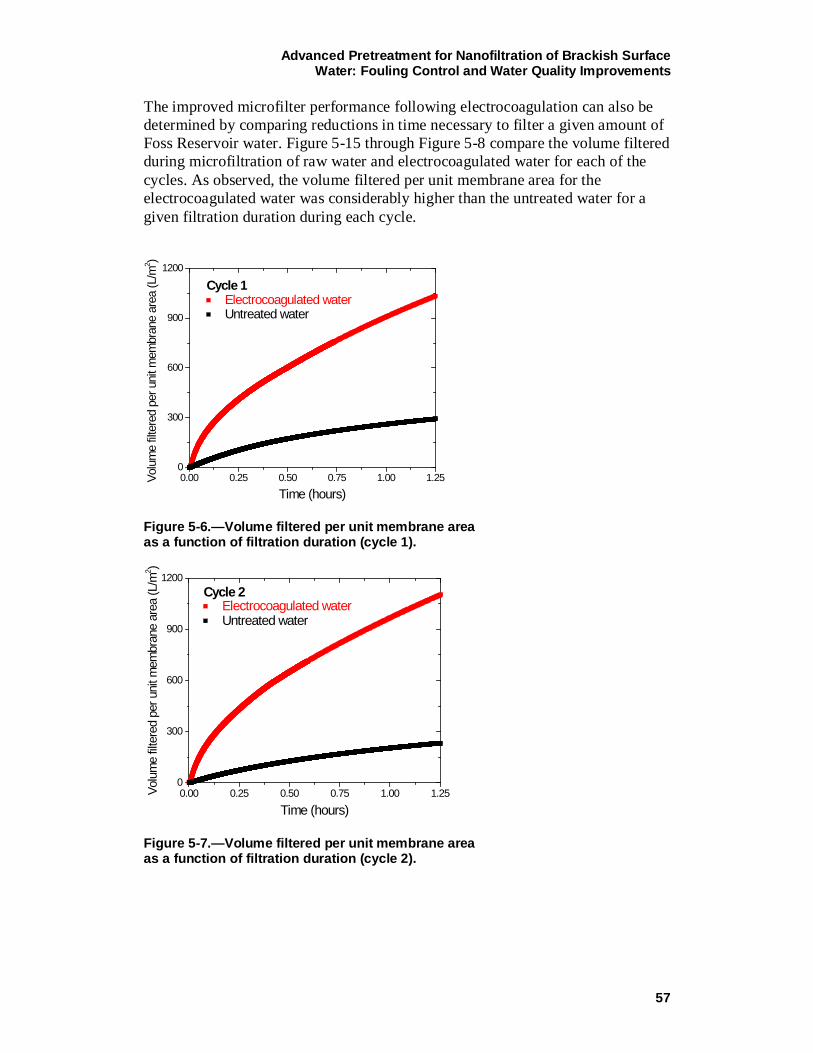
Advanced Pretreatment for Nanofiltration of Brackish Surface Water: Fouling Control and Water Quality Improvements
57
The improved microfilter performance following electrocoagulation can also be determined by comparing reductions in time necessary to filter a given amount of Foss Reservoir water. Figure 5-15 through Figure 5-8 compare the volume filtered during microfiltration of raw water and electrocoagulated water for each of the cycles. As observed, the volume filtered per unit membrane area for the electrocoagulated water was considerably higher than the untreated water for a given filtration duration during each cycle.
Figure 5-6.—Volume filtered per unit membrane area as a function of filtration duration (cycle 1).
Figure 5-7.—Volume filtered per unit membrane area as a function of filtration duration (cycle 2).
0.00 0.25 0.50 0.75 1.00 1.250
300
600
900
1200
Electrocoagulated water Untreated water
Cycle 1
Volu
me
filter
ed p
er u
nit m
embr
ane
area
(L/m
2 )
Time (hours)
0.00 0.25 0.50 0.75 1.00 1.250
300
600
900
1200
Electrocoagulated water Untreated water
Cycle 2
Volu
me
filter
ed p
er u
nit m
embr
ane
area
(L/m
2 )
Time (hours)
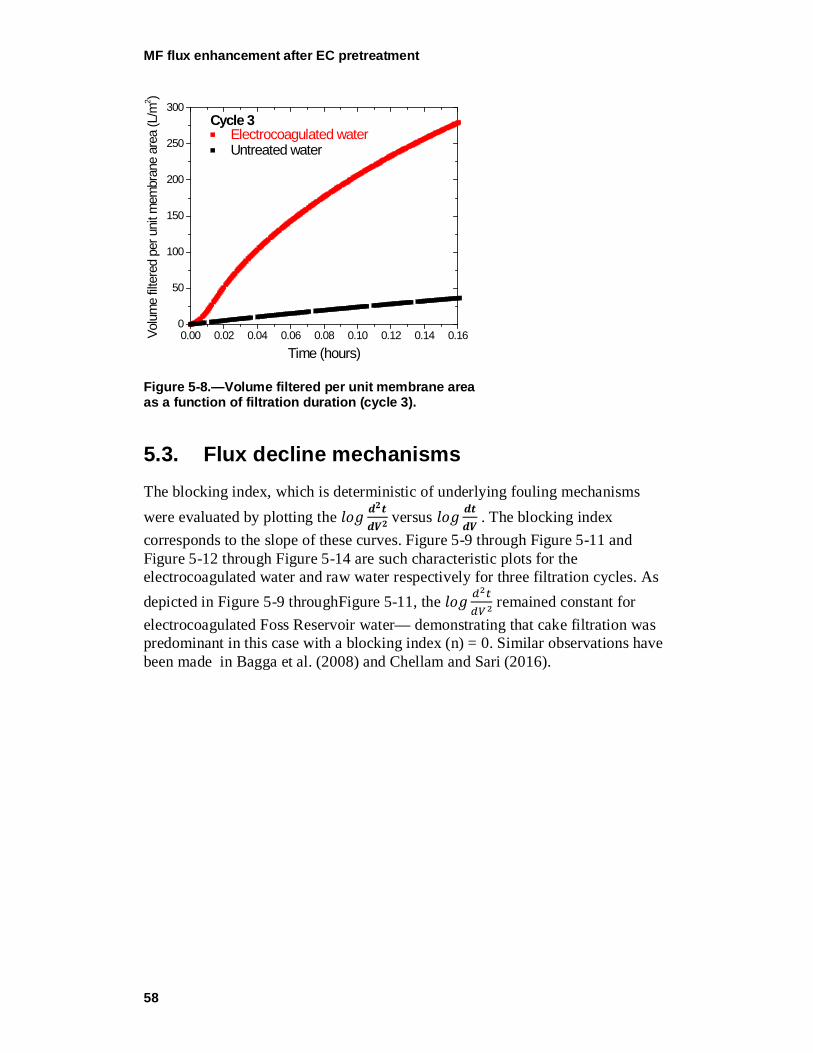
MF flux enhancement after EC pretreatment
58
Figure 5-8.—Volume filtered per unit membrane area as a function of filtration duration (cycle 3).
5.3. Flux decline mechanisms The blocking index, which is deterministic of underlying fouling mechanisms were evaluated by plotting the 𝑙𝑙𝑙𝑙𝑙𝑙 𝒅𝒅𝟐𝟐𝒕𝒕
𝒅𝒅𝑽𝑽𝟐𝟐 versus 𝑙𝑙𝑙𝑙𝑙𝑙 𝒅𝒅𝒕𝒕
𝒅𝒅𝑽𝑽 . The blocking index
corresponds to the slope of these curves. Figure 5-9 through Figure 5-11 and Figure 5-12 through Figure 5-14 are such characteristic plots for the electrocoagulated water and raw water respectively for three filtration cycles. As depicted in Figure 5-9 throughFigure 5-11, the 𝑙𝑙𝑙𝑙𝑙𝑙 𝑑𝑑2𝑡𝑡
𝑑𝑑𝑉𝑉2 remained constant for
electrocoagulated Foss Reservoir water— demonstrating that cake filtration was predominant in this case with a blocking index (n) = 0. Similar observations have been made in Bagga et al. (2008) and Chellam and Sari (2016).
0.00 0.02 0.04 0.06 0.08 0.10 0.12 0.14 0.160
50
100
150
200
250
300
Electrocoagulated water Untreated water
Cycle 3
Volu
me
filter
ed p
er u
nit m
embr
ane
area
(L/m
2 )
Time (hours)
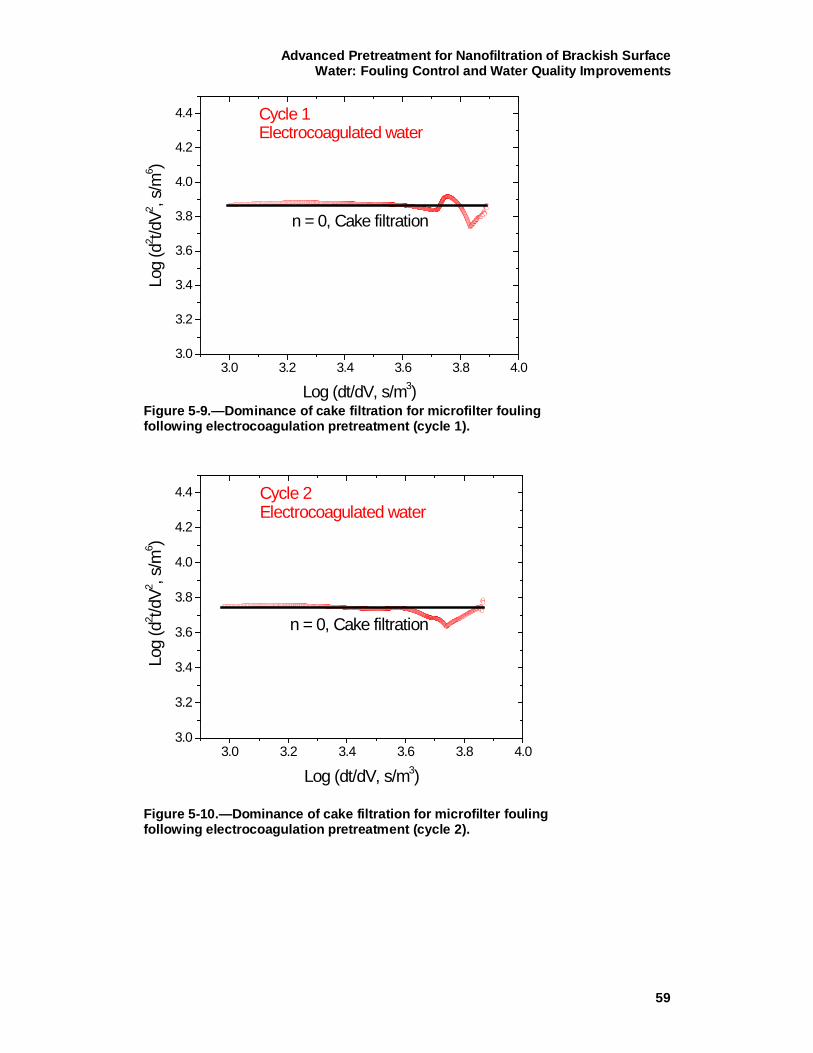
Advanced Pretreatment for Nanofiltration of Brackish Surface Water: Fouling Control and Water Quality Improvements
59
Figure 5-9.—Dominance of cake filtration for microfilter fouling following electrocoagulation pretreatment (cycle 1).
Figure 5-10.—Dominance of cake filtration for microfilter fouling following electrocoagulation pretreatment (cycle 2).
3.0 3.2 3.4 3.6 3.8 4.03.0
3.2
3.4
3.6
3.8
4.0
4.2
4.4 Cycle 1Electrocoagulated water
Log
(d2 t/d
V2 , s/m
6 )
Log (dt/dV, s/m3)
n = 0, Cake filtration
3.0 3.2 3.4 3.6 3.8 4.03.0
3.2
3.4
3.6
3.8
4.0
4.2
4.4 Cycle 2Electrocoagulated water
n = 0, Cake filtration
Log
(d2 t/d
V2 , s/m
6 )
Log (dt/dV, s/m3)
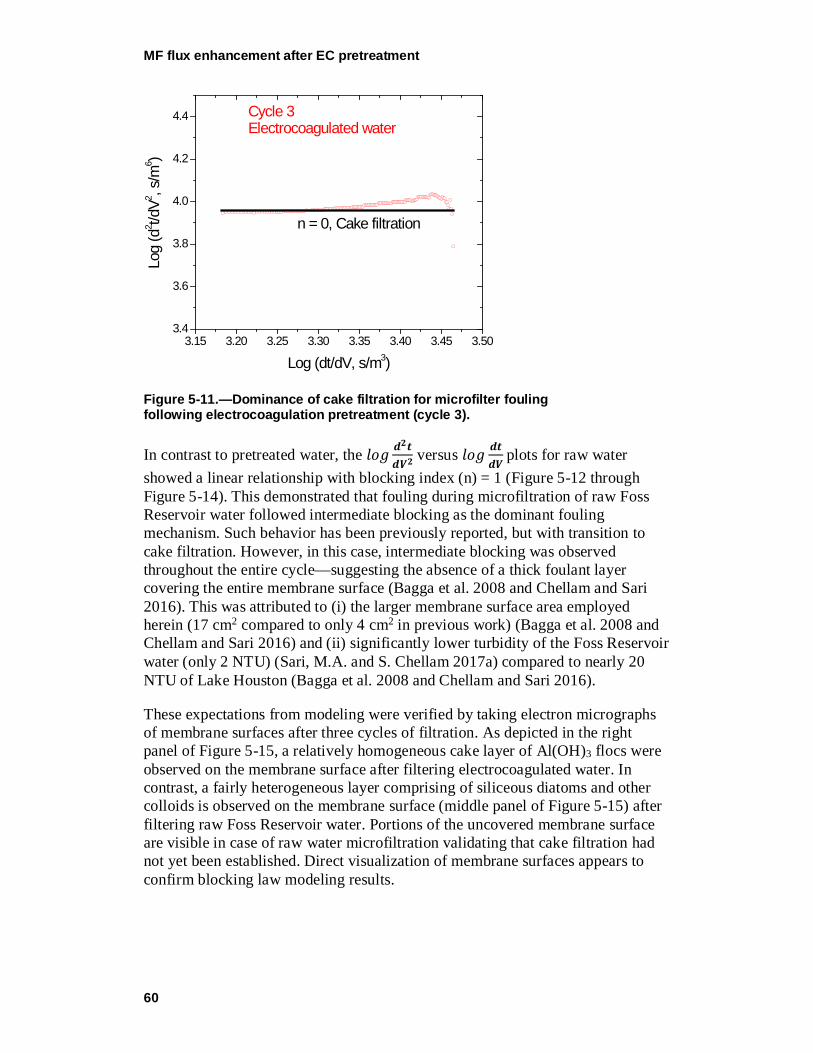
MF flux enhancement after EC pretreatment
60
Figure 5-11.—Dominance of cake filtration for microfilter fouling following electrocoagulation pretreatment (cycle 3).
In contrast to pretreated water, the 𝑙𝑙𝑙𝑙𝑙𝑙 𝒅𝒅𝟐𝟐𝒕𝒕𝒅𝒅𝑽𝑽𝟐𝟐
versus 𝑙𝑙𝑙𝑙𝑙𝑙 𝒅𝒅𝒕𝒕𝒅𝒅𝑽𝑽
plots for raw water showed a linear relationship with blocking index (n) = 1 (Figure 5-12 through Figure 5-14). This demonstrated that fouling during microfiltration of raw Foss Reservoir water followed intermediate blocking as the dominant fouling mechanism. Such behavior has been previously reported, but with transition to cake filtration. However, in this case, intermediate blocking was observed throughout the entire cycle—suggesting the absence of a thick foulant layer covering the entire membrane surface (Bagga et al. 2008 and Chellam and Sari 2016). This was attributed to (i) the larger membrane surface area employed herein (17 cm2 compared to only 4 cm2 in previous work) (Bagga et al. 2008 and Chellam and Sari 2016) and (ii) significantly lower turbidity of the Foss Reservoir water (only 2 NTU) (Sari, M.A. and S. Chellam 2017a) compared to nearly 20 NTU of Lake Houston (Bagga et al. 2008 and Chellam and Sari 2016).
These expectations from modeling were verified by taking electron micrographs of membrane surfaces after three cycles of filtration. As depicted in the right panel of Figure 5-15, a relatively homogeneous cake layer of Al(OH)3 flocs were observed on the membrane surface after filtering electrocoagulated water. In contrast, a fairly heterogeneous layer comprising of siliceous diatoms and other colloids is observed on the membrane surface (middle panel of Figure 5-15) after filtering raw Foss Reservoir water. Portions of the uncovered membrane surface are visible in case of raw water microfiltration validating that cake filtration had not yet been established. Direct visualization of membrane surfaces appears to confirm blocking law modeling results.
3.15 3.20 3.25 3.30 3.35 3.40 3.45 3.503.4
3.6
3.8
4.0
4.2
4.4 Cycle 3Electrocoagulated water
n = 0, Cake filtration
Log
(d2 t/d
V2 , s/m
6 )
Log (dt/dV, s/m3)
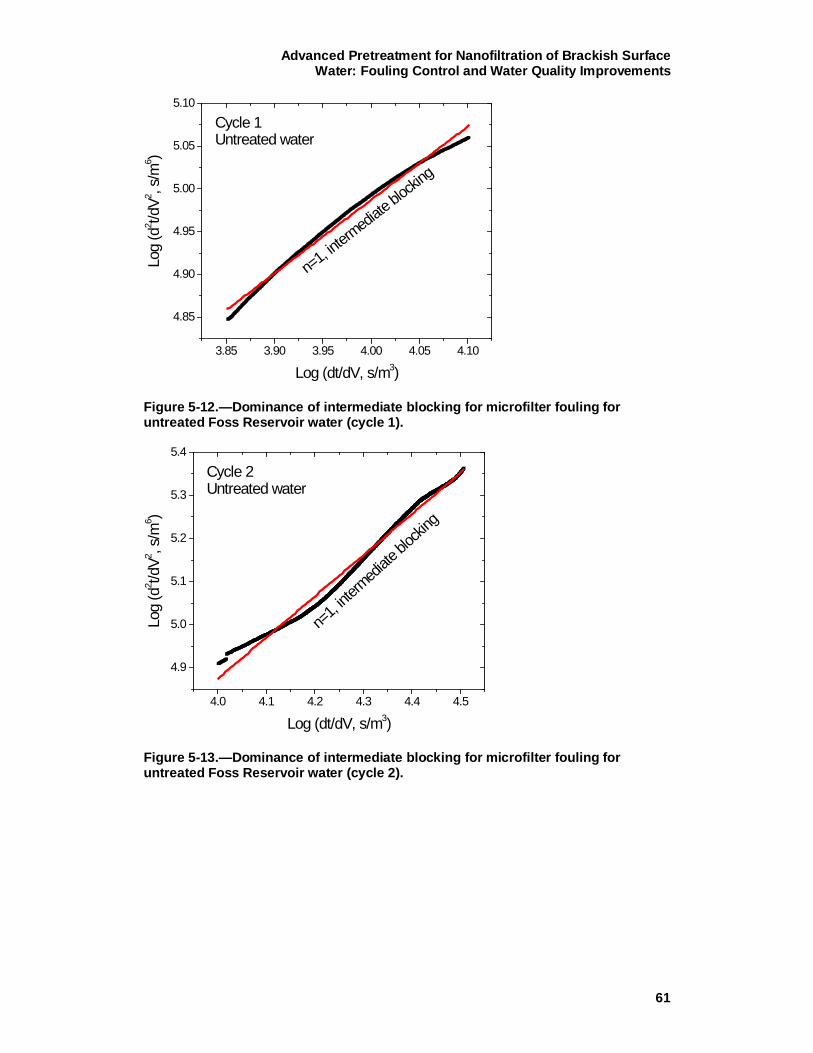
Advanced Pretreatment for Nanofiltration of Brackish Surface Water: Fouling Control and Water Quality Improvements
61
Figure 5-12.—Dominance of intermediate blocking for microfilter fouling for untreated Foss Reservoir water (cycle 1).
Figure 5-13.—Dominance of intermediate blocking for microfilter fouling for untreated Foss Reservoir water (cycle 2).
3.85 3.90 3.95 4.00 4.05 4.10
4.85
4.90
4.95
5.00
5.05
5.10
Cycle 1Untreated water
Log
(d2 t/d
V2 , s/m
6 )
Log (dt/dV, s/m3)
n=1, in
termedi
ate blo
cking
4.0 4.1 4.2 4.3 4.4 4.5
4.9
5.0
5.1
5.2
5.3
5.4
n=1, in
termedi
ate blo
cking
Cycle 2Untreated water
Log
(d2 t/d
V2 , s/m
6 )
Log (dt/dV, s/m3)
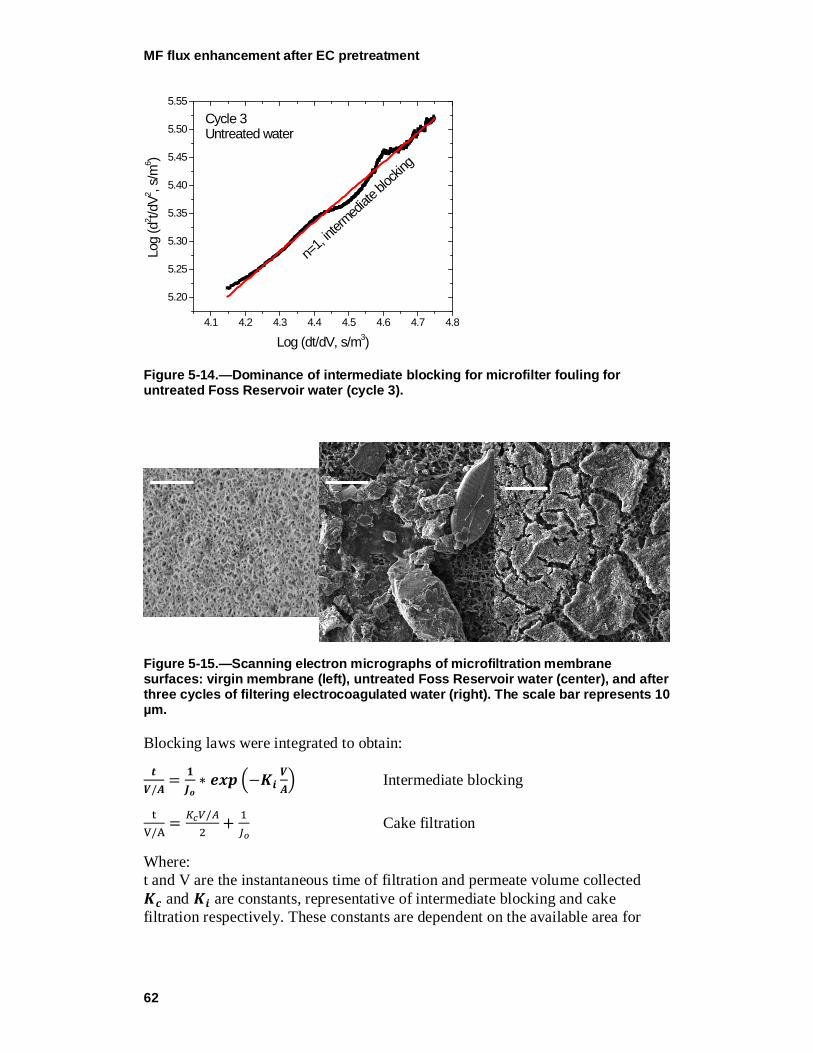
MF flux enhancement after EC pretreatment
62
Figure 5-14.—Dominance of intermediate blocking for microfilter fouling for untreated Foss Reservoir water (cycle 3).
Figure 5-15.—Scanning electron micrographs of microfiltration membrane surfaces: virgin membrane (left), untreated Foss Reservoir water (center), and after three cycles of filtering electrocoagulated water (right). The scale bar represents 10 µm.
Blocking laws were integrated to obtain:
𝒕𝒕𝑽𝑽/𝑨𝑨
= 𝟏𝟏𝑱𝑱𝒐𝒐∗ 𝒆𝒆𝒆𝒆𝒆𝒆 �−𝑲𝑲𝒊𝒊
𝑽𝑽𝑨𝑨� Intermediate blocking
tV/A
= 𝐾𝐾𝑐𝑐𝑉𝑉/𝐴𝐴2
+ 1𝐽𝐽𝑜𝑜
Cake filtration
Where: t and V are the instantaneous time of filtration and permeate volume collected 𝑲𝑲𝒄𝒄 and 𝑲𝑲𝒊𝒊 are constants, representative of intermediate blocking and cake filtration respectively. These constants are dependent on the available area for
4.1 4.2 4.3 4.4 4.5 4.6 4.7 4.8
5.20
5.25
5.30
5.35
5.40
5.45
5.50
5.55
n=1, in
termedi
ate blo
cking
Cycle 3Untreated water
Log
(d2 t/d
V2 , s/m
6 )
Log (dt/dV, s/m3)
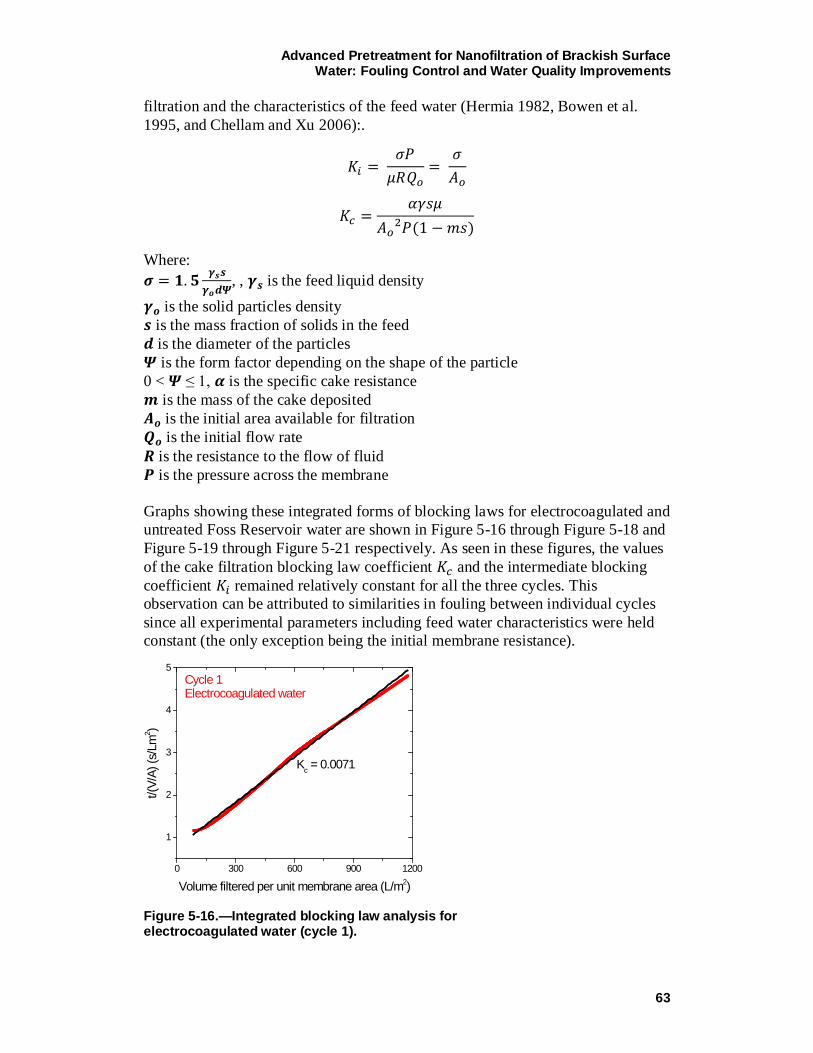
Advanced Pretreatment for Nanofiltration of Brackish Surface Water: Fouling Control and Water Quality Improvements
63
filtration and the characteristics of the feed water (Hermia 1982, Bowen et al. 1995, and Chellam and Xu 2006):.
𝐾𝐾𝑖𝑖 = 𝜎𝜎𝜎𝜎𝜇𝜇𝜇𝜇𝑄𝑄𝑜𝑜
= 𝜎𝜎𝐴𝐴𝑜𝑜
𝐾𝐾𝑐𝑐 =𝛼𝛼𝛼𝛼𝛼𝛼𝜇𝜇
𝐴𝐴𝑜𝑜2𝜎𝜎(1 −𝑚𝑚𝛼𝛼)
Where: 𝝈𝝈 = 𝟏𝟏. 𝟓𝟓 𝜸𝜸𝒔𝒔𝒔𝒔
𝜸𝜸𝒐𝒐𝒅𝒅𝒅𝒅, , 𝜸𝜸𝒔𝒔 is the feed liquid density
𝜸𝜸𝒐𝒐 is the solid particles density 𝒔𝒔 is the mass fraction of solids in the feed 𝒅𝒅 is the diameter of the particles 𝒅𝒅 is the form factor depending on the shape of the particle 0 < 𝒅𝒅 ≤ 1, 𝜶𝜶 is the specific cake resistance 𝒎𝒎 is the mass of the cake deposited 𝑨𝑨𝒐𝒐 is the initial area available for filtration 𝑸𝑸𝒐𝒐 is the initial flow rate 𝑹𝑹 is the resistance to the flow of fluid 𝑷𝑷 is the pressure across the membrane Graphs showing these integrated forms of blocking laws for electrocoagulated and untreated Foss Reservoir water are shown in Figure 5-16 through Figure 5-18 and Figure 5-19 through Figure 5-21 respectively. As seen in these figures, the values of the cake filtration blocking law coefficient 𝐾𝐾𝑐𝑐 and the intermediate blocking coefficient 𝐾𝐾𝑖𝑖 remained relatively constant for all the three cycles. This observation can be attributed to similarities in fouling between individual cycles since all experimental parameters including feed water characteristics were held constant (the only exception being the initial membrane resistance).
Figure 5-16.—Integrated blocking law analysis for electrocoagulated water (cycle 1).
0 300 600 900 1200
1
2
3
4
5Cycle 1Electrocoagulated water
t/(V/
A) (s
/Lm
2 )
Volume filtered per unit membrane area (L/m2)
Kc = 0.0071
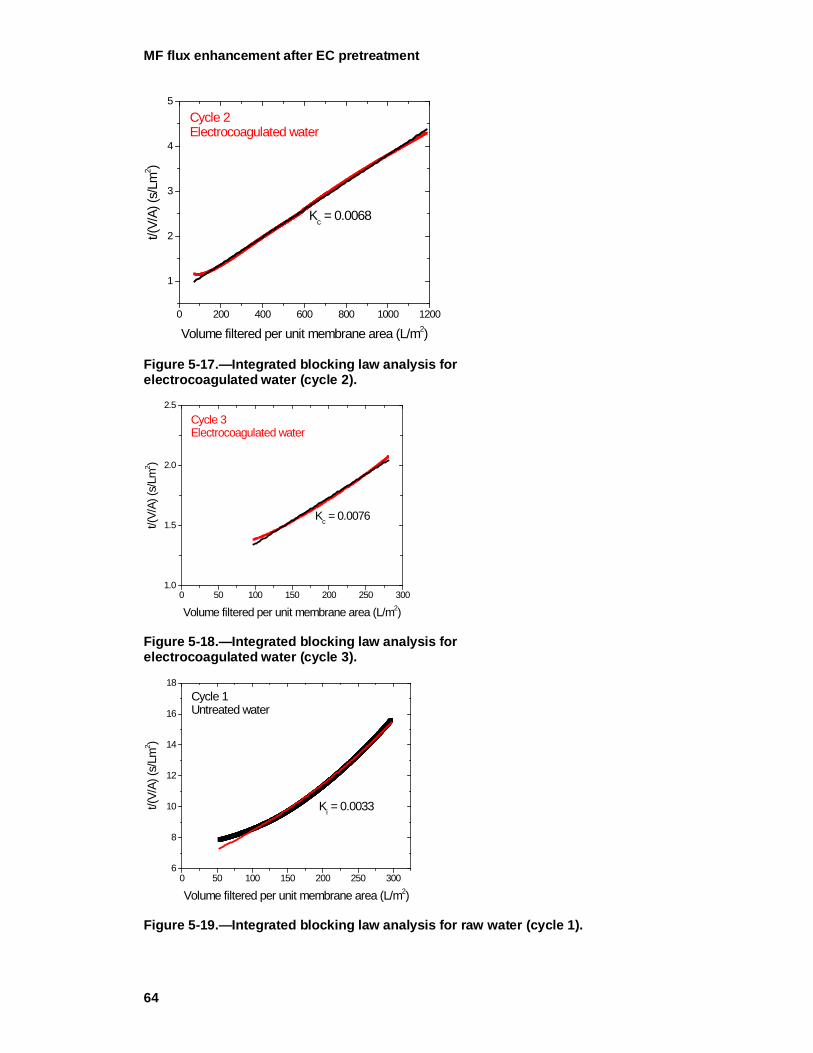
MF flux enhancement after EC pretreatment
64
Figure 5-17.—Integrated blocking law analysis for electrocoagulated water (cycle 2).
Figure 5-18.—Integrated blocking law analysis for electrocoagulated water (cycle 3).
Figure 5-19.—Integrated blocking law analysis for raw water (cycle 1).
0 200 400 600 800 1000 1200
1
2
3
4
5
Volume filtered per unit membrane area (L/m2)
t/(V/
A) (s
/Lm
2 )
Cycle 2Electrocoagulated water
Kc = 0.0068
0 50 100 150 200 250 3001.0
1.5
2.0
2.5
Volume filtered per unit membrane area (L/m2)
Cycle 3Electrocoagulated water
t/(V/
A) (s
/Lm
2 )
Kc = 0.0076
0 50 100 150 200 250 3006
8
10
12
14
16
18Cycle 1Untreated water
Ki = 0.0033
t/(V/
A) (s
/Lm
2 )
Volume filtered per unit membrane area (L/m2)
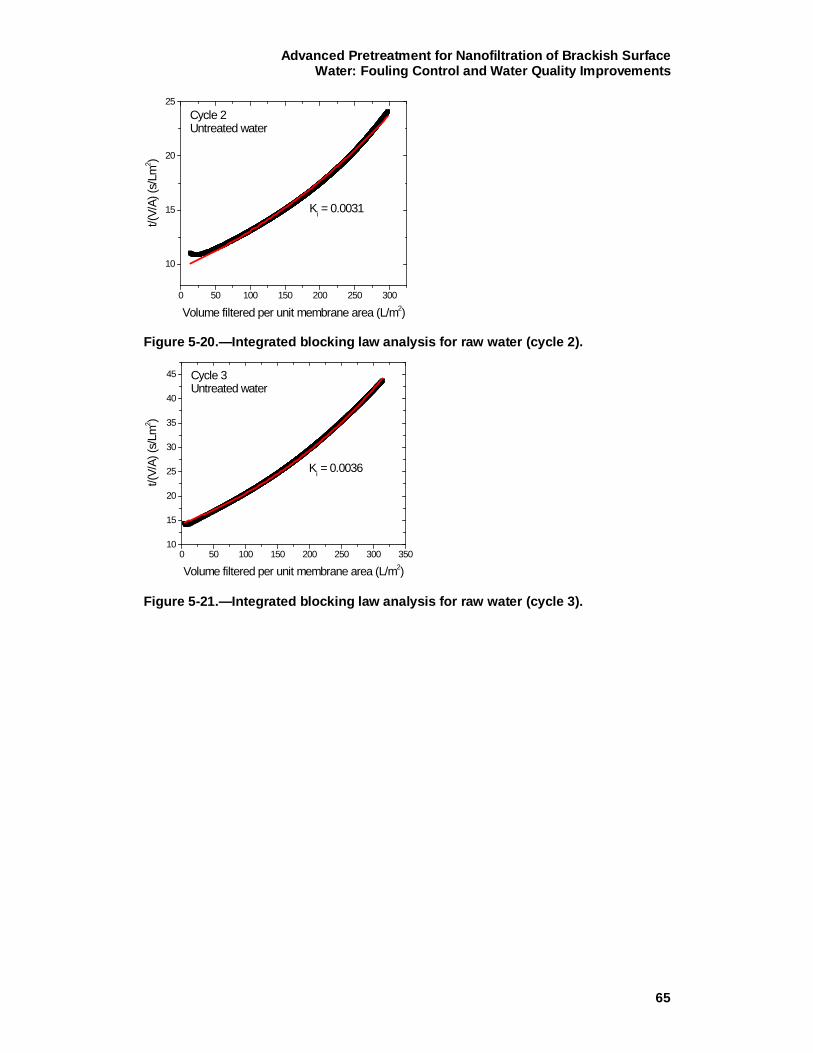
Advanced Pretreatment for Nanofiltration of Brackish Surface Water: Fouling Control and Water Quality Improvements
65
Figure 5-20.—Integrated blocking law analysis for raw water (cycle 2).
Figure 5-21.—Integrated blocking law analysis for raw water (cycle 3).
0 50 100 150 200 250 300
10
15
20
25Cycle 2Untreated water
Ki = 0.0031
t/(V/
A) (s
/Lm
2 )
Volume filtered per unit membrane area (L/m2)
0 50 100 150 200 250 300 35010
15
20
25
30
35
40
45 Cycle 3Untreated water
t/(V/
A) (s
/Lm
2 )
Volume filtered per unit membrane area (L/m2)
Ki = 0.0036

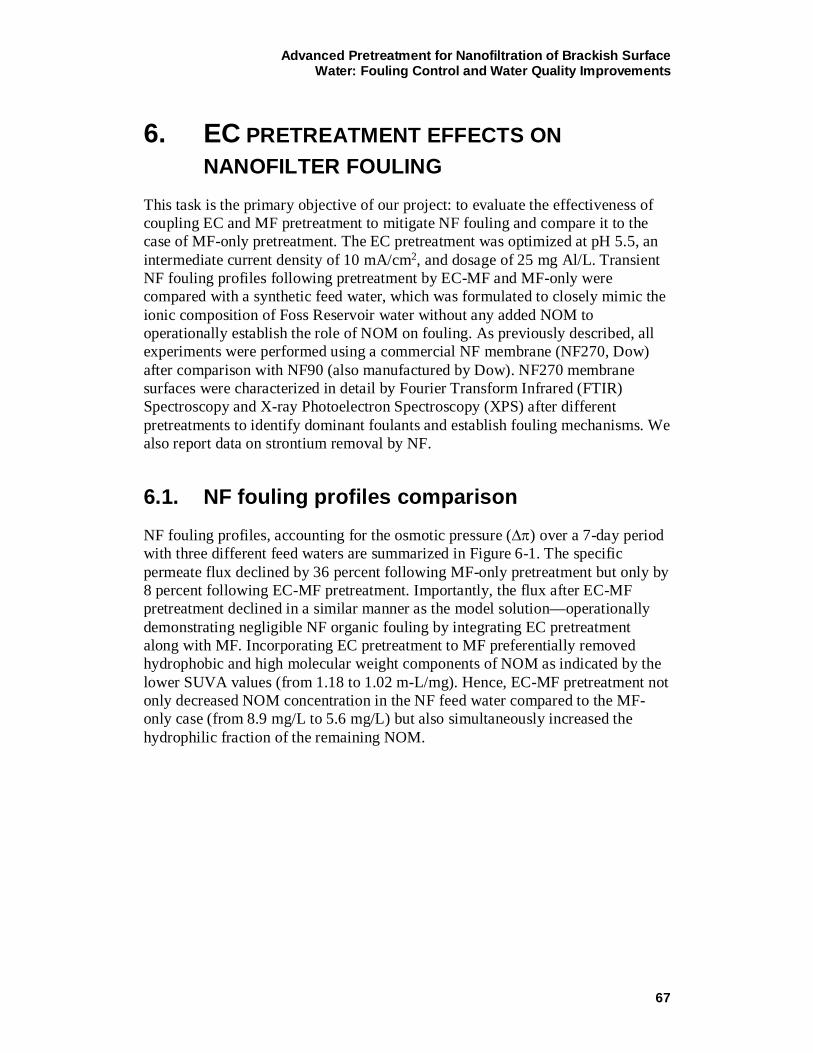
Advanced Pretreatment for Nanofiltration of Brackish Surface Water: Fouling Control and Water Quality Improvements
67
6. EC PRETREATMENT EFFECTS ON NANOFILTER FOULING
This task is the primary objective of our project: to evaluate the effectiveness of coupling EC and MF pretreatment to mitigate NF fouling and compare it to the case of MF-only pretreatment. The EC pretreatment was optimized at pH 5.5, an intermediate current density of 10 mA/cm2, and dosage of 25 mg Al/L. Transient NF fouling profiles following pretreatment by EC-MF and MF-only were compared with a synthetic feed water, which was formulated to closely mimic the ionic composition of Foss Reservoir water without any added NOM to operationally establish the role of NOM on fouling. As previously described, all experiments were performed using a commercial NF membrane (NF270, Dow) after comparison with NF90 (also manufactured by Dow). NF270 membrane surfaces were characterized in detail by Fourier Transform Infrared (FTIR) Spectroscopy and X-ray Photoelectron Spectroscopy (XPS) after different pretreatments to identify dominant foulants and establish fouling mechanisms. We also report data on strontium removal by NF.
6.1. NF fouling profiles comparison NF fouling profiles, accounting for the osmotic pressure (∆π) over a 7-day period with three different feed waters are summarized in Figure 6-1. The specific permeate flux declined by 36 percent following MF-only pretreatment but only by 8 percent following EC-MF pretreatment. Importantly, the flux after EC-MF pretreatment declined in a similar manner as the model solution—operationally demonstrating negligible NF organic fouling by integrating EC pretreatment along with MF. Incorporating EC pretreatment to MF preferentially removed hydrophobic and high molecular weight components of NOM as indicated by the lower SUVA values (from 1.18 to 1.02 m-L/mg). Hence, EC-MF pretreatment not only decreased NOM concentration in the NF feed water compared to the MF-only case (from 8.9 mg/L to 5.6 mg/L) but also simultaneously increased the hydrophilic fraction of the remaining NOM.
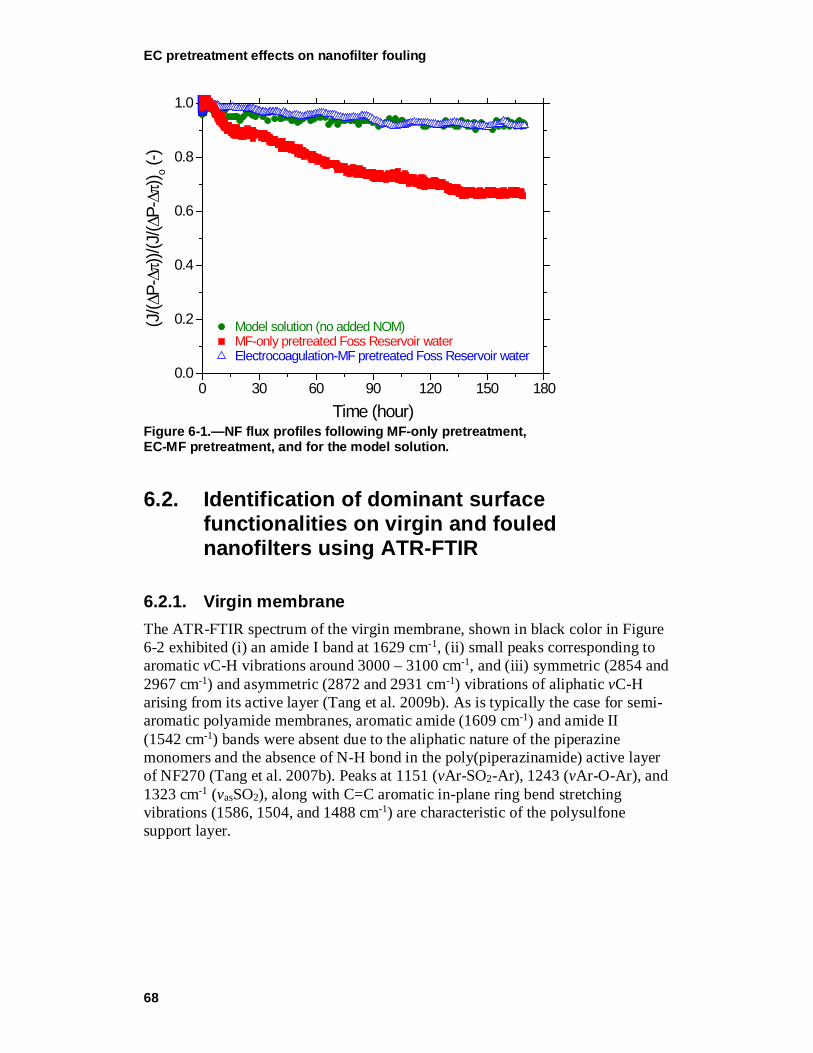
EC pretreatment effects on nanofilter fouling
68
Figure 6-1.—NF flux profiles following MF-only pretreatment, EC-MF pretreatment, and for the model solution.
6.2. Identification of dominant surface functionalities on virgin and fouled nanofilters using ATR-FTIR
6.2.1. Virgin membrane The ATR-FTIR spectrum of the virgin membrane, shown in black color in Figure 6-2 exhibited (i) an amide I band at 1629 cm-1, (ii) small peaks corresponding to aromatic vC-H vibrations around 3000 – 3100 cm-1, and (iii) symmetric (2854 and 2967 cm-1) and asymmetric (2872 and 2931 cm-1) vibrations of aliphatic vC-H arising from its active layer (Tang et al. 2009b). As is typically the case for semi-aromatic polyamide membranes, aromatic amide (1609 cm-1) and amide II (1542 cm-1) bands were absent due to the aliphatic nature of the piperazine monomers and the absence of N-H bond in the poly(piperazinamide) active layer of NF270 (Tang et al. 2007b). Peaks at 1151 (vAr-SO2-Ar), 1243 (vAr-O-Ar), and 1323 cm-1 (vasSO2), along with C=C aromatic in-plane ring bend stretching vibrations (1586, 1504, and 1488 cm-1) are characteristic of the polysulfone support layer.
0 30 60 90 120 150 1800.0
0.2
0.4
0.6
0.8
1.0
Model solution (no added NOM)MF-only pretreated Foss Reservoir waterElectrocoagulation-MF pretreated Foss Reservoir water
(J/(∆
P-∆π
))/(J
/(∆P-∆π
)) o (-)
Time (hour)
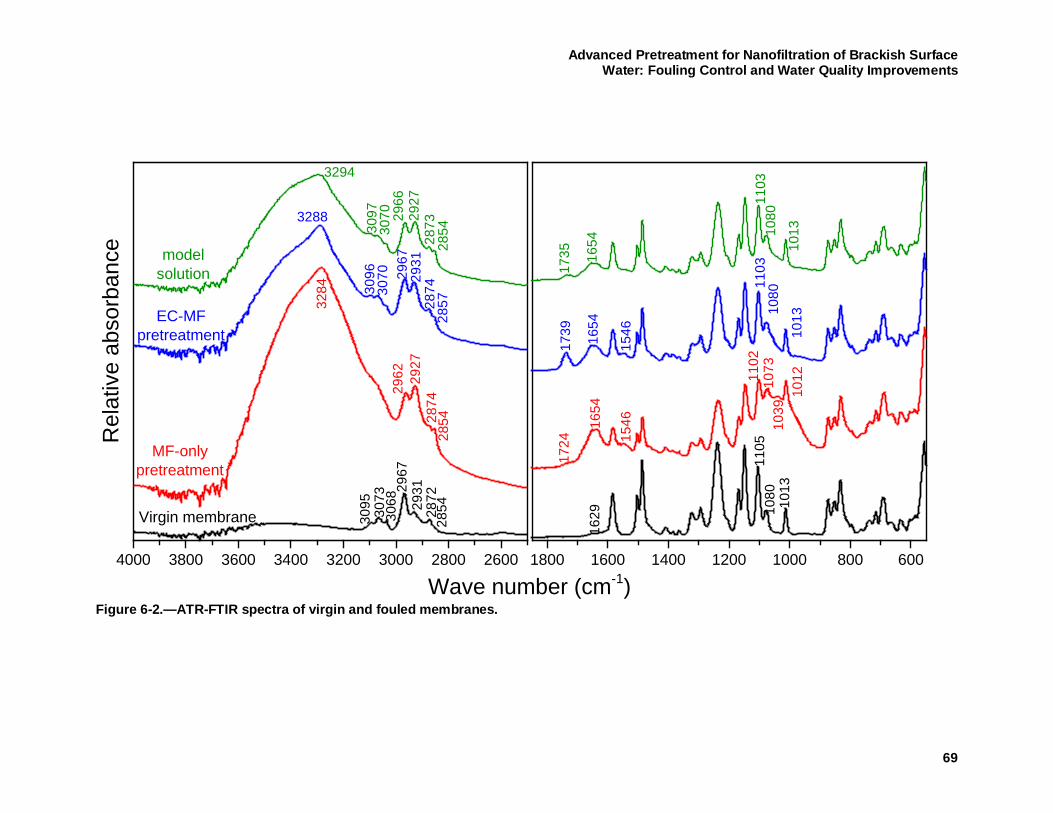
Advanced Pretreatment for Nanofiltration of Brackish Surface Water: Fouling Control and Water Quality Improvements
69
Figure 6-2.—ATR-FTIR spectra of virgin and fouled membranes.
4000 3800 3600 3400 3200 3000 2800 2600 1800 1600 1400 1200 1000 800 600
2854
3294
2966
287329
27
2854
Rel
ativ
e ab
sorb
ance
Wave number (cm-1)
modelsolution
EC-MFpretreatment
MF-onlypretreatment
Virgin membrane 3068
3073
3095
3097
3070
3096
3070
101310
8011
03
1654
1735
285728
7429
3129
67
3288
2874
2854
2927
2962
3284
2931
2872
2967
1629
1013
1105
1080
101211
0210
73
101310
8011
0310
39
154616
54
1739
15461654
1724
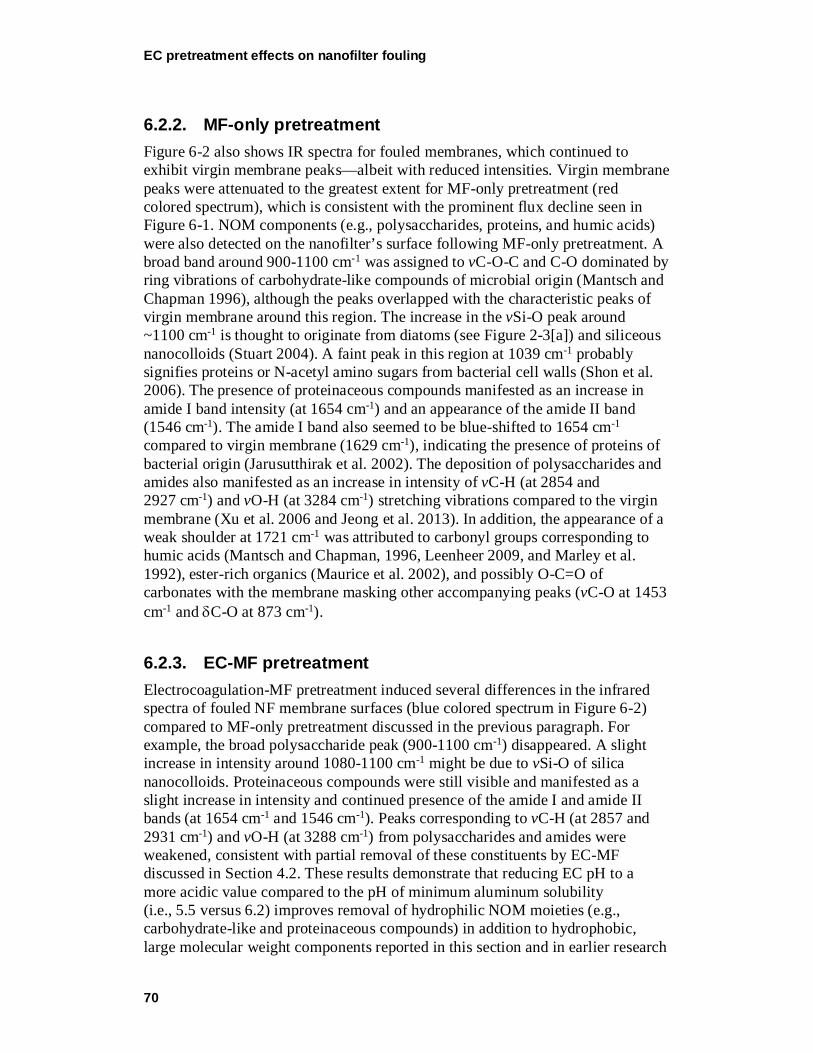
EC pretreatment effects on nanofilter fouling
70
6.2.2. MF-only pretreatment Figure 6-2 also shows IR spectra for fouled membranes, which continued to exhibit virgin membrane peaks—albeit with reduced intensities. Virgin membrane peaks were attenuated to the greatest extent for MF-only pretreatment (red colored spectrum), which is consistent with the prominent flux decline seen in Figure 6-1. NOM components (e.g., polysaccharides, proteins, and humic acids) were also detected on the nanofilter’s surface following MF-only pretreatment. A broad band around 900-1100 cm-1 was assigned to vC-O-C and C-O dominated by ring vibrations of carbohydrate-like compounds of microbial origin (Mantsch and Chapman 1996), although the peaks overlapped with the characteristic peaks of virgin membrane around this region. The increase in the vSi-O peak around ~1100 cm-1 is thought to originate from diatoms (see Figure 2-3[a]) and siliceous nanocolloids (Stuart 2004). A faint peak in this region at 1039 cm-1 probably signifies proteins or N-acetyl amino sugars from bacterial cell walls (Shon et al. 2006). The presence of proteinaceous compounds manifested as an increase in amide I band intensity (at 1654 cm-1) and an appearance of the amide II band (1546 cm-1). The amide I band also seemed to be blue-shifted to 1654 cm-1 compared to virgin membrane (1629 cm-1), indicating the presence of proteins of bacterial origin (Jarusutthirak et al. 2002). The deposition of polysaccharides and amides also manifested as an increase in intensity of vC-H (at 2854 and 2927 cm-1) and vO-H (at 3284 cm-1) stretching vibrations compared to the virgin membrane (Xu et al. 2006 and Jeong et al. 2013). In addition, the appearance of a weak shoulder at 1721 cm-1 was attributed to carbonyl groups corresponding to humic acids (Mantsch and Chapman, 1996, Leenheer 2009, and Marley et al. 1992), ester-rich organics (Maurice et al. 2002), and possibly O-C=O of carbonates with the membrane masking other accompanying peaks (vC-O at 1453 cm-1 and δC-O at 873 cm-1).
6.2.3. EC-MF pretreatment Electrocoagulation-MF pretreatment induced several differences in the infrared spectra of fouled NF membrane surfaces (blue colored spectrum in Figure 6-2) compared to MF-only pretreatment discussed in the previous paragraph. For example, the broad polysaccharide peak (900-1100 cm-1) disappeared. A slight increase in intensity around 1080-1100 cm-1 might be due to vSi-O of silica nanocolloids. Proteinaceous compounds were still visible and manifested as a slight increase in intensity and continued presence of the amide I and amide II bands (at 1654 cm-1 and 1546 cm-1). Peaks corresponding to vC-H (at 2857 and 2931 cm-1) and vO-H (at 3288 cm-1) from polysaccharides and amides were weakened, consistent with partial removal of these constituents by EC-MF discussed in Section 4.2. These results demonstrate that reducing EC pH to a more acidic value compared to the pH of minimum aluminum solubility (i.e., 5.5 versus 6.2) improves removal of hydrophilic NOM moieties (e.g., carbohydrate-like and proteinaceous compounds) in addition to hydrophobic, large molecular weight components reported in this section and in earlier research
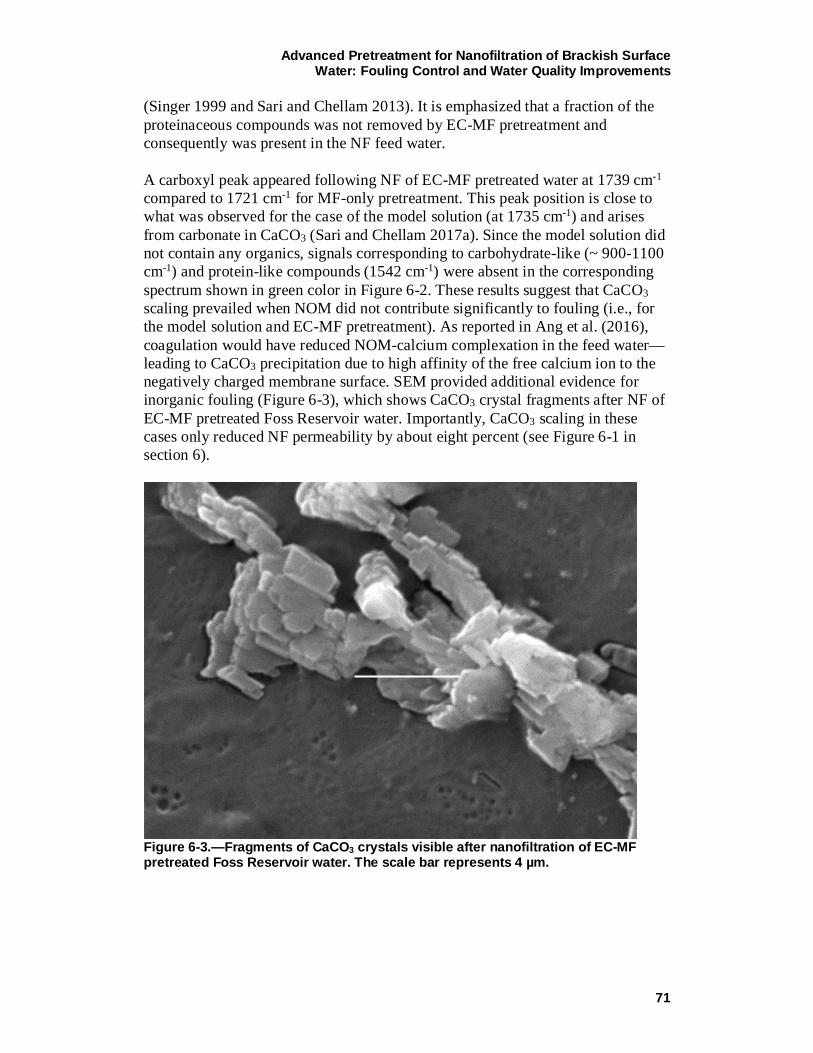
Advanced Pretreatment for Nanofiltration of Brackish Surface Water: Fouling Control and Water Quality Improvements
71
(Singer 1999 and Sari and Chellam 2013). It is emphasized that a fraction of the proteinaceous compounds was not removed by EC-MF pretreatment and consequently was present in the NF feed water. A carboxyl peak appeared following NF of EC-MF pretreated water at 1739 cm-1 compared to 1721 cm-1 for MF-only pretreatment. This peak position is close to what was observed for the case of the model solution (at 1735 cm-1) and arises from carbonate in CaCO3 (Sari and Chellam 2017a). Since the model solution did not contain any organics, signals corresponding to carbohydrate-like (~ 900-1100 cm-1) and protein-like compounds (1542 cm-1) were absent in the corresponding spectrum shown in green color in Figure 6-2. These results suggest that CaCO3 scaling prevailed when NOM did not contribute significantly to fouling (i.e., for the model solution and EC-MF pretreatment). As reported in Ang et al. (2016), coagulation would have reduced NOM-calcium complexation in the feed water—leading to CaCO3 precipitation due to high affinity of the free calcium ion to the negatively charged membrane surface. SEM provided additional evidence for inorganic fouling (Figure 6-3), which shows CaCO3 crystal fragments after NF of EC-MF pretreated Foss Reservoir water. Importantly, CaCO3 scaling in these cases only reduced NF permeability by about eight percent (see Figure 6-1 in section 6).
Figure 6-3.—Fragments of CaCO3 crystals visible after nanofiltration of EC-MF pretreated Foss Reservoir water. The scale bar represents 4 µm.
EC pretreatment effects on nanofilter fouling
72
6.3. Evidence of NOM fouling by XPS XPS was performed to validate infrared findings of dominant foulants. Major elements on the surface of the virgin and fouled membranes and their relative atomic concentrations were first identified by XPS wide scans. As summarized in Table 6-1, the relative concentrations of carbon in fouled NF270 membranes were only slightly lower than the virgin membrane. Table 6-1.—Average elemental composition of virgin and fouled NF membrane surfaces from XPS survey scans.
C1s N1s O1s Si2p S2p Ca2p Virgin membrane 69.2 11.9 18.5 0.0 0.4 0.0 MF-only 65.7 5.1 27.0 1.6 0.0 0.6 Electrocoagulation-MF 67.3 5.0 26.9 0.3 0.0 0.5 Model solution 67.1 5.6 26.4 0 0 0.9
Hence, fouling was not as catastrophic as reported for a “tighter” NF membrane operating on the same source water (see Section 3 for a description of the NF90 membrane). The relative oxygen content in the foulant layer increased after nanofiltration for all three feed waters (reaching approximately the same level of 27 percent). This suggests the presence of oxygen-containing foulants, including NOM, Si-O, and carbonates for MF-only and EC-MF pretreatments. Since the model solution did not contain colloids and organics, the oxygen increase in its case was solely attributed to the presence of carbonates. Calcium was consistently detected on all fouled membranes confirming its role in flux decline. Silicon was detected on surfaces of both membranes filtering natural water demonstrating that nanocolloidal silicon penetrates coagulation and membrane pretreatments (Chon et al. 2012). Importantly, silicon was better removed by EC-MF as evidenced by its lower atomic percentage (0.3 percent) compared to MF-only pretreatment (1.6 percent). Importantly, aluminum wasn’t detected either in the EC-MF pretreated water by ICP-MS (< 0.61 µg/L) or on the NF surface by XPS demonstrating no coagulant carryover to NF system (Sari and Chellam 2016 and Gabelich et al. 2002). More evidence for NOM and CaCO3 deposition via narrow scan XPS is shown next. C1s and O1s component peaks from high resolution XPS of surfaces of virgin and fouled NF membranes were also deconvoluted using our recently published procedure (Sari and Chellam 2017a) and are shown in Figure 6-4.
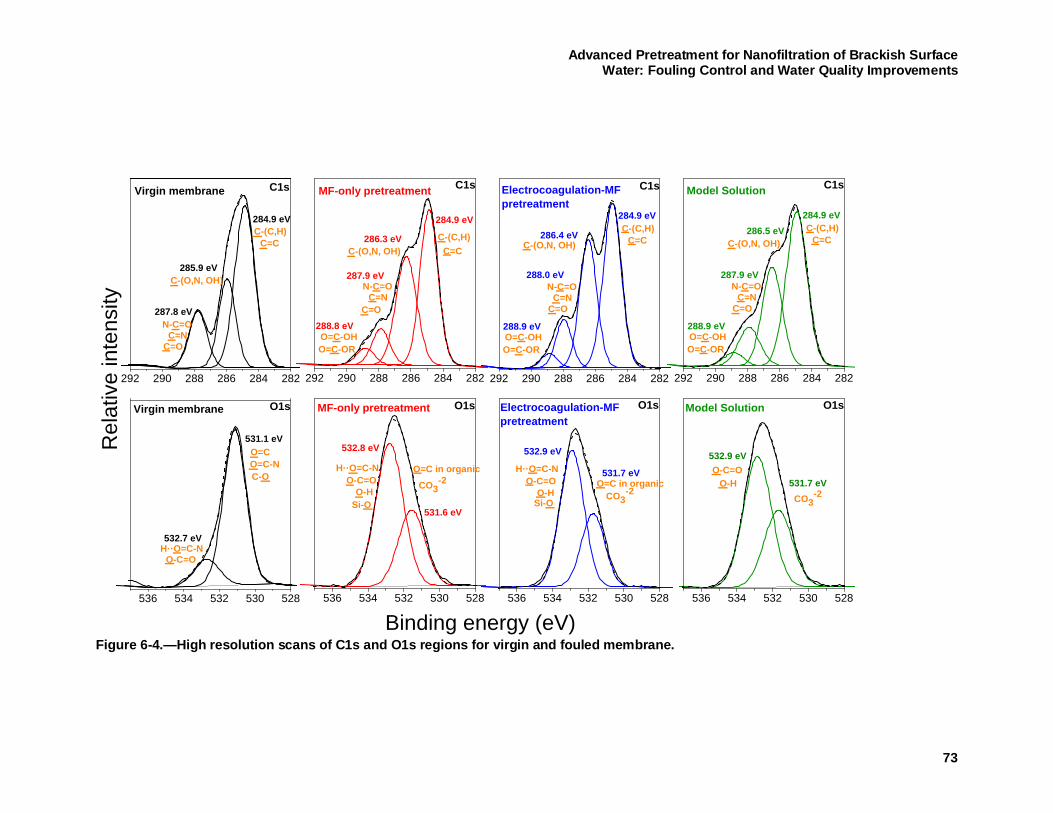
Advanced Pretreatment for Nanofiltration of Brackish Surface Water: Fouling Control and Water Quality Improvements
73
Figure 6-4.—High resolution scans of C1s and O1s regions for virgin and fouled membrane.
292 290 288 286 284 282
536 534 532 530 528
292 290 288 286 284 282
536 534 532 530 528
292 290 288 286 284 282
536 534 532 530 528
292 290 288 286 284 282
536 534 532 530 528
Virgin membrane
C=NN-C=O
C=O
C-(O,N, OH)
C=CC-(C,H)
287.8 eV
285.9 eV
C1s
284.9 eV
Rel
ativ
e in
tens
ity
H··O=C-NO-C=O
C-OO=C-NO=C
O1s
531.1 eV
532.7 eV
Virgin membrane Model SolutionMF-only pretreatment Electrocoagulation-MFpretreatment
288.8 eV
MF-only pretreatment C1s
284.9 eV
286.3 eV
287.9 eV
C=O
O=C-OHO=C-OR
N-C=OC=N
C-(O,N, OH)C-(C,H)
C=C
Si-OO-H CO3
-2
O1s
O=C in organic
531.6 eV
532.8 eV
H··O=C-NO-C=O
C-(O,N, OH)
288.9 eV
Model Solution C1s
284.9 eV286.5 eV
287.9 eVN-C=O
C=NC=O
C-(C,H)C=C
O=C-OHO=C-OR
O-H
O1s
CO3-2
531.7 eV
532.9 eVO-C=O
Electrocoagulation-MFpretreatment
C1s
288.9 eV
284.9 eV
286.4 eV
288.0 eV
C=O
N-C=OC=N
C-(O,N, OH)C-(C,H)
C=C
O=C-OHO=C-OR
O=C in organic
Si-OO-H
O1s
531.7 eV
532.9 eV
Binding energy (eV)
H··O=C-NO-C=O
CO3-2
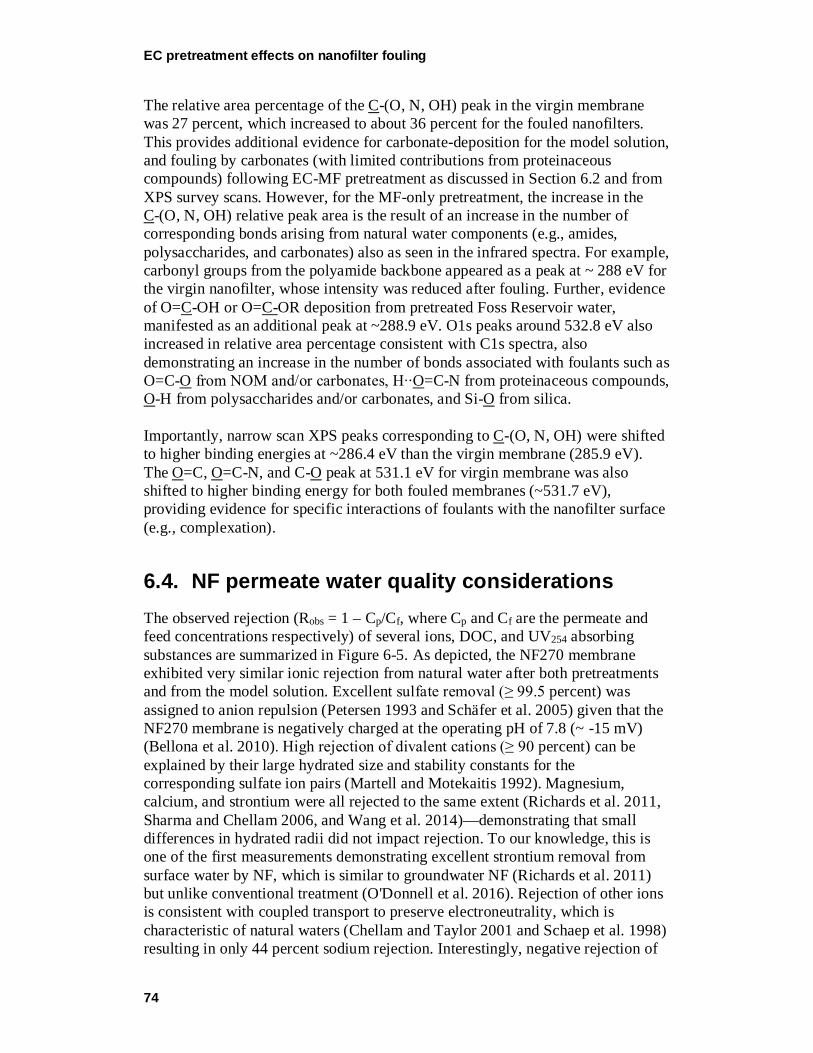
EC pretreatment effects on nanofilter fouling
74
The relative area percentage of the C-(O, N, OH) peak in the virgin membrane was 27 percent, which increased to about 36 percent for the fouled nanofilters. This provides additional evidence for carbonate-deposition for the model solution, and fouling by carbonates (with limited contributions from proteinaceous compounds) following EC-MF pretreatment as discussed in Section 6.2 and from XPS survey scans. However, for the MF-only pretreatment, the increase in the C-(O, N, OH) relative peak area is the result of an increase in the number of corresponding bonds arising from natural water components (e.g., amides, polysaccharides, and carbonates) also as seen in the infrared spectra. For example, carbonyl groups from the polyamide backbone appeared as a peak at ~ 288 eV for the virgin nanofilter, whose intensity was reduced after fouling. Further, evidence of O=C-OH or O=C-OR deposition from pretreated Foss Reservoir water, manifested as an additional peak at ~288.9 eV. O1s peaks around 532.8 eV also increased in relative area percentage consistent with C1s spectra, also demonstrating an increase in the number of bonds associated with foulants such as O=C-O from NOM and/or carbonates, H∙∙O=C-N from proteinaceous compounds, O-H from polysaccharides and/or carbonates, and Si-O from silica.
Importantly, narrow scan XPS peaks corresponding to C-(O, N, OH) were shifted to higher binding energies at ~286.4 eV than the virgin membrane (285.9 eV). The O=C, O=C-N, and C-O peak at 531.1 eV for virgin membrane was also shifted to higher binding energy for both fouled membranes (~531.7 eV), providing evidence for specific interactions of foulants with the nanofilter surface (e.g., complexation).
6.4. NF permeate water quality considerations The observed rejection (Robs = 1 – Cp/Cf, where Cp and Cf are the permeate and feed concentrations respectively) of several ions, DOC, and UV254 absorbing substances are summarized in Figure 6-5. As depicted, the NF270 membrane exhibited very similar ionic rejection from natural water after both pretreatments and from the model solution. Excellent sulfate removal (≥ 99.5 percent) was assigned to anion repulsion (Petersen 1993 and Schäfer et al. 2005) given that the NF270 membrane is negatively charged at the operating pH of 7.8 (~ -15 mV) (Bellona et al. 2010). High rejection of divalent cations (≥ 90 percent) can be explained by their large hydrated size and stability constants for the corresponding sulfate ion pairs (Martell and Motekaitis 1992). Magnesium, calcium, and strontium were all rejected to the same extent (Richards et al. 2011, Sharma and Chellam 2006, and Wang et al. 2014)—demonstrating that small differences in hydrated radii did not impact rejection. To our knowledge, this is one of the first measurements demonstrating excellent strontium removal from surface water by NF, which is similar to groundwater NF (Richards et al. 2011) but unlike conventional treatment (O'Donnell et al. 2016). Rejection of other ions is consistent with coupled transport to preserve electroneutrality, which is characteristic of natural waters (Chellam and Taylor 2001 and Schaep et al. 1998) resulting in only 44 percent sodium rejection. Interestingly, negative rejection of
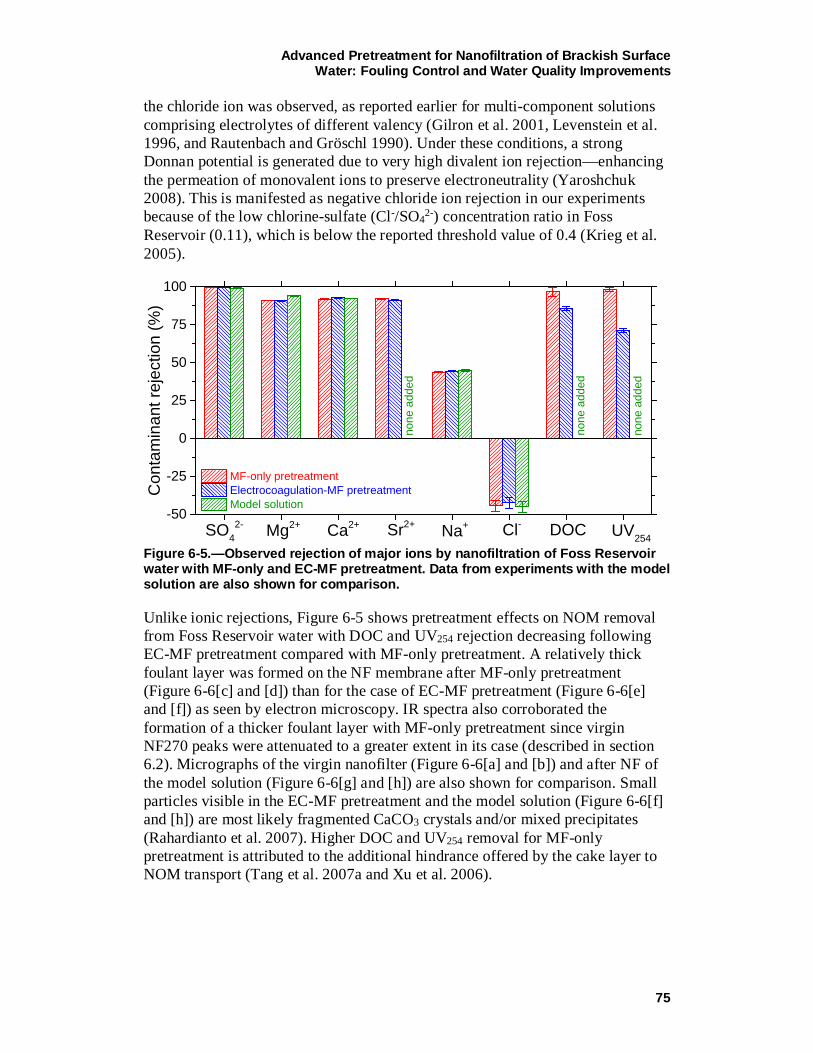
Advanced Pretreatment for Nanofiltration of Brackish Surface Water: Fouling Control and Water Quality Improvements
75
the chloride ion was observed, as reported earlier for multi-component solutions comprising electrolytes of different valency (Gilron et al. 2001, Levenstein et al. 1996, and Rautenbach and Gröschl 1990). Under these conditions, a strong Donnan potential is generated due to very high divalent ion rejection—enhancing the permeation of monovalent ions to preserve electroneutrality (Yaroshchuk 2008). This is manifested as negative chloride ion rejection in our experiments because of the low chlorine-sulfate (Cl-/SO42-) concentration ratio in Foss Reservoir (0.11), which is below the reported threshold value of 0.4 (Krieg et al. 2005).
Figure 6-5.—Observed rejection of major ions by nanofiltration of Foss Reservoir water with MF-only and EC-MF pretreatment. Data from experiments with the model solution are also shown for comparison.
Unlike ionic rejections, Figure 6-5 shows pretreatment effects on NOM removal from Foss Reservoir water with DOC and UV254 rejection decreasing following EC-MF pretreatment compared with MF-only pretreatment. A relatively thick foulant layer was formed on the NF membrane after MF-only pretreatment (Figure 6-6[c] and [d]) than for the case of EC-MF pretreatment (Figure 6-6[e] and [f]) as seen by electron microscopy. IR spectra also corroborated the formation of a thicker foulant layer with MF-only pretreatment since virgin NF270 peaks were attenuated to a greater extent in its case (described in section 6.2). Micrographs of the virgin nanofilter (Figure 6-6[a] and [b]) and after NF of the model solution (Figure 6-6[g] and [h]) are also shown for comparison. Small particles visible in the EC-MF pretreatment and the model solution (Figure 6-6[f] and [h]) are most likely fragmented CaCO3 crystals and/or mixed precipitates (Rahardianto et al. 2007). Higher DOC and UV254 removal for MF-only pretreatment is attributed to the additional hindrance offered by the cake layer to NOM transport (Tang et al. 2007a and Xu et al. 2006).
-50
-25
0
25
50
75
100
none
add
ed
none
add
ed
MF-only pretreatment Electrocoagulation-MF pretreatment Model solution
UV254DOCSO42- Cl-Sr2+Ca2+Mg2+
Con
tam
inan
t rej
ectio
n (%
)
Na+
none
add
ed
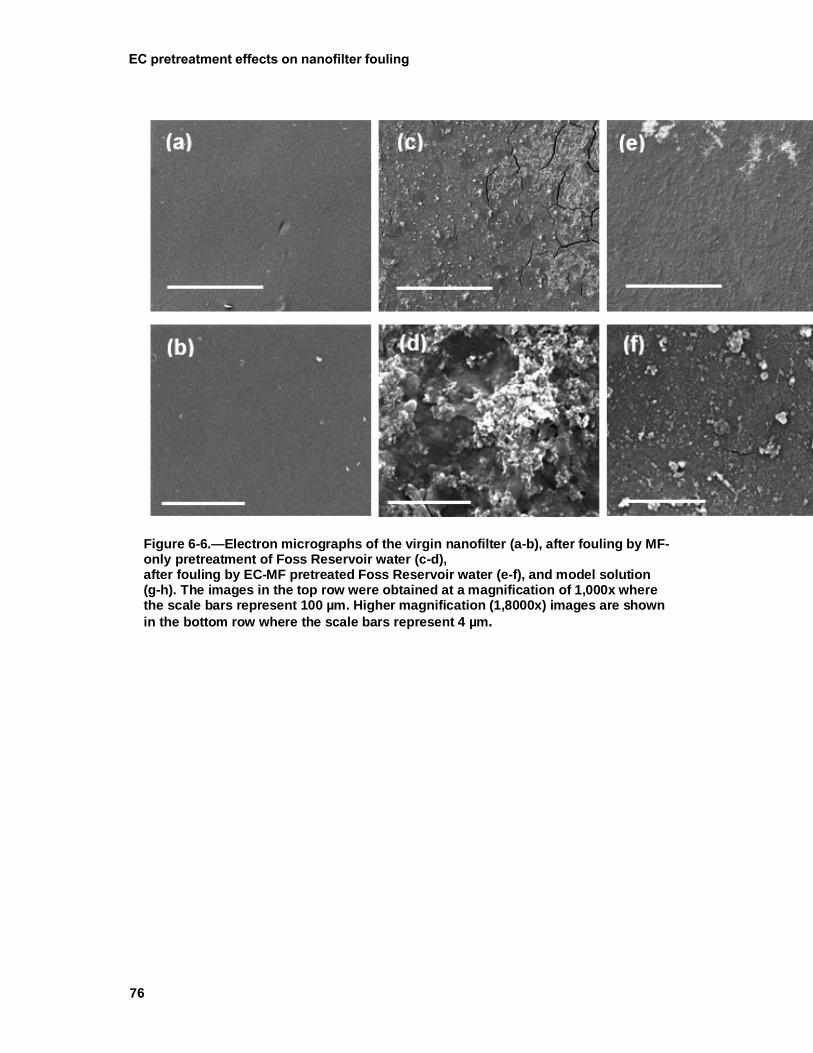
EC pretreatment effects on nanofilter fouling
76
Figure 6-6.—Electron micrographs of the virgin nanofilter (a-b), after fouling by MF-only pretreatment of Foss Reservoir water (c-d), after fouling by EC-MF pretreated Foss Reservoir water (e-f), and model solution (g-h). The images in the top row were obtained at a magnification of 1,000x where the scale bars represent 100 µm. Higher magnification (1,8000x) images are shown in the bottom row where the scale bars represent 4 µm.
78
An additional consideration is that EC preferentially removes hydrophobic and high molecular weight NOM components (Bose and Reckhow 2007 and Singer 1999) along with a smaller amount of carbohydrate-like and protein-like compounds (Gamage and Chellam 2014). For example, as discussed in Section 6.2, humic acids were seen only on the nanofilter surface following MF-only pretreatment, and several peaks corresponding to hydrophilic NOM moieties were more prominent (i.e., these components were well-removed by EC and consequently not found on the nanofilter surface). Hence, EC “fractionated” NOM by not capturing its non-ionic and low molecular weight fractions, whose passage across the NF270 membrane would have been facilitated due to reduced electrosteric interactions, thereby reducing DOC and UV254 rejection (Xu et al 2006)
Advanced Pretreatment for Nanofiltration of Brackish Surface Water: Fouling Control and Water Quality Improvements

Advanced Pretreatment for Nanofiltration of Brackish Surface Water: Fouling Control and Water Quality Improvements
79
7. SUMMARY AND CONCLUSIONS
7.1. NF membrane selection During nanofiltration of pretreated Foss Reservoir water, NOM with limited contributions from CaCO3 predominately fouled a low monovalent ion rejecting membrane (NF270), whereas both NOM and gypsum contributed to fouling a membrane that highly rejected both mono- and divalent ions (NF90). Importantly, gypsum was precipitated around the cell edges and brine exit, corresponding to regions of high recirculation, only for NF90. Hence, mineral scales appear to form in localized supersaturation regions for high salt rejecting nanofilters even when the overall solubility product is not exceeded. The prominent band around 900-1000 cm-1 (vC-O-C and C-O ring vibrations from polysaccharides) and the appearance of amide 1 (1650 cm-1) and amide II (1546 cm-1) bands on both membrane surfaces were evidence that carbohydrate-like and proteinaceous compounds were major foulants during NF of brackish surface water similar to low salinity surface water (Park et al. 2007, Her et al. 2007, Sari and Chellam 2013, and Speth et al. 1998).
The significantly greater flux decline measured for NF90 was attributed to (i) the combined synergistic effects of inorganic and organic foulants (Liu and Mi 2012 and Wang et al. 2016), (ii) formation of a more compact cake layer resulting from a higher degree of NOM-Ca interactions and the high ionic strength at the membrane-feed water interface (Hong and Elimelech 1997), and (iii) an increase in “valley clogging” by organic matter and nanocolloids due to its rough surface (Boussu et al. 2006 and Vrijenhoek 2001). Therefore, the relative dominance of NOM and inorganic scaling during inland brackish water desalination is not only closely related to a nanofilter’s surface characteristics (e.g., roughness, hydrophobicity, and zeta potential) but also dependent on its ability to reject mono- and divalent ions.
Although the NF90 membrane removed salts to a greater extent, it exhibited lower pure water permeability and higher fouling rate for both the model solution and microfiltered Foss Reservoir water. The NF270 membrane allowed a greater passage of conductivity, TDS, chloride, and calcium, but they all were significantly lower than EPA’s secondary maximum contaminant levels. This alone would have reduced concentration polarization suggesting a lesser need for pH adjustment or anti-scalant addition. In other words, because of the very high rejection characteristics of NF90, the NF90 may require more aggressive scaling control than the NF270, possibly leading to operational complexity. Also, a lesser degree of bypass/blending would be possible with NF270 due to its lower ion rejection.
Summary and conclusions
80
Based on the abovementioned results, NF270 membrane appears to have several advantages over the NF90 membrane. These include: (i) higher pure water permeability (i.e., higher flux at lower transmembrane pressure), (ii) lower fouling rate for both the model solution and microfiltered Foss Reservoir water, and (iii) similar rejection of the major divalent anion (sulfate) andNOM present in Foss Reservoir.
7.2. Electrocoagulation pretreatment NOM removal by EC was enhanced by (i) maintaining a slightly acidic pH during electrolysis, compared with that of minimum aluminum solubility (pH of 5.5 compared to 6.4) inducing a greater degree of NOM protonation, (ii) providing sufficient contact time during electrolysis and flocculation by using intermediate current density (10 mA/cm2), and (iii) increasing aluminum dosage to combine charge neutralization and sweep coagulation. Although it is possible to design smaller, low-residence time EC units by employing high current densities for brackish waters, this will correspondingly reduce NOM-gas bubble collision frequency and NOM removal—leading to non-optimal implementation. A highest current density of 10 mA/cm2 is recommended for aluminum EC of Foss Reservoir similar to iron (Dubrawski and Mohseni 2013) to maximize NOM removal while minimizing electrolysis time. The high salt content of the feed water resulted in super-Faradaic aluminum dissolution during EC. This was mainly due to chloride-assisted pitting which was further exacerbated by high sulfate concentration and relatively high current density employed. Experiments using synthetic water also showed that temperature had negligible effects on aluminum dissolution below a threshold temperature (~ 40 °C in our experiments). Therefore, deviations from Faraday’s law between 5 – 37 °C were mostly induced by electrodissolution and chloride-assisted pitting corrosion. Greater deviations from Faraday’s law at 51 °C corresponded to more intense pitting corrosion of the anode surface as revealed by electron microscopy. Simultaneously, the porosity of the anodic passive layer also decreased at higher temperatures. In contrast, temperature did not play a significant role in aluminum dissolution during electrocoagulation of natural water from the Foss Reservoir in the entire temperature range (5 – 51°C). This might be due to a low degree of passivation by NOM, thus decreasing the active surface available for chloride attack. Electron micrographs of the anode following EC with Foss Reservoir water also showed that more localized pits formed on the anode’s surface than with synthetic water. On another note, aluminum precipitates at a faster rate at higher temperature even though total aluminum concentrations were similar at 5 – 51 °C, Therefore, the coagulation pH should be slightly increased from 5.5 at lower temperatures to maximize the formation of Al(OH)3 precipitates. Small amounts of chlorine were also generated during EC (up to 0.03 mg/L free chlorine). Experiments using synthetic water (100 mM NaCl solution) and Foss
Advanced Pretreatment for Nanofiltration of Brackish Surface Water: Fouling Control and Water Quality Improvements
81
Reservoir water showed significant (97 percent) removal/inactivation of E. coli at 30 mg/L Al dosage. Results also showed that low free chlorine concentrations generated during EC was still beneficial in bacterial inactivation. The high removal/inactivation of bacteria can be expected to assist in reducing microbial risk and possibly controlling MF biofouling.
7.3. MF flux enhancement after EC pretreatment Electrocoagulation pretreatment of Foss Reservoir water significantly improved microfilter flux. For the first cycle, the initial flux for the untreated Foss Reservoir water was 500 L/m2.h, which increased to 3150 L/m2.h after electrocoagulation pretreatment at a transmembrane pressure of 20 psig. For the second cycle, the initial flux for the untreated Foss Reservoir water was 360 L/m2.h, which increased to 2,800 L/m2.h after electrocoagulation pretreatment again at 20 psig. For the third cycle, the initial flux for the untreated Foss Reservoir water was 250 L/m2.h, which increased to 2,150 L/m2.h after electrocoagulation pretreatment also at 20 psig. Hence, electrocoagulation pretreatment increased the initial flux by approximately 6, 8, and 9-fold for the first, second, and third cycles, respectively.
Correspondingly, filtration times for the same volume filtered (400 mL) was reduced significantly with electrocoagulation pretreatment. For the first cycle, it took 50 minutes for untreated Foss Reservoir water whereas electrocoagulated Foss Reservoir water required only 6 minutes (at 20 psig). For the second cycle, it took 78 minutes for untreated Foss Reservoir water whereas electrocoagulated Foss Reservoir water required only 7 minutes (at 20 psig). For the third cycle, it took 130 minutes for untreated Foss Reservoir water whereas electrocoagulated Foss Reservoir water required only 7.5 minutes (at 20 psig).
Simple hydraulic rinsing recovered 70 and 50 percent of the flux for untreated Foss Reservoir water after the first and second cycles, respectively. Electrocoagulation pretreatment improved this to 90 and 70 percent, respectively suggesting the possibility of improved backwashing during pilot testing.
The underlying fouling mechanism, as determined by blocking law analysis, was identified as cake filtration for the pretreated Foss Reservoir water whereas for untreated Foss Reservoir water it was intermediate blocking.
7.4. EC pretreatment effects on nanofilter fouling Better NF fouling control by EC-MF pretreatment compared to MF-only pretreatment was due to additional removal of hydrophilic NOM moieties (i.e., polysaccharides and amides) along with hydrophobic NOM and nanocolloids. DOC removal was enhanced by performing EC at a slightly lower pH than that of minimum Al solubility (i.e., 5.5 versus 6.2), which removed a
Summary and conclusions
82
portion of the hydrophilic fraction in addition to the typical hydrophobic and higher molecular weight NOM fractions (Chellam and Sari 2016) similar to enhanced conventional chemical coagulation (Krasner and Amy 1995). Hence, in addition to better controlling nanofilter fouling, this would also reduce disinfection by-product formation since hydrophilic NOM components also serve as trihalomethane and haloacetic acid precursors (Hua and Reckhow 2007). Polysaccharide and protein IR peaks on NF surfaces (~1000 cm-1, 1546 cm-1, and 1654 cm-1) were strongly attenuated following integrated EC-MF pretreatment (compared with MF-only pretreatment)—providing direct evidence for excellent hydrophilic NOM removal by EC. However, NOM removal by EC reduced the NOM-calcium interactions, causing higher affinity of calcium towards negatively charged nanofilter leading to CaCO3 precipitation. This was also observed for the model solution containing no organics. Importantly, this did not significantly reduce flux under conditions of our experiments. Therefore, both operational data and surface spectra demonstrate that higher NF fluxes were obtained following EC-MF pretreatment because it controlled organic fouling. On the other hand, the relative concentration of small, non-ionic NOM moieties preferentially passed through the nanofilter because of the relatively thin cake layer formed by enhanced pretreatment. Finally, NF achieves excellent strontium removal as well as other divalent ions and NOM due to Donnan effects.
Advanced Pretreatment for Nanofiltration of Brackish Surface Water: Fouling Control and Water Quality Improvements
83
8. OVERALL CONCLUSIONS ANDRECOMMENDATIONS
Electrocoagulation can be integrated ahead of MF to effectively control turbidity and microorganisms and simultaneously maintain a high MF specific flux during brackish surface water treatment. Electrolysis efficiently removes hydrophobic NOM, bacteria, and siliceous foulants. Additional contaminant removal may also be possible during MF due to formation thick cake layer of Al(OH)3 flocs that acts like a dynamic membrane. Hence, an integrated EC-MF system can be an attractive option for small-scale decentralized facilities due to its portability and ease of automation.
Organic fouling during brackish surface water NF can be controlled by implementing EC-MF as pretreatment. NOM removal by EC was enhanced by (i) maintaining a slightly acidic pH compared with that of minimum aluminumsolubility, (ii) operating at an intermediate current density of 10 mA/cm2, and(iii) increasing aluminum dosage. This was attributed to the greater degree ofNOM protonation, provision of sufficient contact time during electrolysis andflocculation, and a combination of charge neutralization and sweep coagulation,respectively. It is recommended that the highest current density employed shouldnot exceed 10 mA/cm2 for aluminum EC to maximize NOM control whileminimizing electrolysis time. Similar to non-saline surface water NF (Sari andChellam 2013), EC-MF pretreatment removed both hydrophobic and hydrophilicfraction of NOM in brackish surface water as evidenced by ATR-FTIR, leading toNF flux enhancement. These results suggest that the performance ofelectrochemical coagulation is strongly affected by the source water chemistry;therefore, optimization of the operating conditions is imperative to achieve targetwater quality. In addition, electrocoagulation process must be optimizedseasonally as well as temperature affects the formation of Al(OH)3 precipitates(i.e., coagulant) in the water. We recommend conducting coagulationpretreatment at slightly higher pH in winter than in summer. In any case, processevaluation and optimization is recommended for each season to account fordifferences in temperatures and feed water quality.
In contrast to non-saline surface water NF where mineral scaling is not dominant, careful considerations must be made when implementing NF for treating brackish surface water. Relative importance of organic fouling versus mineral scaling was shown to be strongly membrane-dependent as determined by ion rejection characteristics of individual nanofilters. High salt rejection will lead to high product quality, but at the cost of higher tendency for precipitative and organic membrane fouling. Hence, the optimal membrane selection needs to balance total dissolved solids concentration of the product water with the need to minimize fouling. In other words, low salt rejecting nanofilter may be the appropriate
Overall conclusions and recommendations
84
selection for surface water desalination due to its higher water permeability and lower mineral scaling tendency as long as all water quality requirements are met. Due to these reasons, we selected the low salt rejecting membrane, NF270 to desalinate Foss Reservoir water. This was successful because a divalent anion (sulfate) was dominant. NF experiments were conducted at 70 psi (corresponding flux of 43 L/m2.h) and cross flow velocity of 11 cm/s. The pressure applied was similar to other bench-scale and large scale studies employing NF270 membrane. The Donnan effect arising from the very high rejection of divalent ions substantially decreased monovalent ion removal, even leading to negative observed rejection of chloride during NF using NF270 membrane. Hence, concentrations of individual electrolytes in the NF permeate will differ significantly from that of the feed water, which should be considered while formulating post-treatment corrosion control strategies when the Cl-/SO42- concentration ratio is low (< 0.4). All Group II cations were removed to a very high degree and approximately the same extent—demonstrating that they all behave similarly in natural waters. This suggests that strontium removal by NF can be estimated simply using the more commonly measured values for calcium and magnesium. Additionally, since strontium also complexes with NOM (Ding et al. 2015), it can be expected to exacerbate fouling in an analogous manner to calcium (Hong and Elimelech 1997). Finally, the results presented in this report demonstrate the feasibility of NF to desalinate brackish surface water when sulfate and other divalent ions are dominant contributors of salinity and that advanced pretreatment can significantly control organic and colloidal fouling during such applications. It is emphasized that all our conclusions and recommendations are based on short-term bench-scale experiments. These need to be verified by long-term on-site pilot-scale testing for appropriate scale-up and before full-scale design and implementation.
Advanced Pretreatment for Nanofiltration of Brackish Surface Water: Fouling Control and Water Quality Improvements
85
9. REFERENCESAballe, A. et al., 2001. Localized alkaline corrosion of alloy AA5083 in neutral
3.5% NaCl solution. Corrosion Science, 43(9): p. 1657-1674. Anbalagan, G. et al., 2009. Infrared, optical absorption, and EPR spectroscopic
studies on natural gypsum. Vibrational Spectroscopy, 50(2): p. 226-230. Ang, W.L. et al. 2016. Hybrid coagulation–NF membrane processes for
brackish water treatment: Effect of pH and salt/calcium concentration. Desalination, 390: p. 25-32.
Bagga, A., S. Chellam, and D.A. Clifford, 2008. Evaluation of iron chemical coagulation and electrocoagulation pretreatment for surface water microfiltration. Journal of Membrane Science, 309(1–2): p. 82-93.
Bellona, C., M. Marts, and J.E. Drewes, 2010. The effect of organic membrane fouling on the properties and rejection characteristics of nanofiltration membranes. Separation and Purification Technology, 74(1): p. 44-54.
Bereket, G. and A. Yurt, 2001. The inhibition effect of amino acids and hydroxy carboxylic acids on pitting corrosion of aluminum alloy 7075. Corrosion Science, 43(6): p. 1179-1195.
Böke, H. et al., 2004. Quantification of CaCO3–CaSO3·0.5H2O–CaSO4·2H2O mixtures by FTIR analysis and its ANN model. Materials Letters, 58(5): p. 723-726.
Bose, P. and D.A. Reckhow, 2007. The effect of ozonation on natural organic matter removal by alum coagulation. Water Research, 41(7): p. 1516-1524.
Boussu, K. et al., 2006. Characterization of polymeric nanofiltration membranes for systematic analysis of membrane performance. Journal of Membrane Science, 278(1–2): p. 418-427.
Bowen, W.R., J.I. Calvo, and A. Hernández, 1995. Steps of membrane blocking in flux decline during protein microfiltration. Journal of Membrane Science, 101(1): p. 153-165.
Braghetta, A. and F.A. DiGiano, 1997. Nanofiltration of natural organic matter: pH and ionic strength effects. Journal of Environmental Engineering, 123(7): p. 628.
Cañizares, P. et al., 2005. Electrodissolution of aluminum electrodes in electrocoagulation processes. Industrial and Engineering Chemistry Research, 44(12): p. 4178-4185.
Chakraborti, R.K., J.F. Atkinson, and J.E. Van Benschoten, 2000. Characterization of alum floc by image analysis. Environmental Science and Technology, 34(18): p. 3969-3976.
References
86
Chellam, S. et al., 1997. Effect of pretreatment on surface water nanofiltration. Journal: American Water Works Association, 89(10): p. 77-89.
Chellam, S. and M.A. Sari, 2016. Aluminum electrocoagulation as pretreatment during microfiltration of surface water containing NOM: A review of fouling, NOM, DBP, and virus control. Journal of Hazardous Materials, 304: p. 490-501.
Chellam, S. and J.S. Taylor, 2001. Simplified analysis of contaminant rejection during ground- and surface water nanofiltration under the information collection rule. Water Research, 35(10): p. 2460-2474.
Chellam, S. and W. Xu, 2006. Blocking laws analysis of dead-end constant flux microfiltration of compressible cakes. Journal of Colloid and Interface Science, 301(1): p. 248-257.
Chon, K. et al., 2012. Combined coagulation-disk filtration process as a pretreatment of ultrafiltration and reverse osmosis membrane for wastewater reclamation: An autopsy study of a pilot plant. Water Research, 46(6): p. 1803-1816.
Christie, A.B. et al., 1983. An XPS study of ion-induced compositional changes with group II and group IV compounds. Applications of Surface Science, 15(1–4): p. 224-237.
Ding, S. et al., 2015. Effects of feed solution chemistry on low pressure reverse osmosis filtration of cesium and strontium. Journal of Hazardous Materials, 294: p. 27-34.
Ding, S. et al., 2016. The effects of organic fouling on the removal of radionuclides by reverse osmosis membranes. Water Research, 95: p. 174-184.
Dixon, M.B. et al., 2011.Removal of cyanobacterial metabolites by nanofiltration from two treated waters. Journal of Hazardous Materials, 188(1-3): p. 288-95.
Do, V.T. et al., 2012. Degradation of polyamide nanofiltration and reverse osmosis membranes by hypochlorite. Environmental Science and Technology, 46(2): p. 852-859.
Dow Water and Process Solutions, 2017. http://www.dow.com/en-us/water-and-process-solutions/resources/design-software/rosa-software. (Accessed 04/25/2017).
Dubrawski, K.L. and M. Mohseni, 2013. Standardizing electrocoagulation reactor design: Iron electrodes for NOM removal. Chemosphere, 91(1): p. 55-60.
EPA, 2016. The third unregulated contaminant monitoring rule (UCMR 3): Data summary, July 2016.
Foroulis, Z.A. and M.J. Thubrikar, 1975. On the kinetics of the breakdown of passivity of preanodized aluminum by chloride ions. Journal of the Electrochemical Society, 122(10): p. 1296-1301.
Advanced Pretreatment for Nanofiltration of Brackish Surface Water: Fouling Control and Water Quality Improvements
87
Gabelich, C.J. et al., 2002. Effects of aluminum sulfate and ferric chloride coagulant residuals on polyamide membrane performance. Desalination, 150(1): p. 15-30.
Gamage, N.P., J.D. Rimer, and S. Chellam, 2012. Improvements in permeate flux by aluminum electroflotation pretreatment during microfiltration of surface water. Journal of Membrane Science, 411–412: p. 45-53.
Gamage, N.P. and S. Chellam, 2011. Aluminum electrocoagulation pretreatment reduces fouling during surface water microfiltration. Journal of Membrane Science, 379(1-2): p. 97-105.
Gamage, N.P. and S. Chellam, 2014. Mechanisms of physically irreversible fouling during surface water microfiltration and mitigation by aluminum electroflotation pretreatment. Environmental Science and Technology, 48: p. 1148-1157.
Gao, S. et al., 2010. Electro-coagulation–flotation process for algae removal. Journal of Hazardous Materials, 177(1–3): p. 336-343.
Garcia, S.J. et al., 2013. Unravelling the corrosion inhibition mechanisms of bi-functional inhibitors by EIS and SEM–EDS. Corrosion Science, 69: p. 346-358.
Gilron, J., N. Gara, and O. Kedem, 2001. Experimental analysis of negative salt rejection in nanofiltration membranes. Journal of Membrane Science, 185: p. 223-236.
Gorzalski, A.S. and O. Coronell, 2014. Fouling of nanofiltration membranes in full- and bench-scale systems treating groundwater containing silica. Journal of Membrane Science, 468: p. 349-359.
Her, N. et al., 2007. Identification of nanofiltration membrane foulants. Water Research, 41(17): p. 3936-3947.
Hermia, J., 1982. Constant pressure blocking filtration laws: Application to power-law non-newtonian fluids. Transactions of the Institution of Chemical Engineers, V 60(N 3): p. 183-187.
Holt, P.K. et al., 2002. A quantitative comparison between chemical dosing and electrocoagulation. Colloids and Surfaces A: Physicochemical and Engineering Aspects, 211(2–3): p. 233-248.
Hong, S. and M. Elimelech, 1997. Chemical and physical aspects of natural organic matter (NOM) fouling of nanofiltration membranes. Journal of Membrane Science, 132(2): p. 159-181.
Hu, C.Y., S.L. Lo, and W.H. Kuan, 2003. Effects of co-existing anions on fluoride removal in electrocoagulation (EC) process using aluminum electrodes. Water Research, 37(18): p. 4513-4523.
Hua, G. and D.A. Reckhow, 2007. Characterization of disinfection byproduct precursors based on hydrophobicity and molecular size. Environmental Science and Technology, 41(9): p. 3309-3315.
References
88
Huang, C.-H., L. Chen, and C.-L. Yang, 2009. Effect of anions on electrochemical coagulation for cadmium removal. Separation and Purification Technology, 65(2): p. 137-146.
Iowa Department of Natural Resources, 2009. Water quality standards review: Chloride, sulfate, and total dissolved solids.
Iriarte-Velasco, U., J.I. Álvarez-Uriarte, and J.R. González-Velasco, 2007. Enhanced coagulation under changing alkalinity-hardness conditions and its implications on trihalomethane precursors removal and relationship with UV absorbance. Separation and Purification Technology, 55(3): p. 368-380.
Iritani, E. et al., 1995. Flux decline behavior in dead-end microfiltration of protein solutions. Journal of Membrane Science, 103(1): p. 181-191.
Jarusutthirak, C., G. Amy, and J.-P. Croué, 2002. Fouling characteristics of wastewater effluent organic matter (EfOM) isolates on NF and UF membranes. Desalination, 145: p. 247-255.
Jeong, S. et al., 2013. Foulant analysis of a reverse osmosis membrane using pretreated seawater. Journal of Membrane Science, 428: p. 434 - 444.
Jucker, C. and M.M. Clark, 1994. Adsorption of aquatic humic substances on hydrophobic ultrafiltration membranes. Journal of Membrane Science, 97: p. 37-52.
Kim, H.C. and M.J. Yu, 2005. Characterization of natural organic matter in conventional water treatment processes for selection of treatment processes focused on DBPs control. Water Research, 39(19): p. 4779-4789.
Krasner, S.W. and G. Amy, 1995. Jar-test evaluations of enhanced coagulation. American Water Works Association, 87(10): p. 93-107.
Krieg, H.M. et al., 2005. Salt rejection in nanofiltration for single and binary salt mixtures in view of sulphate removal. Desalination, 171(2): p. 205-215.
Kwon, Y. and J. Leckie, 2006. Hypochlorite degradation of crosslinked polyamide membranes II. Changes in hydrogen bonding behavior and performance. Journal of Membrane Science, 282(1-2): p. 456-464.
Le Gouellec, Y.A. and M. Elimelech, 2002. Calcium sulfate (gypsum) scaling in nanofiltration of agricultural drainage water. Journal of Membrane Science, 205: p. 279-291.
Lee, W.J. and S.I. Pyun, 2000. Effects of sulphate ion additives on the pitting corrosion of pure aluminium in 0.01 M NaCl solution. Electrochimica Acta, 45(12): p. 1901-1910.
Leenheer, J.A., 2009. Systematic approaches to comprehensive analyses of natural organic matter. Annals of Environmental Science, 3: p. 1-130.
Advanced Pretreatment for Nanofiltration of Brackish Surface Water: Fouling Control and Water Quality Improvements
89
Levenstein, R., D. Hasson, and R. Semiat, 1996. Utilization of the Donnan effect for improving electrolyte separation with nanofiltration membranes. Journal of Membrane Science, 116(1): p. 77-92.
Light, T.S., 1984. Temperature dependence and measurement of resistivity of pure water. Analytical Chemistry, 56(7): p. 1138-1142.
Liu, Y. and B. Mi, 2012. Combined fouling of forward osmosis membranes: Synergistic foulant interaction and direct observation of fouling layer formation. Journal of Membrane Science, 407–408: p. 136-144.
Lyster, E. et al., 2009. Coupled 3-D hydrodynamics and mass transfer analysis of mineral scaling-induced flux decline in a laboratory plate-and-frame reverse osmosis membrane module. Journal of Membrane Science, 339(1–2): p. 39-48.
Mantsch, H.H. and D. Chapman, 1996, Infrared Spectroscopy of Biomolecules. New York: John Wiley and Sons, Inc.
Mariñas, B. and R. Urama, 1996. Modeling concentration-polarization in reverse osmosis spiral-wound elements. Journal of Environmental Engineering, 122(4): p. 292-298.
Marley, N.A. et al., 1992. Chemical characterization of size-fractionated humic and fulvic materials in aqueous samples. Science of the Total Environment, 113(1): p. 159-177.
Martell, A.E. and R.J. Motekaitis, 1992. Determination and use of stability constants. 2nd ed, A.E. Martell and R.J. Motekaitis, Ed. New York: VCH Publishers.
Matilainen, A., M. Vepsäläinen, and M. Sillanpää, 2010. Natural organic matter removal by coagulation during drinking water treatment: A review. Advances in Colloid and Interface Science, 159(2): p. 189-197.
Maurice, P.A. et al., 2002. A comparison of surface water natural organic matter in raw filtered water samples, XAD, and reverse osmosis isolates. Water Research, 36(9): p. 2357-2371.
McCafferty, E., 1995. The electrode kinetics of pit initiation on aluminum. Corrosion Science, 37(3): p. 481-492.
Mechelhoff, M., G.H. Kelsall, and N.J.D. Graham, 2013. Super-faradaic charge yields for aluminium dissolution in neutral aqueous solutions. Chemical Engineering Science, 95: p. 353-359.
Mouedhen, G. et al., 2008. Behavior of aluminum electrodes in electrocoagulation process. Journal of Hazardous Materials, 150(1): p. 124-135.
Nance, H.S., 2006. Tracking salinity sources to Texas streams: Examples from west Texas and the Texas gulf coastal plain. H.S. Nance, Ed. The Gulf Coast Association of Geological Societies. p. 675-693.
References
90
Nghiem, L.D., D. Vogel, and S. Khan, 2008. Characterising humic acid fouling of nanofiltration membranes using bisphenol A as a molecular indicator. Water Research, 42(15): p. 4049-4058.
O'Donnell, A.J. et al., 2016. Removal of strontium from drinking water by conventional treatment and lime softening in bench-scale studies. Water Research, 103: p. 319-333.
Park, N. et al., 2006. Characterizations of the colloidal and microbial organic matters with respect to membrane foulants. Journal of Membrane Science, 275(1-2): p. 29-36.
Park, N. et al., 2007. Foulants analyses for NF membranes with different feed waters: coagulation/sedimentation and sand filtration treated waters. Desalination, 202(1-3): p. 231-238.
Petersen, R.J., 1993.Composite reverse osmosis and nanofiltration membranes. Journal of Membrane Science, 83(1): p. 81-150.
Rahardianto, A. et al., 2006. Diagnostic characterization of gypsum scale formation and control in RO membrane desalination of brackish water. Journal of Membrane Science, 279(1-2): p. 655-668.
Rahardianto, A. et al., 2007. High recovery membrane desalting of low-salinity brackish water: Integration of accelerated precipitation softening with membrane RO. Journal of Membrane Science, 289(1-2): p. 123-137.
Rahardianto, A., B.C. McCool, and Y. Cohen, 2008. Reverse osmosis desalting of inland brackish water of high gypsum scaling propensity: kinetics and mitigation of membrane mineral scaling. Environmental Science and Technology, 42(12): p. 4292-7.
Rautenbach, R. and A. Gröschl, 1990. Separation potential of nanofiltration membranes. Desalination, 77: p. 73-84.
Richards, L.A., B.S. Richards, and A.I. Schäfer, 2011. Renewable energy powered membrane technology: Salt and inorganic contaminant removal by nanofiltration/reverse osmosis. Journal of Membrane Science, 369(1–2): p. 188-195.
Roberson, J.A. et al., 2015. Development of recommendations for the fourth contaminant candidate list. Journal: American Water Works Association, 107(10): p. E509-E522.
Rosi, F. et al., 2010. On the use of overtone and combination bands for the analysis of the CaSO4-H2O system by mid-infrared reflection spectroscopy. Applied Spectroscopy, 64(8): p. 956-963.
Sari, M.A., 2017. Aluminum (electro)coagulation and membrane filtration for purification of impaired waters: Applications to surface water, hydraulic fracturing wastewater, and water reuse, in Department of Civil Engineering. Texas A and M University: College Station, Texas.
Advanced Pretreatment for Nanofiltration of Brackish Surface Water: Fouling Control and Water Quality Improvements
91
Sari, M.A. and S. Chellam, 2017a. Relative contributions of organic and inorganic fouling during nanofiltration of inland brackish surface water. Journal of Membrane Science, 523: p. 68-76.
Sari, M.A. and S. Chellam, 2017b. Electrocoagulation process considerations during advanced pretreatment for brackish inland surface water desalination: Nanofilter fouling control and permeate water quality. Desalination, 410: p. 66-76.
Sari, M.A. and S. Chellam, 2013. Surface water nanofiltration incorporating (electro) coagulation–microfiltration pretreatment: Fouling control and membrane characterization. Journal of Membrane Science, 437: p. 249-256.
Sari, M.A. and S. Chellam, 2016. Reverse osmosis fouling during pilot-scale municipal water reuse: Evidence for aluminum coagulant carryover. Journal of Membrane Science, 520: p. 231-239.
Sarkar, M.S.K.A., G.M. Evans, and S.W. Donne, 2010. Bubble size measurement in electroflotation. Minerals Engineering, 23(11–13): p. 1058-1065.
Schaep, J. et al., 1998. Retention mechanisms in nanofiltration, in Chemistry for the Protection of the Environment. L. Pawłowski et al., Ed. Springer US: New York. p. 117-125.
Schäfer, A.I., A.G. Fane, and T.D. Waite, 2005. Nanofiltration: Principles and applications, A.I. Schäfer, A.G. Fane, and T.D. Waite, Ed. Oxford and New York: Elsevier Advanced Technology.
Sharma, R.R. and S. Chellam, 2006. Temperature and concentration effects on electrolyte transport across porous thin-film composite nanofiltration membranes: Pore transport mechanisms and energetics of permeation. Journal of Colloid and Interface Science, 298(1): p. 327-340.
Shih, W.Y. et al., 2005. Morphometric characterization of calcium sulfate dihydrate (gypsum) scale on reverse osmosis membranes. Journal of Membrane Science, 252(1–2): p. 253-263.
Shon, H.K. et al., 2006. Fouling of ultrafiltration membrane by effluent organic matter: A detailed characterization using different organic fractions in wastewater. Journal of Membrane Science, 278(1-2): p. 232-238.
Simon, A., W.E. Price, and L.D. Nghiem, 2013. Influence of formulated chemical cleaning reagents on the surface properties and separation efficiency of nanofiltration membranes. Journal of Membrane Science, 432: p. 73-82.
Singer, P.C., 1999, Formation and control of disinfection by-products in drinking water. American Water Works Association. Denver, Colorado.
Siriwardane, R.V. and J.M. Cook, 1986. Interactions of SO2 with sodium deposited on CaO. Journal of Colloid and Interface Science, 114(2): p. 525-535.
References
92
Snoeyink, V.L. and D. Jenkins, 1980. Water chemistry. Wiley. New York. Snyder, S.A. et al., 2007. Role of membranes and activated carbon in the
removal of endocrine disruptors and pharmaceuticals. Desalination, 202(1): p. 156-181.
Soltis, J., N.J. Laycock, and D. Krouse, 2011.Temperature dependence of the pitting potential of high purity aluminium in chloride containing solutions. Corrosion Science, 53(1): p. 7-10.
Speth, T.F., R.S. Summers, and A.M. Gusses, 1998. Nanofiltration foulants from a treated surface water. Environmental Science and Technology, 32(22): p. 3612-3617.
Stuart, B.H., 2004. Infrared spectroscopy: Fundamentals and applications. Chichester, West Sussex: John Wiley and Sons Ltd.
Szklarska-Smialowska, Z., 1999. Pitting corrosion of aluminum. Corrosion Science, 41(9): p. 1743-1767.
Tang, C.Y., Y.-N. Kwon, and J.O. Leckie, 2007a. Fouling of reverse osmosis and nanofiltration membranes by humic acid: Effects of solution composition and hydrodynamic conditions. Journal of Membrane Science, 290(1-2): p. 86-94.
Tang, C.Y., Y.-N. Kwon, and J.O. Leckie, 2007b. Probing the nano- and micro-scales of reverse osmosis membranes—A comprehensive characterization of physiochemical properties of uncoated and coated membranes by XPS, TEM, ATR-FTIR, and streaming potential measurements. Journal of Membrane Science, 287(1): p. 146-156.
Tang, C.Y., Y.-N. Kwon, and J.O. Leckie, 2009a. The role of foulant-foulant electrostatic interaction on limiting flux for RO and NF membranes during humic acid fouling-Theoretical basis, experimental evidence, and AFM interaction force measurement. Journal of Membrane Science, 326(2): p. 526-532.
Tang, C.Y., Y.-N. Kwon, and J.O. Leckie, 2009b. Effect of membrane chemistry and coating layer on physiochemical properties of thin film composite polyamide RO and NF membranes. Desalination, 242(1): p. 149-167.
Tanneru, C.T. et al., 2014. Relative insignificance of virus inactivation during aluminum electrocoagulation of saline waters. Environmental Science and Technology, 48(24): p. 14590-14598.
Tomcsányi, L. et al., 1989. Electrochemical study of the pitting corrosion of aluminium and its alloys—II. Study of the interaction of chloride ions with a passive film on aluminium and initiation of pitting corrosion. Electrochimica Acta, 34(6): p. 855-859.
Uchymiak, M. et al., 2008. Kinetics of gypsum crystal growth on a reverse osmosis membrane. Journal of Membrane Science, 314(1–2): p. 163-172.
Advanced Pretreatment for Nanofiltration of Brackish Surface Water: Fouling Control and Water Quality Improvements
93
Uduman, N. et al., 2011. A parametric study of electrocoagulation as a recovery process of marine microalgae for biodiesel production. Chemical Engineering Journal, 174(1): p. 249-257.
Van Benschoten, J.E. and J.K. Edzwald, 1990. Chemical aspects of coagulation using aluminum salts—I. Hydrolytic reactions of alum and polyaluminum chloride. Water Research, 24(12): p. 1519-1526.
Van der Bruggen, B., 2013, Nanofiltration, in Encyclopedia of Membrane Science and Technology, E.M.V. Hoek and V.V. Tarabara, Ed. John Wiley and Sons, Inc.
Vasudevan, S. et al., 2009. Remediation of phosphate-contaminated water by electrocoagulation with aluminium, aluminium alloy, and mild steel anodes. Journal of Hazardous Materials, 164(2–3): p. 1480-1486.
Vepsäläinen, M. et al., 2009. Investigations of the effects of temperature and initial sample pH on natural organic matter (NOM) removal with electrocoagulation using response surface method (RSM). Separation and Purification Technology, 69(3): p. 255-261.
Vrijenhoek, E.M., S. Hong, and M. Elimelech, 2001. Influence of membrane surface properties on initial rate of colloidal fouling of reverse osmosis and nanofiltration membranes. Journal of Membrane Science, 188(1): p. 115 - 128.
Wang, J. et al., 2014. Effects of water chemistry on structure and performance of polyamide composite membranes. Journal of Membrane Science, 452: p. 415-425.
Wang, J. et al., 2016. Enhanced gypsum scaling by organic fouling layer on nanofiltration membrane: Characteristics and mechanisms. Water Research, 91: p. 203-213.
Weishaar, J.L. et al., 2003. Evaluation of specific ultraviolet absorbance as an indicator of the chemical composition and reactivity of dissolved organic carbon. Environmental Science and Technology, 37(20): p. 4702 - 4708.
Xie, M. and S.R. Gray, 2016. Gypsum scaling in forward osmosis: Role of membrane surface chemistry. Journal of Membrane Science, 513: p. 250 - 259.
Xu, B. et al., 2010. Measurements of dissolved organic nitrogen (DON) in water samples with nanofiltration pretreatment. Water Research, 44(18): p. 5376 - 84.
Xu, P. et al., 2006. Effect of membrane fouling on transport of organic contaminants in NF/RO membrane applications. Journal of Membrane Science, 279(1-2): p. 165 - 175.
Xu, W. and S. Chellam, 2005. Initial stages of bacterial fouling during dead-end microfiltration. Environmental Science and Technology, 39(17): p. 6470-6476.
References
94
Yangali-Quintanilla, V. et al., 2009. Rejection of pharmaceutically active compounds and endocrine disrupting compounds by clean and fouled nanofiltration membranes. Water Research, 43(9): p. 2349 - 2362.
Yaroshchuk, A.E., 2008. Negative rejection of ions in pressure-driven membrane processes. Advances in Colloid and Interface Science, 139(1–2): p. 150 - 173.
Zaid, B. et al., 2008. Effects of pH and chloride concentration on pitting corrosion of AA6061 aluminum alloy. Corrosion Science, 50(7): p. 1841 - 1847.
Zhu, A. et al., 2007. The negative rejection of H+ in NF of carbonate solution and its influences on membrane performance. Chemosphere, 67(8): p. 1558 - 65.
Zydney, A.L., 1997. Stagnant film model for concentration polarization in membrane systems. Journal of Membrane Science, 130(1–2): p. 275 - 281.
APPENDIX A
NF Quality Control and Assurance

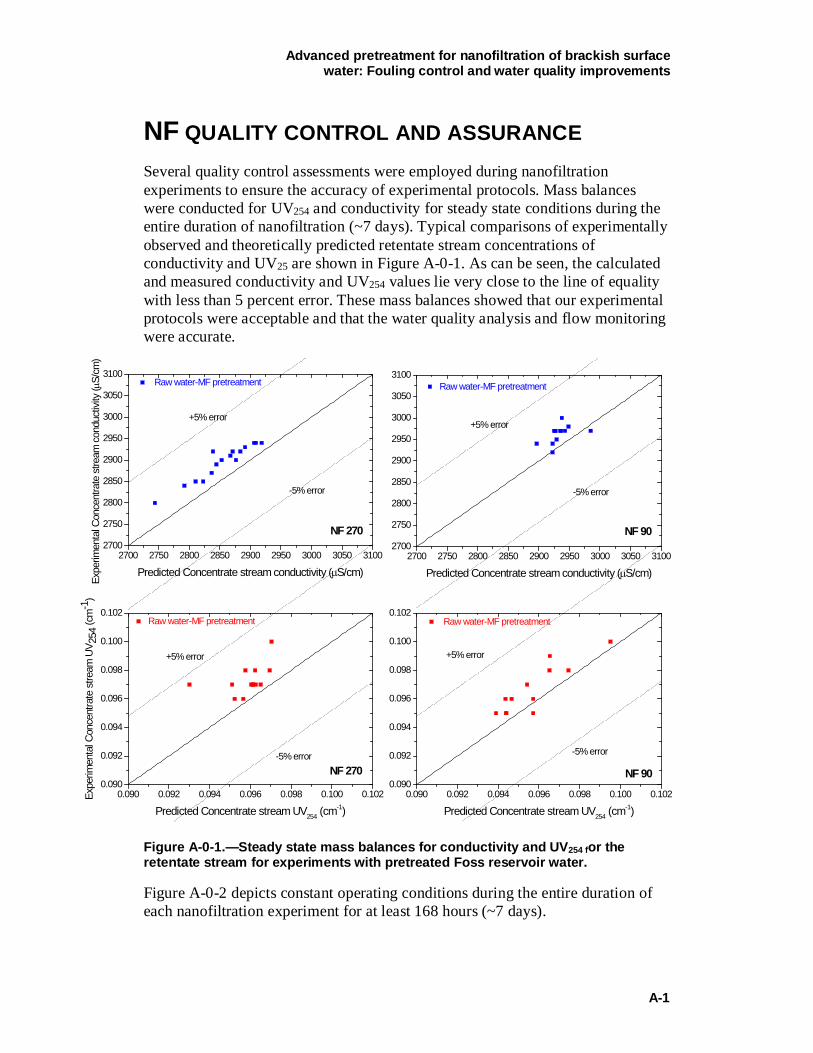
Advanced pretreatment for nanofiltration of brackish surface water: Fouling control and water quality improvements
A-1
NF QUALITY CONTROL AND ASSURANCE Several quality control assessments were employed during nanofiltration experiments to ensure the accuracy of experimental protocols. Mass balances were conducted for UV254 and conductivity for steady state conditions during the entire duration of nanofiltration (~7 days). Typical comparisons of experimentally observed and theoretically predicted retentate stream concentrations of conductivity and UV25 are shown in Figure A-0-1. As can be seen, the calculated and measured conductivity and UV254 values lie very close to the line of equality with less than 5 percent error. These mass balances showed that our experimental protocols were acceptable and that the water quality analysis and flow monitoring were accurate.
Figure A-0-1.—Steady state mass balances for conductivity and UV254 for the retentate stream for experiments with pretreated Foss reservoir water.
Figure A-0-2 depicts constant operating conditions during the entire duration of each nanofiltration experiment for at least 168 hours (~7 days).
2700 2750 2800 2850 2900 2950 3000 3050 31002700
2750
2800
2850
2900
2950
3000
3050
3100
2700 2750 2800 2850 2900 2950 3000 3050 31002700
2750
2800
2850
2900
2950
3000
3050
3100
0.090 0.092 0.094 0.096 0.098 0.100 0.1020.090
0.092
0.094
0.096
0.098
0.100
0.102
0.090 0.092 0.094 0.096 0.098 0.100 0.1020.090
0.092
0.094
0.096
0.098
0.100
0.102
Raw water-MF pretreatment
+5% error
Expe
rimen
tal C
once
ntra
te s
tream
con
duct
ivity
(µS/
cm)
Predicted Concentrate stream conductivity (µS/cm)
NF 270
-5% error
Raw water-MF pretreatment
-5% error
+5% error
NF 90
Predicted Concentrate stream conductivity (µS/cm)
Raw water-MF pretreatment
-5% error
+5% error
NF 270
Expe
rimen
tal C
once
ntra
te s
tream
UV 2
54 (c
m-1
)
Predicted Concentrate stream UV254 (cm-1)
Raw water-MF pretreatment
-5% error
+5% error
NF 90
Predicted Concentrate stream UV254 (cm-1)
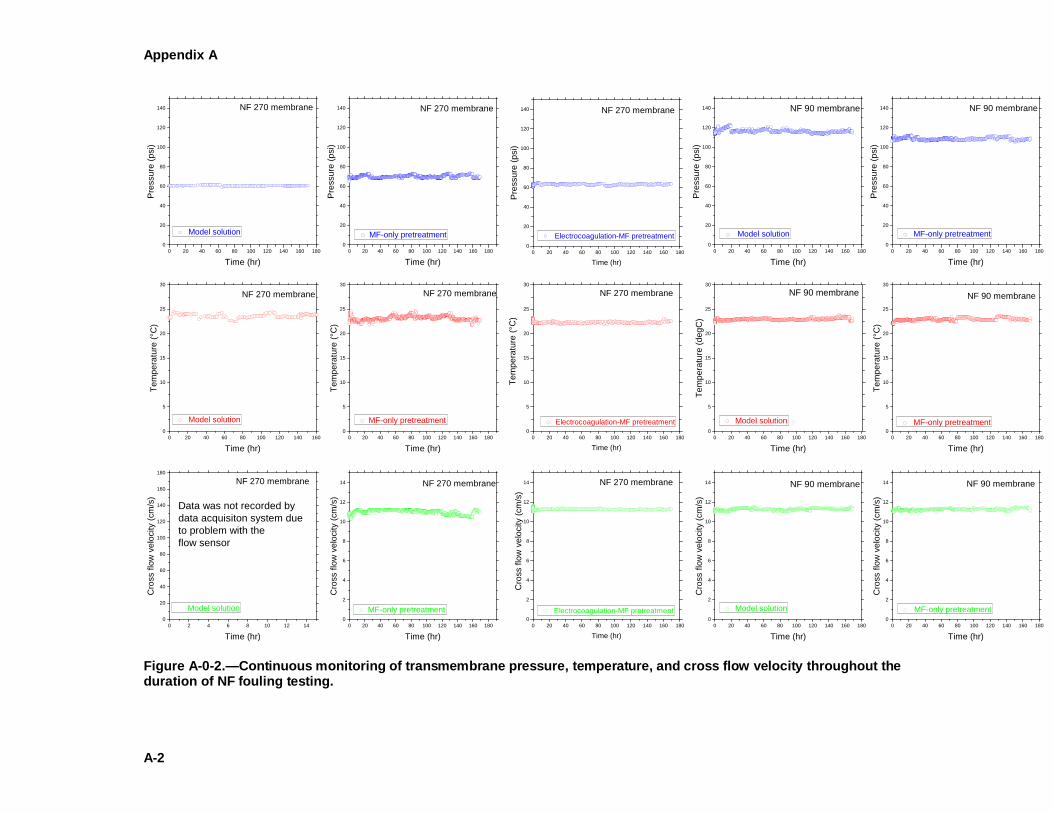
Appendix A
A-2
Figure A-0-2.—Continuous monitoring of transmembrane pressure, temperature, and cross flow velocity throughout the duration of NF fouling testing.
0 20 40 60 80 100 120 140 160 1800
20
40
60
80
100
120
140
0 20 40 60 80 100 120 140 160 1800
20
40
60
80
100
120
140
0 20 40 60 80 100 120 140 160 1800
20
40
60
80
100
120
140
0 20 40 60 80 100 120 140 160 1800
20
40
60
80
100
120
140
0 20 40 60 80 100 120 140 1600
5
10
15
20
25
30
0 20 40 60 80 100 120 140 160 1800
5
10
15
20
25
30
0 20 40 60 80 100 120 140 160 1800
5
10
15
20
25
30
0 20 40 60 80 100 120 140 160 1800
5
10
15
20
25
30
0 20 40 60 80 100 120 140 160 1800
2
4
6
8
10
12
14
0 20 40 60 80 100 120 140 160 1800
2
4
6
8
10
12
14
0 20 40 60 80 100 120 140 160 1800
2
4
6
8
10
12
14
0 20 40 60 80 100 120 140 160 1800
20
40
60
80
100
120
140
0 20 40 60 80 100 120 140 160 1800
5
10
15
20
25
30
0 20 40 60 80 100 120 140 160 1800
2
4
6
8
10
12
14
Model solution
Pres
sure
(psi
)
Time (hr)
NF 270 membrane NF 270 membrane
MF-only pretreatment
Pres
sure
(psi
)
Time (hr)
NF 90 membrane
Model solution
Pres
sure
(psi
)
Time (hr)
NF 90 membrane
MF-only pretreatment
Pres
sure
(psi
)
Time (hr)
NF 270 membrane
Model solution
Tem
pera
ture
(°C
)
Time (hr)
NF 270 membrane
MF-only pretreatment
Tem
pera
ture
(°C
)
Time (hr)
NF 90 membrane
Model solution
Tem
pera
ture
(deg
C)
Time (hr)
NF 90 membrane
MF-only pretreatment
Tem
pera
ture
(°C
)
Time (hr)
NF 270 membrane
MF-only pretreatment
Cro
ss fl
ow v
eloc
ity (c
m/s
)
Time (hr)
NF 90 membrane
Model solution
Cro
ss fl
ow v
eloc
ity (c
m/s
)
Time (hr)
NF 90 membrane
MF-only pretreatment
Cro
ss fl
ow v
eloc
ity (c
m/s
)
Time (hr)
Electrocoagulation-MF pretreatment
NF 270 membrane
Pres
sure
(psi
)
Time (hr)
Electrocoagulation-MF pretreatment
NF 270 membrane
Tem
pera
ture
(°C
)
Time (hr)
Electrocoagulation-MF pretreatment
NF 270 membrane
Cro
ss fl
ow v
eloc
ity (c
m/s
)
Time (hr)0 2 4 6 8 10 12 14
0
20
40
60
80
100
120
140
160
180
Model solution
NF 270 membrane
Cro
ss fl
ow v
eloc
ity (c
m/s
)
Time (hr)
Data was not recorded bydata acquisiton system dueto problem with theflow sensor
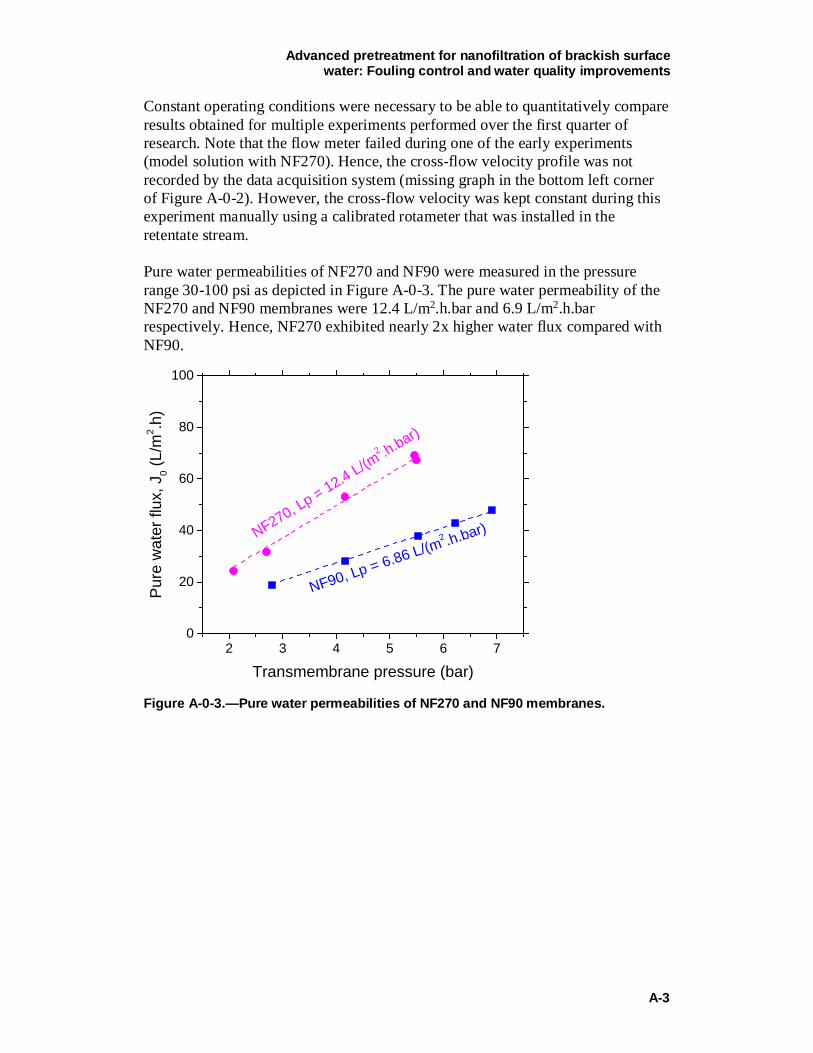
Advanced pretreatment for nanofiltration of brackish surface water: Fouling control and water quality improvements
A-3
Constant operating conditions were necessary to be able to quantitatively compare results obtained for multiple experiments performed over the first quarter of research. Note that the flow meter failed during one of the early experiments (model solution with NF270). Hence, the cross-flow velocity profile was not recorded by the data acquisition system (missing graph in the bottom left corner of Figure A-0-2). However, the cross-flow velocity was kept constant during this experiment manually using a calibrated rotameter that was installed in the retentate stream.
Pure water permeabilities of NF270 and NF90 were measured in the pressure range 30-100 psi as depicted in Figure A-0-3. The pure water permeability of the NF270 and NF90 membranes were 12.4 L/m2.h.bar and 6.9 L/m2.h.bar respectively. Hence, NF270 exhibited nearly 2x higher water flux compared with NF90.
Figure A-0-3.—Pure water permeabilities of NF270 and NF90 membranes.
2 3 4 5 6 70
20
40
60
80
100
NF270, Lp = 12.4 L/(m2 .h.bar)
Pure
wat
er fl
ux, J
0 (L/
m2 .h
)
Transmembrane pressure (bar)
NF90, Lp = 6.86 L/(m2 .h.bar)