Embed Size (px)
Citation preview
Advanced Heat Pump Water Heater Research First Midterm Field Study Report
Bonneville Power Administration Technology Innovation Project 292
Organization
Washington State University – WSU Energy Program in Olympia, WA
Co-Sponsors
Avista Corp.
The Energy Trust of Oregon
Northwest Energy Efficiency Alliance
Ravalli Electric Co-op
Tacoma Public Utilities
Prepared by
Ken Eklund and Adria Banks, WSU Energy Program Ben Larson, Ecotope, Analysis Consultant and Reviewer
360-956-2019, [email protected]
Publication # WSUEEP15-005
Publication Date: October 30, 2014
Corrected & Updated: March 19, 2015
i
Contents Introduction ......................................................................................................................................1 Field Study Description ......................................................................................................................2 Description of Analysis .......................................................................................................................4
a. Energy Factor vs. Coefficient of Performance .................................................................................. 4 b. Changes from the Field Test Plan ..................................................................................................... 4 c. Challenges in Monitoring .................................................................................................................. 4 d. Analysis Protocols ............................................................................................................................. 5
Results ...............................................................................................................................................6 a. Site Summaries ................................................................................................................................. 6 b. Outside Air Temperature .................................................................................................................. 7 c. Freeze Protection .............................................................................................................................. 8 d. Tank Room Summaries (from Metered Readings)............................................................................ 9 e. Household Water Temperatures (from Flow Event Averages) ....................................................... 10 f. Household Water and Water Heater Energy Use ........................................................................... 12 g. System Performance ....................................................................................................................... 13 h. Field Energy Factors ........................................................................................................................ 14
Conclusion and Recommendations ................................................................................................... 17
References ....................................................................................................................................... 18
Tables Table 1. Heating Zones of Four Test Sites ..................................................................................................... 6 Table 2. Test Site Characteristics .................................................................................................................. 6 Table 3. Low, Average, and Standard Deviation from Average OAT at Each Site ......................................... 8 Table 4. Measured Electricity Used for Freeze Protection and Percent of Total System Energy Use .......... 8 Table 5. Total Measured Cold Water Supply and Calculated Tempering Water ........................................ 13
Figures Figure 1. Field Monitoring Setup .................................................................................................................. 3 Figure 2. Daily Average Temperature at Each Site through March 2014 ..................................................... 7 Figure 3. Box Plot Description ....................................................................................................................... 9 Figure 4. Temperature of Space Surrounding the Tank ................................................................................ 9 Figure 5. Average Cold Water Supply Temperatures at Each Site .............................................................. 10 Figure 6. Average Hot Water Supply Temperature by Site ......................................................................... 11 Figure 7. Average Tempered Mixed Water Temperature by Site ............................................................... 12 Figure 8. Water Flow through the Hot Water System and the Energy Used to Heat It ............................. 14 Figure 9. Weekly Field Energy Factor (Including Freeze Protection) and Temperature ............................. 15 Figure 10. Energy Factor for Various Test Temperatures ........................................................................... 15 Figure 11. Laboratory Fit Superimposed on Field Results (from Figure 9)……………………………………………...156
ii
Abbreviations
BPA ....................................................................... Bonneville Power Administration CO2 ............................................................................................................. carbon dioxide COP ....................................................................... coefficient of performance EF ......................................................................... energy factor ER ......................................................................... electric resistance FEF ........................................................................ Field Energy Factor GWP ..................................................................... Global Warming Potential HPWH ................................................................... heat pump water heater HFC ....................................................................... hydrofluorocarbons OAT ....................................................................... outside air temperatures UL ......................................................................... Underwriters Laboratory WSU...................................................................... Washington State University
1
Introduction This report is part of groundbreaking research by Washington State University (WSU) Energy Program into the performance of advanced heat pump water heaters (HPWHs). This research is funded by the Bonneville Power Administration (BPA) through its Technology Innovation Program.
These water heaters are unique for three significant reasons:
• First, they are split systems, meaning the compressor and evaporator are separate from the hot water tank, and take heat from outside air without impact on the conditioned space or internal noise—both of which are issues with unitary HPWHs currently available in the U.S. market.
• Second, the compressor, fan and pump are highly efficient variable speed, inverter driven technology unlike most of the heat pump water heaters on the market.
• Third, they have carbon dioxide (CO2) as the refrigerant. CO2 has higher performance than standard refrigerants in this application and has a significantly lower impact on the environment.
The environmental benefit of using CO2 as a refrigerant is that its Global Warming Potential (GWP) is 1. This compares very favorably to the refrigerant in most HPWHs, which are hydrofluorocarbons (HFC), with GWP several orders of magnitude higher than CO2. The use of CO2 as a refrigerant was introduced in response to climate change in Japan, and is now being used in Europe and Australia for environmental reasons. The equipment being tested in this study is manufactured by Sanden International in Australia.
The research began with a lab test, which was done by Ecotope, Inc. of Seattle and Cascade Engineering Services, a lab in Redmond, Washington. This report, Laboratory Assessment of Sanden GAU Heat Pump Water Heater Lab, demonstrates the potential of the technology with energy factors significantly higher than unitary systems located inside conditioned space or sheltered in buffer spaces, like basements and garages, which draw heat from conditioned space.
The question of whether the lab performance would translate to actual use is answered by this field study. This phase of the research has local plumbers and electricians install these systems in four, single family homes so the researchers could measure performance in the real world. Performance is measured according to protocols used for similar studies of unitary systems. See, for example, the NEEA Heat Pump Water Heater Field Study Report. Surveys of water use and occupants’ response to the systems are also being conducted.
Information from this research is being used to prepare a product for sale in the U.S. Both the lab and field tests have produced practical information that is helpful in the design process to adapt an Australian product so it is suitable for use in colder climates. Underwriters Laboratory (UL) listing is also needed and the performance data from these lab and field studies is useful for that process.
The field study is designed to gather at least a year’s worth of data from the systems being tested. The data will be analyzed at two interim points and then brought together for a final analysis and report due in fall 2015. This is the first interim field study report.
This midterm report focuses only on field performance at the four sites. The final report will include performance analysis, but will add survey results and a billing analysis.
2
Field Study Description Four split system CO2 refrigerant HPWHs manufactured by Sanden International were installed in homes across the region beginning in fall 2013. These homes are located in Tacoma, WA; Corvallis, MT; Addy, WA; and Portland, OR. The field study is designed to test the performance of the technology in all three of the Pacific Northwest’s heating climate zones. The four host organizations are: Avista, Energy Trust of Oregon, Ravalli Electric Coop, and Tacoma Public Utilities. Each of these partners actively recruited host sites for the field tests.
Each test site met certain criteria of occupancy and history of energy use. Each site has a minimum family size of four; the water heater replaced by the test unit was electric resistance (ER); and the same family members have used the ER water heater for at least three years of occupancy.
The field study is designed to monitor the systems for at least 12 full months. This report covers the first quarter of monitoring – from installation through March 2014. The installations were completed as early as October 30, 2013 and the final installation was completed and producing data on February 8, 2014.
Regional monitoring protocols are followed except those related to impact on conditioned space because the split system has no impact except tank loss. Data points include:
• Water flow time and volume through hot water tank measured at the cold water inlet • Temperatures
o Cold water supply o Hot water to tempering valve o Tempered water to house o Outside air temperature o Inside air temperature near the hot water tank
• Power measurements o Time and amperage of compressor electricity use o Time and amperage of outdoor pipe freeze protection (heat tape) electricity use o Time and amperage of backup domestic hot water systems (for two sites)
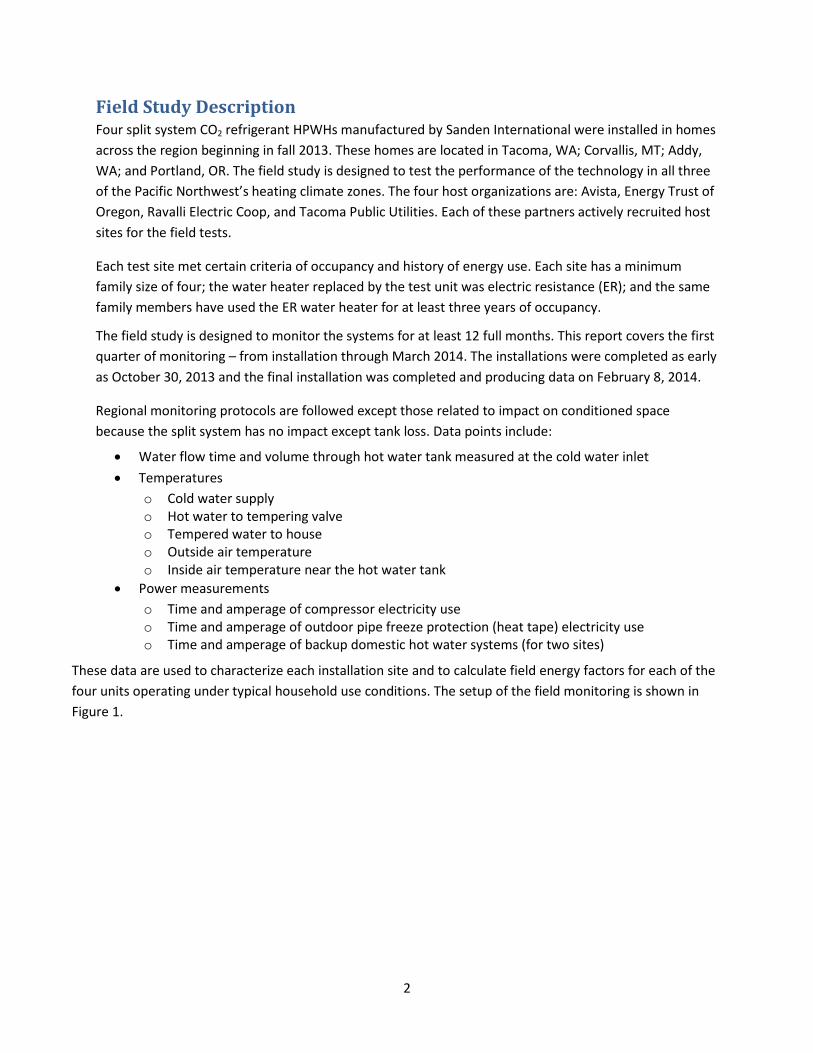
These data are used to characterize each installation site and to calculate field energy factors for each of the four units operating under typical household use conditions. The setup of the field monitoring is shown in Figure 1.
3
Figure 1. Field Monitoring Setup
The monitoring collection device is an Onset U30 GSM with cellphone contract so data can be downloaded daily and settings on the logger can be controlled remotely. This quality assurance ensures that any issues are identified and corrected as soon as possible. The following monitoring equipment is used:
• U30 GSM (includes 10-port option and data plan) • WattNode (WNB-3Y-208-P option 3) • 50 amp split core alternating current (AC) current transformers • Pulse adapters S-UCC_M006 • 12-bit temperature sensors with 6-meter cable • 12-bit temperature sensors with 17-meter cable • Water flow meter sensor (T-Minol-130) • Pulse adapter for flow meter S-UCD-M006 • 10K ohm type 2 thermistors with temperature documentation • Thermo wells for the thermistors
4
Description of Analysis The midterm analysis focuses on site data gathered early in the field monitoring in order to provide quality assurance, develop analysis procedures, and organize the data analysis reporting for the project. The period covered by this analysis is from the time data monitoring began through March 31, 2014. Because system installation spanned three months, there are different-sized data sets for each system.
Two of the sites, Tacoma and Montana, were installed in October and November 2013, and the initial data collection rate at these sites was every five minutes. This was changed to one-minute intervals on December 11, 2013. All data for the other two sites is collected in one-minute intervals. This collection rate allows better definition of performance due to the ability to more accurately account for thermal lag in water temperature sensors.
The analysis in this report examines the efficiency of the system and a number of its operating parameters, including the temperature of the supply water, heated water and tempered water, and the calculated volume of water used for tempering the temperature of the hot water before use. Tempering was required due to the high (approaching 150oF) temperature of the heated water. The total volume of water used and daily use averages are also calculated.
a. Energy Factor vs. Coefficient of Performance The lab test report refers to both coefficient of performance (COP) and energy factor (EF).1
• COP is simply the ratio of the energy produced by the water heater to the energy used to operate the heat pump. In the lab, the researchers have temperature sensors in the tank and can look directly at the hot water temperature so they can calculate the energy in the water.
• The EF is an official DOE 24 hour lab test that includes the tank losses in the energy used with the effect of reducing the COP. This is a more realistic measure of efficiency.
• In this report, the efficiency is labeled a Field Energy Factor (FEF) because it includes tank and plumbing losses. For this reason, the field results look a lot more like energy factors than COP measurements.
b. Changes from the Field Test Plan The Field Test Plan implied that midterm reports would include a billing analysis. This is not the case. The billing analysis is reserved for the final report, where it will have more meaning in a longer context. Normalization of the outside air temperature will be included to assist in comparing data pre- and post-installation of each new water heater.
c. Challenges in Monitoring Logger instrumentation required some adjustment in the first five months of data collection. Tacoma and Montana were initially programmed to record measured variables every five minutes. After consultation with data analysts, these instruments were adjusted to record data at one-minute intervals in mid-December. The Addy and Portland sites were initiated in late January and early February 2014, respectively, and instrumentation was set to log every minute upon installation. 1 The lab test report , Laboratory Assessment of Sanden GAU Heat Pump Water Heater by Ben Larson, Ecotope, can be found at https://conduitnw.org/Pages/File.aspx?RID=1901
5
d. Analysis Protocols Data files from the four sites were compiled for analysis. Depending on the site, data from the first day or more was dropped to eliminate readings affected by set-up and testing of instrumentation. All remaining data, regardless of logging frequency, were used in analyses.
In addition to the metered data described in the Field Study Description, the following values were calculated:
• Average temperatures by flow event or by day for cold water supply, hot water, and tempered water
• Thermal energy required to heat cold supply water for each flow event • Volume of water added to temper valve hot water for each flow event • Volume of total water for each flow event
To calculate representative temperatures for cold supply water, hot water, and tempered water, at least three consecutive flow measurements were required—where one minute data was taken this resulted in a minimum total flow of three minutes for each temperature measurement.2 Mean temperatures were then calculated by dropping the initial temperature reading and averaging over the remaining readings for a given flow event. These remaining readings were also used to approximate daily average temperatures for cold water, hot water, and tempered water. Daily averages were used as the representative mean water temperatures for short-duration draws that were less than three consecutive minutes. Average water temperatures were used to calculate the thermal energy needed to heat the cold water for each draw.
The energy needed to heat the cold water supply for each flow event was calculated as:
Supply Water BTU = Volume (Supply water) x 8.34 x (Avg. hot water temp. – Avg. cold water temp.) x 1 Btu/lb/oF, where 8.34 lb/gal is the density of water
Because only water volume flowing into the HPWH was metered via data loggers, additional water added to temper the hot water flowing to the home was calculated for each flow event by using the known water flow (gallons) and the difference between the average tempered water to the house and the average cold or hot water temperatures, respectively. Total water flow for each flow event was then the sum of the cold water flow and the added water.
Metered and computed values were summarized both daily and weekly. For presentation in this report, FEF values were calculated using weekly averages as:
FEF = Energy Contained in Total Useful Hot Water/Total Energy In
Weekly FEF values including freeze protection energy draws as a component of Total Energy Input to the system were calculated separately. Data summaries and calculations for the first two to five months of data collection at each site (depending on installation date) are presented in this midterm report.
2 Most data taken was one minute data. For a discussion of one and five minute data, see Page 4.
6
Results
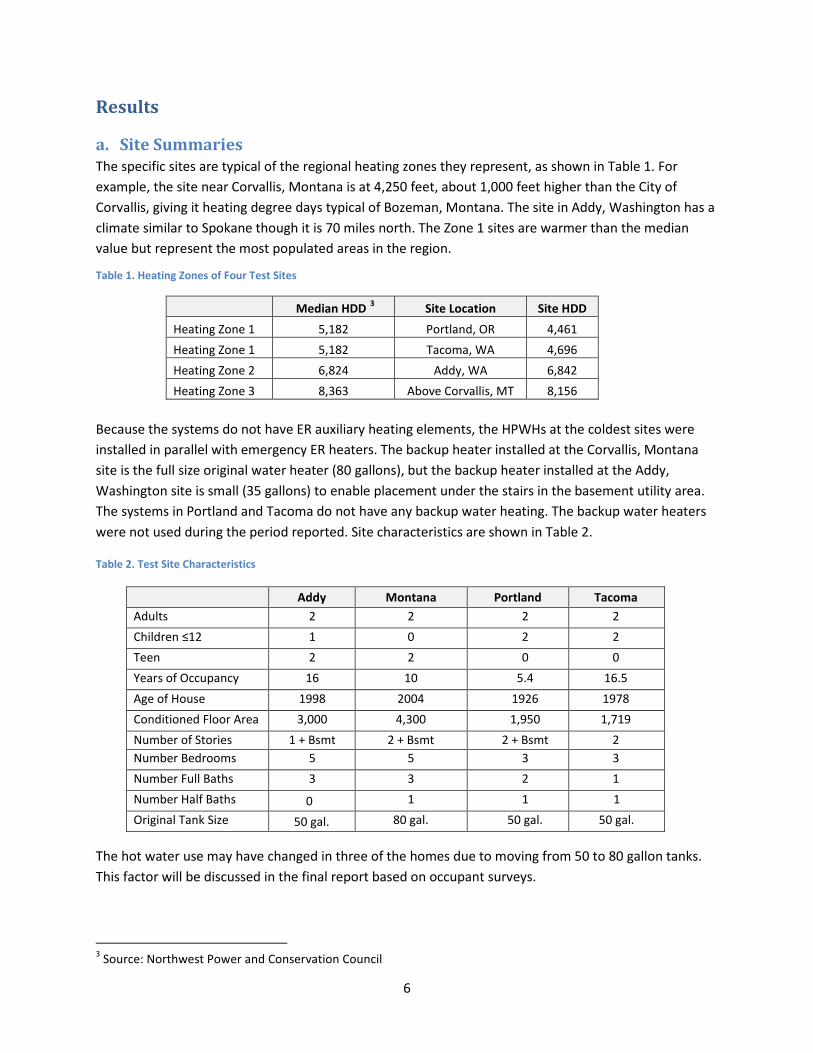
a. Site Summaries The specific sites are typical of the regional heating zones they represent, as shown in Table 1. For example, the site near Corvallis, Montana is at 4,250 feet, about 1,000 feet higher than the City of Corvallis, giving it heating degree days typical of Bozeman, Montana. The site in Addy, Washington has a climate similar to Spokane though it is 70 miles north. The Zone 1 sites are warmer than the median value but represent the most populated areas in the region.
Table 1. Heating Zones of Four Test Sites
Median HDD 3 Site Location Site HDD Heating Zone 1 5,182 Portland, OR 4,461 Heating Zone 1 5,182 Tacoma, WA 4,696 Heating Zone 2 6,824 Addy, WA 6,842 Heating Zone 3 8,363 Above Corvallis, MT 8,156
Because the systems do not have ER auxiliary heating elements, the HPWHs at the coldest sites were installed in parallel with emergency ER heaters. The backup heater installed at the Corvallis, Montana site is the full size original water heater (80 gallons), but the backup heater installed at the Addy, Washington site is small (35 gallons) to enable placement under the stairs in the basement utility area. The systems in Portland and Tacoma do not have any backup water heating. The backup water heaters were not used during the period reported. Site characteristics are shown in Table 2.
Table 2. Test Site Characteristics
The hot water use may have changed in three of the homes due to moving from 50 to 80 gallon tanks. This factor will be discussed in the final report based on occupant surveys.
3 Source: Northwest Power and Conservation Council
Addy Montana Portland Tacoma Adults 2 2 2 2 Children ≤12 1 0 2 2 Teen 2 2 0 0 Years of Occupancy 16 10 5.4 16.5 Age of House 1998 2004 1926 1978 Conditioned Floor Area 3,000 4,300 1,950 1,719 Number of Stories 1 + Bsmt 2 + Bsmt 2 + Bsmt 2 Number Bedrooms 5 5 3 3 Number Full Baths 3 3 2 1 Number Half Baths 0 1 1 1 Original Tank Size 50 gal. 80 gal. 50 gal. 50 gal.
7
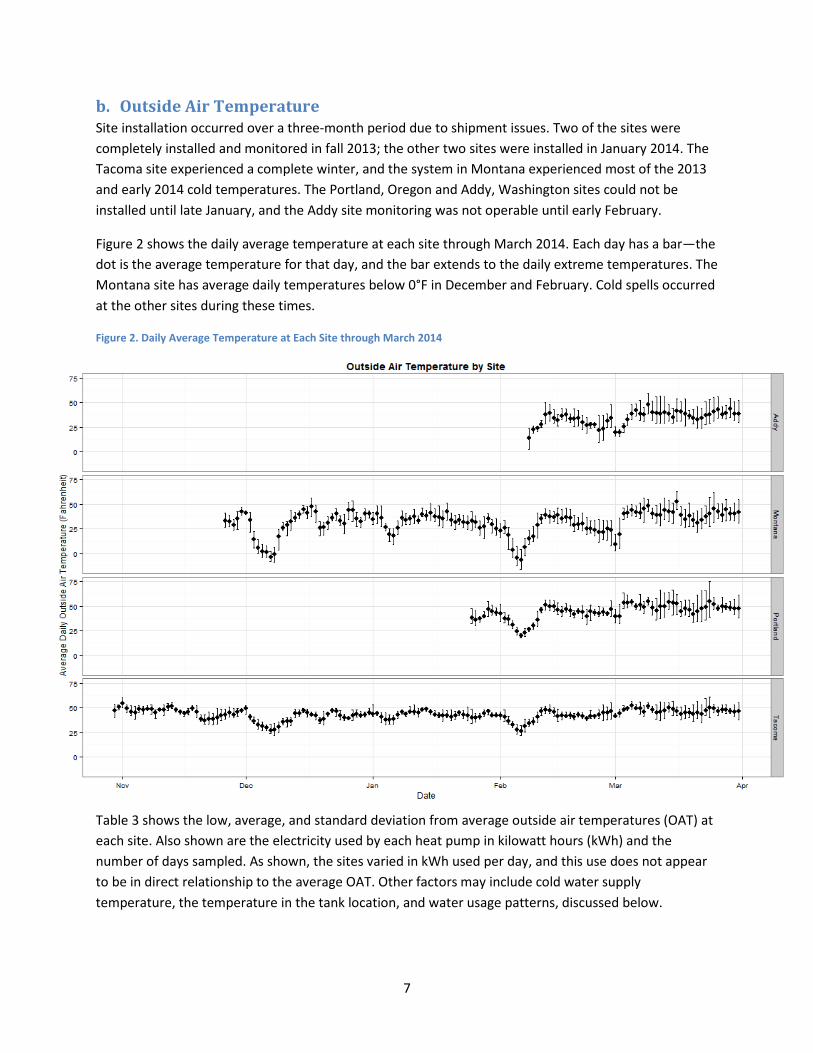
b. Outside Air Temperature Site installation occurred over a three-month period due to shipment issues. Two of the sites were completely installed and monitored in fall 2013; the other two sites were installed in January 2014. The Tacoma site experienced a complete winter, and the system in Montana experienced most of the 2013 and early 2014 cold temperatures. The Portland, Oregon and Addy, Washington sites could not be installed until late January, and the Addy site monitoring was not operable until early February.
Figure 2 shows the daily average temperature at each site through March 2014. Each day has a bar—the dot is the average temperature for that day, and the bar extends to the daily extreme temperatures. The Montana site has average daily temperatures below 0°F in December and February. Cold spells occurred at the other sites during these times.
Figure 2. Daily Average Temperature at Each Site through March 2014
Table 3 shows the low, average, and standard deviation from average outside air temperatures (OAT) at each site. Also shown are the electricity used by each heat pump in kilowatt hours (kWh) and the number of days sampled. As shown, the sites varied in kWh used per day, and this use does not appear to be in direct relationship to the average OAT. Other factors may include cold water supply temperature, the temperature in the tank location, and water usage patterns, discussed below.
8
Table 3. Low, Average, and Standard Deviation from Average OAT at Each Site
Site Minimum OAT (°F)
Mean OAT (°F)
SD OAT (°F)
Total HPWH (kWh)
Sampled Days (n) kWh/Day
Addy 2.08 34.17 ± 8.64 498.27 52 9.6
Montana -15.68 32.96 ± 11.74 930.96 126 7.4
Portland 17.89 44.23 ± 8.88 331.17 66 5
Tacoma 22.20 43.35 ± 5.33 955.92 153 6.2
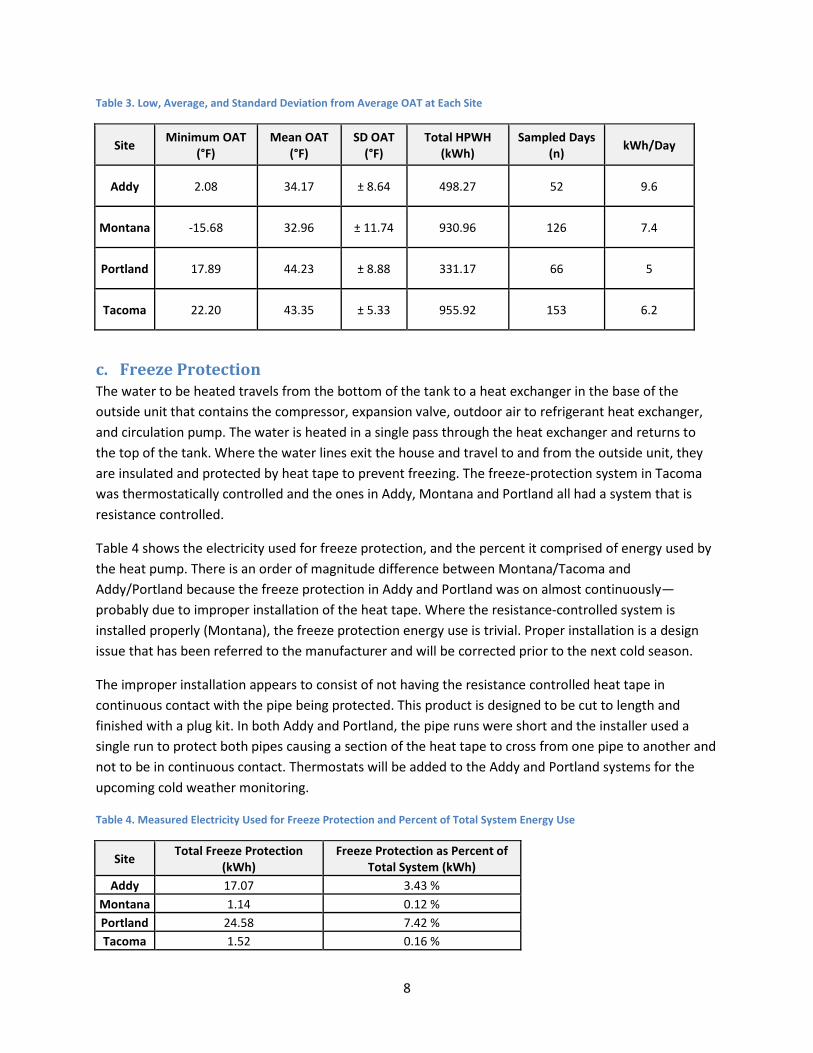
c. Freeze Protection The water to be heated travels from the bottom of the tank to a heat exchanger in the base of the outside unit that contains the compressor, expansion valve, outdoor air to refrigerant heat exchanger, and circulation pump. The water is heated in a single pass through the heat exchanger and returns to the top of the tank. Where the water lines exit the house and travel to and from the outside unit, they are insulated and protected by heat tape to prevent freezing. The freeze-protection system in Tacoma was thermostatically controlled and the ones in Addy, Montana and Portland all had a system that is resistance controlled.
Table 4 shows the electricity used for freeze protection, and the percent it comprised of energy used by the heat pump. There is an order of magnitude difference between Montana/Tacoma and Addy/Portland because the freeze protection in Addy and Portland was on almost continuously—probably due to improper installation of the heat tape. Where the resistance-controlled system is installed properly (Montana), the freeze protection energy use is trivial. Proper installation is a design issue that has been referred to the manufacturer and will be corrected prior to the next cold season.
The improper installation appears to consist of not having the resistance controlled heat tape in continuous contact with the pipe being protected. This product is designed to be cut to length and finished with a plug kit. In both Addy and Portland, the pipe runs were short and the installer used a single run to protect both pipes causing a section of the heat tape to cross from one pipe to another and not to be in continuous contact. Thermostats will be added to the Addy and Portland systems for the upcoming cold weather monitoring.
Table 4. Measured Electricity Used for Freeze Protection and Percent of Total System Energy Use
Site Total Freeze Protection (kWh)
Freeze Protection as Percent of Total System (kWh)
Addy 17.07 3.43 % Montana 1.14 0.12 % Portland 24.58 7.42 % Tacoma 1.52 0.16 %
9
The box plots in the following sections show tank room temperature at the four sites. As shown in Figure 3, the middle line is the median temperature, the bottom of the box is the 25th percentile, and the top is the 75th percentile of the temperature readings. Readings outside this range are shown above and below the box. The box plots throughout the report follow this pattern.
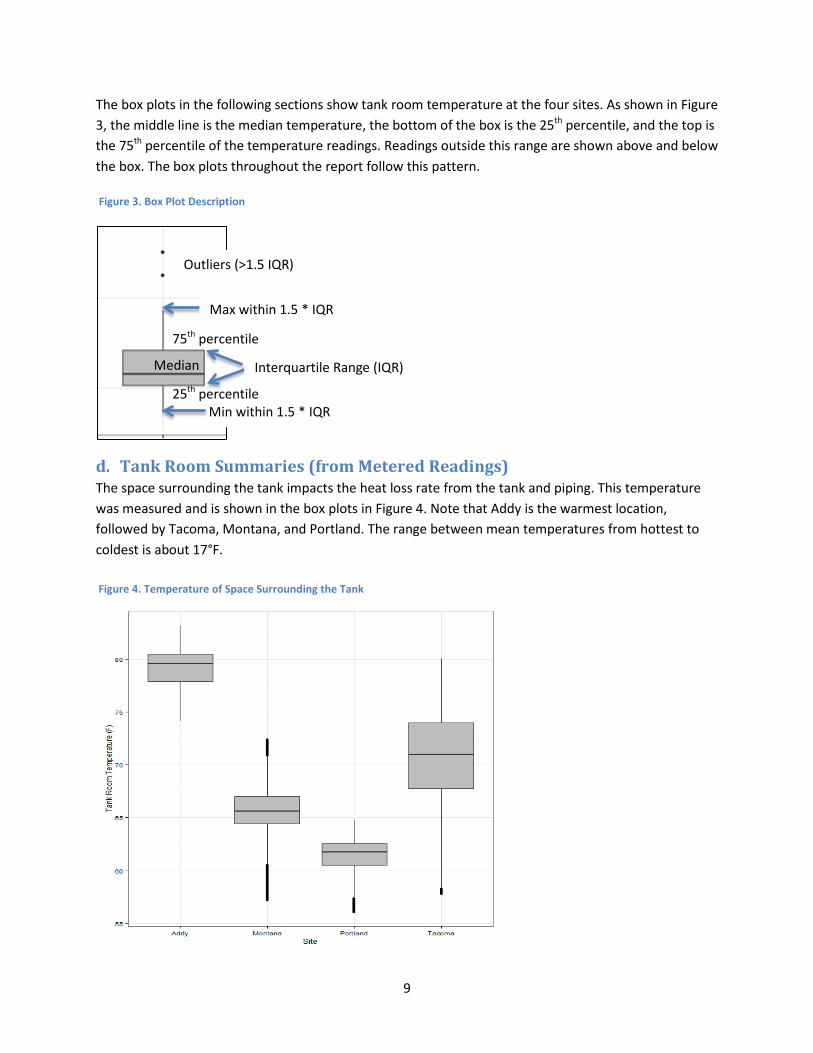
d. Tank Room Summaries (from Metered Readings) The space surrounding the tank impacts the heat loss rate from the tank and piping. This temperature was measured and is shown in the box plots in Figure 4. Note that Addy is the warmest location, followed by Tacoma, Montana, and Portland. The range between mean temperatures from hottest to coldest is about 17°F.
Figure 4. Temperature of Space Surrounding the Tank
Min within 1.5 * IQR
Outliers (>1.5 IQR)
Median Interquartile Range (IQR)
75th percentile
25th percentile
Max within 1.5 * IQR
Figure 3. Box Plot Description

10
The tank room temperature in Addy is due to the tank being located in a small, confined space under stairs in relatively close proximity to a propane gas stove in the family room, which is a primary heat source for the house and runs much of the time in winter. The tank space temperatures do not appear to have a major impact on the energy use per day, probably because a difference of a 20% (at most) change in tank heat loss rate within the context of greater energy impacts such as hot water use and proportionally greater heat loss through piping between draws is difficult to detect.
e. Household Water Temperatures (from Flow Event Averages) The box plot in Figure 5 shows the average cold water supply temperatures at each site. Logically, the lower the supply temperature, the harder the heat pump has to work to heat the water. The Addy system has the highest heat pump use per day and the coldest water, while the other cold weather system in Montana has lower daily use and its cold water supply is about 10°F warmer. But this relationship does not hold up for the coastal systems: Portland has a lower daily use than Tacoma but colder supply water.
Figure 5. Average Cold Water Supply Temperatures at Each Site
The reading of inlet water temperature is impacted by the sensor heating up due to its location in a pipe connected to a tank of very hot water. That pipe is heated by conduction from the water heater, and this masks the true temperature of the incoming water. This effect is reduced by requiring a minimum of three consecutive readings for calculating average temperatures. However, outliers caused by tank heating are still apparent in the temperatures used in the calculations, although the errors are lower than those that result from instantaneous temperatures.
11
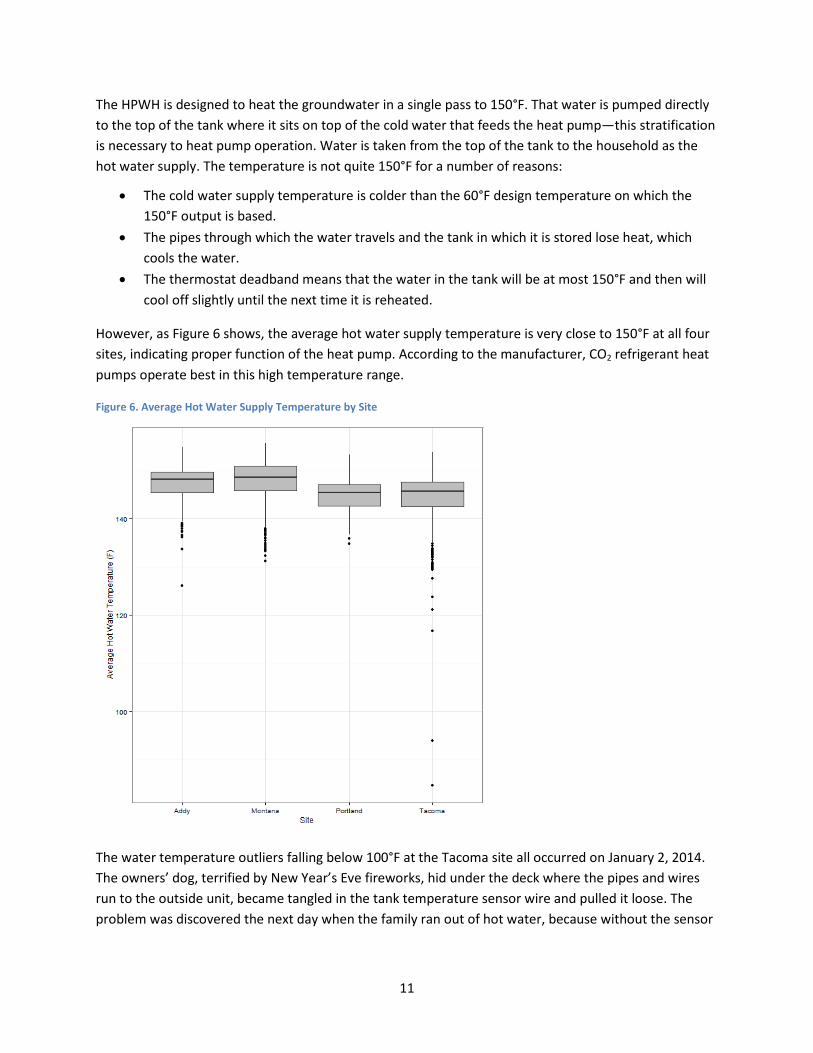
The HPWH is designed to heat the groundwater in a single pass to 150°F. That water is pumped directly to the top of the tank where it sits on top of the cold water that feeds the heat pump—this stratification is necessary to heat pump operation. Water is taken from the top of the tank to the household as the hot water supply. The temperature is not quite 150°F for a number of reasons:
• The cold water supply temperature is colder than the 60°F design temperature on which the 150°F output is based.
• The pipes through which the water travels and the tank in which it is stored lose heat, which cools the water.
• The thermostat deadband means that the water in the tank will be at most 150°F and then will cool off slightly until the next time it is reheated.
However, as Figure 6 shows, the average hot water supply temperature is very close to 150°F at all four sites, indicating proper function of the heat pump. According to the manufacturer, CO2 refrigerant heat pumps operate best in this high temperature range.
Figure 6. Average Hot Water Supply Temperature by Site
The water temperature outliers falling below 100°F at the Tacoma site all occurred on January 2, 2014. The owners’ dog, terrified by New Year’s Eve fireworks, hid under the deck where the pipes and wires run to the outside unit, became tangled in the tank temperature sensor wire and pulled it loose. The problem was discovered the next day when the family ran out of hot water, because without the sensor
12
signal, the system did not operate. The homeowner reconnected the wire and the system function was restored.
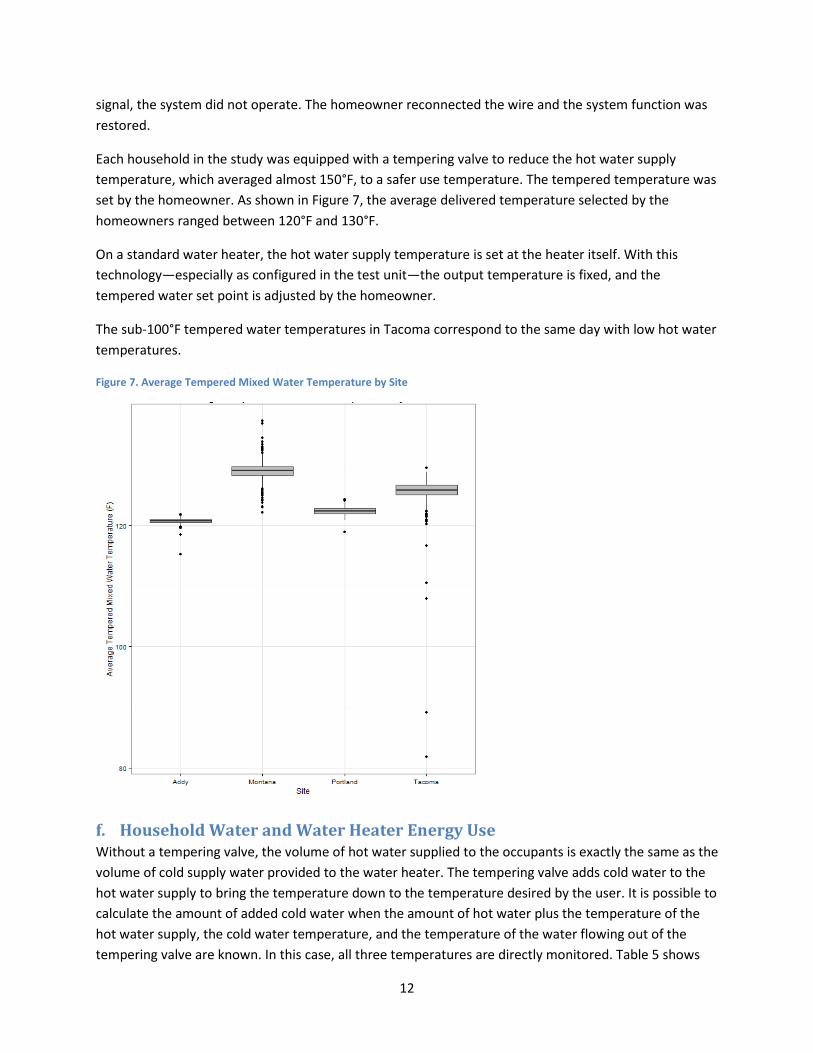
Each household in the study was equipped with a tempering valve to reduce the hot water supply temperature, which averaged almost 150°F, to a safer use temperature. The tempered temperature was set by the homeowner. As shown in Figure 7, the average delivered temperature selected by the homeowners ranged between 120°F and 130°F.
On a standard water heater, the hot water supply temperature is set at the heater itself. With this technology—especially as configured in the test unit—the output temperature is fixed, and the tempered water set point is adjusted by the homeowner.
The sub-100°F tempered water temperatures in Tacoma correspond to the same day with low hot water temperatures.
Figure 7. Average Tempered Mixed Water Temperature by Site
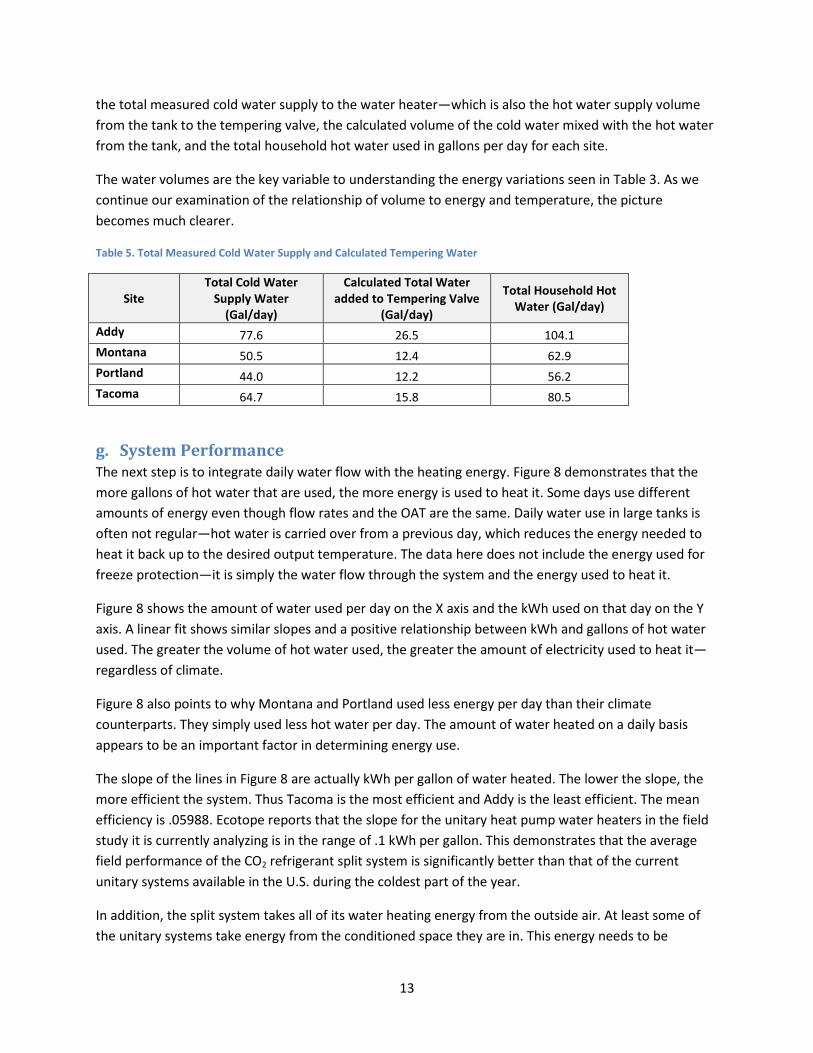
f. Household Water and Water Heater Energy Use Without a tempering valve, the volume of hot water supplied to the occupants is exactly the same as the volume of cold supply water provided to the water heater. The tempering valve adds cold water to the hot water supply to bring the temperature down to the temperature desired by the user. It is possible to calculate the amount of added cold water when the amount of hot water plus the temperature of the hot water supply, the cold water temperature, and the temperature of the water flowing out of the tempering valve are known. In this case, all three temperatures are directly monitored. Table 5 shows
13
the total measured cold water supply to the water heater—which is also the hot water supply volume from the tank to the tempering valve, the calculated volume of the cold water mixed with the hot water from the tank, and the total household hot water used in gallons per day for each site.
The water volumes are the key variable to understanding the energy variations seen in Table 3. As we continue our examination of the relationship of volume to energy and temperature, the picture becomes much clearer.
Table 5. Total Measured Cold Water Supply and Calculated Tempering Water
Site Total Cold Water
Supply Water (Gal/day)
Calculated Total Water added to Tempering Valve
(Gal/day)
Total Household Hot Water (Gal/day)
Addy 77.6 26.5 104.1 Montana 50.5 12.4 62.9 Portland 44.0 12.2 56.2 Tacoma 64.7 15.8 80.5
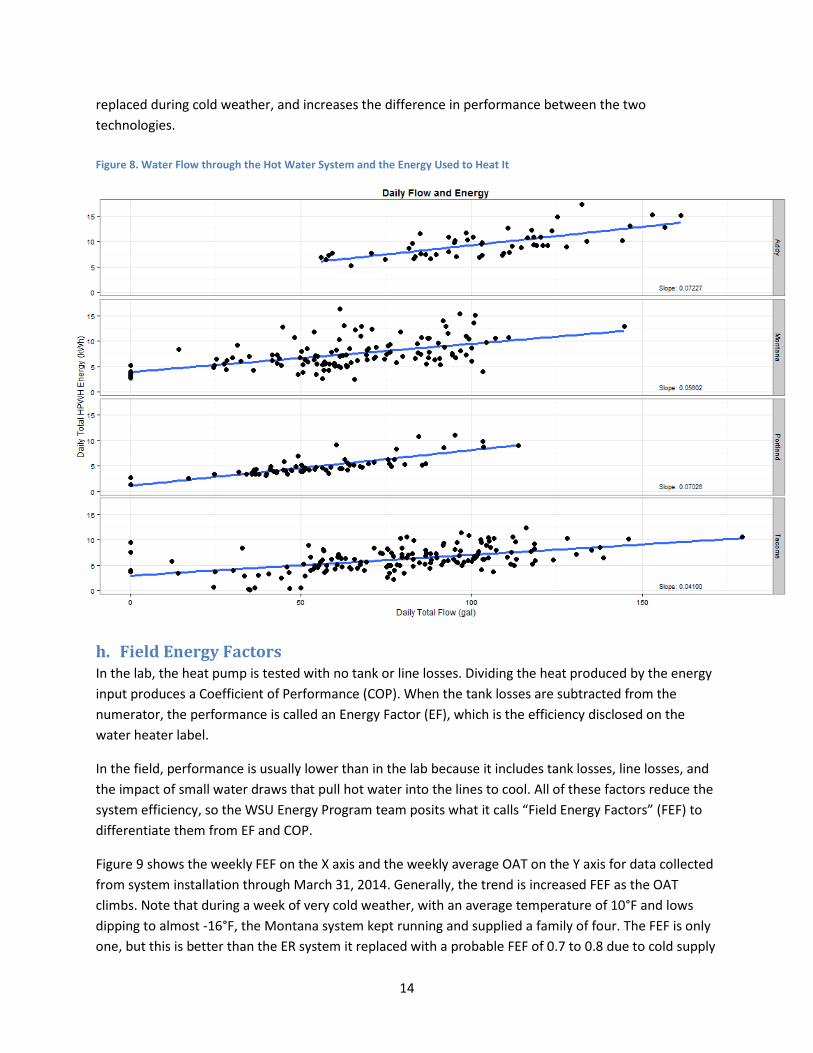
g. System Performance The next step is to integrate daily water flow with the heating energy. Figure 8 demonstrates that the more gallons of hot water that are used, the more energy is used to heat it. Some days use different amounts of energy even though flow rates and the OAT are the same. Daily water use in large tanks is often not regular—hot water is carried over from a previous day, which reduces the energy needed to heat it back up to the desired output temperature. The data here does not include the energy used for freeze protection—it is simply the water flow through the system and the energy used to heat it.
Figure 8 shows the amount of water used per day on the X axis and the kWh used on that day on the Y axis. A linear fit shows similar slopes and a positive relationship between kWh and gallons of hot water used. The greater the volume of hot water used, the greater the amount of electricity used to heat it—regardless of climate.
Figure 8 also points to why Montana and Portland used less energy per day than their climate counterparts. They simply used less hot water per day. The amount of water heated on a daily basis appears to be an important factor in determining energy use.
The slope of the lines in Figure 8 are actually kWh per gallon of water heated. The lower the slope, the more efficient the system. Thus Tacoma is the most efficient and Addy is the least efficient. The mean efficiency is .05988. Ecotope reports that the slope for the unitary heat pump water heaters in the field study it is currently analyzing is in the range of .1 kWh per gallon. This demonstrates that the average field performance of the CO2 refrigerant split system is significantly better than that of the current unitary systems available in the U.S. during the coldest part of the year.
In addition, the split system takes all of its water heating energy from the outside air. At least some of the unitary systems take energy from the conditioned space they are in. This energy needs to be
14
replaced during cold weather, and increases the difference in performance between the two technologies. Figure 8. Water Flow through the Hot Water System and the Energy Used to Heat It
h. Field Energy Factors In the lab, the heat pump is tested with no tank or line losses. Dividing the heat produced by the energy input produces a Coefficient of Performance (COP). When the tank losses are subtracted from the numerator, the performance is called an Energy Factor (EF), which is the efficiency disclosed on the water heater label.
In the field, performance is usually lower than in the lab because it includes tank losses, line losses, and the impact of small water draws that pull hot water into the lines to cool. All of these factors reduce the system efficiency, so the WSU Energy Program team posits what it calls “Field Energy Factors” (FEF) to differentiate them from EF and COP.
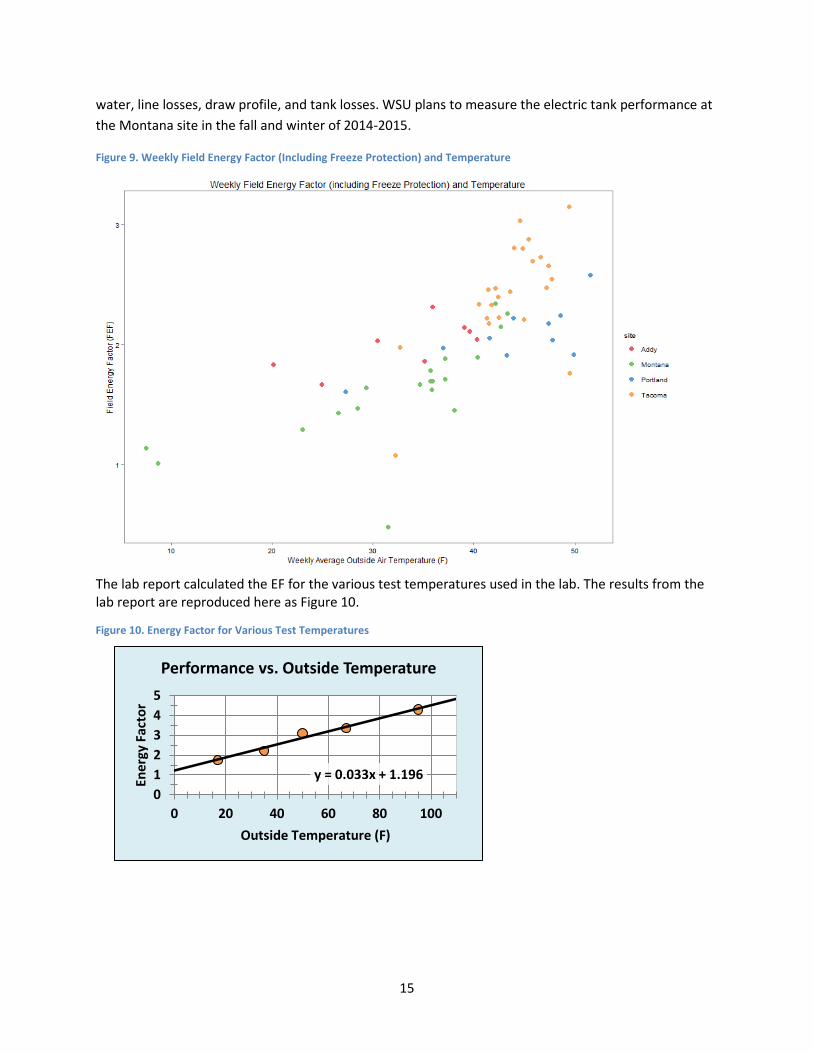
Figure 9 shows the weekly FEF on the X axis and the weekly average OAT on the Y axis for data collected from system installation through March 31, 2014. Generally, the trend is increased FEF as the OAT climbs. Note that during a week of very cold weather, with an average temperature of 10°F and lows dipping to almost -16°F, the Montana system kept running and supplied a family of four. The FEF is only one, but this is better than the ER system it replaced with a probable FEF of 0.7 to 0.8 due to cold supply
15
water, line losses, draw profile, and tank losses. WSU plans to measure the electric tank performance at the Montana site in the fall and winter of 2014-2015.
Figure 9. Weekly Field Energy Factor (Including Freeze Protection) and Temperature
The lab report calculated the EF for the various test temperatures used in the lab. The results from the lab report are reproduced here as Figure 10.
Figure 11. Results from the Lab Report
y = 0.033x + 1.196 012345
0 20 40 60 80 100
Ener
gy F
acto
r
Outside Temperature (F)
Performance vs. Outside Temperature
Figure 10. Energy Factor for Various Test Temperatures
16
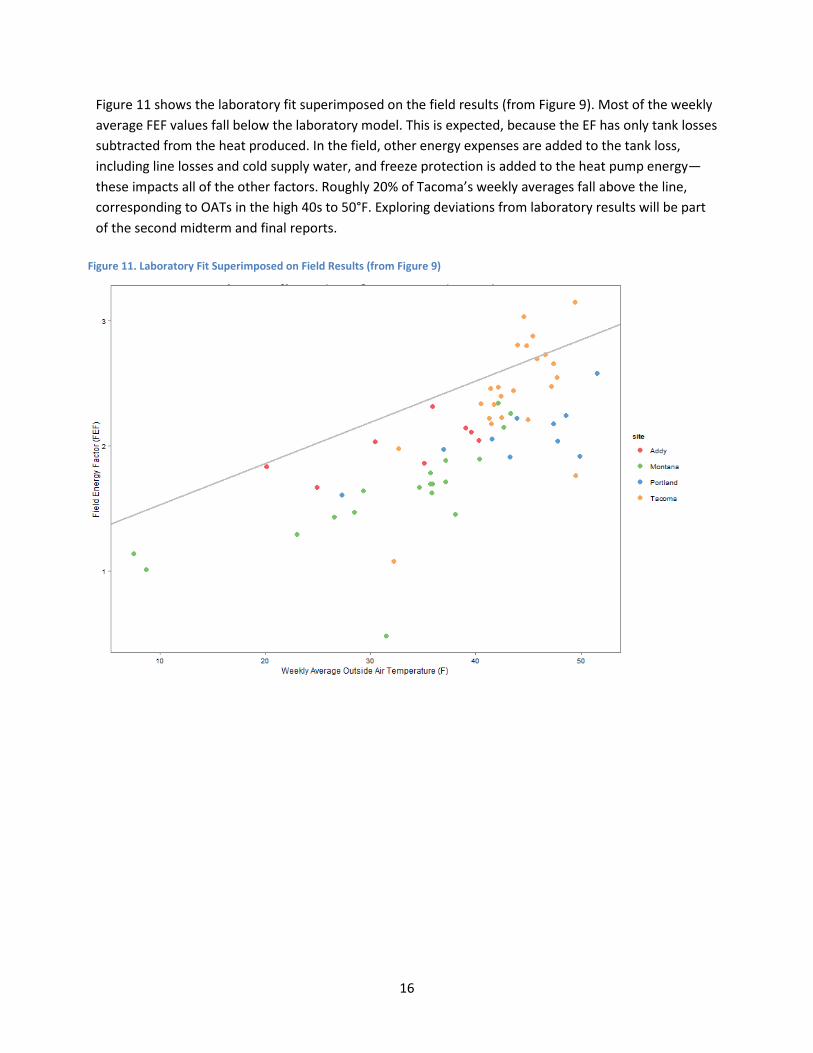
Figure 11 shows the laboratory fit superimposed on the field results (from Figure 9). Most of the weekly average FEF values fall below the laboratory model. This is expected, because the EF has only tank losses subtracted from the heat produced. In the field, other energy expenses are added to the tank loss, including line losses and cold supply water, and freeze protection is added to the heat pump energy—these impacts all of the other factors. Roughly 20% of Tacoma’s weekly averages fall above the line, corresponding to OATs in the high 40s to 50°F. Exploring deviations from laboratory results will be part of the second midterm and final reports.
Figure 11. Laboratory Fit Superimposed on Field Results (from Figure 9)
17
Conclusion and Recommendations The initial field test data on the Sanden GAU split system HPWH shows these systems can provide the hot water needs of a family of at least four without backup heat during a cold winter with low temperatures ranging from almost -16°F in Montana to the 20s in Portland and Tacoma.
The energy needed to heat water was an average of approximately .06 kWh per gallon used. This is 40% less than the energy needed by standard unitary heat pump water heaters according to recent analysis of a field study done by Ecotope. When it is considered that at least some of these standard units took energy from interior space, the actual difference is probably greater.
As the temperature climbed to weekly averages in the 40s, the FEF climbed to 2 and beyond. The Tacoma system reached a weekly FEF of 3 while the temperature averaged in the mid-40s. And the data hints at new performance levels as the weekly average temperature climbs above 50°F.
Many factors impact performance, but OAT appears to be a major factor. This is because the system requires less energy to heat water when the heat source, the outside air, is at a higher temperature. As is shown in Figure 9, the HPWH systems at the four locations perform differently under the same average temperature conditions. This may be explained by other factors such as cold water supply temperature, freeze protection energy use, and water use patterns. Future analysis will examine the impacts of these factors.
The large tank provides a buffer that accounts for differing energy use when viewed on a daily basis. The compressor can fill the tank with hot water one day and may not be called on to operate much the following day because the tank capacity provides most of the load. This is why the Tacoma family did not discover the problem with their sensor wire until the following day.
One of the most important factors of this research is the information it can provide to the manufacturer and to BPA on the future of this technology. Sanden is currently designing the product it plans to introduce in the U.S. in 2015. BPA needs to plan the best way to support this technology. Both Sanden and BPA benefit from the experience gained through this research.
During the latter part of 2014, the WSU Energy Program team will revisit all four sites and check the installations and monitoring equipment calibration. The issue with the freeze protection at the Addy and Portland sites will be explored and the systems corrected for the 2014-2015 winter. The result of these actions will be reported in the Second Midterm Field Report. WSU also plans to survey home owners about their experience with the systems and these results will be shared in the final report.

18
References Larson, B., 2013. Laboratory Assessment of Sanden GAU Heat Pump Water Heater Lab. A Report of BPA Technology Innovation Project #292. Prepared by Ecotope, Inc. for the WSU Energy Program under contract to BPA. September 18, 2013. http://www.energy.wsu.edu/documents/Sanden_CO2_split_HWPH_lab_report_Final_Sept%202013.pdf
Fluid Market Strategies and NEEA, 2013. Heat Pump Water Heater Field Study Report. October 22, 2013. http://neea.org/docs/default-source/reports/heat-pump-water-heater-field-study-report.pdf?sfvrsn=5