Embed Size (px)
Citation preview

Pearson Edexcel Level 3 Advanced Subsidiary and Advanced GCE Mathematics andFurther Mathematics
Mathematical formulae and statistical tables
First certification from 2018
Advanced Subsidiary GCE in Mathematics (8MA0)
Advanced GCE in Mathematics (9MA0)
Advanced Subsidiary GCE in Further Mathematics (8FM0)
First certification from 2019
Advanced GCE in Further Mathematics (9FM0)
This copy is the property of Pearson. It is not to be removed from the examination room or marked in any way.
P54458A©2017 Pearson Education Ltd.1/1/1/1/1/1/
exemplar
exemplar
DRAFT
DRAFT

Edexcel, BTEC and LCCI qualifications
Edexcel, BTEC and LCCI qualifications are awarded by Pearson, the UK’s largest awarding body offering academic and vocational qualifications that are globally recognised and benchmarked. For further information, please visit our qualification website at qualifications.pearson.com. Alternatively, you can get in touch with us using the details on our contact us page at qualifications.pearson.com/contactus
About Pearson
Pearson is the world’s leading learning company, with 35,000 employees in more than 70 countries working to help people of all ages to make measurable progress in their lives through learning. We put the learner at the centre of everything we do, because wherever learning flourishes, so do people. Find out more about how we can help you and your learners at qualifications.pearson.com
References to third party material made in this sample assessment materials are made in good faith. Pearson does not endorse, approve or accept responsibility for the content of materals, which may be subject to change, or any opinions expressed therein. (Material may include textbooks, journals, magazines and other publications and websites.)
All information in this document is correct at time of publication.
ISBN 978 1 4469 4857 6
© Pearson Education Limited 2017
exemplar
exemplar
DRAFT
DRAFT

Contents
Introduction 11 AS Mathematics 3Pure Mathematics 3Statistics 3Mechanics 4
2 A Level Mathematics 5Pure Mathematics 5Statistics 7Mechanics 8
3 AS Further Mathematics 9Pure Mathematics 9Statistics 13Mechanics 15
4 A Level Further Mathematics 17Pure Mathematics 17Statistics 23Mechanics 27
5 Statistical Tables 29Binomial Cumulative Distribution Function 29Percentage Points of The Normal Distribution 34Poisson Cumulative Distribution Function 35Percentage Points of the χ2 Distribution 36Critical Values for Correlation Coefficients 37Random Numbers 38Percentage Points of Student’s t Distribution 39Percentage Points of the F Distribution 40
exemplar
exemplar
DRAFT
DRAFT

exemplar
exemplar
DRAFT
DRAFT

1Pearson Edexcel Level 3 Advanced Subsidiary and Advanced GCE in Mathematics and Further Mathematics Mathematical Formulae and Statistical Tables – Issue 1 – July 2017 – © Pearson Education Limited 2017
IntroductionThe formulae in this booklet have been arranged by qualification. Students sitting AS or A Level Further Mathematics papers may be required to use the formulae that were introduced in AS or A Level Mathematics papers.
It may also be the case that students sitting Mechanics and Statistics papers will need to use formulae introduced in the appropriate Pure Mathematics papers for the qualification they are sitting.
exemplar
exemplar
DRAFT
DRAFT

2 Pearson Edexcel Level 3 Advanced Subsidiary and Advanced GCE in Mathematics and Further Mathematics Mathematical Formulae and Statistical Tables – Issue 1 – July 2017 – © Pearson Education Limited 2017
exemplar
exemplar
DRAFT
DRAFT

3Pearson Edexcel Level 3 Advanced Subsidiary and Advanced GCE in Mathematics and Further Mathematics Mathematical Formulae and Statistical Tables – Issue 1 – July 2017 – © Pearson Education Limited 2017
1 AS Mathematics
Pure Mathematics
Mensuration
Surface area of sphere = 4πr2
Area of curved surface of cone = πr × slant height
Binomial series
(a + b)n = an + n1
an–1b + n2
an–2b2 + . . . + nr
an–rb r + . . . + bn (n ∈ )
where nr
= nCr = n
r n r!
!( )!−
Logarithms and exponentials
loga x = loglog
b
b
xa
ex ln a = ax
Differentiation
First Principles
′ = + −→
f f f( ) lim ( ) ( )x x h xh h0
Statistics
Probability
P P( ) ( )′ = −A A1
Standard deviation
Standard deviation = √(Variance)
Interquartile range = IQR = Q3 – Q1
For a set of n values x1, x2, . . . xi, . . . xn
Sxx = Σ(xi – x)2 = Σxi2 –
2(Σ )ixn
1
exemplar
exemplar
DRAFT
DRAFT
4 Pearson Edexcel Level 3 Advanced Subsidiary and Advanced GCE in Mathematics and Further Mathematics Mathematical Formulae and Statistical Tables – Issue 1 – July 2017 – © Pearson Education Limited 2017
Standard deviation = Sxx
n or
xn
x2
2∑ −
Statistical tables
The following statistical tables are required for A Level Mathematics:
Binomial Cumulative Distribution Function (see page 29)
Random Numbers (see page 38)
Mechanics
Kinematics
For motion in a straight line with constant acceleration:
v = u + at
s = ut + 12 at 2
s = vt – 12 at 2
v2 = u2 + 2as
s = 12 (u + v)t
exemplar
exemplar
DRAFT
DRAFT

5Pearson Edexcel Level 3 Advanced Subsidiary and Advanced GCE in Mathematics and Further Mathematics Mathematical Formulae and Statistical Tables – Issue 1 – July 2017 – © Pearson Education Limited 2017
2 A Level Mathematics
Pure Mathematics
Mensuration
Surface area of sphere = 4πr2
Area of curved surface of cone = πr × slant height
Arithmetic series
Sn = 12 n(a + l ) = 1
2 n[2a + (n – 1)d]
Binomial series
(a + b)n = an + n1
an–1b + n2
an–2b2 + . . . + nr
an–rb r + . . . + bn (n ∈ )
where nr
= nCr = n
r n r!
!( )!−
(1 + x)n = 1 + nx + n n( )−
×1
1 2x2 + . . . +
n n n rr
( )...( )...
− − +× × ×1 1
1 2xr + . . . (½ x ½ < 1, n ∈ )
Logarithms and exponentials
loga x = loglog
b
b
xa
ex ln a = ax
Geometric series
Sn = a r
r
n( )11
−−
S∞ = ar1 −
for ½ r ½ < 1
2
exemplar
exemplar
DRAFT
DRAFT

6 Pearson Edexcel Level 3 Advanced Subsidiary and Advanced GCE in Mathematics and Further Mathematics Mathematical Formulae and Statistical Tables – Issue 1 – July 2017 – © Pearson Education Limited 2017
Trigonometric identities
sin(A ± B) = sin A cosB ± cosA sinB
cos(A ± B) = cosA cosB sin A sinB
tan(A ± B) = tan tan
tan tanA B
A B±
1 (A ± B ≠ (k + 1
2 )π)
sin A + sinB = 2sin A B A B+ −2 2
cos
sin A – sinB = 2cos A B A B+ −2 2
sin
cosA + cosB = 2cos A B A B+ −2 2
cos
cosA – cosB = –2sin A B A B+ −2 2
sin
Small angle approximations
sin θ ≈ θ
cos θ ≈ 1 – 2
2θ
tan θ ≈ θ
where θ is measured in radians
Differentiation
First Principles
′ = + −→
f f f( ) lim ( ) ( )x x h xh h0
f (x) f ′(x)
tan kx k sec2 kx
sec kx k sec kx tan kx
cot kx –k cosec2 kx
cosec kx –k cosec kx cot kx
fg
( )( )xx
′ − ′f g f g(g
( ) ( ) ( ) ( )( ))
x x x xx 2
exemplar
exemplar
DRAFT
DRAFT

7Pearson Edexcel Level 3 Advanced Subsidiary and Advanced GCE in Mathematics and Further Mathematics Mathematical Formulae and Statistical Tables – Issue 1 – July 2017 – © Pearson Education Limited 2017
Integration (+ constant)
f (x) ∫f (x) dx
sec2 kx 1k
tan kx
tan kx 1k
ln ½sec kx½
cot kx 1k
ln ½sin kx½
cosec kx –1k
ln ½cosec kx + cot kx½, 1k
ln ½tan ( 12 kx)½
sec kx 1k
ln ½sec kx + tan kx½, 1k
ln ½tan ( 12 kx + 1
4 π)½
∫u ddvx
dx = uv – ∫vddux
dx
Numerical Methods
The trapezium rule: ya
b
∫ dx ≈ 12 h{( y0 + yn) + 2(y1 + y2 + . . . + yn–1)}, where h =
b an−
The Newton-Raphson iteration for solving f (x) = 0 : xn+1 = xn – ff
( )( )xxn
n′
Statistics
Probability
P P( ) ( )′ = −A A1
P(A ∪ B) = P(A) + P(B) – P(A ∩ B)
P(A ∩ B) = P(A)P(B ½ A)
P(A ½ B) = P P
P P P P( ) ( )
( ) ( ) ( ) ( )B A A
B A A B A A|
| |+ ′ ′
For independent events A and B,
P(B ½ A) = P(B) P(A ½ B) = P(A) P(A ∩ B) = P(A) P(B)
2
exemplar
exemplar
DRAFT
DRAFT

8 Pearson Edexcel Level 3 Advanced Subsidiary and Advanced GCE in Mathematics and Further Mathematics Mathematical Formulae and Statistical Tables – Issue 1 – July 2017 – © Pearson Education Limited 2017
Standard deviation
Standard deviation = √(Variance)
Interquartile range = IQR = Q3 – Q1
For a set of n values x1, x2, . . . xi, . . . xn
Sxx = Σ(xi – x)2 = Σxi2 –
2(Σ )ixn
Standard deviation = Sxx
n or
xn
x2
2∑ −
Discrete distributions
Distribution of X P(X = x) Mean Variance
Binomial B(n, p)nx
px (1 – p)n–x np np(1 – p)
Sampling distributions
For a random sample of n observations from N(μ, σ2)
/X μσ n
− ~ N(0, 1)
Statistical tables
The following statistical tables are required for A Level Mathematics:
Binomial Cumulative Distribution Function (see page 29)
Percentage Points of The Normal Distribution (see page 34)
Critical Values for Correlation Coefficients: Product Moment Coefficient (see page 37)
Random Numbers (see page 38)
Mechanics
Kinematics
For motion in a straight line with constant acceleration:
v = u + at
s = ut + 12 at 2
s = vt – 12 at 2
v2 = u2 + 2as
s = 12 (u + v)t
exemplar
exemplar
DRAFT
DRAFT

9Pearson Edexcel Level 3 Advanced Subsidiary and Advanced GCE in Mathematics and Further Mathematics Mathematical Formulae and Statistical Tables – Issue 1 – July 2017 – © Pearson Education Limited 2017
3 AS Further MathematicsStudents sitting an AS Level Further Mathematics paper may also require those formulae listed forA Level Mathematics in Section 2.
Pure Mathematics
Summations
rr
n2
1=∑ = 1
6 n(n + 1)(2n + 1)
rr
n3
1=∑ = 1
4 n2(n + 1)2
Matrix transformations
Anticlockwise rotation through θ about O : cos sinsin cosθ θθ θ
−
Reflection in the line y = (tanθ)x : cos 2 sin 2sin 2 cos 2
θ θθ θ
−
Area of a sector
A = 12 ∫r2 dθ (polar coordinates)
Complex numbers
{r(cosθ + isinθ)}n = rn (cosnθ + isinnθ)
The roots of zn = 1 are given by z = e2 iπkn , for k = 0, 1, 2, . . ., n – 1
3
exemplar
exemplar
DRAFT
DRAFT

10 Pearson Edexcel Level 3 Advanced Subsidiary and Advanced GCE in Mathematics and Further Mathematics Mathematical Formulae and Statistical Tables – Issue 1 – July 2017 – © Pearson Education Limited 2017
Maclaurin’s and Taylor’s Series
f (x) = f(0) + x f ′(0) + x2
2!f ′′(0) + . . . +
xr
r
!f (r)(0) + . . .
ex = exp(x) = 1 + x + x2
2! + . . . +
xr
r
! + . . . for all x
ln(1 + x) = x – x2
2 +
x3
3 – . . . + (–1)r+1
xr
r
+ . . . (–1 < x 1)
sin x = x – x3
3! +
x5
5! – . . . + (–1)r
xr
r2 1
2 1
+
+( )! + . . . for all x
cos x = 1 – x2
2! +
x4
4! – . . . + (–1)r
xr
r2
2( )! + . . . for all x
arctan x = x – x3
3 +
x5
5 – . . . + (–1)r
xr
r2 1
2 1
+
+ + . . . (–1 x 1)
Vectors
Vector product: a × b = ½a½½b½sinθ n̂ = i j ka a ab b b
a b a ba b a ba b a b
1 2 3
1 2 3
2 3 3 2
3 1 1 3
1 2 2 1
=−−−
a.(b × c) = a a ab b bc c c
1 2 3
1 2 3
1 2 3
= b.(c × a) = c.(a × b)
If A is the point with position vector a = a1i + a2 j + a3k and the direction vector b is given by b = b1i + b2 j + b3k, then the straight line through A with direction vector b has cartesian equation
31 2
1 2 3
( )z ax a y a λb b b
−− −= = =
The plane through A with normal vector n = n1i + n2 j + n3k has cartesian equation
n1x + n2 y + n3z + d = 0 where d = –a.n
The plane through non-collinear points A, B and C has vector equation
r = a + λ(b – a) + μ(c – a) = (1 – λ – μ)a + λb + μc
The plane through the point with position vector a and parallel to b and c has equation
r = a + sb + tc
The perpendicular distance of (α, β, γ) from n1x + n2 y + n3z + d = 0 is 1 2 3
2 2 21 2 3
n α n β n γ d
n n n
+ + +
+ +.
exemplar
exemplar
DRAFT
DRAFT
11Pearson Edexcel Level 3 Advanced Subsidiary and Advanced GCE in Mathematics and Further Mathematics Mathematical Formulae and Statistical Tables – Issue 1 – July 2017 – © Pearson Education Limited 2017
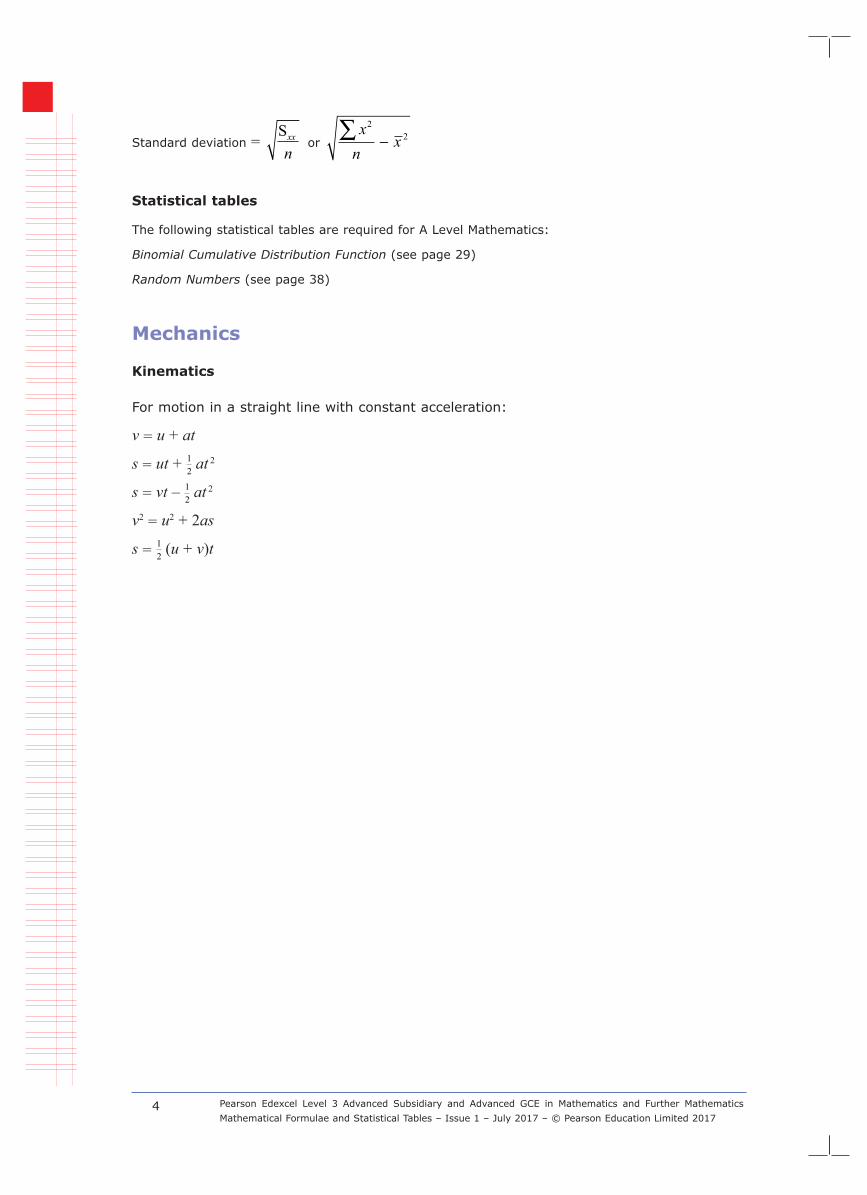
Hyperbolic functions
cosh2 x – sinh2 x =1
sinh 2x = 2sinh x cosh x
cosh 2x = cosh2 x + sinh2 x
arcosh x = ln{x + x2 1− } (x 1)
arsinh x = ln{x + x2 1+ }
artanh x = 12 ln 1
1+−
xx
(½x½ < 1)
Differentiation
f (x) f ′(x)
arcsin x 1
1 2− x
arccos x – 1
1 2− x
arctan x 11 2+ x
sinh x cosh x
cosh x sinh x
tanh x sech2 x
arsinh x 1
1 2+ x
arcosh x 1
12x −
artanh x 11 2− x
3
exemplar
exemplar
DRAFT
DRAFT

12 Pearson Edexcel Level 3 Advanced Subsidiary and Advanced GCE in Mathematics and Further Mathematics Mathematical Formulae and Statistical Tables – Issue 1 – July 2017 – © Pearson Education Limited 2017
Integration (+ constant; a > 0 where relevant)
f (x) ∫ f (x) dx
sinh x cosh x
cosh x sinh x
tanh x lncosh x
12 2a x−
arcsin xa
(½x½ < a)
12 2a x+
1a
arctan xa
12 2x a−
arcosh xa
, ln{x + x a2 2− } (x > a)
12 2a x+
arsinh xa
, ln{x + x a2 2+ }
12 2a x−
1
2aln
a xa x
+−
= 1a
artanh xa
(½x½ < a)
12 2x a−
1
2aln
x ax a
−+
exemplar
exemplar
DRAFT
DRAFT

13Pearson Edexcel Level 3 Advanced Subsidiary and Advanced GCE in Mathematics and Further Mathematics Mathematical Formulae and Statistical Tables – Issue 1 – July 2017 – © Pearson Education Limited 2017
Statistics
Discrete distributions
For a discrete random variable X taking values xi with probabilities P(X = xi)
Expectation (mean): E(X ) = μ = Σxi P(X = xi)
Variance: Var(X ) = σ2 = Σ(xi – μ)2 P(X = xi) = Σ x2i P(X = xi) – μ2
Discrete distributions
Standard discrete distributions:
Distribution of X P(X = x) Mean Variance
Binomial B(n, p)nx
px (1 – p)n–x np np(1 – p)
Poisson Po(λ) e!
xλ λx
− λ λ
Continuous distributions
For a continuous random variable X having probability density function f
Expectation (mean): E(X ) = μ = ∫x f(x) dx
Variance: Var(X ) = σ2 = ∫ (x – μ)2 f(x) dx = ∫x2 f(x) dx – μ2
For a function g(X ): E(g(X )) = ∫g(x) f(x) dx
Cumulative distribution function: F(x0) = P(X x0) = #x0
−∞
f (t) dt
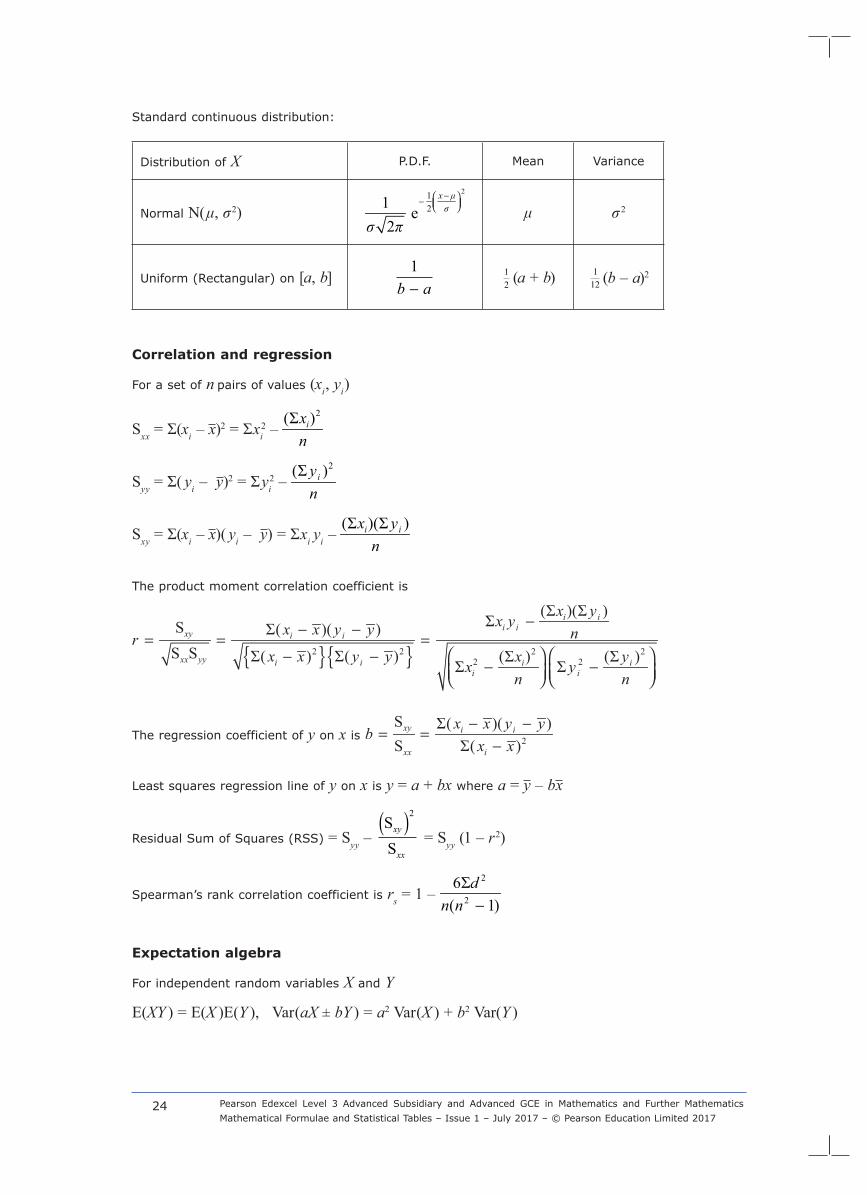
Standard continuous distribution:
Distribution of X P.D.F. Mean Variance
Normal N(μ, σ2)21
21 e2
x μσ
σ π
− − μ σ2
Uniform (Rectangular) on [a, b]1
b a−12(a + b) 1
12 (b – a)2
3
exemplar
exemplar
DRAFT
DRAFT

14 Pearson Edexcel Level 3 Advanced Subsidiary and Advanced GCE in Mathematics and Further Mathematics Mathematical Formulae and Statistical Tables – Issue 1 – July 2017 – © Pearson Education Limited 2017
Correlation and regression
For a set of n pairs of values (xi, yi)
Sxx = Σ(xi – x)2 = Σxi2 –
2(Σ )ixn
Syy = Σ( yi – y)2 = Σyi2 –
2(Σ )iyn
Sxy = Σ(xi – x)( yi – y) = Σxi yi – (Σ )(Σ )i ix y
n
The product moment correlation coefficient is
{ }{ }2 2 2 22 2
(Σ )(Σ )ΣS Σ( )( )S S Σ( ) Σ( ) (Σ ) (Σ )Σ Σ
−− −= = =
− −− −
i ii i
xy i i
xx yy i i i ii i
x yx yx x y y nrx x y y x yx y
n n
The regression coefficient of y on x is 2
S Σ( )( )S Σ( )
− −= =
−xy i i
xx i
x x y ybx x
Least squares regression line of y on x is y = a + bx where a = y – bx
Residual Sum of Squares (RSS) = Syy – SS
xy
xx
( )2
= Syy (1 – r2)
Spearman’s rank correlation coefficient is rS = 1 – 2
2
6Σ( 1)d
n n −
Non-parametric tests
Goodness-of-fit test and contingency tables: ( )O E
Ei i
i
−∑2
~ χ2v
Statistical tables
The following statistical tables are required for AS Level Further Mathematics:
Binomial Cumulative Distribution Function (see page 29)
Poisson Cumulative Distribution Function (see page 35)
Percentage Points of the χ2 Distribution (see page 36)
Critical Values for Correlation Coefficients: Product Moment Coefficient and Spearman’s Coefficient (see page 37)
Random Numbers (see page 38)
exemplar
exemplar
DRAFT
DRAFT
15Pearson Edexcel Level 3 Advanced Subsidiary and Advanced GCE in Mathematics and Further Mathematics Mathematical Formulae and Statistical Tables – Issue 1 – July 2017 – © Pearson Education Limited 2017
Mechanics
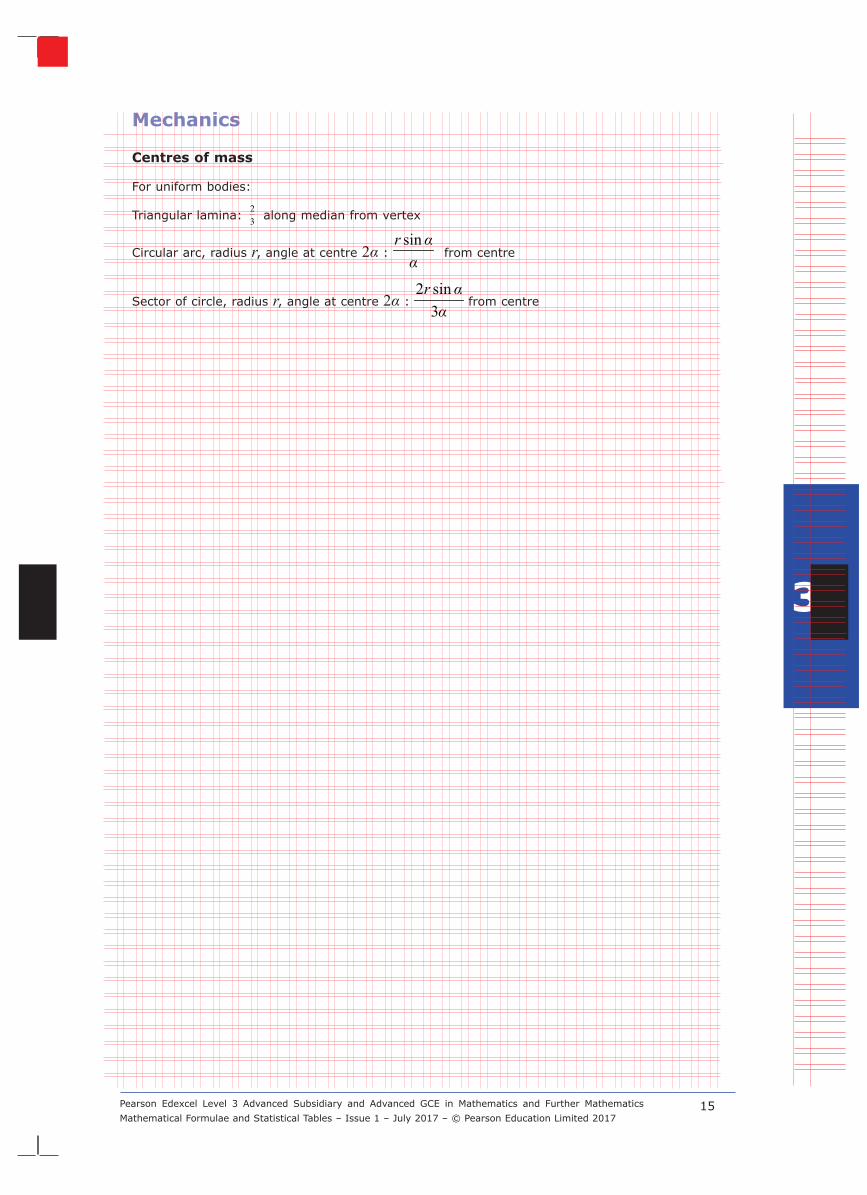
Centres of mass
For uniform bodies:
Triangular lamina: 23 along median from vertex
Circular arc, radius r, angle at centre 2α : sinr αα from centre
Sector of circle, radius r, angle at centre 2α : 2 sin3r αα
from centre
3
exemplar
exemplar
DRAFT
DRAFT

16 Pearson Edexcel Level 3 Advanced Subsidiary and Advanced GCE in Mathematics and Further Mathematics Mathematical Formulae and Statistical Tables – Issue 1 – July 2017 – © Pearson Education Limited 2017
exemplar
exemplar
DRAFT
DRAFT

17Pearson Edexcel Level 3 Advanced Subsidiary and Advanced GCE in Mathematics and Further Mathematics Mathematical Formulae and Statistical Tables – Issue 1 – July 2017 – © Pearson Education Limited 2017
4 A Level Further MathematicsStudents sitting an A Level Further Mathematics paper may also require those formulae listed for A Level Mathematics in Section 2.
Pure Mathematics
Summations
rr
n2
1=∑ = 1
6 n(n + 1)(2n + 1)
rr
n3
1=∑ = 1
4 n2(n + 1)2
Matrix transformations
Anticlockwise rotation through θ about O : cos sinsin cosθ θθ θ
−
Reflection in the line y = (tanθ)x : cos 2 sin 2sin 2 cos 2
θ θθ θ
−
Area of a sector
A = 12 ∫r2 dθ (polar coordinates)
Complex numbers
{r(cosθ + isinθ)}n = rn (cosnθ + isinnθ)
The roots of zn = 1 are given by z = e2 iπkn , for k = 0, 1, 2, . . ., n – 1
4exemplar
exemplar
DRAFT
DRAFT
18 Pearson Edexcel Level 3 Advanced Subsidiary and Advanced GCE in Mathematics and Further Mathematics Mathematical Formulae and Statistical Tables – Issue 1 – July 2017 – © Pearson Education Limited 2017
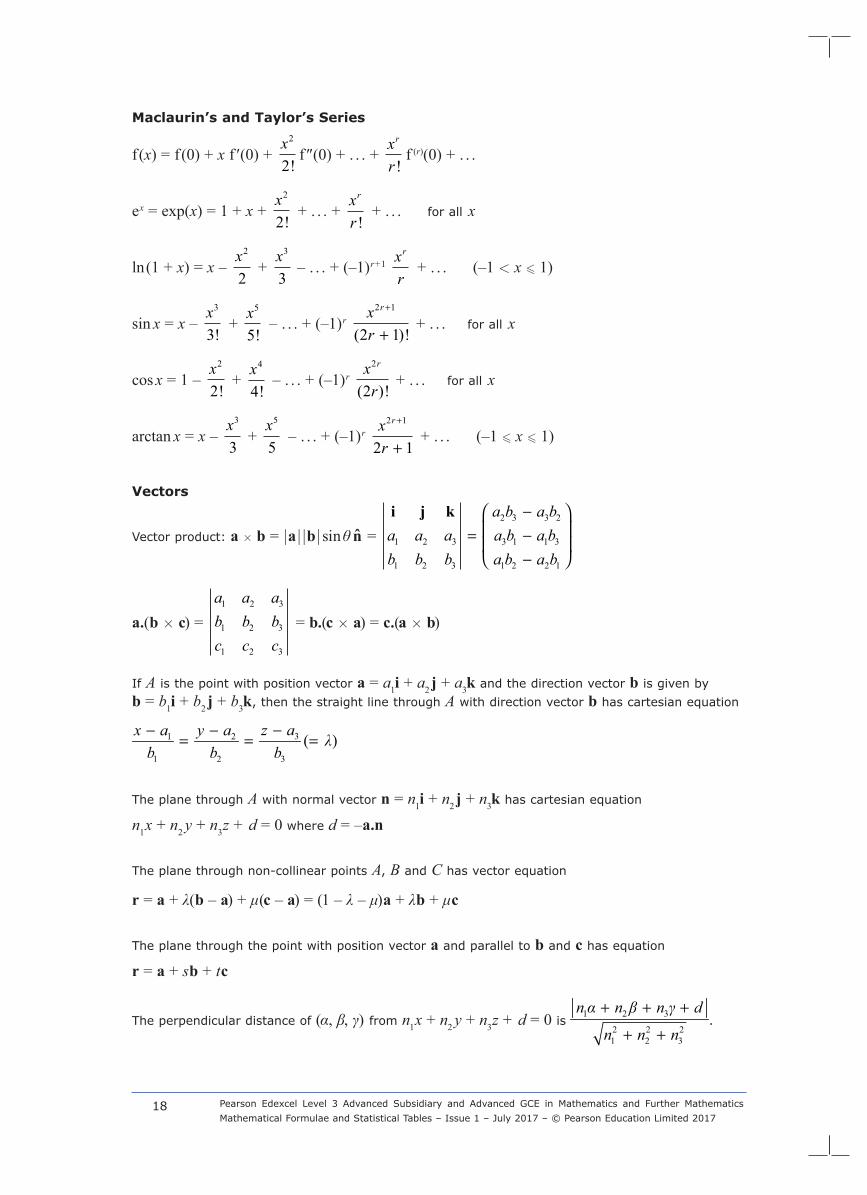
Maclaurin’s and Taylor’s Series
f (x) = f(0) + x f ′(0) + x2
2!f ′′(0) + . . . +
xr
r
!f (r)(0) + . . .
ex = exp(x) = 1 + x + x2
2! + . . . +
xr
r
! + . . . for all x
ln(1 + x) = x – x2
2 +
x3
3 – . . . + (–1)r+1
xr
r
+ . . . (–1 < x 1)
sin x = x – x3
3! +
x5
5! – . . . + (–1)r
xr
r2 1
2 1
+
+( )! + . . . for all x
cos x = 1 – x2
2! +
x4
4! – . . . + (–1)r
xr
r2
2( )! + . . . for all x
arctan x = x – x3
3 +
x5
5 – . . . + (–1)r
xr
r2 1
2 1
+
+ + . . . (–1 x 1)
Vectors
Vector product: a × b = ½a½½b½sinθ n̂ = i j ka a ab b b
a b a ba b a ba b a b
1 2 3
1 2 3
2 3 3 2
3 1 1 3
1 2 2 1
=−−−
a.(b × c) = a a ab b bc c c
1 2 3
1 2 3
1 2 3
= b.(c × a) = c.(a × b)
If A is the point with position vector a = a1i + a2 j + a3k and the direction vector b is given by b = b1i + b2 j + b3k, then the straight line through A with direction vector b has cartesian equation
31 2
1 2 3
( )z ax a y a λb b b
−− −= = =
The plane through A with normal vector n = n1i + n2 j + n3k has cartesian equation
n1x + n2 y + n3z + d = 0 where d = –a.n
The plane through non-collinear points A, B and C has vector equation
r = a + λ(b – a) + μ(c – a) = (1 – λ – μ)a + λb + μc
The plane through the point with position vector a and parallel to b and c has equation
r = a + sb + tc
The perpendicular distance of (α, β, γ) from n1x + n2 y + n3z + d = 0 is 1 2 3
2 2 21 2 3
n α n β n γ d
n n n
+ + +
+ +.
exemplar
exemplar
DRAFT
DRAFT

19Pearson Edexcel Level 3 Advanced Subsidiary and Advanced GCE in Mathematics and Further Mathematics Mathematical Formulae and Statistical Tables – Issue 1 – July 2017 – © Pearson Education Limited 2017
Hyperbolic functions
cosh2 x – sinh2 x =1
sinh 2x = 2sinh x cosh x
cosh 2x = cosh2 x + sinh2 x
arcosh x = ln{x + x2 1− } (x 1)
arsinh x = ln{x + x2 1+ }
artanh x = 12 ln 1
1+−
xx
(½x½ < 1)
Conics
Ellipse Parabola HyperbolaRectangular Hyperbola
Standard Formxa
yb
2
2
2
2 1+ = y2 = 4ax xa
yb
2
2
2
2 1− = xy = c2
Parametric Form (a cosθ, b sinθ) (at2, 2at) (a secθ, b tanθ) (±a coshθ, b sinhθ)
ct ct
,
Eccentricity e < 1 b2 = a2 (1 – e2)
e = 1 e > 1 b2 = a2 (e2 – 1) e = 2
Foci (±ae, 0) (a, 0) (±ae, 0) (± 2 c, ± 2 c)
Directrices x = ±ae
x = –a x = ±ae x + y = ± 2 c
Asymptotes none nonexa
yb
= ± x = 0, y = 0
4exemplar
exemplar
DRAFT
DRAFT

20 Pearson Edexcel Level 3 Advanced Subsidiary and Advanced GCE in Mathematics and Further Mathematics Mathematical Formulae and Statistical Tables – Issue 1 – July 2017 – © Pearson Education Limited 2017
Differentiation
f (x) f ′(x)
arcsin x 1
1 2− x
arccos x – 1
1 2− x
arctan x 11 2+ x
sinh x cosh x
cosh x sinh x
tanh x sech2 x
arsinh x 1
1 2+ x
arcosh x 1
12x −
artanh x 11 2− x
exemplar
exemplar
DRAFT
DRAFT

21Pearson Edexcel Level 3 Advanced Subsidiary and Advanced GCE in Mathematics and Further Mathematics Mathematical Formulae and Statistical Tables – Issue 1 – July 2017 – © Pearson Education Limited 2017
Integration (+ constant; a > 0 where relevant)
f (x) ∫ f (x) dx
sinh x cosh x
cosh x sinh x
tanh x lncosh x
12 2a x−
arcsin xa
(½x½ < a)
12 2a x+
1a
arctan xa
12 2x a−
arcosh xa
, ln{x + x a2 2− } (x > a)
12 2a x+
arsinh xa
, ln{x + x a2 2+ }
12 2a x−
1
2aln
a xa x
+−
= 1a
artanh xa
(½x½ < a)
12 2x a−
1
2aln
x ax a
−+
Arc length
s yx
x= +
# 1
2dd
d (cartesian coordinates)
s xt
yt
t=
+
# d
ddd
d2 2
(parametric form)
22 d d
d = + rs r θθ# (polar form) 4ex
emplar
exemplar
DRAFT
DRAFT

22 Pearson Edexcel Level 3 Advanced Subsidiary and Advanced GCE in Mathematics and Further Mathematics Mathematical Formulae and Statistical Tables – Issue 1 – July 2017 – © Pearson Education Limited 2017
Surface area of revolution
2d2 1 dd
= + x
ys π y xx# (cartesian coordinates)
2 2d d2 dd d
= + xx ys π y tt t# (parametric form)
22 d2 sin d
d = + xrs π r θ r θθ# (polar form)
exemplar
exemplar
DRAFT
DRAFT

23Pearson Edexcel Level 3 Advanced Subsidiary and Advanced GCE in Mathematics and Further Mathematics Mathematical Formulae and Statistical Tables – Issue 1 – July 2017 – © Pearson Education Limited 2017
Statistics
Discrete distributions
For a discrete random variable X taking values xi with probabilities P(X = xi)
Expectation (mean): E(X ) = μ = Σxi P(X = xi)
Variance: Var(X ) = σ2 = Σ(xi – μ)2 P(X = xi) = Σ x2i P(X = xi) – μ2
For a function g(X ): E(g(X )) = Σg(xi) P(X = xi)
The probability generating function of X is GX(t) = E(tX ) and
E(X ) = G′X(1) and Var(X ) = G′′X(1) + G′X(1) – [G′X(1)]2
For Z = X + Y, where X and Y are independent: GZ(t) = GX(t) × GY(t)
Discrete distributions
Standard discrete distributions:
Distribution of X P(X = x) Mean Variance P.G.F.
Binomial B(n, p)nx
px (1 – p)n–x np np(1 – p) (1 – p + pt)n
Poisson Po(λ) e!
xλ λx
− λ λ eλ(t –1)
Geometric Geo( p) on 1, 2, . . . p(1 – p)x–1
1p
12
− pp
ptp t1 1− −( )
Negative binomial on r, r + 1, . . .
xr
−−
11
pr(1 – p)x–r rp
r pp
( )12
− ptp t
r
1 1− −
( )
Continuous distributions
For a continuous random variable X having probability density function f
Expectation (mean): E(X ) = μ = ∫x f(x) dx
Variance: Var(X ) = σ2 = ∫ (x – μ)2 f(x) dx = ∫x2 f(x) dx – μ2
For a function g(X ): E(g(X )) = ∫g(x) f(x) dx
Cumulative distribution function: F(x0) = P(X x0) = #x0
−∞
f (t) dt
4exemplar
exemplar
DRAFT
DRAFT
24 Pearson Edexcel Level 3 Advanced Subsidiary and Advanced GCE in Mathematics and Further Mathematics Mathematical Formulae and Statistical Tables – Issue 1 – July 2017 – © Pearson Education Limited 2017
Standard continuous distribution:
Distribution of X P.D.F. Mean Variance
Normal N(μ, σ2)21
21 e2
x μσ
σ π
− − μ σ2
Uniform (Rectangular) on [a, b]1
b a−12 (a + b) 1
12 (b – a)2
Correlation and regression
For a set of n pairs of values (xi, yi)
Sxx = Σ(xi – x)2 = Σxi2 –
2(Σ )ixn
Syy = Σ( yi – y)2 = Σyi2 –
2(Σ )iyn
Sxy = Σ(xi – x)( yi – y) = Σxi yi – (Σ )(Σ )i ix y
n
The product moment correlation coefficient is
{ }{ }2 2 2 22 2
(Σ )(Σ )ΣS Σ( )( )S S Σ( ) Σ( ) (Σ ) (Σ )Σ Σ
−− −= = =
− −− −
i ii i
xy i i
xx yy i i i ii i
x yx yx x y y nrx x y y x yx y
n n
The regression coefficient of y on x is 2
S Σ( )( )S Σ( )
− −= =
−xy i i
xx i
x x y ybx x
Least squares regression line of y on x is y = a + bx where a = y – bx
Residual Sum of Squares (RSS) = Syy – SS
xy
xx
( )2
= Syy (1 – r2)
Spearman’s rank correlation coefficient is rs = 1 – 2
2
6Σ( 1)d
n n −
Expectation algebra
For independent random variables X and Y
E(XY ) = E(X )E(Y ), Var(aX ± bY ) = a2 Var(X ) + b2 Var(Y )
exemplar
exemplar
DRAFT
DRAFT

25Pearson Edexcel Level 3 Advanced Subsidiary and Advanced GCE in Mathematics and Further Mathematics Mathematical Formulae and Statistical Tables – Issue 1 – July 2017 – © Pearson Education Limited 2017
Sampling distributions
(i) Tests for mean when σ is known
For a random sample X1, X2, . . ., Xn of n independent observations from a distribution having
mean μ and variance σ2:
X is an unbiased estimator of μ, with Var(X ) = 2σn
S2 is an unbiased estimator of σ2, where S2 = 2Σ( )
1iX Xn
−−
For a random sample of n observations from N(μ, σ2), /X μσ n
− ~ N(0, 1)
For a random sample of nx observations from N(μx, σ2x) and, independently, a random
sample of ny observations from N(μy , σ2y), 22
( ) ( )x y
x y
yx
X Y μ μ
σσn n
− − −
+
~ N(0, 1)
(ii) Tests for variance and mean when σ is not known
For a random sample of n observations from N(μ, σ2)
2
2
( 1)n Sσ− ~ χ2
n –1
/X μS n
− ~ tn –1 (also valid in matched-pairs situations)
For a random sample of nx observations from N(μx, σ2x) and, independently, a random sample
of ny observations from N(μy, σ2y)
2 2
2 2
//y y
x xS σS σ
~ Fn x– 1, ny – 1
If σ2x = σ2
y = σ2 (unknown) then
2
2
( ) ( )~
1 1x y
x yn n
px y
X Y μ μt
Sn n
+ −
− − −
+
where Sn S n S
n npx y
x y
x y22 21 1
2=
− + −+ −
( ) ( )
4exemplar
exemplar
DRAFT
DRAFT

26 Pearson Edexcel Level 3 Advanced Subsidiary and Advanced GCE in Mathematics and Further Mathematics Mathematical Formulae and Statistical Tables – Issue 1 – July 2017 – © Pearson Education Limited 2017
Non-parametric tests
Goodness-of-fit test and contingency tables: ( )O E
Ei i
i
−∑2
~ χ2v
Statistical tables
The following statistical tables are required for A Level Further Mathematics:
Binomial Cumulative Distribution Function (see page 29)
Poisson Cumulative Distribution Function (see page 35)
Percentage Points of the χ2 Distribution (see page 36)
Critical Values for Correlation Coefficients: Product Moment Coefficient and Spearman’s Coefficient (see page 37)
Random Numbers (see page 38)
Percentage Points of Student’s t Distribution (see page 39)
Percentage Points of the F Distribution (see page 40)
exemplar
exemplar
DRAFT
DRAFT

27Pearson Edexcel Level 3 Advanced Subsidiary and Advanced GCE in Mathematics and Further Mathematics Mathematical Formulae and Statistical Tables – Issue 1 – July 2017 – © Pearson Education Limited 2017
Mechanics
Centres of mass
For uniform bodies:
Triangular lamina: 23 along median from vertex
Circular arc, radius r, angle at centre 2α : sinr αα from centre
Sector of circle, radius r, angle at centre 2α : 2 sin3r αα
from centre
Solid hemisphere, radius r: 38 r from centre
Hemispherical shell, radius r: 12 r from centre
Solid cone or pyramid of height h: 14 h above the base on the line from centre of base to vertex
Conical shell of height h: 13 h above the base on the line from centre of base to vertex
Motion in a circle
Transverse velocity: v = rθ.
Transverse acceleration: v. = rθ
..
Radial acceleration: –rθ.2 = –
vr
2
4exemplar
exemplar
DRAFT
DRAFT

28 Pearson Edexcel Level 3 Advanced Subsidiary and Advanced GCE in Mathematics and Further Mathematics Mathematical Formulae and Statistical Tables – Issue 1 – July 2017 – © Pearson Education Limited 2017
exemplar
exemplar
DRAFT
DRAFT

29Pearson Edexcel Level 3 Advanced Subsidiary and Advanced GCE in Mathematics and Further Mathematics Mathematical Formulae and Statistical Tables – Issue 1 – July 2017 – © Pearson Education Limited 2017
5 Statistical Tables
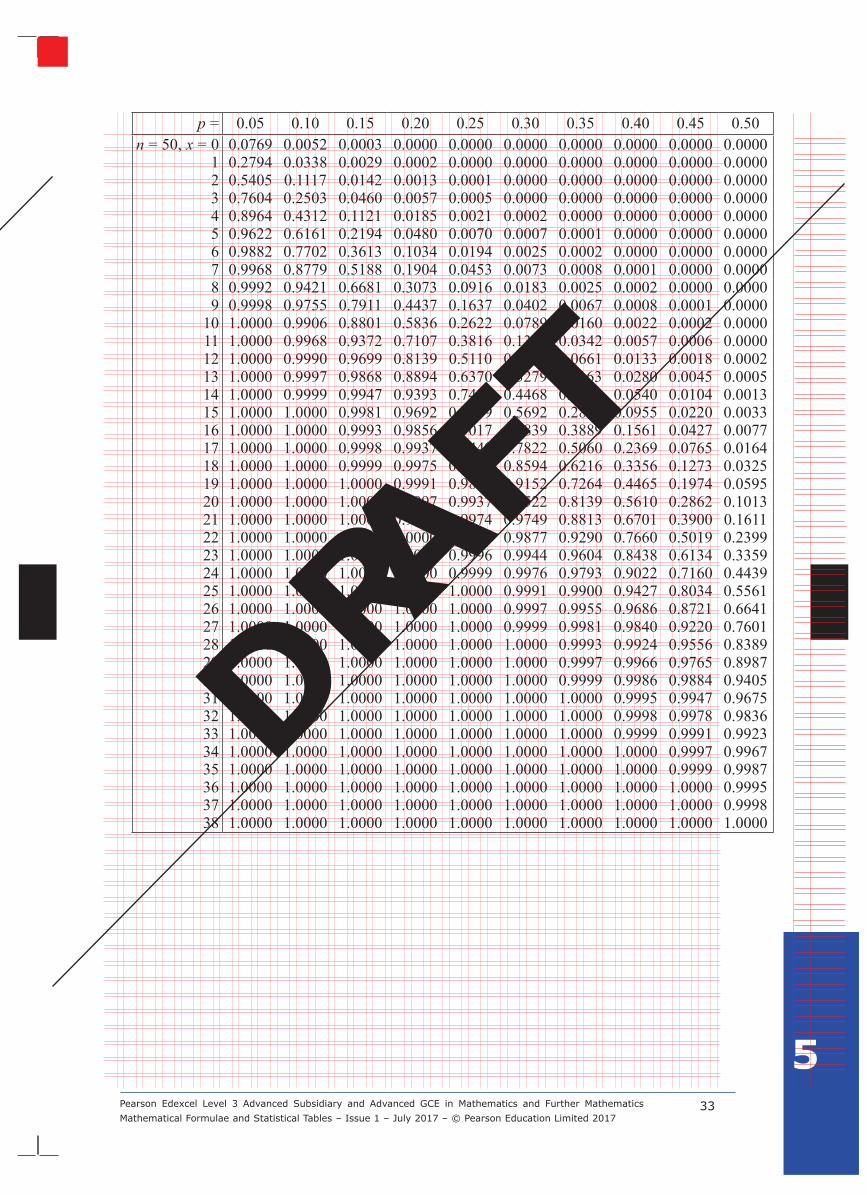
Binomial Cumulative Distribution FunctionThe tabulated value is P(X x), where X has a binomial distribution with index n and parameter p.
p = 0.05 0.10 0.15 0.20 0.25 0.30 0.35 0.40 0.45 0.50n = 5, x = 0 0.7738 0.5905 0.4437 0.3277 0.2373 0.1681 0.1160 0.0778 0.0503 0.0312
1 0.9774 0.9185 0.8352 0.7373 0.6328 0.5282 0.4284 0.3370 0.2562 0.18752 0.9988 0.9914 0.9734 0.9421 0.8965 0.8369 0.7648 0.6826 0.5931 0.50003 1.0000 0.9995 0.9978 0.9933 0.9844 0.9692 0.9460 0.9130 0.8688 0.81254 1.0000 1.0000 0.9999 0.9997 0.9990 0.9976 0.9947 0.9898 0.9815 0.9688
n = 6, x = 0 0.7351 0.5314 0.3771 0.2621 0.1780 0.1176 0.0754 0.0467 0.0277 0.01561 0.9672 0.8857 0.7765 0.6554 0.5339 0.4202 0.3191 0.2333 0.1636 0.10942 0.9978 0.9842 0.9527 0.9011 0.8306 0.7443 0.6471 0.5443 0.4415 0.34383 0.9999 0.9987 0.9941 0.9830 0.9624 0.9295 0.8826 0.8208 0.7447 0.65634 1.0000 0.9999 0.9996 0.9984 0.9954 0.9891 0.9777 0.9590 0.9308 0.89065 1.0000 1.0000 1.0000 0.9999 0.9998 0.9993 0.9982 0.9959 0.9917 0.9844
n = 7, x = 0 0.6983 0.4783 0.3206 0.2097 0.1335 0.0824 0.0490 0.0280 0.0152 0.00781 0.9556 0.8503 0.7166 0.5767 0.4449 0.3294 0.2338 0.1586 0.1024 0.06252 0.9962 0.9743 0.9262 0.8520 0.7564 0.6471 0.5323 0.4199 0.3164 0.22663 0.9998 0.9973 0.9879 0.9667 0.9294 0.8740 0.8002 0.7102 0.6083 0.50004 1.0000 0.9998 0.9988 0.9953 0.9871 0.9712 0.9444 0.9037 0.8471 0.77345 1.0000 1.0000 0.9999 0.9996 0.9987 0.9962 0.9910 0.9812 0.9643 0.93756 1.0000 1.0000 1.0000 1.0000 0.9999 0.9998 0.9994 0.9984 0.9963 0.9922
n = 8, x = 0 0.6634 0.4305 0.2725 0.1678 0.1001 0.0576 0.0319 0.0168 0.0084 0.00391 0.9428 0.8131 0.6572 0.5033 0.3671 0.2553 0.1691 0.1064 0.0632 0.03522 0.9942 0.9619 0.8948 0.7969 0.6785 0.5518 0.4278 0.3154 0.2201 0.14453 0.9996 0.9950 0.9786 0.9437 0.8862 0.8059 0.7064 0.5941 0.4770 0.36334 1.0000 0.9996 0.9971 0.9896 0.9727 0.9420 0.8939 0.8263 0.7396 0.63675 1.0000 1.0000 0.9998 0.9988 0.9958 0.9887 0.9747 0.9502 0.9115 0.85556 1.0000 1.0000 1.0000 0.9999 0.9996 0.9987 0.9964 0.9915 0.9819 0.96487 1.0000 1.0000 1.0000 1.0000 1.0000 0.9999 0.9998 0.9993 0.9983 0.9961
n = 9, x = 0 0.6302 0.3874 0.2316 0.1342 0.0751 0.0404 0.0207 0.0101 0.0046 0.00201 0.9288 0.7748 0.5995 0.4362 0.3003 0.1960 0.1211 0.0705 0.0385 0.01952 0.9916 0.9470 0.8591 0.7382 0.6007 0.4628 0.3373 0.2318 0.1495 0.08983 0.9994 0.9917 0.9661 0.9144 0.8343 0.7297 0.6089 0.4826 0.3614 0.25394 1.0000 0.9991 0.9944 0.9804 0.9511 0.9012 0.8283 0.7334 0.6214 0.50005 1.0000 0.9999 0.9994 0.9969 0.9900 0.9747 0.9464 0.9006 0.8342 0.74616 1.0000 1.0000 1.0000 0.9997 0.9987 0.9957 0.9888 0.9750 0.9502 0.91027 1.0000 1.0000 1.0000 1.0000 0.9999 0.9996 0.9986 0.9962 0.9909 0.98058 1.0000 1.0000 1.0000 1.0000 1.0000 1.0000 0.9999 0.9997 0.9992 0.9980
n = 10, x = 0 0.5987 0.3487 0.1969 0.1074 0.0563 0.0282 0.0135 0.0060 0.0025 0.00101 0.9139 0.7361 0.5443 0.3758 0.2440 0.1493 0.0860 0.0464 0.0233 0.01072 0.9885 0.9298 0.8202 0.6778 0.5256 0.3828 0.2616 0.1673 0.0996 0.05473 0.9990 0.9872 0.9500 0.8791 0.7759 0.6496 0.5138 0.3823 0.2660 0.17194 0.9999 0.9984 0.9901 0.9672 0.9219 0.8497 0.7515 0.6331 0.5044 0.37705 1.0000 0.9999 0.9986 0.9936 0.9803 0.9527 0.9051 0.8338 0.7384 0.62306 1.0000 1.0000 0.9999 0.9991 0.9965 0.9894 0.9740 0.9452 0.8980 0.82817 1.0000 1.0000 1.0000 0.9999 0.9996 0.9984 0.9952 0.9877 0.9726 0.94538 1.0000 1.0000 1.0000 1.0000 1.0000 0.9999 0.9995 0.9983 0.9955 0.98939 1.0000 1.0000 1.0000 1.0000 1.0000 1.0000 1.0000 0.9999 0.9997 0.9990 5
exemplar
exemplar
DRAFT
DRAFT

30 Pearson Edexcel Level 3 Advanced Subsidiary and Advanced GCE in Mathematics and Further Mathematics Mathematical Formulae and Statistical Tables – Issue 1 – July 2017 – © Pearson Education Limited 2017
p = 0.05 0.10 0.15 0.20 0.25 0.30 0.35 0.40 0.45 0.50n = 12, x = 0 0.5404 0.2824 0.1422 0.0687 0.0317 0.0138 0.0057 0.0022 0.0008 0.0002
1 0.8816 0.6590 0.4435 0.2749 0.1584 0.0850 0.0424 0.0196 0.0083 0.00322 0.9804 0.8891 0.7358 0.5583 0.3907 0.2528 0.1513 0.0834 0.0421 0.01933 0.9978 0.9744 0.9078 0.7946 0.6488 0.4925 0.3467 0.2253 0.1345 0.07304 0.9998 0.9957 0.9761 0.9274 0.8424 0.7237 0.5833 0.4382 0.3044 0.19385 1.0000 0.9995 0.9954 0.9806 0.9456 0.8822 0.7873 0.6652 0.5269 0.38726 1.0000 0.9999 0.9993 0.9961 0.9857 0.9614 0.9154 0.8418 0.7393 0.61287 1.0000 1.0000 0.9999 0.9994 0.9972 0.9905 0.9745 0.9427 0.8883 0.80628 1.0000 1.0000 1.0000 0.9999 0.9996 0.9983 0.9944 0.9847 0.9644 0.92709 1.0000 1.0000 1.0000 1.0000 1.0000 0.9998 0.9992 0.9972 0.9921 0.9807
10 1.0000 1.0000 1.0000 1.0000 1.0000 1.0000 0.9999 0.9997 0.9989 0.996811 1.0000 1.0000 1.0000 1.0000 1.0000 1.0000 1.0000 1.0000 0.9999 0.9998
n = 15, x = 0 0.4633 0.2059 0.0874 0.0352 0.0134 0.0047 0.0016 0.0005 0.0001 0.00001 0.8290 0.5490 0.3186 0.1671 0.0802 0.0353 0.0142 0.0052 0.0017 0.00052 0.9638 0.8159 0.6042 0.3980 0.2361 0.1268 0.0617 0.0271 0.0107 0.00373 0.9945 0.9444 0.8227 0.6482 0.4613 0.2969 0.1727 0.0905 0.0424 0.01764 0.9994 0.9873 0.9383 0.8358 0.6865 0.5155 0.3519 0.2173 0.1204 0.05925 0.9999 0.9978 0.9832 0.9389 0.8516 0.7216 0.5643 0.4032 0.2608 0.15096 1.0000 0.9997 0.9964 0.9819 0.9434 0.8689 0.7548 0.6098 0.4522 0.30367 1.0000 1.0000 0.9994 0.9958 0.9827 0.9500 0.8868 0.7869 0.6535 0.50008 1.0000 1.0000 0.9999 0.9992 0.9958 0.9848 0.9578 0.9050 0.8182 0.69649 1.0000 1.0000 1.0000 0.9999 0.9992 0.9963 0.9876 0.9662 0.9231 0.8491
10 1.0000 1.0000 1.0000 1.0000 0.9999 0.9993 0.9972 0.9907 0.9745 0.940811 1.0000 1.0000 1.0000 1.0000 1.0000 0.9999 0.9995 0.9981 0.9937 0.982412 1.0000 1.0000 1.0000 1.0000 1.0000 1.0000 0.9999 0.9997 0.9989 0.996313 1.0000 1.0000 1.0000 1.0000 1.0000 1.0000 1.0000 1.0000 0.9999 0.999514 1.0000 1.0000 1.0000 1.0000 1.0000 1.0000 1.0000 1.0000 1.0000 1.0000
n = 20, x = 0 0.3585 0.1216 0.0388 0.0115 0.0032 0.0008 0.0002 0.0000 0.0000 0.00001 0.7358 0.3917 0.1756 0.0692 0.0243 0.0076 0.0021 0.0005 0.0001 0.00002 0.9245 0.6769 0.4049 0.2061 0.0913 0.0355 0.0121 0.0036 0.0009 0.00023 0.9841 0.8670 0.6477 0.4114 0.2252 0.1071 0.0444 0.0160 0.0049 0.00134 0.9974 0.9568 0.8298 0.6296 0.4148 0.2375 0.1182 0.0510 0.0189 0.00595 0.9997 0.9887 0.9327 0.8042 0.6172 0.4164 0.2454 0.1256 0.0553 0.02076 1.0000 0.9976 0.9781 0.9133 0.7858 0.6080 0.4166 0.2500 0.1299 0.05777 1.0000 0.9996 0.9941 0.9679 0.8982 0.7723 0.6010 0.4159 0.2520 0.13168 1.0000 0.9999 0.9987 0.9900 0.9591 0.8867 0.7624 0.5956 0.4143 0.25179 1.0000 1.0000 0.9998 0.9974 0.9861 0.9520 0.8782 0.7553 0.5914 0.4119
10 1.0000 1.0000 1.0000 0.9994 0.9961 0.9829 0.9468 0.8725 0.7507 0.588111 1.0000 1.0000 1.0000 0.9999 0.9991 0.9949 0.9804 0.9435 0.8692 0.748312 1.0000 1.0000 1.0000 1.0000 0.9998 0.9987 0.9940 0.9790 0.9420 0.868413 1.0000 1.0000 1.0000 1.0000 1.0000 0.9997 0.9985 0.9935 0.9786 0.942314 1.0000 1.0000 1.0000 1.0000 1.0000 1.0000 0.9997 0.9984 0.9936 0.979315 1.0000 1.0000 1.0000 1.0000 1.0000 1.0000 1.0000 0.9997 0.9985 0.994116 1.0000 1.0000 1.0000 1.0000 1.0000 1.0000 1.0000 1.0000 0.9997 0.998717 1.0000 1.0000 1.0000 1.0000 1.0000 1.0000 1.0000 1.0000 1.0000 0.999818 1.0000 1.0000 1.0000 1.0000 1.0000 1.0000 1.0000 1.0000 1.0000 1.0000
exemplar
exemplar
DRAFT
DRAFT

31Pearson Edexcel Level 3 Advanced Subsidiary and Advanced GCE in Mathematics and Further Mathematics Mathematical Formulae and Statistical Tables – Issue 1 – July 2017 – © Pearson Education Limited 2017
p = 0.05 0.10 0.15 0.20 0.25 0.30 0.35 0.40 0.45 0.50n = 25, x = 0 0.2774 0.0718 0.0172 0.0038 0.0008 0.0001 0.0000 0.0000 0.0000 0.0000
1 0.6424 0.2712 0.0931 0.0274 0.0070 0.0016 0.0003 0.0001 0.0000 0.00002 0.8729 0.5371 0.2537 0.0982 0.0321 0.0090 0.0021 0.0004 0.0001 0.00003 0.9659 0.7636 0.4711 0.2340 0.0962 0.0332 0.0097 0.0024 0.0005 0.00014 0.9928 0.9020 0.6821 0.4207 0.2137 0.0905 0.0320 0.0095 0.0023 0.00055 0.9988 0.9666 0.8385 0.6167 0.3783 0.1935 0.0826 0.0294 0.0086 0.00206 0.9998 0.9905 0.9305 0.7800 0.5611 0.3407 0.1734 0.0736 0.0258 0.00737 1.0000 0.9977 0.9745 0.8909 0.7265 0.5118 0.3061 0.1536 0.0639 0.02168 1.0000 0.9995 0.9920 0.9532 0.8506 0.6769 0.4668 0.2735 0.1340 0.05399 1.0000 0.9999 0.9979 0.9827 0.9287 0.8106 0.6303 0.4246 0.2424 0.1148
10 1.0000 1.0000 0.9995 0.9944 0.9703 0.9022 0.7712 0.5858 0.3843 0.212211 1.0000 1.0000 0.9999 0.9985 0.9893 0.9558 0.8746 0.7323 0.5426 0.345012 1.0000 1.0000 1.0000 0.9996 0.9966 0.9825 0.9396 0.8462 0.6937 0.500013 1.0000 1.0000 1.0000 0.9999 0.9991 0.9940 0.9745 0.9222 0.8173 0.655014 1.0000 1.0000 1.0000 1.0000 0.9998 0.9982 0.9907 0.9656 0.9040 0.787815 1.0000 1.0000 1.0000 1.0000 1.0000 0.9995 0.9971 0.9868 0.9560 0.885216 1.0000 1.0000 1.0000 1.0000 1.0000 0.9999 0.9992 0.9957 0.9826 0.946117 1.0000 1.0000 1.0000 1.0000 1.0000 1.0000 0.9998 0.9988 0.9942 0.978418 1.0000 1.0000 1.0000 1.0000 1.0000 1.0000 1.0000 0.9997 0.9984 0.992719 1.0000 1.0000 1.0000 1.0000 1.0000 1.0000 1.0000 0.9999 0.9996 0.998020 1.0000 1.0000 1.0000 1.0000 1.0000 1.0000 1.0000 1.0000 0.9999 0.999521 1.0000 1.0000 1.0000 1.0000 1.0000 1.0000 1.0000 1.0000 1.0000 0.999922 1.0000 1.0000 1.0000 1.0000 1.0000 1.0000 1.0000 1.0000 1.0000 1.0000
n = 30, x = 0 0.2146 0.0424 0.0076 0.0012 0.0002 0.0000 0.0000 0.0000 0.0000 0.00001 0.5535 0.1837 0.0480 0.0105 0.0020 0.0003 0.0000 0.0000 0.0000 0.00002 0.8122 0.4114 0.1514 0.0442 0.0106 0.0021 0.0003 0.0000 0.0000 0.00003 0.9392 0.6474 0.3217 0.1227 0.0374 0.0093 0.0019 0.0003 0.0000 0.00004 0.9844 0.8245 0.5245 0.2552 0.0979 0.0302 0.0075 0.0015 0.0002 0.00005 0.9967 0.9268 0.7106 0.4275 0.2026 0.0766 0.0233 0.0057 0.0011 0.00026 0.9994 0.9742 0.8474 0.6070 0.3481 0.1595 0.0586 0.0172 0.0040 0.00077 0.9999 0.9922 0.9302 0.7608 0.5143 0.2814 0.1238 0.0435 0.0121 0.00268 1.0000 0.9980 0.9722 0.8713 0.6736 0.4315 0.2247 0.0940 0.0312 0.00819 1.0000 0.9995 0.9903 0.9389 0.8034 0.5888 0.3575 0.1763 0.0694 0.0214
10 1.0000 0.9999 0.9971 0.9744 0.8943 0.7304 0.5078 0.2915 0.1350 0.049411 1.0000 1.0000 0.9992 0.9905 0.9493 0.8407 0.6548 0.4311 0.2327 0.100212 1.0000 1.0000 0.9998 0.9969 0.9784 0.9155 0.7802 0.5785 0.3592 0.180813 1.0000 1.0000 1.0000 0.9991 0.9918 0.9599 0.8737 0.7145 0.5025 0.292314 1.0000 1.0000 1.0000 0.9998 0.9973 0.9831 0.9348 0.8246 0.6448 0.427815 1.0000 1.0000 1.0000 0.9999 0.9992 0.9936 0.9699 0.9029 0.7691 0.572216 1.0000 1.0000 1.0000 1.0000 0.9998 0.9979 0.9876 0.9519 0.8644 0.707717 1.0000 1.0000 1.0000 1.0000 0.9999 0.9994 0.9955 0.9788 0.9286 0.819218 1.0000 1.0000 1.0000 1.0000 1.0000 0.9998 0.9986 0.9917 0.9666 0.899819 1.0000 1.0000 1.0000 1.0000 1.0000 1.0000 0.9996 0.9971 0.9862 0.950620 1.0000 1.0000 1.0000 1.0000 1.0000 1.0000 0.9999 0.9991 0.9950 0.978621 1.0000 1.0000 1.0000 1.0000 1.0000 1.0000 1.0000 0.9998 0.9984 0.991922 1.0000 1.0000 1.0000 1.0000 1.0000 1.0000 1.0000 1.0000 0.9996 0.997423 1.0000 1.0000 1.0000 1.0000 1.0000 1.0000 1.0000 1.0000 0.9999 0.999324 1.0000 1.0000 1.0000 1.0000 1.0000 1.0000 1.0000 1.0000 1.0000 0.999825 1.0000 1.0000 1.0000 1.0000 1.0000 1.0000 1.0000 1.0000 1.0000 1.0000
5
exemplar
exemplar
DRAFT
DRAFT

32 Pearson Edexcel Level 3 Advanced Subsidiary and Advanced GCE in Mathematics and Further Mathematics Mathematical Formulae and Statistical Tables – Issue 1 – July 2017 – © Pearson Education Limited 2017
p = 0.05 0.10 0.15 0.20 0.25 0.30 0.35 0.40 0.45 0.50n = 40, x = 0 0.1285 0.0148 0.0015 0.0001 0.0000 0.0000 0.0000 0.0000 0.0000 0.0000
1 0.3991 0.0805 0.0121 0.0015 0.0001 0.0000 0.0000 0.0000 0.0000 0.00002 0.6767 0.2228 0.0486 0.0079 0.0010 0.0001 0.0000 0.0000 0.0000 0.00003 0.8619 0.4231 0.1302 0.0285 0.0047 0.0006 0.0001 0.0000 0.0000 0.00004 0.9520 0.6290 0.2633 0.0759 0.0160 0.0026 0.0003 0.0000 0.0000 0.00005 0.9861 0.7937 0.4325 0.1613 0.0433 0.0086 0.0013 0.0001 0.0000 0.00006 0.9966 0.9005 0.6067 0.2859 0.0962 0.0238 0.0044 0.0006 0.0001 0.00007 0.9993 0.9581 0.7559 0.4371 0.1820 0.0553 0.0124 0.0021 0.0002 0.00008 0.9999 0.9845 0.8646 0.5931 0.2998 0.1110 0.0303 0.0061 0.0009 0.00019 1.0000 0.9949 0.9328 0.7318 0.4395 0.1959 0.0644 0.0156 0.0027 0.0003
10 1.0000 0.9985 0.9701 0.8392 0.5839 0.3087 0.1215 0.0352 0.0074 0.001111 1.0000 0.9996 0.9880 0.9125 0.7151 0.4406 0.2053 0.0709 0.0179 0.003212 1.0000 0.9999 0.9957 0.9568 0.8209 0.5772 0.3143 0.1285 0.0386 0.008313 1.0000 1.0000 0.9986 0.9806 0.8968 0.7032 0.4408 0.2112 0.0751 0.019214 1.0000 1.0000 0.9996 0.9921 0.9456 0.8074 0.5721 0.3174 0.1326 0.040315 1.0000 1.0000 0.9999 0.9971 0.9738 0.8849 0.6946 0.4402 0.2142 0.076916 1.0000 1.0000 1.0000 0.9990 0.9884 0.9367 0.7978 0.5681 0.3185 0.134117 1.0000 1.0000 1.0000 0.9997 0.9953 0.9680 0.8761 0.6885 0.4391 0.214818 1.0000 1.0000 1.0000 0.9999 0.9983 0.9852 0.9301 0.7911 0.5651 0.317919 1.0000 1.0000 1.0000 1.0000 0.9994 0.9937 0.9637 0.8702 0.6844 0.437320 1.0000 1.0000 1.0000 1.0000 0.9998 0.9976 0.9827 0.9256 0.7870 0.562721 1.0000 1.0000 1.0000 1.0000 1.0000 0.9991 0.9925 0.9608 0.8669 0.682122 1.0000 1.0000 1.0000 1.0000 1.0000 0.9997 0.9970 0.9811 0.9233 0.785223 1.0000 1.0000 1.0000 1.0000 1.0000 0.9999 0.9989 0.9917 0.9595 0.865924 1.0000 1.0000 1.0000 1.0000 1.0000 1.0000 0.9996 0.9966 0.9804 0.923125 1.0000 1.0000 1.0000 1.0000 1.0000 1.0000 0.9999 0.9988 0.9914 0.959726 1.0000 1.0000 1.0000 1.0000 1.0000 1.0000 1.0000 0.9996 0.9966 0.980827 1.0000 1.0000 1.0000 1.0000 1.0000 1.0000 1.0000 0.9999 0.9988 0.991728 1.0000 1.0000 1.0000 1.0000 1.0000 1.0000 1.0000 1.0000 0.9996 0.996829 1.0000 1.0000 1.0000 1.0000 1.0000 1.0000 1.0000 1.0000 0.9999 0.998930 1.0000 1.0000 1.0000 1.0000 1.0000 1.0000 1.0000 1.0000 1.0000 0.999731 1.0000 1.0000 1.0000 1.0000 1.0000 1.0000 1.0000 1.0000 1.0000 0.999932 1.0000 1.0000 1.0000 1.0000 1.0000 1.0000 1.0000 1.0000 1.0000 1.0000
exemplar
exemplar
DRAFT
DRAFT
33Pearson Edexcel Level 3 Advanced Subsidiary and Advanced GCE in Mathematics and Further Mathematics Mathematical Formulae and Statistical Tables – Issue 1 – July 2017 – © Pearson Education Limited 2017
p = 0.05 0.10 0.15 0.20 0.25 0.30 0.35 0.40 0.45 0.50n = 50, x = 0 0.0769 0.0052 0.0003 0.0000 0.0000 0.0000 0.0000 0.0000 0.0000 0.0000
1 0.2794 0.0338 0.0029 0.0002 0.0000 0.0000 0.0000 0.0000 0.0000 0.00002 0.5405 0.1117 0.0142 0.0013 0.0001 0.0000 0.0000 0.0000 0.0000 0.00003 0.7604 0.2503 0.0460 0.0057 0.0005 0.0000 0.0000 0.0000 0.0000 0.00004 0.8964 0.4312 0.1121 0.0185 0.0021 0.0002 0.0000 0.0000 0.0000 0.00005 0.9622 0.6161 0.2194 0.0480 0.0070 0.0007 0.0001 0.0000 0.0000 0.00006 0.9882 0.7702 0.3613 0.1034 0.0194 0.0025 0.0002 0.0000 0.0000 0.00007 0.9968 0.8779 0.5188 0.1904 0.0453 0.0073 0.0008 0.0001 0.0000 0.00008 0.9992 0.9421 0.6681 0.3073 0.0916 0.0183 0.0025 0.0002 0.0000 0.00009 0.9998 0.9755 0.7911 0.4437 0.1637 0.0402 0.0067 0.0008 0.0001 0.0000
10 1.0000 0.9906 0.8801 0.5836 0.2622 0.0789 0.0160 0.0022 0.0002 0.000011 1.0000 0.9968 0.9372 0.7107 0.3816 0.1390 0.0342 0.0057 0.0006 0.000012 1.0000 0.9990 0.9699 0.8139 0.5110 0.2229 0.0661 0.0133 0.0018 0.000213 1.0000 0.9997 0.9868 0.8894 0.6370 0.3279 0.1163 0.0280 0.0045 0.000514 1.0000 0.9999 0.9947 0.9393 0.7481 0.4468 0.1878 0.0540 0.0104 0.001315 1.0000 1.0000 0.9981 0.9692 0.8369 0.5692 0.2801 0.0955 0.0220 0.003316 1.0000 1.0000 0.9993 0.9856 0.9017 0.6839 0.3889 0.1561 0.0427 0.007717 1.0000 1.0000 0.9998 0.9937 0.9449 0.7822 0.5060 0.2369 0.0765 0.016418 1.0000 1.0000 0.9999 0.9975 0.9713 0.8594 0.6216 0.3356 0.1273 0.032519 1.0000 1.0000 1.0000 0.9991 0.9861 0.9152 0.7264 0.4465 0.1974 0.059520 1.0000 1.0000 1.0000 0.9997 0.9937 0.9522 0.8139 0.5610 0.2862 0.101321 1.0000 1.0000 1.0000 0.9999 0.9974 0.9749 0.8813 0.6701 0.3900 0.161122 1.0000 1.0000 1.0000 1.0000 0.9990 0.9877 0.9290 0.7660 0.5019 0.239923 1.0000 1.0000 1.0000 1.0000 0.9996 0.9944 0.9604 0.8438 0.6134 0.335924 1.0000 1.0000 1.0000 1.0000 0.9999 0.9976 0.9793 0.9022 0.7160 0.443925 1.0000 1.0000 1.0000 1.0000 1.0000 0.9991 0.9900 0.9427 0.8034 0.556126 1.0000 1.0000 1.0000 1.0000 1.0000 0.9997 0.9955 0.9686 0.8721 0.664127 1.0000 1.0000 1.0000 1.0000 1.0000 0.9999 0.9981 0.9840 0.9220 0.760128 1.0000 1.0000 1.0000 1.0000 1.0000 1.0000 0.9993 0.9924 0.9556 0.838929 1.0000 1.0000 1.0000 1.0000 1.0000 1.0000 0.9997 0.9966 0.9765 0.898730 1.0000 1.0000 1.0000 1.0000 1.0000 1.0000 0.9999 0.9986 0.9884 0.940531 1.0000 1.0000 1.0000 1.0000 1.0000 1.0000 1.0000 0.9995 0.9947 0.967532 1.0000 1.0000 1.0000 1.0000 1.0000 1.0000 1.0000 0.9998 0.9978 0.983633 1.0000 1.0000 1.0000 1.0000 1.0000 1.0000 1.0000 0.9999 0.9991 0.992334 1.0000 1.0000 1.0000 1.0000 1.0000 1.0000 1.0000 1.0000 0.9997 0.996735 1.0000 1.0000 1.0000 1.0000 1.0000 1.0000 1.0000 1.0000 0.9999 0.998736 1.0000 1.0000 1.0000 1.0000 1.0000 1.0000 1.0000 1.0000 1.0000 0.999537 1.0000 1.0000 1.0000 1.0000 1.0000 1.0000 1.0000 1.0000 1.0000 0.999838 1.0000 1.0000 1.0000 1.0000 1.0000 1.0000 1.0000 1.0000 1.0000 1.0000
5
exemplar
exemplar
DRAFT
DRAFT

34 Pearson Edexcel Level 3 Advanced Subsidiary and Advanced GCE in Mathematics and Further Mathematics Mathematical Formulae and Statistical Tables – Issue 1 – July 2017 – © Pearson Education Limited 2017
Percentage Points of The Normal DistributionThe values z in the table are those which a random variable Z – N(0, 1) exceeds with probability p; that is, P(Z > z) = 1 – Φ(z) = p.
p z p z0.5000 0.0000 0.0500 1.64490.4000 0.2533 0.0250 1.96000.3000 0.5244 0.0100 2.32630.2000 0.8416 0.0050 2.57580.1500 1.0364 0.0010 3.09020.1000 1.2816 0.0005 3.2905
exemplar
exemplar
DRAFT
DRAFT

35Pearson Edexcel Level 3 Advanced Subsidiary and Advanced GCE in Mathematics and Further Mathematics Mathematical Formulae and Statistical Tables – Issue 1 – July 2017 – © Pearson Education Limited 2017
Poisson Cumulative Distribution FunctionThe tabulated value is P(X x), where X has a Poisson distribution with parameter λ.
λ = 0.5 1.0 1.5 2.0 2.5 3.0 3.5 4.0 4.5 5.0x = 0 0.6065 0.3679 0.2231 0.1353 0.0821 0.0498 0.0302 0.0183 0.0111 0.0067
1 0.9098 0.7358 0.5578 0.4060 0.2873 0.1991 0.1359 0.0916 0.0611 0.04042 0.9856 0.9197 0.8088 0.6767 0.5438 0.4232 0.3208 0.2381 0.1736 0.12473 0.9982 0.9810 0.9344 0.8571 0.7576 0.6472 0.5366 0.4335 0.3423 0.26504 0.9998 0.9963 0.9814 0.9473 0.8912 0.8153 0.7254 0.6288 0.5321 0.44055 1.0000 0.9994 0.9955 0.9834 0.9580 0.9161 0.8576 0.7851 0.7029 0.61606 1.0000 0.9999 0.9991 0.9955 0.9858 0.9665 0.9347 0.8893 0.8311 0.76227 1.0000 1.0000 0.9998 0.9989 0.9958 0.9881 0.9733 0.9489 0.9134 0.86668 1.0000 1.0000 1.0000 0.9998 0.9989 0.9962 0.9901 0.9786 0.9597 0.93199 1.0000 1.0000 1.0000 1.0000 0.9997 0.9989 0.9967 0.9919 0.9829 0.9682
10 1.0000 1.0000 1.0000 1.0000 0.9999 0.9997 0.9990 0.9972 0.9933 0.986311 1.0000 1.0000 1.0000 1.0000 1.0000 0.9999 0.9997 0.9991 0.9976 0.994512 1.0000 1.0000 1.0000 1.0000 1.0000 1.0000 0.9999 0.9997 0.9992 0.998013 1.0000 1.0000 1.0000 1.0000 1.0000 1.0000 1.0000 0.9999 0.9997 0.999314 1.0000 1.0000 1.0000 1.0000 1.0000 1.0000 1.0000 1.0000 0.9999 0.999815 1.0000 1.0000 1.0000 1.0000 1.0000 1.0000 1.0000 1.0000 1.0000 0.999916 1.0000 1.0000 1.0000 1.0000 1.0000 1.0000 1.0000 1.0000 1.0000 1.000017 1.0000 1.0000 1.0000 1.0000 1.0000 1.0000 1.0000 1.0000 1.0000 1.000018 1.0000 1.0000 1.0000 1.0000 1.0000 1.0000 1.0000 1.0000 1.0000 1.000019 1.0000 1.0000 1.0000 1.0000 1.0000 1.0000 1.0000 1.0000 1.0000 1.0000
λ = 5.5 6.0 6.5 7.0 7.5 8.0 8.5 9.0 9.5 10.0x = 0 0.0041 0.0025 0.0015 0.0009 0.0006 0.0003 0.0002 0.0001 0.0001 0.0000
1 0.0266 0.0174 0.0113 0.0073 0.0047 0.0030 0.0019 0.0012 0.0008 0.00052 0.0884 0.0620 0.0430 0.0296 0.0203 0.0138 0.0093 0.0062 0.0042 0.00283 0.2017 0.1512 0.1118 0.0818 0.0591 0.0424 0.0301 0.0212 0.0149 0.01034 0.3575 0.2851 0.2237 0.1730 0.1321 0.0996 0.0744 0.0550 0.0403 0.02935 0.5289 0.4457 0.3690 0.3007 0.2414 0.1912 0.1496 0.1157 0.0885 0.06716 0.6860 0.6063 0.5265 0.4497 0.3782 0.3134 0.2562 0.2068 0.1649 0.13017 0.8095 0.7440 0.6728 0.5987 0.5246 0.4530 0.3856 0.3239 0.2687 0.22028 0.8944 0.8472 0.7916 0.7291 0.6620 0.5925 0.5231 0.4557 0.3918 0.33289 0.9462 0.9161 0.8774 0.8305 0.7764 0.7166 0.6530 0.5874 0.5218 0.4579
10 0.9747 0.9574 0.9332 0.9015 0.8622 0.8159 0.7634 0.7060 0.6453 0.583011 0.9890 0.9799 0.9661 0.9467 0.9208 0.8881 0.8487 0.8030 0.7520 0.696812 0.9955 0.9912 0.9840 0.9730 0.9573 0.9362 0.9091 0.8758 0.8364 0.791613 0.9983 0.9964 0.9929 0.9872 0.9784 0.9658 0.9486 0.9261 0.8981 0.864514 0.9994 0.9986 0.9970 0.9943 0.9897 0.9827 0.9726 0.9585 0.9400 0.916515 0.9998 0.9995 0.9988 0.9976 0.9954 0.9918 0.9862 0.9780 0.9665 0.951316 0.9999 0.9998 0.9996 0.9990 0.9980 0.9963 0.9934 0.9889 0.9823 0.973017 1.0000 0.9999 0.9998 0.9996 0.9992 0.9984 0.9970 0.9947 0.9911 0.985718 1.0000 1.0000 0.9999 0.9999 0.9997 0.9993 0.9987 0.9976 0.9957 0.992819 1.0000 1.0000 1.0000 1.0000 0.9999 0.9997 0.9995 0.9989 0.9980 0.996520 1.0000 1.0000 1.0000 1.0000 1.0000 0.9999 0.9998 0.9996 0.9991 0.998421 1.0000 1.0000 1.0000 1.0000 1.0000 1.0000 0.9999 0.9998 0.9996 0.999322 1.0000 1.0000 1.0000 1.0000 1.0000 1.0000 1.0000 0.9999 0.9999 0.9997
5
exemplar
exemplar
DRAFT
DRAFT
36 Pearson Edexcel Level 3 Advanced Subsidiary and Advanced GCE in Mathematics and Further Mathematics Mathematical Formulae and Statistical Tables – Issue 1 – July 2017 – © Pearson Education Limited 2017
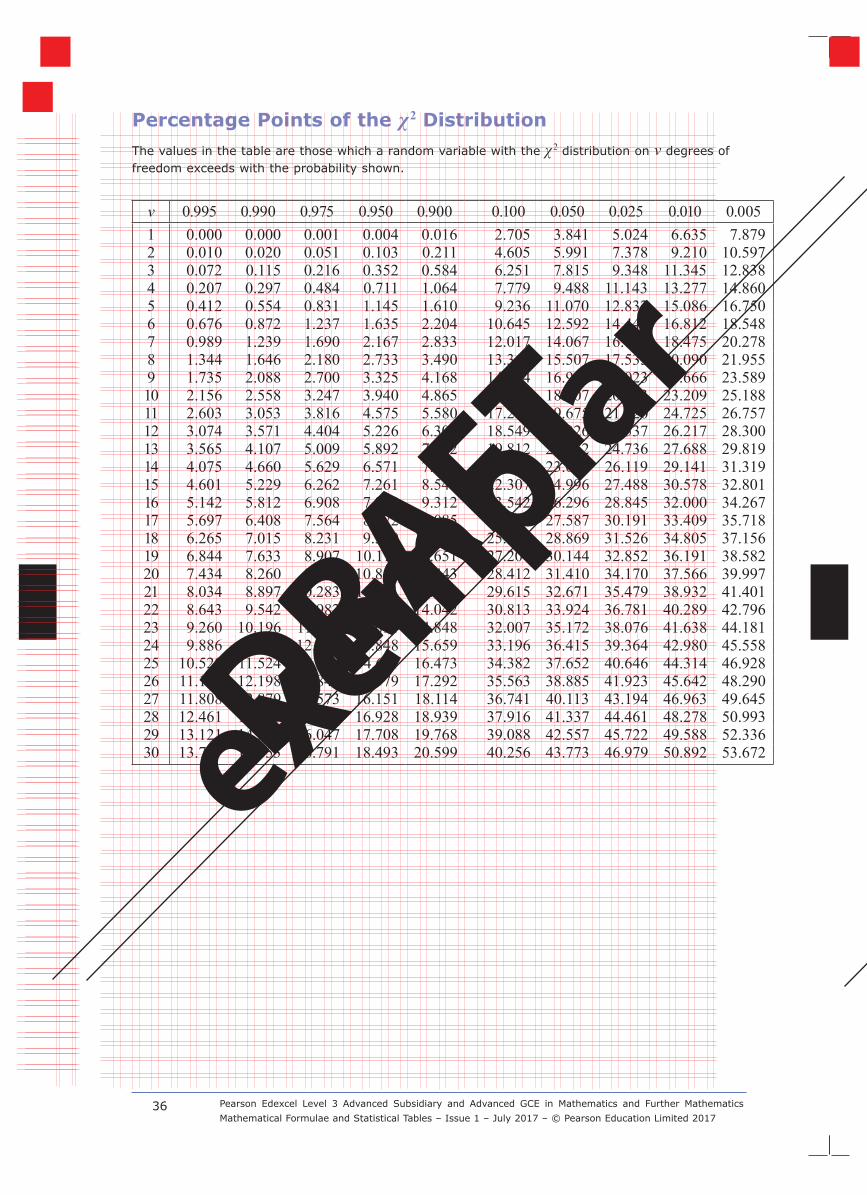
Percentage Points of the χ2 DistributionThe values in the table are those which a random variable with the χ2 distribution on v degrees of freedom exceeds with the probability shown.
v 0.995 0.990 0.975 0.950 0.900 0.100 0.050 0.025 0.010 0.0051 0.000 0.000 0.001 0.004 0.016 2.705 3.841 5.024 6.635 7.8792 0.010 0.020 0.051 0.103 0.211 4.605 5.991 7.378 9.210 10.5973 0.072 0.115 0.216 0.352 0.584 6.251 7.815 9.348 11.345 12.8384 0.207 0.297 0.484 0.711 1.064 7.779 9.488 11.143 13.277 14.8605 0.412 0.554 0.831 1.145 1.610 9.236 11.070 12.832 15.086 16.7506 0.676 0.872 1.237 1.635 2.204 10.645 12.592 14.449 16.812 18.5487 0.989 1.239 1.690 2.167 2.833 12.017 14.067 16.013 18.475 20.2788 1.344 1.646 2.180 2.733 3.490 13.362 15.507 17.535 20.090 21.9559 1.735 2.088 2.700 3.325 4.168 14.684 16.919 19.023 21.666 23.58910 2.156 2.558 3.247 3.940 4.865 15.987 18.307 20.483 23.209 25.18811 2.603 3.053 3.816 4.575 5.580 17.275 19.675 21.920 24.725 26.75712 3.074 3.571 4.404 5.226 6.304 18.549 21.026 23.337 26.217 28.30013 3.565 4.107 5.009 5.892 7.042 19.812 22.362 24.736 27.688 29.81914 4.075 4.660 5.629 6.571 7.790 21.064 23.685 26.119 29.141 31.31915 4.601 5.229 6.262 7.261 8.547 22.307 24.996 27.488 30.578 32.80116 5.142 5.812 6.908 7.962 9.312 23.542 26.296 28.845 32.000 34.26717 5.697 6.408 7.564 8.672 10.085 24.769 27.587 30.191 33.409 35.71818 6.265 7.015 8.231 9.390 10.865 25.989 28.869 31.526 34.805 37.15619 6.844 7.633 8.907 10.117 11.651 27.204 30.144 32.852 36.191 38.58220 7.434 8.260 9.591 10.851 12.443 28.412 31.410 34.170 37.566 39.99721 8.034 8.897 10.283 11.591 13.240 29.615 32.671 35.479 38.932 41.40122 8.643 9.542 10.982 12.338 14.042 30.813 33.924 36.781 40.289 42.79623 9.260 10.196 11.689 13.091 14.848 32.007 35.172 38.076 41.638 44.18124 9.886 10.856 12.401 13.848 15.659 33.196 36.415 39.364 42.980 45.55825 10.520 11.524 13.120 14.611 16.473 34.382 37.652 40.646 44.314 46.92826 11.160 12.198 13.844 15.379 17.292 35.563 38.885 41.923 45.642 48.29027 11.808 12.879 14.573 16.151 18.114 36.741 40.113 43.194 46.963 49.64528 12.461 13.565 15.308 16.928 18.939 37.916 41.337 44.461 48.278 50.99329 13.121 14.256 16.047 17.708 19.768 39.088 42.557 45.722 49.588 52.33630 13.787 14.953 16.791 18.493 20.599 40.256 43.773 46.979 50.892 53.672ex
emplar
exemplar
DRAFT
DRAFT

37Pearson Edexcel Level 3 Advanced Subsidiary and Advanced GCE in Mathematics and Further Mathematics Mathematical Formulae and Statistical Tables – Issue 1 – July 2017 – © Pearson Education Limited 2017
Critical Values for Correlation CoefficientsThese tables concern tests of the hypothesis that a population correlation coefficient ρ is 0. The values in the tables are the minimum values which need to be reached by a sample correlation coefficient in order to be significant at the level shown, on a one-tailed test.
Product Moment Coefficient
Sample size, n
Spearman’s Coefficient
Level Level
0.10 0.05 0.025 0.01 0.005 0.05 0.025 0.010.8000 0.9000 0.9500 0.9800 0.9900 4 1.0000 – –0.6870 0.8054 0.8783 0.9343 0.9587 5 0.9000 1.0000 1.00000.6084 0.7293 0.8114 0.8822 0.9172 6 0.8286 0.8857 0.94290.5509 0.6694 0.7545 0.8329 0.8745 7 0.7143 0.7857 0.89290.5067 0.6215 0.7067 0.7887 0.8343 8 0.6429 0.7381 0.83330.4716 0.5822 0.6664 0.7498 0.7977 9 0.6000 0.7000 0.78330.4428 0.5494 0.6319 0.7155 0.7646 10 0.5636 0.6485 0.74550.4187 0.5214 0.6021 0.6851 0.7348 11 0.5364 0.6182 0.70910.3981 0.4973 0.5760 0.6581 0.7079 12 0.5035 0.5874 0.67830.3802 0.4762 0.5529 0.6339 0.6835 13 0.4835 0.5604 0.64840.3646 0.4575 0.5324 0.6120 0.6614 14 0.4637 0.5385 0.62640.3507 0.4409 0.5140 0.5923 0.6411 15 0.4464 0.5214 0.60360.3383 0.4259 0.4973 0.5742 0.6226 16 0.4294 0.5029 0.58240.3271 0.4124 0.4821 0.5577 0.6055 17 0.4142 0.4877 0.56620.3170 0.4000 0.4683 0.5425 0.5897 18 0.4014 0.4716 0.55010.3077 0.3887 0.4555 0.5285 0.5751 19 0.3912 0.4596 0.53510.2992 0.3783 0.4438 0.5155 0.5614 20 0.3805 0.4466 0.52180.2914 0.3687 0.4329 0.5034 0.5487 21 0.3701 0.4364 0.50910.2841 0.3598 0.4227 0.4921 0.5368 22 0.3608 0.4252 0.49750.2774 0.3515 0.4133 0.4815 0.5256 23 0.3528 0.4160 0.48620.2711 0.3438 0.4044 0.4716 0.5151 24 0.3443 0.4070 0.47570.2653 0.3365 0.3961 0.4622 0.5052 25 0.3369 0.3977 0.46620.2598 0.3297 0.3882 0.4534 0.4958 26 0.3306 0.3901 0.45710.2546 0.3233 0.3809 0.4451 0.4869 27 0.3242 0.3828 0.44870.2497 0.3172 0.3739 0.4372 0.4785 28 0.3180 0.3755 0.44010.2451 0.3115 0.3673 0.4297 0.4705 29 0.3118 0.3685 0.43250.2407 0.3061 0.3610 0.4226 0.4629 30 0.3063 0.3624 0.42510.2070 0.2638 0.3120 0.3665 0.4026 40 0.2640 0.3128 0.36810.1843 0.2353 0.2787 0.3281 0.3610 50 0.2353 0.2791 0.32930.1678 0.2144 0.2542 0.2997 0.3301 60 0.2144 0.2545 0.30050.1550 0.1982 0.2352 0.2776 0.3060 70 0.1982 0.2354 0.27820.1448 0.1852 0.2199 0.2597 0.2864 80 0.1852 0.2201 0.26020.1364 0.1745 0.2072 0.2449 0.2702 90 0.1745 0.2074 0.24530.1292 0.1654 0.1966 0.2324 0.2565 100 0.1654 0.1967 0.2327
5
exemplar
exemplar
DRAFT
DRAFT

38 Pearson Edexcel Level 3 Advanced Subsidiary and Advanced GCE in Mathematics and Further Mathematics Mathematical Formulae and Statistical Tables – Issue 1 – July 2017 – © Pearson Education Limited 2017
Random Numbers
86 13 84 10 07 30 39 05 97 96 88 07 37 26 04 89 13 48 19 2060 78 48 12 99 47 09 46 91 33 17 21 03 94 79 00 08 50 40 1678 48 06 37 82 26 01 06 64 65 94 41 17 26 74 66 61 93 24 9780 56 90 79 66 94 18 40 97 79 93 20 41 51 25 04 20 71 76 0499 09 39 25 66 31 70 56 30 15 52 17 87 55 31 11 10 68 98 2356 32 32 72 91 65 97 36 56 61 12 79 95 17 57 16 53 58 96 3666 02 49 93 97 44 99 15 56 86 80 57 11 78 40 23 58 40 86 1431 77 53 94 05 93 56 14 71 23 60 46 05 33 23 72 93 10 81 2398 79 72 43 14 76 54 77 66 29 84 09 88 56 75 86 41 67 04 4250 97 92 15 10 01 57 01 87 33 73 17 70 18 40 21 24 20 66 6290 51 94 50 12 48 88 95 09 34 09 30 22 27 25 56 40 76 01 5931 99 52 24 13 43 27 88 11 39 41 65 00 84 13 06 31 79 74 9722 96 23 34 46 12 67 11 48 06 99 24 14 83 78 37 65 73 39 4706 84 55 41 27 06 74 59 14 29 20 14 45 75 31 16 05 41 22 9608 64 89 30 25 25 71 35 33 31 04 56 12 67 03 74 07 16 49 3286 87 62 43 15 11 76 49 79 13 78 80 93 89 09 57 07 14 40 7494 44 97 13 77 04 35 02 12 76 60 91 93 40 81 06 85 85 72 8463 25 55 14 66 47 99 90 02 90 83 43 16 01 19 69 11 78 87 1611 22 83 98 15 21 18 57 53 42 91 91 26 52 89 13 86 00 47 6101 70 10 83 94 71 13 67 11 12 36 54 53 32 90 43 79 01 95 15
exemplar
exemplar
DRAFT
DRAFT

39Pearson Edexcel Level 3 Advanced Subsidiary and Advanced GCE in Mathematics and Further Mathematics Mathematical Formulae and Statistical Tables – Issue 1 – July 2017 – © Pearson Education Limited 2017
Percentage Points of Student’s t DistributionThe values in the table are those which a random variable with Student’s t distribution on v degrees of freedom exceeds with the probability shown.
v 0.10 0.05 0.025 0.01 0.0051 3.078 6.314 12.706 31.821 63.6572 1.886 2.920 4.303 6.965 9.9253 1.638 2.353 3.182 4.541 5.8414 1.533 2.132 2.776 3.747 4.6045 1.476 2.015 2.571 3.365 4.0326 1.440 1.943 2.447 3.143 3.7077 1.415 1.895 2.365 2.998 3.4998 1.397 1.860 2.306 2.896 3.3559 1.383 1.833 2.262 2.821 3.250
10 1.372 1.812 2.228 2.764 3.16911 1.363 1.796 2.201 2.718 3.10612 1.356 1.782 2.179 2.681 3.05513 1.350 1.771 2.160 2.650 3.01214 1.345 1.761 2.145 2.624 2.97715 1.341 1.753 2.131 2.602 2.94716 1.337 1.746 2.120 2.583 2.92117 1.333 1.740 2.110 2.567 2.89818 1.330 1.734 2.101 2.552 2.87819 1.328 1.729 2.093 2.539 2.86120 1.325 1.725 2.086 2.528 2.84521 1.323 1.721 2.080 2.518 2.83122 1.321 1.717 2.074 2.508 2.81923 1.319 1.714 2.069 2.500 2.80724 1.318 1.711 2.064 2.492 2.79725 1.316 1.708 2.060 2.485 2.78726 1.315 1.706 2.056 2.479 2.77927 1.314 1.703 2.052 2.473 2.77128 1.313 1.701 2.048 2.467 2.76329 1.311 1.699 2.045 2.462 2.75630 1.310 1.697 2.042 2.457 2.75032 1.309 1.694 2.037 2.449 2.73834 1.307 1.691 2.032 2.441 2.72836 1.306 1.688 2.028 2.435 2.71938 1.304 1.686 2.024 2.429 2.71240 1.303 1.684 2.021 2.423 2.70445 1.301 1.679 2.014 2.412 2.69050 1.299 1.676 2.009 2.403 2.67855 1.297 1.673 2.004 2.396 2.66860 1.296 1.671 2.000 2.390 2.66070 1.294 1.667 1.994 2.381 2.64880 1.292 1.664 1.990 2.374 2.63990 1.291 1.662 1.987 2.369 2.632
100 1.290 1.660 1.984 2.364 2.626110 1.289 1.659 1.982 2.361 2.621120 1.289 1.658 1.980 2.358 2.617
5
exemplar
exemplar
DRAFT
DRAFT

40 Pearson Edexcel Level 3 Advanced Subsidiary and Advanced GCE in Mathematics and Further Mathematics Mathematical Formulae and Statistical Tables – Issue 1 – July 2017 – © Pearson Education Limited 2017
Percentage Points of the F DistributionThe values in the table are those which a random variable with the F distribution on v1 and v2 degrees of freedom exceeds with probability 0.05 or 0.01.
Probabilityv1
v2
1 2 3 4 5 6 8 10 12 24 ∞
0.05
1 161.4 199.5 215.7 224.6 230.2 234.0 238.9 241.9 243.9 249.1 254.32 18.51 19.00 19.16 19.25 19.30 19.33 19.37 19.40 19.41 19.46 19.503 10.13 9.55 9.28 9.12 9.01 8.94 8.85 8.79 8.74 8.64 8.534 7.71 6.94 6.59 6.39 6.26 6.16 6.04 5.96 5.91 5.77 5.635 6.61 5.79 5.41 5.19 5.05 4.95 4.82 4.74 4.68 4.53 4.376 5.99 5.14 4.76 4.53 4.39 4.28 4.15 4.06 4.00 3.84 3.677 5.59 4.74 4.35 4.12 3.97 3.87 3.73 3.64 3.57 3.41 3.238 5.32 4.46 4.07 3.84 3.69 3.58 3.44 3.35 3.28 3.12 2.939 5.12 4.26 3.86 3.63 3.48 3.37 3.23 3.14 3.07 2.90 2.71
10 4.96 4.10 3.71 3.48 3.33 3.22 3.07 2.98 2.91 2.74 2.5411 4.84 3.98 3.59 3.36 3.20 3.09 2.95 2.85 2.79 2.61 2.4012 4.75 3.89 3.49 3.26 3.11 3.00 2.85 2.75 2.69 2.51 2.3014 4.60 3.74 3.34 3.11 2.96 2.85 2.70 2.60 2.53 2.35 2.1316 4.49 3.63 3.24 3.01 2.85 2.74 2.59 2.49 2.42 2.24 2.0118 4.41 3.55 3.16 2.93 2.77 2.66 2.51 2.41 2.34 2.15 1.9220 4.35 3.49 3.10 2.87 2.71 2.60 2.45 2.35 2.28 2.08 1.8425 4.24 3.39 2.99 2.76 2.60 2.49 2.34 2.24 2.16 1.96 1.7130 4.17 3.32 2.92 2.69 2.53 2.42 2.27 2.16 2.09 1.89 1.6240 4.08 3.23 2.84 2.61 2.45 2.34 2.18 2.08 2.00 1.79 1.5160 4.00 3.15 2.76 2.53 2.37 2.25 2.10 1.99 1.92 1.70 1.39
120 3.92 3.07 2.68 2.45 2.29 2.18 2.02 1.91 1.83 1.61 1.25∞ 3.84 3.00 2.60 2.37 2.21 2.10 1.94 1.83 1.75 1.52 1.00
0.01
1 4052. 5000. 5403. 5625. 5764. 5859. 5982. 6056. 6106. 6235. 6366.2 98.50 99.00 99.17 99.25 99.30 99.33 99.37 99.40 99.42 99.46 99.503 34.12 30.82 29.46 28.71 28.24 27.91 27.49 27.23 27.05 26.60 26.134 21.20 18.00 16.69 15.98 15.52 15.21 14.80 14.55 14.37 13.93 13.455 16.26 13.27 12.06 11.39 10.97 10.67 10.29 10.05 9.89 9.47 9.026 13.70 10.90 9.78 9.15 8.75 8.47 8.10 7.87 7.72 7.31 6.887 12.20 9.55 8.45 7.85 7.46 7.19 6.84 6.62 6.47 6.07 5.658 11.30 8.65 7.59 7.01 6.63 6.37 6.03 5.81 5.67 5.28 4.869 10.60 8.02 6.99 6.42 6.06 5.80 5.47 5.26 5.11 4.73 4.31
10 10.00 7.56 6.55 5.99 5.64 5.39 5.06 4.85 4.17 4.33 3.9111 9.65 7.21 6.22 5.67 5.32 5.07 4.74 4.54 4.40 4.02 3.6012 9.33 6.93 5.95 5.41 5.06 4.82 4.50 4.30 4.16 3.78 3.3614 8.86 6.51 5.56 5.04 4.70 4.46 4.14 3.94 3.80 3.43 3.0016 8.53 6.23 5.29 4.77 4.44 4.20 3.89 3.69 3.55 3.18 2.7518 8.29 6.01 5.09 4.58 4.25 4.01 3.71 3.51 3.37 3.00 2.5720 8.10 5.85 4.94 4.43 4.10 3.87 3.56 3.37 3.23 2.86 2.4225 7.77 5.57 4.68 4.18 3.86 3.63 3.32 3.13 2.99 2.62 2.1730 7.56 5.39 4.51 4.02 3.70 3.47 3.17 2.98 2.84 2.47 2.0140 7.31 5.18 4.31 3.83 3.51 3.29 2.99 2.80 2.66 2.29 1.8060 7.08 4.98 4.13 3.65 3.34 3.12 2.82 2.63 2.50 2.12 1.60
120 6.85 4.79 3.95 3.48 3.17 2.96 2.66 2.47 2.34 1.95 1.38∞ 6.63 4.61 3.78 3.32 3.02 2.80 2.51 2.32 2.18 1.79 1.00
If an upper percentage point of the F distribution on v1 and v2 degrees of freedom is f, then the corresponding lower percentage point of the F distribution on v2 and v1 degrees of freedom is 1/ f .
exemplar
exemplar
DRAFT
DRAFT

exemplar
exemplar
DRAFT
DRAFT

exemplar
exemplar
DRAFT
DRAFT

exemplar
exemplar
DRAFT
DRAFT

exemplar
exemplar
DRAFT
DRAFT