Embed Size (px)
Citation preview
Adriana Filipa Soares Lima
Genetic modification of a bacteriophage
to create a multifunctional drug delivery
particle
Universidade do Minho
Escola de Engenharia
Outubro de 2016
Adriana F
ilipa S
oare
s Lim
a
Genetic m
odific
ation
of
a b
act
eri
ophage
to
cre
ate
a m
ultifunct
ional dru
g d
eliv
ery
part
icle
M
inho |
2016
U

Adriana Filipa Soares Lima
Genetic modification of a bacteriophage to
create a multifunctional drug delivery
particle
Dissertação de Mestrado
Mestrado em Bioengenharia
Trabalho efetuado sob a orientação da
Doutora Ivone Martins
e da
Professora Doutora Ligia Rodrigues
Outubro de 2016
100 µm
ii
DECLARAÇÃO
Nome: Adriana Filipa Soares Lima
Endereço eletrónico: [email protected] Telefone: 966947362
Bilhete de Identidade/Cartão do Cidadão: 14002587
Título da dissertação: Genetic modification of a bacteriophage to create a multifunctional drug
delivery particle
Orientadoras:
Doutora Ivone Marisa Pereira Martins
Professora Doutora Lígia Raquel Marona Rodrigues
Ano de conclusão: 2016
Mestrado em Bioengenharia
iii
É AUTORIZADA A REPRODUÇÃO INTEGRAL DESTA DISSERTAÇÃO APENAS PARA EFEITOS DE
INVESTIGAÇÃO, MEDIANTE DECLARAÇÃO ESCRITA DO INTERESSADO, QUE A TAL SE
COMPROMETE.
Universidade do Minho, _____/_____/_________
Assinatura:

v
Agradecimentos
“ Áqueles que passam por nós, não vão sós, não nos deixam sós.
Deixam pouco de si, levam um pouco de nós.”
Antoine de Saint-Exupéry
Mais uma etapa cumprida no meu percurso académico e é de coração cheio que a termino. Foi
longa a jornada e com algumas dificuldades mas o verdadeiro espirito cientifico encontra-se na
capacidade de as ultrassar em vez de apenas disistir.
Foram muitos os que se cruzaram comigo e que me acompanharam nesta jornarda, partilhamos
ideias, conhecimentos, lágrimas e sorrisos.
Queria agradecer primeiramente e deixar uma homenagem a um grande exemplo, que me
inspirou e me propôs este tema tão desafiante, o Doutor Leon Kluskens.
Agradeço também às minhas orientadoras Doutora Ivone Martins e Professora Doutora Lígia
Rodrigues por toda a ajuda, orientação e disponibilidade ao longo desta etapa.
Um obrigada do tamanho do mundo à Dédora Ferreira e à Ana Rita Costa por toda a instrução,
partilha e conhecimento, sem vocês não teria conseguido.
Às “sargentas” da PBMS, Carla Magalhães e Joana Rodrigues quero agradecer pelos
raspanetes... Ahahaha… Muito obrigada por me ensinarem a ter boas práticas laboratoriais… e por
estarem lá sempre que precisei.
Ana Silva, Diana Sousa, Márcia Couto e Rodrigo Monteiro obrigada por terem sido os melhores
parceiros de laboratório… Por me terem proporcinado um ano cheio de gargalhadas e por estarem
presentes nos momentos menos bons.
Queria expressar uma enorme gratidão para com os amigos de coração que fiz desde que
cheguei á Unversidade do Minho, em especial ao Óscar, Bruno, Eloy, Luís, Bia, Henrique, Ana, Maria e
Hugo (Boro) que me acolheram como fosse família (Família Autêntica). Não era nada sem vocês!
Daniel (Deny) obrigada por seres o melhor namorado do mundo, mas principalmente por seres
o meu melhor amigo. De todos és tu quem sabe de tudo, quem mais me apoiou incondicionalmente, me
abraçou e fez rir nos momentos menos bons. Obrigada por todo o carinho, amor e compreensão que ao
longo destes anos me proporcinaste.
Por ultimo, mas não menos importante, um obrigada do tamanho do Universo à minha família:
Aos meus pais que me criaram e fizeram de mim a pessoa que hoje sou, que me ensinaram a ser fiel a

vi
mim mesma, que sempre me apoiaram e sempre tiveram orgulho em mim; Ao meu irmão, que tanto
amo, por se ter tornado um rapaz que admiro, amigo, talentoso, cheio de vida e por me dar ânimo e
inspiração; Aos meus tios, avós e prima (Bárbara) por fazerem parte do meu dia-a-dia, desde de que me
lembro, pelo apoio e carinho.
Agora, já no fim, sei que ainda é só o começo…
vii
Resumo
O cancro da mama é o cancro mais frequentemente diagnosticado e a principal causa de morte
por cancro entre as mulheres em todo o mundo, tendo sido estimados cerca de 1,7 milhões de novos
casos e 521,900 mortes em 2012. Os tratamentos convencionais, como a quimioterapia e a radioterapia,
continuam a ser a base terapêutica deste tipo de doença. Contudo, estes tipos de tratamentos não são
específicos tendo como alvo todas as células em divisão, sendo que, no caso da quimioterapia, há uma
distribuição e penetração indiscriminada de drogas altamente citotóxicas, resultando na deteriorazação
física dos pacientes. Para resolver este problema e melhorar o estilo de vida do paciente, têm vindo a
desenvolver-se novas terapias direcionadas, com o objectivo de eliminar apenas as células cancerosas.
Este trabalho tem como objectivo desenvolver uma nanopartícula, à base de bacteriofagos, de
forma a transportar drogas citotóxicas e diminuir a sua concentração in situ. Para atingir este objetivo, o
bacteriofago filamentoso M13 foi geneticamente modificado, com o propósito deste exibir o péptido de
internalização celular HIV-Tat à sua superfície, através da técnica de phage display. De seguida os fagos
genéticamente modificados foram químicamente conjugados com um fármaco anticancerígeno, a
doxorrubicina, sendo assim esperado um payload citotóxico mais baixo e controlado, no local do tumor.
Apesar do fago ter sido genéticamente modificado com sucesso e ter mostrado internalizar nas células
tumorais de cancro de mama, este parece não ter qualquer actividade citotóxica quando comparado com
o efeito da droga livre.
No futuro o fago construido neste trabalho deverá ser geneticamente modificado com a
sequencia de um peptido de reconhecimento de forma a discriminar entre celulas cancerígenas e
saudáveis, criando assim uma particula citotóxica direcionada.
PALAVRAS-CHAVE: CANCRO DE MAMA, PHAGE DISPLAY, PÉPTIDOS DE INTERNALIZAÇÃO CELULAR, DOXORUBICINA,
TRANSPORTE DE DROGAS

ix
Abstract
Breast cancer is the most frequently diagnosed cancer and the leading cause of cancer death
among females worldwide, with an estimated 1.7 million new cases and 521,900 deaths in 2012.
Conventional treatments, such as chemotherapy and radiotherapy, continue to be the base of cancer
therapy. These types of treatments non-specifically target any dividing cells, which in the case of
chemotherapy, results in an indiscriminate drug distribution and severe toxicity for patients associated to
a poor distribution and penetration of the drugs. To solve this problem and improve patient’s lifestyle, it
is of utmost importance the development of new targeted therapies that eventually eliminate only cancer
cells.
This work aimed to develop a phage-based nanoparticle that will be used as a carrier for cytotoxic
drugs in order to decrease drugs concentration in situ. To achieve this goal, the M13 filamentous
bacteriophage was genetically modified to display, on its surface, HIV-Tat cell-penetrating peptides, which
allows the internalization of the phage particles towards breast cancer cells. Genetically modified phages
were then conjugated with the doxorubicin anti-carcinogenic drug, which was expected to result in a lower,
controlled and in situ cytotoxic payload. Despite M13 phage has been genetically modified with success
and proved to penetrate the cells, it appears to have no enhanced cytotoxic activity when compared to
the free drug effect.
In the future the phages obtainded in this work should be genetically modified with a sequencence
encoding for a recognition peptide to discriminate between cancerous and healthy cells, thereby creating
a targeted cytotoxic particle.
KEYWORDS: BREAST CANCER, PHAGE DISPLAY, CELL PENETRATING PEPTIDES, DOXORUBICIN, DRUG DELIVERY

xi
Table of contents
Agradecimentos ................................................................................................................................... v
Resumo............................................................................................................................................. vii
Abstract.............................................................................................................................................. ix
Lista de Figuras ................................................................................................................................. xv
Lista de Tabelas ................................................................................................................................ xix
Lista de Abreviaturas, Siglas e Acrónimos .......................................................................................... xxi
1. State of the art .............................................................................................................................. 1
1.1. Cell cycle in cancer ................................................................................................................. 1
1.2. Breast cancer ......................................................................................................................... 3
1.2.1. Conventional diagnosis and treatment .............................................................................. 5
1.2.2. Molecular cancer imaging - use of targeting ligands .......................................................... 7
1.3. Targeted drug delivery: new approaches ................................................................................. 8
1.3.1. Bacteriophages as nanocarriers for cancer therapy ........................................................... 9
1.3.1.1. The M13 Phage .......................................................................................................... 10
1.3.1.2. Genetic manipulation and chemical conjugation of M13 phage .................................... 12
1.3.1.3. Problems associated to the use of bacteriophages in cancer treatment ........................ 16
1.4. Objectives ......................................................................................................................... 16
2. Materials and Methods ................................................................................................................ 18
2.1. M13KE Phage Manipulation .................................................................................................. 18
2.1.1. HIV-Tat peptide cloning on M13 phage genome .............................................................. 18
2.1.2. M13KE phage production and tittering ........................................................................... 18
2.1.3. M13KE phage DNA extraction ........................................................................................ 20
2.1.4. Synthesis of HIV-Tat sequences for later cloning in M13KE vector ................................... 20
2.1.4.1. First approach ............................................................................................................ 20
2.1.4.2. Second approach........................................................................................................ 21
xii
2.1.4.3. Third approach – Round PCR...................................................................................... 22
2.1.5. M13KE DNA genetic manipulation to clone HIV-Tat peptide sequence ............................. 24
2.1.5.1. Double digestion of the M13KE DNA - vector ............................................................... 25
2.1.5.2. Double digestion of the HIV-Tat peptide - insert ............................................................ 25
2.1.5.3. Ligation of the M13KE DNA vector with HIV-Tat insert .................................................. 26
2.1.6. Transformation of E. coli JM109 .................................................................................... 27
2.1.6.1. E. coli JM109 electrocompetent cells .......................................................................... 28
2.1.6.1.1. Transformation – electroporation process ................................................................ 28
2.1.6.2. E. coli JM109 chemocompetent cells .......................................................................... 29
2.1.6.2.1. Transformation - thermal shock ................................................................................ 29
2.1.7. Transformants amplification and DNA extraction ............................................................. 29
2.1.8. Confirmation of the modified clones ............................................................................... 30
2.1.9. DNA sequencing of the positive phage transformants ...................................................... 31
2.2. M13KO7 Helper Phage manipulation - Phagemid cloning system .......................................... 32
2.2.1. PETDuet and pGEM phagemids manipulation ................................................................. 33
2.2.1.1. Extraction of phagemids .............................................................................................. 33
2.2.1.2. Synthesis of the sequence encoding HIV-Tat peptide .................................................... 33
2.2.1.3. Double digestion of pETDuet and pGEM - vectors ......................................................... 33
2.2.1.4. Double digestion of sequences encoding HIV-Tat peptide - insert .................................. 34
2.2.1.5. Ligation of phagemids with HIV-Tat sequence .............................................................. 35
2.2.1.6. Amplification of the positive clones - colony PCR .......................................................... 35
2.2.2. Infection of transformed E. coli JM109 with M13KO7 helper phage ................................ 38
2.2.2.1. Confirmation of the phagemids packaged into M13KO7 genome ................................. 39
2.2.3. Chemical functionalization of the modified M13KO7 phages with a fluorochrome ........... 41
2.2.3.1. Conjugation of phages with Alexa-Fluor 488 TFP ester ................................................. 41
2.2.3.1.1. Microsep advance centrifuge device sanitization ....................................................... 41
xiii
2.3. Cell lines and culture conditions ............................................................................................ 42
2.4. Cell internalization assays with Alexa-Fluor 488 TFP ester ...................................................... 43
2.4.1. Evaluation of cells internalization by flow cytometry ........................................................ 43
2.4.2. Evaluation of cells internalization by fluorescence microscopy ......................................... 44
2.5. DOX chemical conjugation to M13KO7 phages ...................................................................... 44
2.6. Cytotoxicity evaluation through Sulforhodamine B colorimetric assay...................................... 46
3. Results and Discussion ................................................................................................................ 47
3.1. M13KE phage quantification ................................................................................................. 47
3.2. M13KE phage genetic manipulation ...................................................................................... 48
3.2.1. First approach ............................................................................................................... 48
3.2.2. Second approach ........................................................................................................... 49
3.2.3. Round PCR – third approach .......................................................................................... 50
3.3. M13KO7 helper phage manipulation - Phagemid cloning system ........................................... 52
3.3.1. Cloning HIV-Tat in pGEM and pETDuet phagemids.......................................................... 53
3.3.2. M13KO7 helper phage infection of E. coli JM109 transformed with modified phagemids . 54
3.4. Internalization tests ............................................................................................................... 55
3.4.1. Flow cytometry .............................................................................................................. 55
3.4.2. Fluorescence microscopy ............................................................................................... 56
3.5. DOX conjugation ................................................................................................................... 58
3.6. SRB cytotoxicity test .............................................................................................................. 60
4. Conclusions and futures perspectives .......................................................................................... 63
5. Bibliography ................................................................................................................................ 65

xv
Lista de Figuras
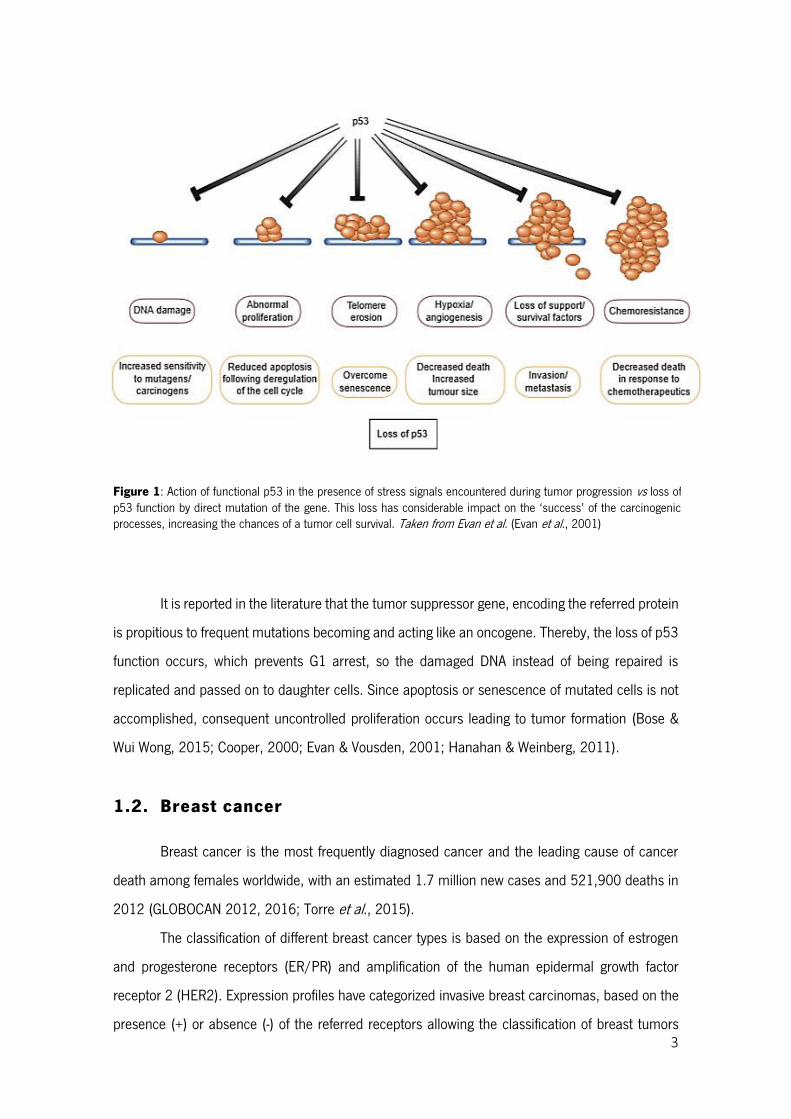
Figure 1: Action of functional p53 in the presence of stress signals encountered during tumor progression vs loss of p53 function by direct mutation of the gene. This loss has considerable impact on the ‘success’ of the carcinogenic processes, increasing the chances of a tumor cell survival. Taken from Evan et al. (Evan et al., 2001) ............................................................................................................. 3
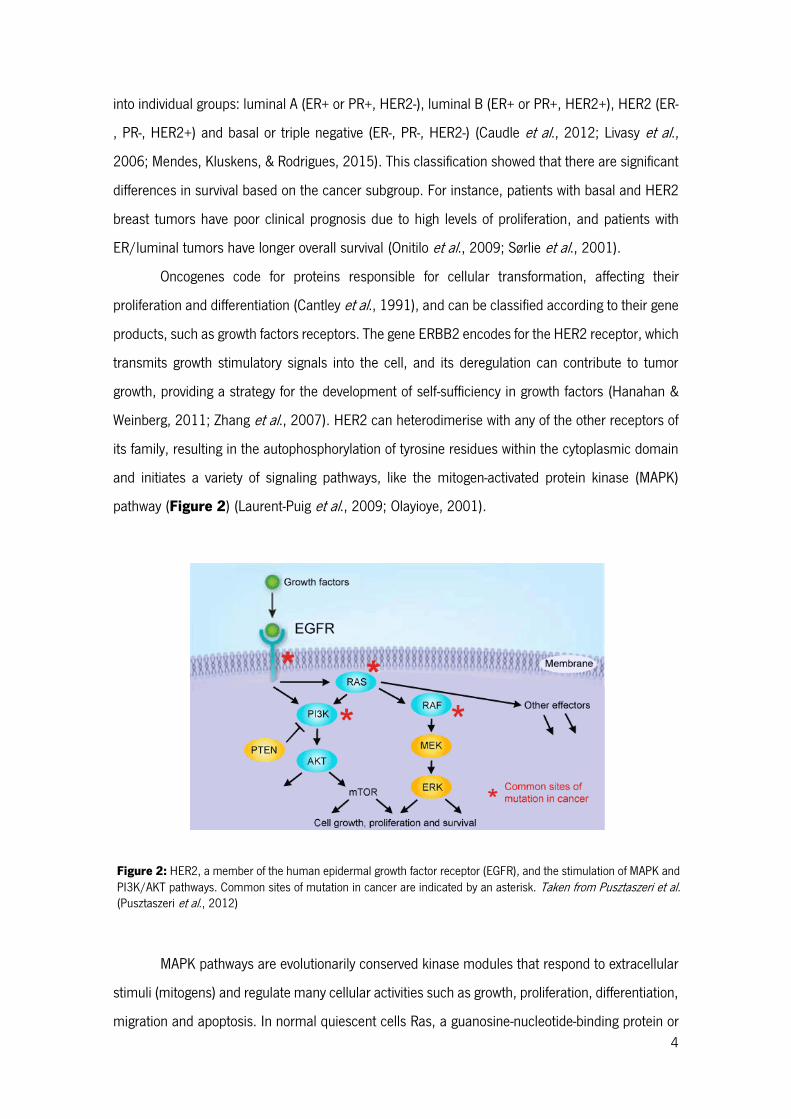
Figure 2: HER2, a member of the human epidermal growth factor receptor (EGFR), and the stimulation of MAPK and PI3K/AKT pathways. Common sites of mutation in cancer are indicated by an asterisk. Taken from Pusztaszeri et al. (Pusztaszeri et al., 2012) ....................................................................... 4
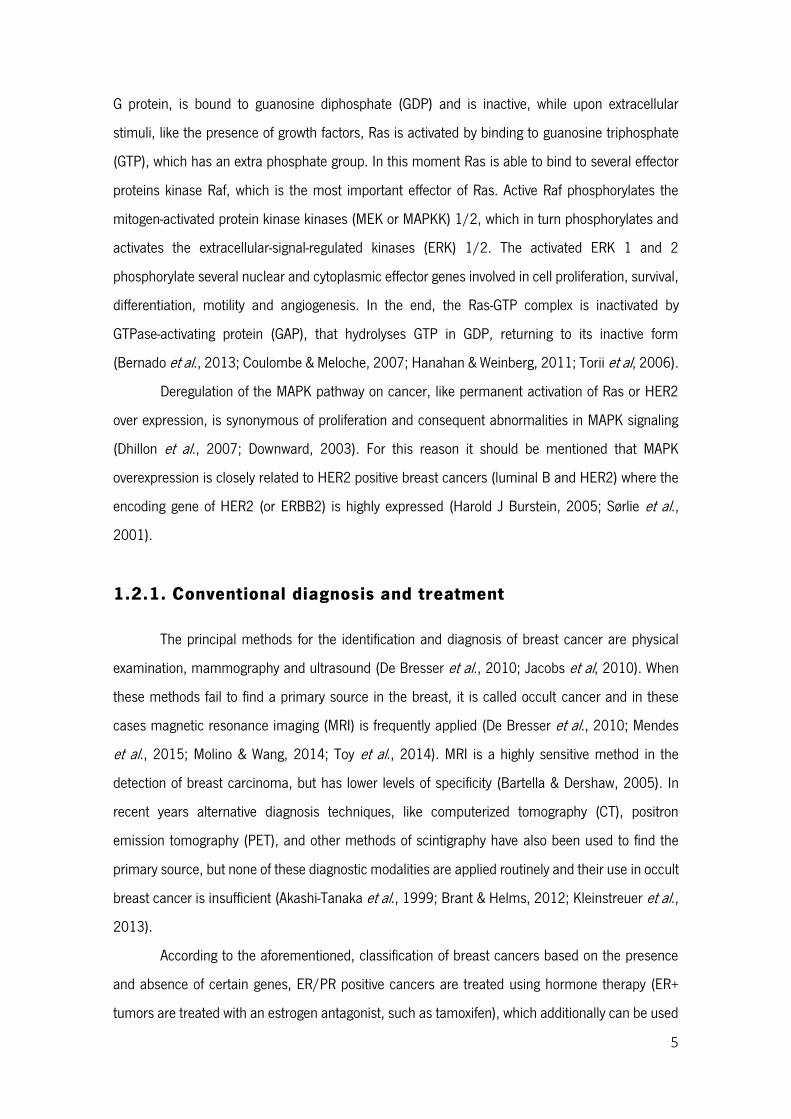
Figure 3: Example of non-directional drug delivery vs directional-targeted drug delivery to a tumor in the human liver. Taken from Kleinstreuer et al. (Kleinstreuer et al., 2013) ................................................. 7
Figure 4: Schematic diagram of a nanomedicine (NM) with (A) encapsulated or (B) surface-bound drugs. The NM drug carrier is modified with a targeting molecule. Taken from Aguilar (Aguilar, 2013) ............ 8
Figure 5: The general structure of M13 filamentous phage. The phage capsid is made up of five coat proteins: one major coat protein pVIII and pIII, pVI, pVII and pIX at the ends of the phage virion. Taken from Bakhshinejad et al. (Bakhshinejad et al., 2014) ......................................................................... 11
Figure 6: Type of carriers and cargos that can be associated to CPPs to increase cell uptake. Adapted from Sawant et al. (Sawant et al., 2013) ........................................................................................... 13
Figure 7: Schematic structure of a M13 bacteriophage (A) and its major coat proteins (B). Taken from Chung et al. (Chung et al., 2014) ...................................................................................................... 15
Figure 8: Schematic representation of the M13KE quantification methodology. Consecutive 10-fold dilutions (10-1 to 10-12) in SM-buffer were made in a 96-well plate, in a total volume of 100 µl per well. A 10 µl drop of each dilution was plated in a LB/IPTG/X-gal plate with an E. coli JM109 lawn and incubated at 37 °C, overnight. .......................................................................................................................... 19
Figure 9: Schematic representation of the blue plaques in a plate of LB/IPTG/X-gal with an E. coli JM109 lawn after incubation. ............................................................................................................ 19
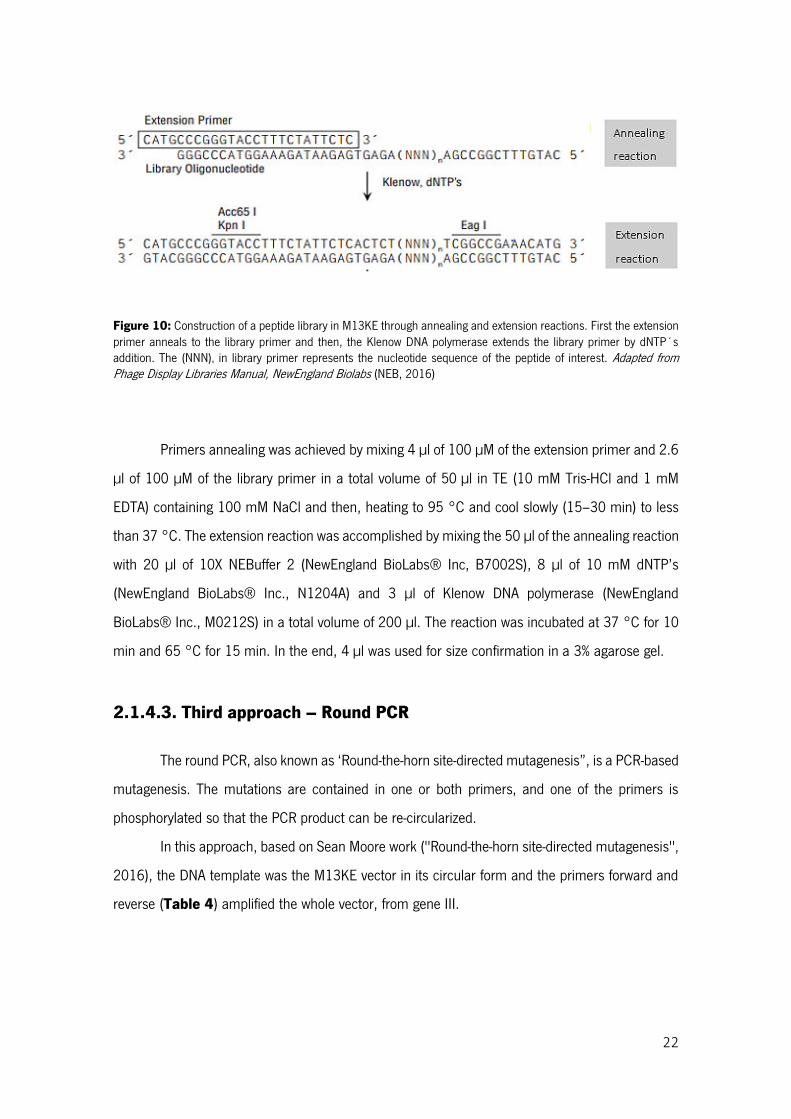
Figure 10: Construction of a peptide library in M13KE through annealing and extension reactions. First the extension primer anneals to the library primer and then, the Klenow DNA polymerase extends the library primer by dNTP´s addition. The (NNN)n in library primer represents the nucleotide sequence of the peptide of interest. Adapted from Phage Display Libraries Manual, NewEngland Biolabs (NEB, 2016) ........................................................................................................................................................ 22
Figure 11: Round PCR method. The primer forward, with a tail containing the HIV-Tat nucleotide sequence, anneals in the beginning of gene III such as the primer reverse, which is phosphorylated. The primers after the annealing extends the whole M13KE vector, resulting in the amplification of M13KE genome modified with HIV-Tat sequence. The 3’ end is phosphorylated in order to re-circularize the vector. ........................................................................................................................................................ 23
xvi
Figure 12: Schematic illustration of the M13KE DNA genetic manipulation. Both HIV-Tat sequence and M13KE DNA vector are double digested and ligated. Then, the ligation product is inserted into competent E. coli strain and phages displaying HIV-Tat peptide are amplified. ..................................................... 25
Figure 13: A phagemid display vector with the ampicillin resistance gene is manipulated in the region of a phage coat (gene III in this case), with HIV-Tat encoding sequence (green color HT), to its posterior packaging into M13KO7 helper phage genome, with kanamycin resistance, resulting in a viral particle which displays on its surface the HIV-Tat peptide.Adapted from Qi et al. (Qi et al., 2012) ................... 32
Figure 14: A colony is picked from plate with a white tip (A). In a LB/ampicillin plate, divided into quadrants, the picked colony is plated in its corresponding quadrant by scratching the tip in the plate and then the used tip is placed in the respective PCR tube containing water (B). ...................................... 37
Figure 15: Infection of transformed bacteria (with manipulated phagemids), with the M13KO7 helper phage. .............................................................................................................................................. 39
Figure 16: 4T1 (A and B) and 3T3 (C and D) cell lines at low densities and high densities, respectively. ........................................................................................................................................................ 42
Figure 17: 4T1 cells were plated in 10 wells at 7.5 x 10⁵ cells/ml/well. Previous phages solutions and its controls were added to each well in a final volume of 1 ml of growth medium. C1 corresponds to the control 1, which contains only cells to evaluate cells autofluorescence; C2 corresponds to unmodified and unconjugated M13KO7 phages solution; C3 corresponds to unmodified and conjugated M13KO7 phages solution and A corresponds to modified and conjugated M13KO7 phages solutions. .......................... 43
Figure 18: Schematic representation of the Microsep Advance Centrifugal Device used in the DOX conjugation process to the M13KO7 phages. Adaped from Pall manual. (Pall, 2014) ......................... 45
Figure 19: M13KE phage PFUs plate with 13 drops of successive dilutions of the phage solution. ... 48
Figure 20: LB/IPTG/X-gal plate with E. coli JM109 blue colonies infected by genetically modified M13KE phage. .............................................................................................................................................. 48
Figure 21: Size confirmation of positive clones M13KE::HIV-Tat by an agarose gel after amplification of gene III region present in phages DNA: 1. Low molecular weight marker (LMW) with a 350 bp band; 2. and 9. Negative control (M13KE wild type); 3. to 8., 10. and 11. clones M13KE::HIV-Tat. .................... 49
Figure 22: Size confirmation of positive clones M13KE::HIV-Tat by an agarose gel after amplification of gene III region present in phages DNA: 1. Low molecular weight marker (LMW) with a 350 bp band; 2. to 7. clones M13KE::HIV-Tat 1 to 6; 8. Negative control (M13KE wild type). ........................................ 50
Figure 23: Amplification of the M13KE vector with primers tailed with HIV-Tat sequence, resulting in a linear M13KE vector DNA with the HIV-Tat sequence already inserted: 1. and 5. 1kb DNA ladder; 4. M13KE vector::HIV-Tat amplification (above 7.2 kb). ......................................................................... 51
Figure 24: Size confirmation of positive clones M13KE::HIV-Tat by an agarose gel after amplification of gene III region present in phages DNA: 1. LMW; 2. – 6. and 8. – 13. Clones M13KE::HIV-Tat; 7. and 14. Negative control (M13KE wild type). .................................................................................................. 51
xvii
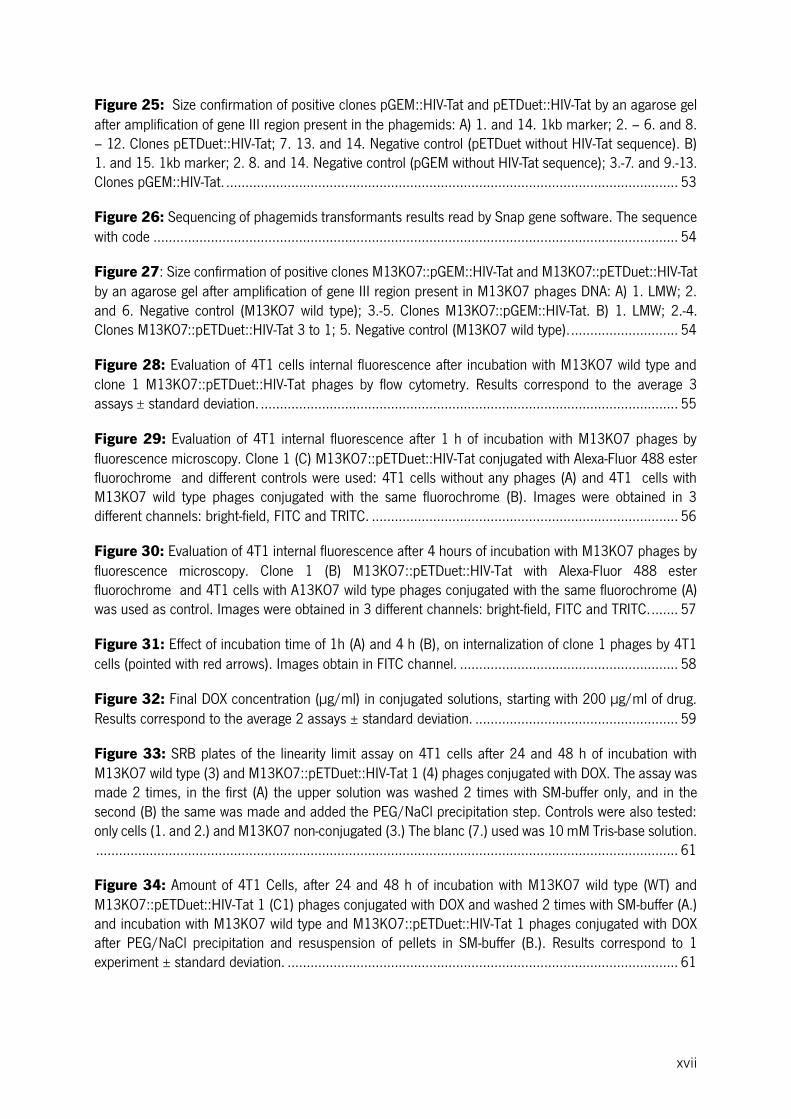
Figure 25: Size confirmation of positive clones pGEM::HIV-Tat and pETDuet::HIV-Tat by an agarose gel after amplification of gene III region present in the phagemids: A) 1. and 14. 1kb marker; 2. – 6. and 8. – 12. Clones pETDuet::HIV-Tat; 7. 13. and 14. Negative control (pETDuet without HIV-Tat sequence). B) 1. and 15. 1kb marker; 2. 8. and 14. Negative control (pGEM without HIV-Tat sequence); 3.-7. and 9.-13. Clones pGEM::HIV-Tat. ...................................................................................................................... 53
Figure 26: Sequencing of phagemids transformants results read by Snap gene software. The sequence with code ......................................................................................................................................... 54
Figure 27: Size confirmation of positive clones M13KO7::pGEM::HIV-Tat and M13KO7::pETDuet::HIV-Tat by an agarose gel after amplification of gene III region present in M13KO7 phages DNA: A) 1. LMW; 2. and 6. Negative control (M13KO7 wild type); 3.-5. Clones M13KO7::pGEM::HIV-Tat. B) 1. LMW; 2.-4. Clones M13KO7::pETDuet::HIV-Tat 3 to 1; 5. Negative control (M13KO7 wild type). ............................ 54
Figure 28: Evaluation of 4T1 cells internal fluorescence after incubation with M13KO7 wild type and clone 1 M13KO7::pETDuet::HIV-Tat phages by flow cytometry. Results correspond to the average 3 assays standard deviation. ............................................................................................................. 55
Figure 29: Evaluation of 4T1 internal fluorescence after 1 h of incubation with M13KO7 phages by fluorescence microscopy. Clone 1 (C) M13KO7::pETDuet::HIV-Tat conjugated with Alexa-Fluor 488 ester fluorochrome and different controls were used: 4T1 cells without any phages (A) and 4T1 cells with M13KO7 wild type phages conjugated with the same fluorochrome (B). Images were obtained in 3 different channels: bright-field, FITC and TRITC. ................................................................................ 56
Figure 30: Evaluation of 4T1 internal fluorescence after 4 hours of incubation with M13KO7 phages by fluorescence microscopy. Clone 1 (B) M13KO7::pETDuet::HIV-Tat with Alexa-Fluor 488 ester fluorochrome and 4T1 cells with A13KO7 wild type phages conjugated with the same fluorochrome (A) was used as control. Images were obtained in 3 different channels: bright-field, FITC and TRITC. ....... 57
Figure 31: Effect of incubation time of 1h (A) and 4 h (B), on internalization of clone 1 phages by 4T1 cells (pointed with red arrows). Images obtain in FITC channel. ......................................................... 58
Figure 32: Final DOX concentration (µg/ml) in conjugated solutions, starting with 200 µg/ml of drug. Results correspond to the average 2 assays ± standard deviation. ..................................................... 59
Figure 33: SRB plates of the linearity limit assay on 4T1 cells after 24 and 48 h of incubation with M13KO7 wild type (3) and M13KO7::pETDuet::HIV-Tat 1 (4) phages conjugated with DOX. The assay was made 2 times, in the first (A) the upper solution was washed 2 times with SM-buffer only, and in the second (B) the same was made and added the PEG/NaCl precipitation step. Controls were also tested: only cells (1. and 2.) and M13KO7 non-conjugated (3.) The blanc (7.) used was 10 mM Tris-base solution. ........................................................................................................................................................ 61
Figure 34: Amount of 4T1 Cells, after 24 and 48 h of incubation with M13KO7 wild type (WT) and M13KO7::pETDuet::HIV-Tat 1 (C1) phages conjugated with DOX and washed 2 times with SM-buffer (A.) and incubation with M13KO7 wild type and M13KO7::pETDuet::HIV-Tat 1 phages conjugated with DOX after PEG/NaCl precipitation and resuspension of pellets in SM-buffer (B.). Results correspond to 1 experiment ± standard deviation. ...................................................................................................... 61

xix
Lista de Tabelas
Table 1: Primers forward (Fw) and reverse (Rv) used for the synthesis of the nucleotide sequence encoding HIV-Tat peptide. The HIV-Tat sequence is underlined. ......................................................... 20
Table 2: Reaction parameters for the insert synthesis by annealing. The annealing was accomplished by gradual heating up to 93 °C and then cooling to 4 °C. ................................................................. 21
Table 3: Extension and library primers used for the synthesis of the nucleotide sequence encoding the HIV-Tat peptide. The HIV-Tat sequence is underlined. ........................................................................ 21
Table 4: Primers forward and reverse used for the synthesis of the nucleotide sequence encoding the HIV-Tat peptide. The HIV-Tat sequence is underlined. ........................................................................ 23
Table 5: Amount of components for the Round PCR Master Mix, in a final volume of 25 µl, and their initial concentrations according to Step 1 of Kappa HiFi PCR Kit technical data sheet (Kappa Biosystems, 2013). .............................................................................................................................................. 24
Table 6: Cycling protocol to preform Round PCR, according to the recommendations described in Step 3 of Kappa HiFi PCR Kit technical data sheet.(Kappa Biosystems, 2013) ........................................... 24
Table 7: Reaction parameters for the ligation between M13KE vector (7202 bp) and the HIV-Tat insert (45 bp) using T4 DNA ligase. ............................................................................................................ 27
Table 8: Reaction parameters for the ligation between M13KE vector (7202 bp) and the HIV-Tat insert (62 bp) using T4 DNA Ligase. ........................................................................................................... 27
Table 9: Reaction parameters for the amplification of gene III region for positive clones confirmation 31
Table 10: Cycling protocol for gene III amplification......................................................................... 31
Table 11: Primers forward and reverse used in the synthesis of nucleotide sequence encoding HIV-Tat peptide for further cloning on each phagemid. The two sequences differ in the restriction sites. The HIV-Tat sequence is underlined. .............................................................................................................. 33
Table 12: Reaction parameters to digest 500 ng of PETDuet and pGEM phagemids ........................ 34
Table 13: Reaction parameters to digest 500 ng of HIV-Tat insert. ................................................... 34
Table 14: Reaction parameters for the ligation between pETDuet phagemid (6700 bp) and the respective insert (50 bp), and between pGEM (4500 bp) and the respective insert (45 bp) using T4 DNA Ligase. The molar ratios used for ligation reaction were calculated using the NEBioCalculator tool. ....................... 35
Table 15: Colony PCR component amounts for a 25 µl final volume. Primers for each phagemid confirmation are represented. ........................................................................................................... 36
Table 16: Colony PCR cycling protocol for both phagemids. Phagemids pETDuet and pGEM without HIV-Tat sequence have, respectively, a 1849 bp and 1494 bp sequence. PETDuet and pGEM with HIV-tat sequence have, respectively, 1867 bp and 1520 bp sequence. ......................................................... 36
xx
Table 17: Components and their amounts for digestion of the extracted phagemids. ....................... 37
Table 18: Reaction parameters for the amplification of gene III region for positive clones confirmation. In a PCR tube the DNA amount needs to be less than 25 ng in a final volume of 20µl. ...................... 40
Table 19: Cycling protocol for gene III amplification. Phages that haven’t packaged the pGEM modified phagemid have a 336 bp sequence in contrast to phages that have, which show 352 bp. Phages that haven’t packaged pETDuet modified phagemid don’t have any sequence in contrast to phages that have, which show 204 bp sequence. .......................................................................................................... 40
xxi
Lista de Abreviaturas, Siglas e Acrónimos
ANOVA Analysis of variance
bp Base pair
CPP Cell-penetrating peptide
CT Computerized tomography
DMEM Dulbecco’s modified eagle’s medium
DNA Deoxyribonucleic acid
dNTPs Deoxynucleotide triphosphates
DOX Doxorubicin
dsDNA Double-stranded DNA
EDC 1-(3-dimethylaminopropyl)-2-ethylcarbodiimide hydrochloride
EDTA Ethylenediaminetetraacetic acid
EGF Epidermal growth factor
EGFR Epidermal growth factor receptor
EPR Enhanced permeability and retention
ER Estrogen receptor
ERK Extracellular-signal-regulated kinase
FBS Fetal bovine serum
FITC Fluorescein isothiocyanate
Fw Forward
GAP GTPase-activating protein
GDP Guanosine diphosphate
GTP Guanosine triphosphate
h Hours
HER2 Human epidermal growth factor
IPTG Isopropyl -D-1-thiogalactopyranoside
kb Kilo bases
kV Kilo Volts
LacZα LacZ alpha fragment
LB Luria-Bertani broth
M Molar
xxii
LMW Low molecular weight
MAPK Mitogen-activated protein kinase
MBW Molecular biology water
MEK Mitogen-activated protein kinase
min Minutes
MRI Magnetic resonance imaging
MWCO Molecular weight cut-off
NHS N-hydroxysuccinimide
NM Nanomedicines
nm Nanometers
OD Optimal density
PBS Phosphate buffered saline
PCR Polymerase chain reaction
PEG Polyethylene glycol
PES Polyethersulfone
PET Positron emission tomography
PFUs Phage forming units
PR Progesterone receptor
Rv Reverse
RNA Ribonucleic acid
sec Seconds
SOC Super optimal broth with catabolite
SRB Sulforhodamine B
ssDNA Single-stranded DNA
sulfo-NHS N-hydroxysulfosuccinimide sodium salt
TRITC Tetramethylrhodamine
X-gal 5-bromo-4-chloro-3-indolyl- -D-galactoside
1
1. State of the art
Cancer is defined as a genetic disease where a group of cells multiplies uncontrollably,
diverging from the normal principles of cell division (American Cancer Society, 2016.; Bose & Wui
Wong, 2015). In this sense, cells grow out of control and consequently abnormally proliferate.
Untreated cancer leads to a continuous cell proliferation that can cause worsening of the
disease, resulting in the patient’s death. Almost 90% of the cancer-related deaths are caused by
the occurrence of tumor spreading, a phenomenon called metastasis (American Cancer Society,
2016; National Cancer Institute, 2016).
According to the estimates from the International Agency for Research on Cancer (IARC),
in 2012 there were 14.1 million new cancer cases and 8.2 million cancer deaths worldwide. By
2030, the global burden is expected to grow up to 21.7 million new cancer cases and 13 million
cancer deaths, simply due to the growth and aging of the population (Global Cancer Facts &
Figures, 2016).
For these reasons, cancer has become the leading cause of mortality in economically
developed countries, despite the significant investment and research (Siegel et al., 2013), and it
will continue to increase due to the embrace of risk lifestyles such as smoking, physical inactivity,
and ‘‘westernized’’ diets associated with genetic conditions (Parkin et al, 1999; World Health
Organization, 2008).
It is important to refer that the prevalence of cancer can be reduced through prevention
and early diagnosis (Chandran & Thomas, 2015).
1.1. Cell cycle in cancer
All mammalian cells share similar molecular networks that control cell proliferation,
division, differentiation and death (National Cancer Institute, 2016). The cell cycle is the series of
events that take place in a cell leading to its DNA duplication and division. Cell division is highly
regulated to guarantee the suitable transmission of genetic material under appropriate conditions
(Lubischer, 2007).
The cycle of cell division comprises four coordinated processes, namely cell growth, DNA
replication, distribution of the duplicated chromosomes to daughter cells and cell division. The
progression between these stages is controlled by a conserved regulatory apparatus, which
2
coordinates the different events of the cell cycle and links the cell cycle with extracellular signals
that control cell proliferation.
The cell cycle is divided into two basic parts: interphase and mitosis. The interphase is
characterized by an intense cell activity, involving cell growth and DNA replication (S phase) for
division to occur in mitosis phase (M).
Among these phases, the existence of regulatory gap phases (G) allow cells to grow and,
like checkpoints, provides the control of the cell cycle mechanisms, ensuring that the cell is ready
to continue the cycle and enters in the next phase. During the first gap phase (G1), that occurs
prior to the S phase, it is decided if the cell continues to divide or if the cell cycle is suspended, for
unfavorable reasons. During the second gap phase (G2), that occurs after the S phase, the cell
continues to grow, produces structures necessary for the division (centrioles) and is checked if it
is ready to initiate mitosis, such as for the occurrence of DNA damage (e.g. by radiation) (Cooper,
2000).
When a cell enters an abnormal cycle, proliferation of mutated cells can happen due to
some failure during checkpoints control which occurs faster than in healthy cells, leading to the
formation of a tumor.
These mutated cells are associated with DNA polymerase errors in the replication phase,
which leads to DNA damage. During a normal cell cycle, regulatory mechanisms arrest the mutated
cell in G2, giving time for the damage to be repaired, rather than being passed on to daughter
cells. Another regulatory mechanism consists in slowing down the progression of cells through S
phase and cell cycle progression stops at a checkpoint in G1, allowing the repair of the damage
before the entry of the cell in the S phase.
The arrest at the G1 checkpoint is mediated through the action of the protein p53, which
is instantly induced upon occurrence of damaged DNA (Cooper, 2000; Lowe et al., 2004). Many
stress signals encountered during tumor progression activate p53 resulting in apoptosis or growth
arrest (Lowe et al., 2004), as shown in Figure 1.
3
Figure 1: Action of functional p53 in the presence of stress signals encountered during tumor progression vs loss of p53 function by direct mutation of the gene. This loss has considerable impact on the ‘success’ of the carcinogenic processes, increasing the chances of a tumor cell survival. Taken from Evan et al. (Evan et al., 2001)
It is reported in the literature that the tumor suppressor gene, encoding the referred protein
is propitious to frequent mutations becoming and acting like an oncogene. Thereby, the loss of p53
function occurs, which prevents G1 arrest, so the damaged DNA instead of being repaired is
replicated and passed on to daughter cells. Since apoptosis or senescence of mutated cells is not
accomplished, consequent uncontrolled proliferation occurs leading to tumor formation (Bose &
Wui Wong, 2015; Cooper, 2000; Evan & Vousden, 2001; Hanahan & Weinberg, 2011).
1.2. Breast cancer
Breast cancer is the most frequently diagnosed cancer and the leading cause of cancer
death among females worldwide, with an estimated 1.7 million new cases and 521,900 deaths in
2012 (GLOBOCAN 2012, 2016; Torre et al., 2015).
The classification of different breast cancer types is based on the expression of estrogen
and progesterone receptors (ER/PR) and amplification of the human epidermal growth factor
receptor 2 (HER2). Expression profiles have categorized invasive breast carcinomas, based on the
presence (+) or absence (-) of the referred receptors allowing the classification of breast tumors
4
Figure 2: HER2, a member of the human epidermal growth factor receptor (EGFR), and the stimulation of MAPK and PI3K/AKT pathways. Common sites of mutation in cancer are indicated by an asterisk. Taken from Pusztaszeri et al. (Pusztaszeri et al., 2012)
into individual groups: luminal A (ER+ or PR+, HER2-), luminal B (ER+ or PR+, HER2+), HER2 (ER-
, PR-, HER2+) and basal or triple negative (ER-, PR-, HER2-) (Caudle et al., 2012; Livasy et al.,
2006; Mendes, Kluskens, & Rodrigues, 2015). This classification showed that there are significant
differences in survival based on the cancer subgroup. For instance, patients with basal and HER2
breast tumors have poor clinical prognosis due to high levels of proliferation, and patients with
ER/luminal tumors have longer overall survival (Onitilo et al., 2009; Sørlie et al., 2001).
Oncogenes code for proteins responsible for cellular transformation, affecting their
proliferation and differentiation (Cantley et al., 1991), and can be classified according to their gene
products, such as growth factors receptors. The gene ERBB2 encodes for the HER2 receptor, which
transmits growth stimulatory signals into the cell, and its deregulation can contribute to tumor
growth, providing a strategy for the development of self-sufficiency in growth factors (Hanahan &
Weinberg, 2011; Zhang et al., 2007). HER2 can heterodimerise with any of the other receptors of
its family, resulting in the autophosphorylation of tyrosine residues within the cytoplasmic domain
and initiates a variety of signaling pathways, like the mitogen-activated protein kinase (MAPK)
pathway (Figure 2) (Laurent-Puig et al., 2009; Olayioye, 2001).
MAPK pathways are evolutionarily conserved kinase modules that respond to extracellular
stimuli (mitogens) and regulate many cellular activities such as growth, proliferation, differentiation,
migration and apoptosis. In normal quiescent cells Ras, a guanosine-nucleotide-binding protein or
5
G protein, is bound to guanosine diphosphate (GDP) and is inactive, while upon extracellular
stimuli, like the presence of growth factors, Ras is activated by binding to guanosine triphosphate
(GTP), which has an extra phosphate group. In this moment Ras is able to bind to several effector
proteins kinase Raf, which is the most important effector of Ras. Active Raf phosphorylates the
mitogen-activated protein kinase kinases (MEK or MAPKK) 1/2, which in turn phosphorylates and
activates the extracellular-signal-regulated kinases (ERK) 1/2. The activated ERK 1 and 2
phosphorylate several nuclear and cytoplasmic effector genes involved in cell proliferation, survival,
differentiation, motility and angiogenesis. In the end, the Ras-GTP complex is inactivated by
GTPase-activating protein (GAP), that hydrolyses GTP in GDP, returning to its inactive form
(Bernado et al., 2013; Coulombe & Meloche, 2007; Hanahan & Weinberg, 2011; Torii et al, 2006).
Deregulation of the MAPK pathway on cancer, like permanent activation of Ras or HER2
over expression, is synonymous of proliferation and consequent abnormalities in MAPK signaling
(Dhillon et al., 2007; Downward, 2003). For this reason it should be mentioned that MAPK
overexpression is closely related to HER2 positive breast cancers (luminal B and HER2) where the
encoding gene of HER2 (or ERBB2) is highly expressed (Harold J Burstein, 2005; Sørlie et al.,
2001).
1.2.1. Conventional diagnosis and treatment
The principal methods for the identification and diagnosis of breast cancer are physical
examination, mammography and ultrasound (De Bresser et al., 2010; Jacobs et al, 2010). When
these methods fail to find a primary source in the breast, it is called occult cancer and in these
cases magnetic resonance imaging (MRI) is frequently applied (De Bresser et al., 2010; Mendes
et al., 2015; Molino & Wang, 2014; Toy et al., 2014). MRI is a highly sensitive method in the
detection of breast carcinoma, but has lower levels of specificity (Bartella & Dershaw, 2005). In
recent years alternative diagnosis techniques, like computerized tomography (CT), positron
emission tomography (PET), and other methods of scintigraphy have also been used to find the
primary source, but none of these diagnostic modalities are applied routinely and their use in occult
breast cancer is insufficient (Akashi-Tanaka et al., 1999; Brant & Helms, 2012; Kleinstreuer et al.,
2013).
According to the aforementioned, classification of breast cancers based on the presence
and absence of certain genes, ER/PR positive cancers are treated using hormone therapy (ER+
tumors are treated with an estrogen antagonist, such as tamoxifen), which additionally can be used
6
in combination with chemotherapy as adjuvant therapy (Malinowski, 2007). HER2 cancers (ER/PR
negative) are treated with an anti-HER2 directed monoclonal antibody and chemotherapy. For triple-
negative or basal cancers the primary therapeutics consists in chemotherapy, since they cannot
be treated with hormones, due to the absence of a known positive receptor (Burstein, 2011;
Carlson et al., 2009; Vanneman & Dranoff, 2012).
Traditional breast cancer treatments, as already referred, generally involve chemotherapy
sometimes in combination with radiation therapy. The purpose of chemotherapy and radiation is
to kill the tumor cells, once it is expected that these cells are more susceptible to the actions of
these drugs and methods, due to their pronounced growth compared to healthy cells, at least in
adults.
Some examples of chemotherapy agents are doxorubicin (DOX), which can intercalate with
DNA damaging the cell membrane by free radical formation and disrupt the topoisomerase-II-
mediated DNA complex by inhibition of topoisomerase II and MEK inhibitors, such as the PD98059
drug, which binds to MEK 1, inactivating the kinase and consequently blocking the overexpressed
MAPK pathway (Bose & Wui Wong, 2015; Thorn et al., 2011; Urruticoechea et al., 2010; Zhao &
Adjei, 2014).
The effectiveness of cancer treatment is deeply related to the treatment’s ability to target
and kill the cancer cells while affecting as few healthy cells as possible, increasing the patient’s
quality of life and life expectancy (Brannon-Peppas & Blanchette, 2012; Feng & Chien, 2003).
Thereby, drug delivery in cancer is important for optimizing the effect of drugs and to reduce toxic
side effects (Aguilar, 2013).
Chemotherapy is mainly based on systemic administration of highly cytotoxic drugs that
non-specifically target any dividing cells, resulting in indiscriminate drug distribution and severe
toxicity for patients, associated to a poor distribution and penetration of the drugs in solid tumors
(Bar et al., 2008; Brannon-Peppas & Blanchette, 2012; Chandran & Thomas, 2015).
To overcome this problem, alternative approaches that seek the use of targeted anti-
carcinogenic drugs-carrying platforms that specifically deliver the drug to the tumor site, as
demonstrated in Figure 3, have been intensively studied (Bar et al., 2008; Bertrand et al., 2014;
Chandran & Thomas, 2015; Luo & Prestwich, 2002).
7
1.2.2. Molecular cancer imaging - use of targeting ligands
Recently, the development of specific contrast agents with potential molecular imaging
applications has been one of the major aims of synthetic biology (Mendes et al., 2015; Toy et al.,
2014). Molecular imaging consists in detecting specific biological processes with molecular probes
that couple signaling or contrast agents with ligands that target specific biomarkers (Bose & Wui
Wong, 2015; Chandran & Thomas, 2015; Molino & Wang, 2014; Toy et al., 2014).
Biomarkers like mutated genes, proteins, RNAs, small metabolite molecules, are indicative
for certain types of cancer, and their altering expression level in tumor cells can be used as a target
for detection and diagnosis. Examples of ftraditional biomarkers that have been investigated for
their application on this technique of detection are ER, PR, HER2, p53 and Ki-67 (Kierny et al.,
2012; Malinowski, 2007).
In these applications, several biological molecules are used as targeting molecules, such
as antibodies, peptides, proteins, nucleic acids, or small molecule ligands, that are further
combined with contrast agents for effective detection and diagnosis (Aguilar, 2013; Bertrand et al.,
2014; Mendes et al., 2015; Srinivas et al., 2002).
Molecular imaging may contribute promisingly for the detection of early stage tumors (early
diagnosis), since molecular changes normally occur prior to morphological alterations (Chandran
& Thomas, 2015; Mendes et al., 2015).
Figure 3: Example of non-directional drug delivery vs directional-targeted drug delivery to a tumor in the human liver. Taken from Kleinstreuer et al. (Kleinstreuer et al., 2013)
8
1.3. Targeted drug delivery: new approaches
Targeting is crucial to promote the drug release (or injection) in a pre-determined site, but
also to optimize the effect of drugs and to reduce toxic side effects (Aguilar, 2013; Baran & Reis,
2008; Kleinstreuer et al., 2013).
Non-targeted drugs are administered in high dosages to achieve an effective blood
concentration, which is the main cause of patient’s morbidity. To improve the patient’s condition,
anticancer drugs need to be distributed at the specific tumor site with minimal loss of their volume
and keeping its biological activity through the blood circulation. Once on the tumor site, selective
destruction of tumor cells by a controlled release of the active form of the drug, without affecting
the healthy cells, is accomplished (Chandran & Thomas, 2015; Hussain, 2000; Poste, 1998).
Recent studies led to the development of functional nanoparticles/nanostructures to
overcome the damages associated to the conventional cancer treatment systems and opportunities
to improve patient survival (Baran & Reis, 2008; Chandran & Thomas, 2015; Mendes et al., 2015;
Srinivas et al., 2002).
Nanotechnology-based drug delivery systems or nanomedicines (NM) are being
increasingly developed as new approaches of cancer treatment to transport large therapeutic
payloads of the drug, preventing its premature degradation such as interaction with its biological
environment, enhancing drug adsorption to the desired tissues and controlling the drug tissue
distribution (Maiolino et al., 2015; Mendes et al., 2015; Peer et al., 2007). Examples include
dendrimers, liposomes, polymersomes, polymeric micelles, polymeric nanoparticles, carbon
nanotubes, nanoconjugates, virus-like particles and bacteriophages, which carry the drug to a
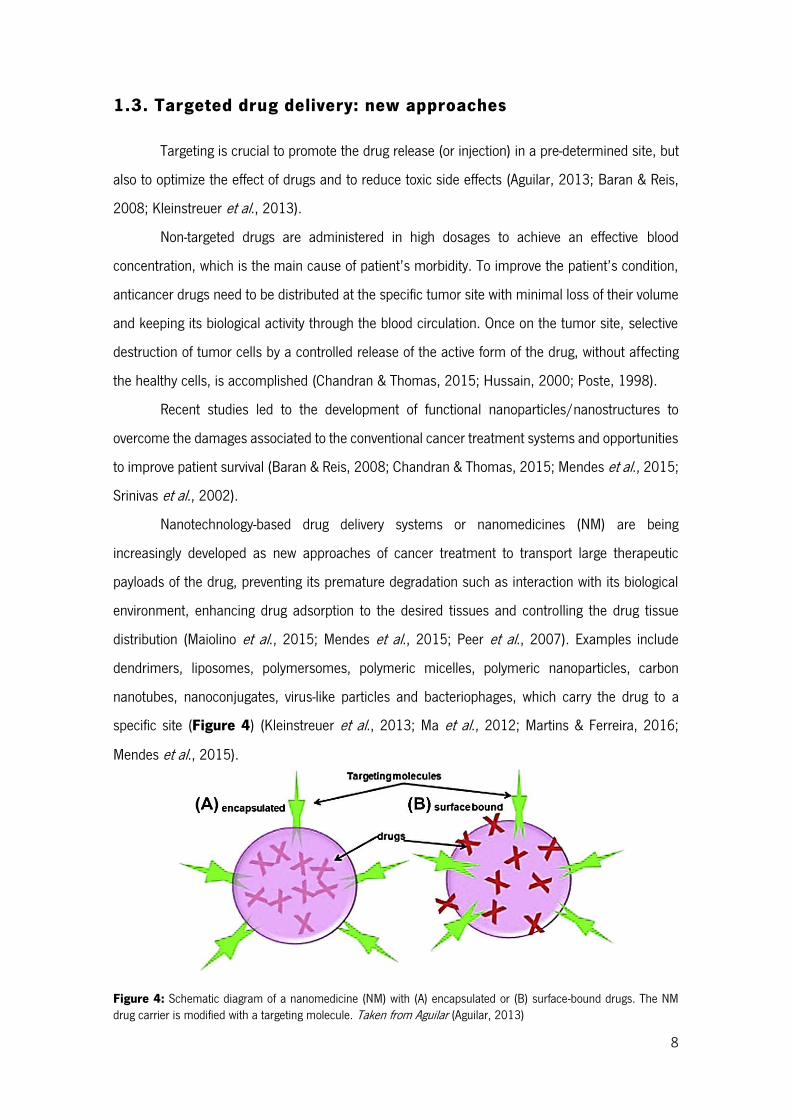
specific site (Figure 4) (Kleinstreuer et al., 2013; Ma et al., 2012; Martins & Ferreira, 2016;
Mendes et al., 2015).
Figure 4: Schematic diagram of a nanomedicine (NM) with (A) encapsulated or (B) surface-bound drugs. The NM drug carrier is modified with a targeting molecule. Taken from Aguilar (Aguilar, 2013)
9
Only a few exceptions, such as targeted liposomes and antibody-targeted polymeric
carriers, have on its surface a targeting ligand to acquire target specificity (active targeting), once
that tumor-selectivity of most nanomedicines is based on the enhanced permeability and retention
(EPR) effect characterized by an increased accumulation of macromolecules in the tumor (passive
targeting) (Bertrand et al., 2014; Mendes et al., 2015).
These nanoparticles are a clear need to improve cancer treatments, although, within the
human body present certain obstacles, including mucosal barriers and reticuloendothelial system
(Peer et al., 2007; Steichen et al., 2013).
1.3.1. Bacteriophages as nanocarriers for cancer therapy
Bacteriophages (or just phages) are viruses that only infect bacteria and, for this reason,
perform an important role in ecology by regulating the microbial populations of several ecosystems
(Hungaro et al., 2014; Mao, 2013; Moineau, 2013). The infection of the host can occur via the
lytic or lysogenic cycle. Lytic phages kill the bacterial host, whereas temperate phages can replicate
inside the host for several generations until, at a certain point, external conditions can induce the
phage to release its genome, causing bacterial lysis (Hyman & Abedon, 2009; Moineau, 2013;
Sulakvelidze, 2001).
These type of viruses are now recognized as the most diverse biological group on Earth
and found in large quantities in areas habited by their bacterial hosts (Hendrix, 1999; Moineau,
2013).
It was in 1915 and 1917 that Frederick Twort and Félix D’Hérelle, respectively, discovered
bacteriophages and, because of their high specificity and safety to humans (Sulakvelidze, 2001),
have highly contributed to the progression of many scientific areas and used in human therapy
(D’Herelle, 2007; Nobrega et al., 2015). The first therapeutic application of phages, developed by
Félix D’Hérelle, was to treat bacterial dysentery; followed by treatment of abscesses, wound
infections, vaginitis and upper respiratory tract infections (D’Herelle, 2007; Hungaro et al., 2014).
With the discovery and introduction of antibiotics, United States and Western Europe countries
abandoned phage therapy. However, the Soviet Union and other Eastern Europe countries
continued to investigate phages in order to discover and improve their applications in human
treatments (Kutateladze & Adamia, 2010; Sulakvelidze, 2001).
The undiscriminating and uncontrolled use of antibiotics led to the increase of bacterial
resistance becoming, in some cases, an unresponsive conventional treatment (Hungaro et al.,
10
2014; Shetty & Wilson, 2000). For that reason, allied to the difficulty of developing new antibiotics,
the use of bacteriophages in human therapy re-emerged (Kutateladze & Adamia, 2010; Lu &
Koeris, 2011; Vandersteegen et al., 2011). Furthermore, recent studies showed that the
development of methods that isolates, characterizes and engineer bacteriophages to create drug
delivery vehicles will play a major role in phage therapy, including cancer targeted therapy
(Bakhshinejad, 2014; Lu & Koeris, 2011).
Bacteriophages are heterogeneous in their biology and structure and can be classified
based on their morphology and genetic content (Hungaro et al., 2014; Molek & Bratkovič, 2015).
Filamentous phages, like M13KE, are characterized by circular ssDNA encapsulated by a tubular
coat (Marvin & Straus, 2014), while lytic phages like T7 an T4, have an icosahedral and quasi-
icosahedral capsid respectively, that contains dsDNA and they have a tail for microinjection of its
genetic material into the host (Black, 2015; Hyman & Abedon, 2009; Mosig & Eiserling, 2006;
Moulineux, 2006). A part of the genetic material of phages encodes for coat proteins and, for being
structurally and genetically simple viruses, especially the filamentous phages, they can be
genetically manipulated for peptide display (Molek & Bratkovič, 2015).
1.3.1.1. The M13 Phage
M13 is a typical filamentous phage, which have as host Gram-negative bacterium
Escherichia coli and is an attractive therapeutic platform because of its ability to display peptides,
and the strong fundamental understanding of its biology (Ghosh et al, 2012; Velappan et al., 2010).
This biological entity has about 1 µm in length and its genome is enclosed in a capsid coat
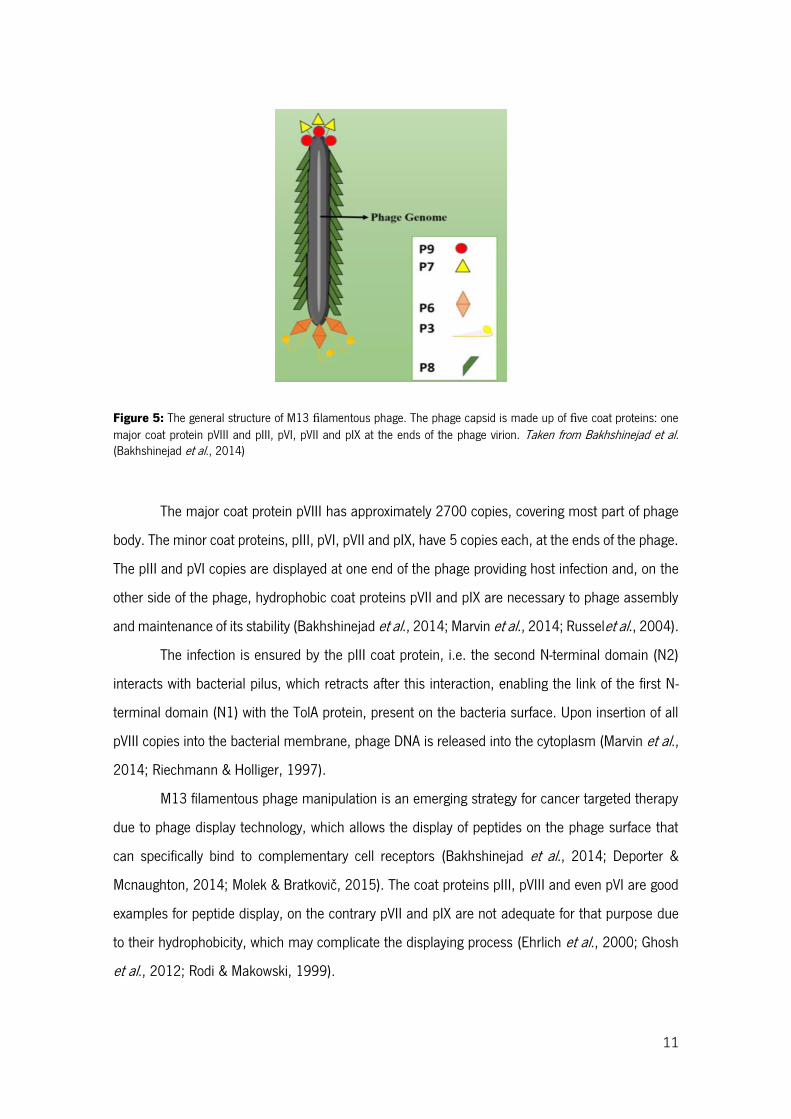
composed by 5 proteins – pIII, pVI, pVII, pVIII and pIX (Figure 5) (Bakhshinejad et al., 2014;
Molek & Bratkovič, 2015; Velappan et al., 2010).
11
Figure 5: The general structure of M13 filamentous phage. The phage capsid is made up of five coat proteins: one major coat protein pVIII and pIII, pVI, pVII and pIX at the ends of the phage virion. Taken from Bakhshinejad et al. (Bakhshinejad et al., 2014)
The major coat protein pVIII has approximately 2700 copies, covering most part of phage
body. The minor coat proteins, pIII, pVI, pVII and pIX, have 5 copies each, at the ends of the phage.
The pIII and pVI copies are displayed at one end of the phage providing host infection and, on the
other side of the phage, hydrophobic coat proteins pVII and pIX are necessary to phage assembly
and maintenance of its stability (Bakhshinejad et al., 2014; Marvin et al., 2014; Russelet al., 2004).
The infection is ensured by the pIII coat protein, i.e. the second N-terminal domain (N2)
interacts with bacterial pilus, which retracts after this interaction, enabling the link of the first N-
terminal domain (N1) with the TolA protein, present on the bacteria surface. Upon insertion of all
pVIII copies into the bacterial membrane, phage DNA is released into the cytoplasm (Marvin et al.,
2014; Riechmann & Holliger, 1997).
M13 filamentous phage manipulation is an emerging strategy for cancer targeted therapy
due to phage display technology, which allows the display of peptides on the phage surface that
can specifically bind to complementary cell receptors (Bakhshinejad et al., 2014; Deporter &
Mcnaughton, 2014; Molek & Bratkovič, 2015). The coat proteins pIII, pVIII and even pVI are good
examples for peptide display, on the contrary pVII and pIX are not adequate for that purpose due
to their hydrophobicity, which may complicate the displaying process (Ehrlich et al., 2000; Ghosh
et al., 2012; Rodi & Makowski, 1999).
12
The use of M13 vectors for cloning strategies is not recent. Messing and co-workers
described the incorporation of a segment of the E. coli lac operon into the bacteriophage M13 and
the complementation between the phage lacZ gene fragment and bacterial chromosomal lacZ,
which allows the production of functional -galactosidase in the infected cell (Messing et al., 1977).
For short peptide sequences display, the M13KE vector was created through the insertion of the
Acc 65I and Eag I restriction sites at the 5’ end of gene III into the M13mp19 vector (circular
molecule of 7250 base pairs with 54 base pairs polylinker region), without a deleterious effect on
phage infectivity (NEB, 2016; Greenstein & Brent, 1990).
M13KO7 helper phage is an M13 derivative. The mutation Met40Ile in gene II, with the
origin of replication from plasmid P15A and the kanamycin resistance gene from the transposon
Tn903 allows it to replicate like a plasmid inside the cell (Vieira & Messing, 1987). In the presence
of a phagemid containing a wild-type M13 or f1 origin, it is preferentially packaged into M13KO7
viral particles and then secreted into the culture medium allowing the production of single-stranded
phagemid DNA (Sambrook & Russell, 2001).
1.3.1.2. Genetic manipulation and chemical conjugation of M13
phage
In the past years, studies about genetic and chemical modification of filamentous phages
have been described to create antitumor drug platforms. In 2008, Bar et al. (Bar et al., 2008)
modified a filamentous phage through manipulation of its capsid proteins, by genetically display of
a specific target ligand in pIII and chemically conjugate a cytotoxic drug to pVIII protein. More
recently, in 2012, Ghosh et al. (Ghosh et al., 2012) have developed a genetically manipulated M13
phage conjugated with a payload of DOX at the pVIII protein. In the same study they also reported
that the M13 genome is difficult to engineer due to overlaps of key genetic elements that directly
link the coding sequence of one gene to the coding or regulatory sequence of another, complicating
the alteration of one gene without disrupting the other, which may compromise phage function. So
refactoring, a controlled technique that improves the design of an existing code base, can be made
to increase the utility of M13 bacteriophage for phage display, turning it a multiplex carrier (Ghosh
et al., 2012; Hertveldt et al., 2009; Springman et al, 2012).
13
Genetic modification: Cell Penetrating Peptides (CPPs) and recognition
peptides
Phage therapy has a great potential to treat a wide range of diseases which occur due to
defective gene expression levels, such as cancer. This requires a non-toxic, controllable and
efficient delivery vector. A potential type of delivery molecules are CPPs as they mediate the contact
between the phage and the cells (Kullberg et al., 2013; Suhorutsenko et al., 2011). CPPs are short
peptides (up to 30 amino acids) which have been used since 1994 as a way to solve the difficulty
of therapeutic drugs penetration through the mammalian cell membranes, derived from its
hydrophilicity (Zorko & Langel, 2005).
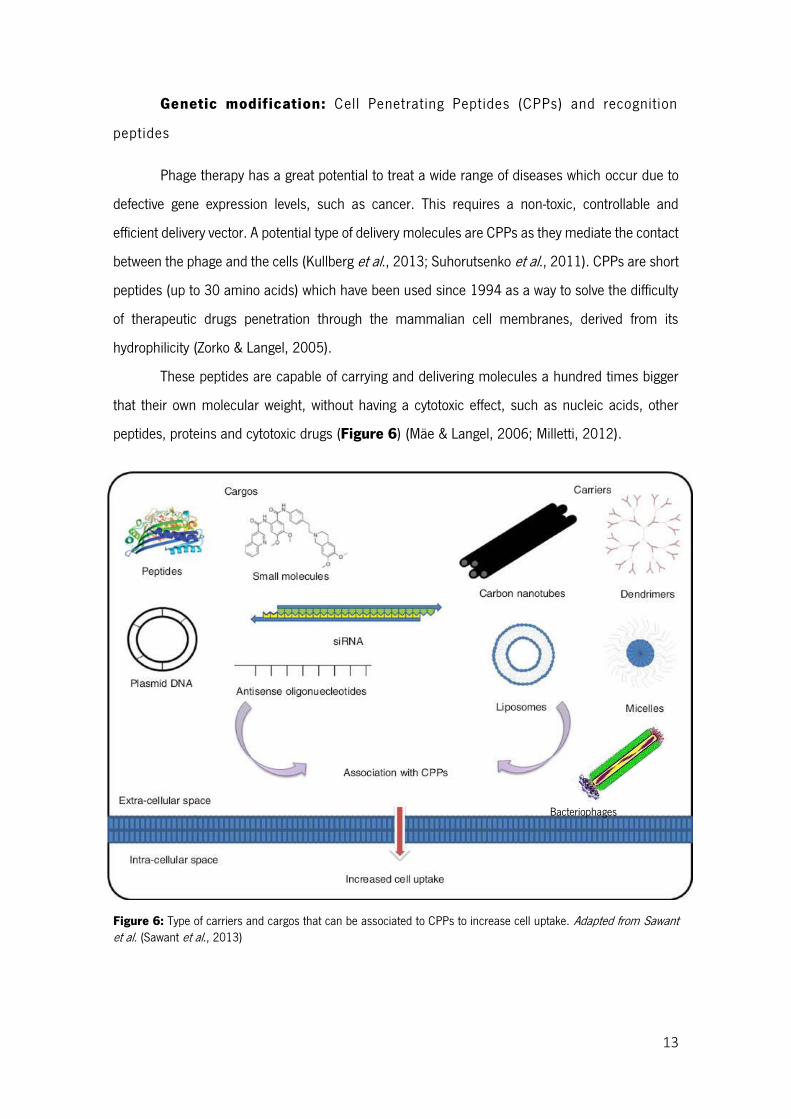
These peptides are capable of carrying and delivering molecules a hundred times bigger
that their own molecular weight, without having a cytotoxic effect, such as nucleic acids, other
peptides, proteins and cytotoxic drugs (Figure 6) (Mäe & Langel, 2006; Milletti, 2012).
Figure 6: Type of carriers and cargos that can be associated to CPPs to increase cell uptake. Adapted from Sawant et al. (Sawant et al., 2013)
Bacteriophages
14
In 2009, a study based on the association of DOX with CPPs to penetrate breast cancer
cells, showed that a DOX-CPP complex induced cell apoptosis at lower doses than that needed for
unconjugated DOX (Aroui et al., 2009).
CPPs cellular uptake is highly related to its structure, type of the attached cargo and to the
heterogeneity of the cellular membranes, and their internalization is accomplished by endocytosis
followed by direct translocation across the membrane (Bolhassani, 2011; Copolovici et al., 2014).
Cell penetration peptides classification in cationic, amphipathic or hydrophobic peptides is
based on their physical and chemical properties. Cationic CPPs have highly positive charged
peptides, whereas amphipathic and hydrophobic CPPs have equally cationic and anionic peptides
(Bolhassani, 2011; Milletti, 2012; Veiman et al., 2015).
For cationic CPPs uptake, the positively charged arginine (R) is responsible for cell/CPP
interactions, by binding to the negative phosphates and sulfates of the cell membrane and, for that
reason, higher cellular CPPs uptake is observed when they have in their structure more than six
arginine residues. Cationic CPPs internalization is related to its concentration, i.e. above a specific
peptide concentration direct translocation occurs, and for levels under the same specific peptide
concentration it occurs endocytosis (Chugh et al., 2010; Sawant et al., 2013). HIV-Tat
(YGRKKRRQRRR) and Penetratin (RGIKWFGNRRMKWKK) are examples of cationic CPPs and they
are commonly used (Kim et al., 2012). Their high content in arginine and lysine residues promotes
their uptake over the mammalian cells by binding with negatively charged glycosaminoglycans
present in the extracellular matrix (Fuchs & Raines, 2007).
Nevertheless, the specificity of the peptides can be improved. Dong et al. (Dong et. al,
2008) identified a novel peptide through phage display (231 peptide – CASPSGALRSC), which
specifically targets and internalizes in vitro human breast cancer cells - MDA-MB-231 cell line.
In this sense, phages, such as M13, can be modified to display peptides like CPPs and
231 peptides at their surface, through manipulation of gene sequences encoding for coat protein
pIII (high peptide display efficiency) and pVIII (Rakonjac et al., 1997). This genetic manipulation
turns these nanoparticles more specific to human cells, offers the ability of internalization and
improves the bioavailability and system durability of CPPs (Yata et al., 2014). Furthermore, a
selective payload drug can be added to the phage major coat protein pVIII by chemical conjugation,
making this type of carrier a new and revolutionary targeted therapy platform (Ghosh et al., 2012).
15
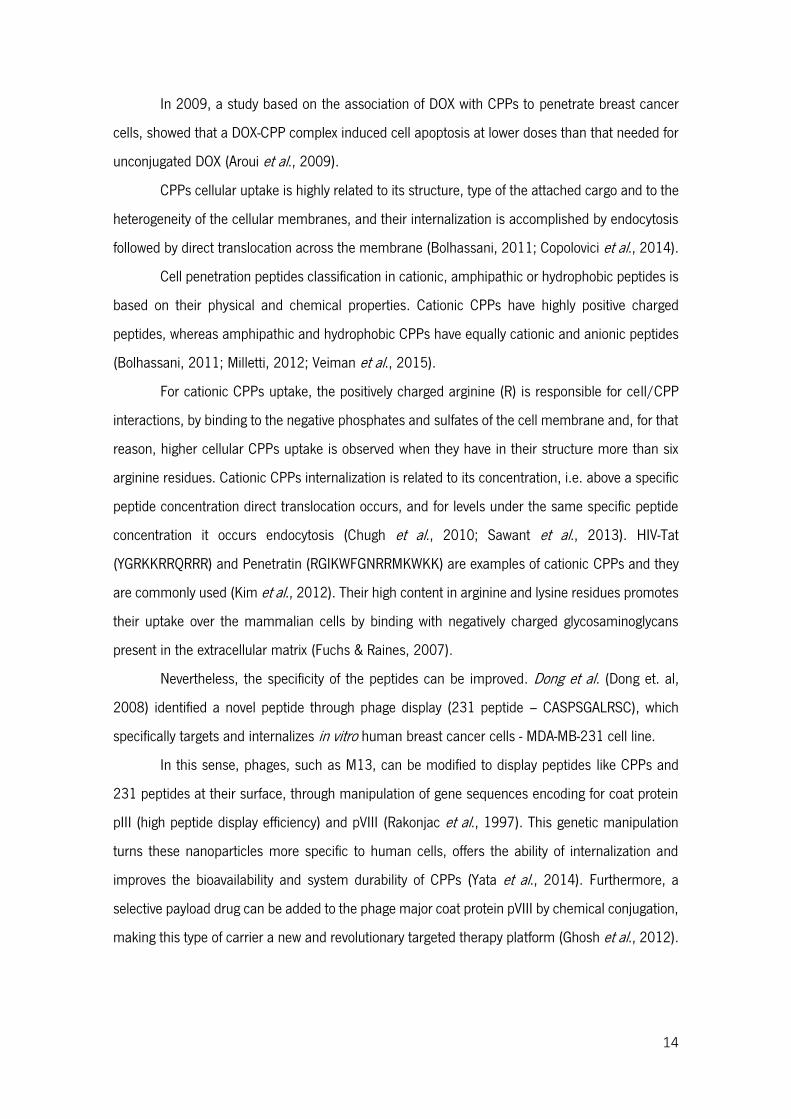
Figure 7: Schematic structure of a M13 bacteriophage (A) and its major coat proteins (B). Taken from Chung et al. (Chung et al., 2014)
Chemical modification: DOX conjugation
Chemical conjugation of M13 phages, based on chemoselective reactions, has been
studied to provide a controlled and efficient drug payload and reduce its toxicity. This modification
process is accomplished by binding the coat proteins amino group with the drug carboxylic group
(Chung et al., 2014). Recently, specific sites within coat proteins used as target residues for
chemical conjunction, have been identified, as cysteine, N-terminal alanine, lysine, N-terminal
serine/threonine, aspartic acid/glutamic acid, and tyrosine (Figure 7) (Chung et al., 2014; Li et
al., 2010).
Functionalization of M13 can be made to increase the target sites for drugs conjugation,
improving chemoselective reactions (Deutscher & Kelly, 2011). During chemical functionalization,
functional groups are added to the desired active sites and then coupled with multiple copies of
proteins that have abundant potential reactive groups. In this process, both wild type and
genetically engineered phages, displaying specific amino acids, are used for chemical
functionalization. The N-terminal domains of pIII and pVIII, exposed to the media, are targets for
chemical functionalization (Kwaśnikowski et al., 2005), because they are more tolerant to genetic
mutations to insert specific amino acids (Rakonjac et al., 2011) leading to a better chemoselective
modification (Bernard & Francis, 2014; Chung et al., 2014; Ma et al., 2012).
The minor coat protein pIII is the critical component for the infection process. For this
reason, its genetic manipulation and chemical modification may reduce phage infectivity, leading
to an inefficient display (Molek & Bratkovič, 2015).
16
In applications where a large loading capacity is desired, such as drug delivery or imaging,
the major coat protein pVIII due to its high copy number became the major target of chemical
conjugation, but it is important to mention that pVIII monomers can only tolerate the incorporation
of 6–8 amino acids (Hess et al., 2012; Popp et al., 2007).
In a non-genetic modified M13 phage, amino groups of N-terminal alanine and lysine and
carboxylic acid groups of glutamic acid and aspartic acid of pVIII coat protein are favorable targets
for selective chemical functionalization, such as amide bond formation (Figure 7B). In order to
apply a wide range of chemoselective modifications in phage, cysteine and other amino acids such
as N-terminal serine/threonine or tyrosine, which do not appear in the solvent-exposed domain of
the wild type coat proteins, have also been inserted using genetic engineering (Bernard & Francis,
2014; Carrico et al., 2008; Chung et al., 2014; Deporter & Mcnaughton, 2014).
A good example of phage functionalization is reported by Li et al. (Li et al., 2010). The
authors created a M13 particle for drug delivery through its functionalization using N-
hydroxysuccinimide (NHS) ester chemistry to attach folic acid in order to bind cancer cells. This
study showed that each pVIII subunit contained only one modification and that these assemblies
were capable of loading DOX.
1.3.1.3. Problems associated to the use of bacteriophages in cancer
treatment
Toxicity, pharmacokinetics and immunogenicity are relevant issues when nanoparticules
are considered for in vivo application (Yacoby & Benhar, 2007; Singh, 2010). One of the biggest
problems in the development of phage-based therapies is their high immunogenicity, probably
caused by the multiple copies of pVIII protein on the phage surface (van Houten et al., 2006). Due
to this particular property, their application as boosters for vaccination purposes has gained
interest, being considered an effective immunogenic carrier for synthetic peptides (van Houten et
al., 2010; Sartorius et al., 2008). However, the high immunogenicity limits the toxic effect of the
drug-carrying bacteriophages once inside the human body (Vaks & Benhar, 2011).
Amino-related coating, such as PEGylation and conjugation of imunogenic proteins with
aminoglycosides, such as neomycin, provides an “envelope” for the phage particle reducing the
immune response against it (Milla et al., 2012; Burkin & Gal’vidis, 2011; Vaks & Benhar, 2011).
With the decrease of immunogenicity of drug-carrying phages sequential treatments, without severe
side effects, could be applied in cancer therapy (Milla et al., 2012).
17
1.4. Objectives
The overall objective of this work was to develop a multifunctional phage-based
nanoparticle for drug delivery. For this purpose, the M13 phage was genetically modified to display
at its surface an internalization element, such as HIV-Tat cell penetrating peptide, to promote the
internalization of the nanoparticle by 4T1 breast cancer cells. Additionally, the M13 phage was
chemically conjugated with a cytotoxic drug (DOX) aiming at a reduction of the drug concentration
to be released in situ.
18
2. Materials and Methods
2.1. M13KE Phage Manipulation
In order to develop the aforementioned nanoparticle for drug delivery, the M13KE phage
was genetically and chemically modified.
2.1.1. HIV-Tat peptide cloning on M13 phage genome
Three approaches were used for the genetic manipulation of the M13KE phage to display
on its surface the HIV-Tat peptide. The following protocols describe the sequence of procedures
conducted to obtain M13KE phages displaying the HIV-Tat peptide.
2.1.2. M13KE phage production and tittering
In a 50 ml falcon tube, an inoculum of 4.5 ml of Luria Bertani Broth (LB) medium (25 g/L,
NzyTech, Lda., MB14501) with 500 µl of an overnight E. coli JM109 strain culture at exponential
phase, 25 µl of 1 M MgCl2 (VWR, AA12315-A1) and 100 µl of M13KE phage (New England
Biolabs® Inc, N0316S), was allowed to grow for 5 h at 37 °C and 200 rpm. The culture was
centrifuged; the supernatant was filtered with a 0.2 µm polyethersulfone (PES) filter (Fiorini,
6002S) and then stored at 4 °C.
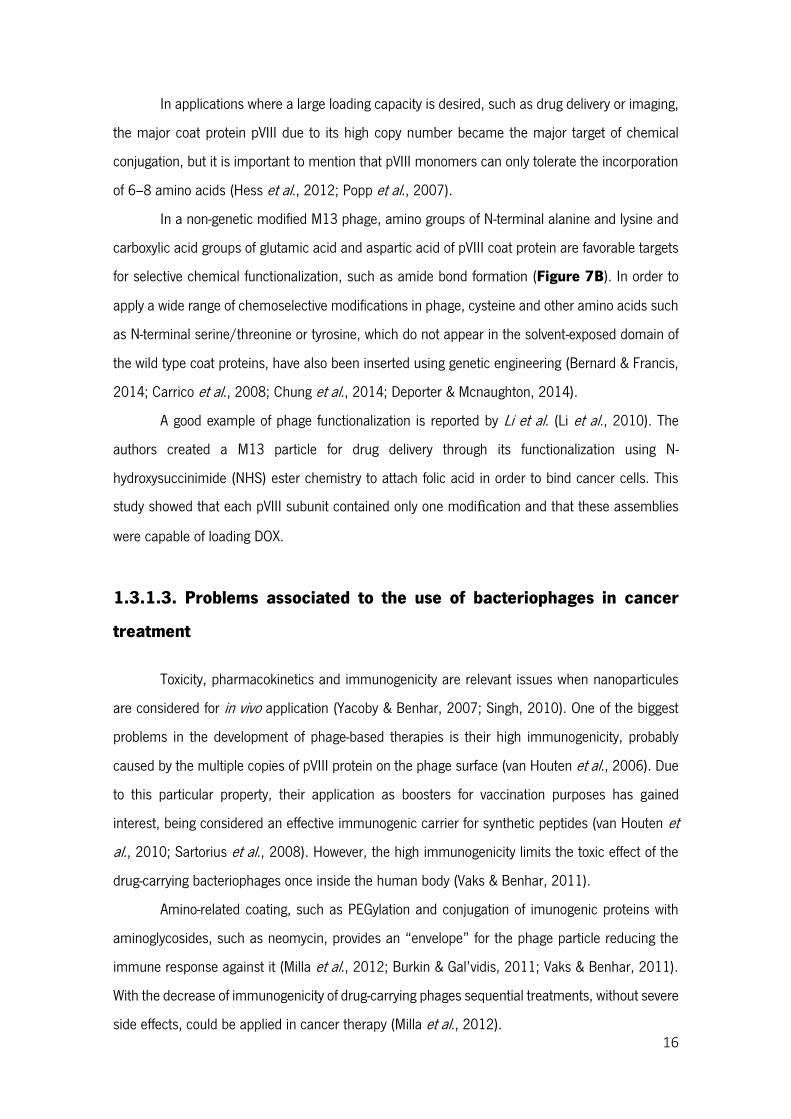
To quantify the M13KE phage produced, by phage forming units (PFUs) assay was
performed. In a sterile 96 well-plate (Frilabo), consecutive 10-fold phage dilutions in 90 µl of sodium
magnesium (SM) buffer [100 mM sodium chloride (Panreac, 131659), 8 mM magnesium sulfate
heptahydrated (Panreac, 1058860500) and 50 mM Tris-HCl (Sigma, 10812846001), pH 7.5)]
were done. A 10 µl drop of each dilution was plated in LB/ isopropyl -D-1-thiogalactopyranoside
(IPTG)/ 5-bromo-4-chloro-3-indolyl- -D-galactoside (X-gal) agar plates [25 g/L LB, 20 g/L agar
(Frilabo, 611001), 0.05 g/L X-gal and 0.25 mM IPTG (both Nzytech, Lda., MB02501, MB026)]
with an E. coli JM109 lawn [a mixture of about 5 ml of Top-agar (25 g/L LB and 7 g/L agar)] and
then allowed to dry. The plates were incubated overnight at 37 °C (Figure 8).
19
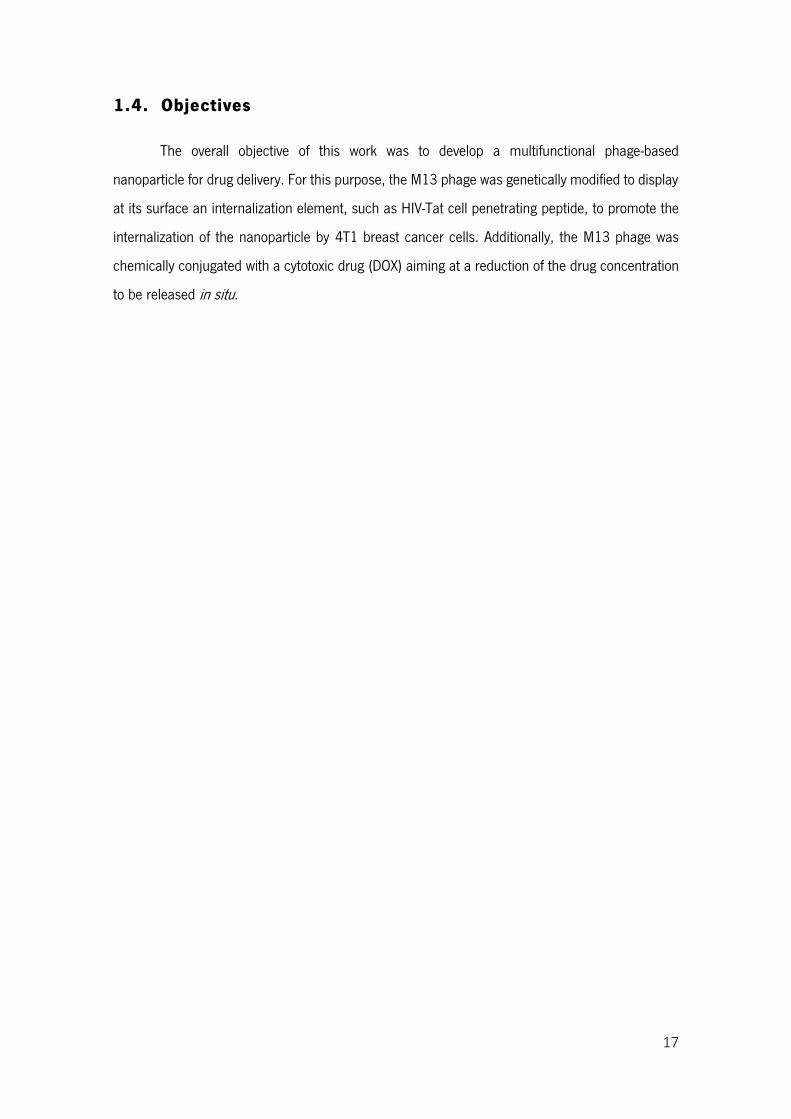
Figure 9: Schematic representation of the blue plaques in a plate of LB/IPTG/X-gal with an E. coli JM109 lawn after incubation.
Figure 8: Schematic representation of the M13KE quantification methodology. Consecutive 10-fold dilutions (10-1 to 10-12) in SM-buffer were made in a 96-well plate, in a total volume of 100 µl per well. A 10 µl drop of each dilution was plated in a LB/IPTG/X-gal plate with an E. coli JM109 lawn and incubated at 37 °C, overnight.
After the incubation period the plates were analyzed. The ones that presented between 3
and 30 blue plaques were used to quantify the M13KE phage concentration (Figure 9), according
to the following equation:
[M13KE] (PFUs/ml) = (nr M13KE plaques × reciprocal of counted dilution)/0.01
20
2.1.3. M13KE phage DNA extraction
After infection of E. coli JM109 strain with M13KE wild type (WT) phage, the phage DNA
was extracted using the NucleoSpin Plasmid/Plasmid (NoLid) kit (Macherey-Nagel GmbH & Co.
KG, 740499.50) according to the supplier (protocol 5.1 -Isolation of high-copy plasmid DNA from
E. coli) (Macherey-Nagel, 2015). The DNA obtained was quantified using the NanoDrop1000
(ThermoFisher Scientific Inc.).
2.1.4. Synthesis of HIV-Tat sequences for later cloning in M13KE vector
In the present work, the M13KE phage DNA was genetically manipulated to receive the
peptide of interest, the cell penetrating peptide HIV-Tat (YGRKKRRQRRR). As previously mentioned,
three approaches were used to accomplish the purposed goal. These approaches are described in
the following sections.
2.1.4.1. First approach
The synthesis of the sequence encoding the HIV-Tat peptide was based on the work of
Rangel et al. (Rangel et al., 2013) and consisted in the annealing of two primers 100% homologous
(Table 1) in a thermocycler (BioRad, MJ Mini™).
Table 1: Primers forward (Fw) and reverse (Rv) used for the synthesis of the nucleotide sequence encoding HIV-Tat peptide. The HIV-Tat sequence is underlined.
20 µl of each primer (10 µM) and 10 µl of 10 mM Tris HCl (Sigma, Portugal) were added
in a PCR tube. The annealing protocol was based in the gradual heating and cooling process (Table
2).
HIV-Tat
nucleotide
sequence
Primer
Forward
5’ - TATATAGGTACCTATGGGCGAAAGAAACGGCGTCAG
CGTAGACGTCGGCCGTATATA - 3’
Primer Reverse 5’ - TATATACGGCCGACGTCTACGCTGACGCCGTTTCTT
TCGCCCATAGGTACCTATATA - 3’
21
Table 2: Reaction parameters for the insert synthesis by annealing. The annealing was accomplished by gradual heating up to 93 °C and then cooling to 4 °C.
Then, the sequence was confirmed in a 3% agarose gel using 1X TAE [40 mM Tris (Fisher
Scientific, 17926), 20 mM acetic acid (Sigma, 537020) and 1 mM ethylenediaminetetraacetic acid
(EDTA, Fluka Analytical, Sigma, E9884)] and SyBr safe green (Fisher Scientific, S33102) for bands
visualization.
2.1.4.2. Second approach
In this approach, the synthesis of the sequence encoding the HIV-Tat peptide was based
on the New England Biolabs (NEB) protocol for Phage Display Libraries Synthesis (NEB, 2016;
Noren & Noren, 2001) consisting in the annealing of two different primers, the extension primer
and the library primer (Table 3) and then, in the extension of the library primer (Figure 10) in a
thermocycler.
Table 3: Extension and library primers used for the synthesis of the nucleotide sequence encoding the HIV-Tat peptide. The HIV-Tat sequence is underlined.
Step 1 2 3 4 5 6 7
Temperature (°C) 93 80 75 70 65 40 4
Time (min) 3 20 20 20 20 60 Hold
HIV-Tat
nucleotide
sequence
Extension
Primer 5’ - CATGCCCGGGTACCTTTCTATTCTC – 3’
Library
Primer
5´- CATGTTTCGGCCGAACGTCTACGCTGACGCCGT
TTCTTTCGCCCATAAGAGTGAGAATAGAAAGGTACC CGGG - 3´
22
Figure 10: Construction of a peptide library in M13KE through annealing and extension reactions. First the extension primer anneals to the library primer and then, the Klenow DNA polymerase extends the library primer by dNTP´s addition. The (NNN)n in library primer represents the nucleotide sequence of the peptide of interest. Adapted from Phage Display Libraries Manual, NewEngland Biolabs (NEB, 2016)
Primers annealing was achieved by mixing 4 µl of 100 µM of the extension primer and 2.6
µl of 100 µM of the library primer in a total volume of 50 µl in TE (10 mM Tris-HCl and 1 mM
EDTA) containing 100 mM NaCl and then, heating to 95 °C and cool slowly (15–30 min) to less
than 37 °C. The extension reaction was accomplished by mixing the 50 µl of the annealing reaction
with 20 µl of 10X NEBuffer 2 (NewEngland BioLabs® Inc, B7002S), 8 µl of 10 mM dNTP’s
(NewEngland BioLabs® Inc., N1204A) and 3 µl of Klenow DNA polymerase (NewEngland
BioLabs® Inc., M0212S) in a total volume of 200 µl. The reaction was incubated at 37 °C for 10
min and 65 °C for 15 min. In the end, 4 µl was used for size confirmation in a 3% agarose gel.
2.1.4.3. Third approach – Round PCR
The round PCR, also known as ‘Round-the-horn site-directed mutagenesis”, is a PCR-based
mutagenesis. The mutations are contained in one or both primers, and one of the primers is
phosphorylated so that the PCR product can be re-circularized.
In this approach, based on Sean Moore work ("Round-the-horn site-directed mutagenesis",
2016), the DNA template was the M13KE vector in its circular form and the primers forward and
reverse (Table 4) amplified the whole vector, from gene III.
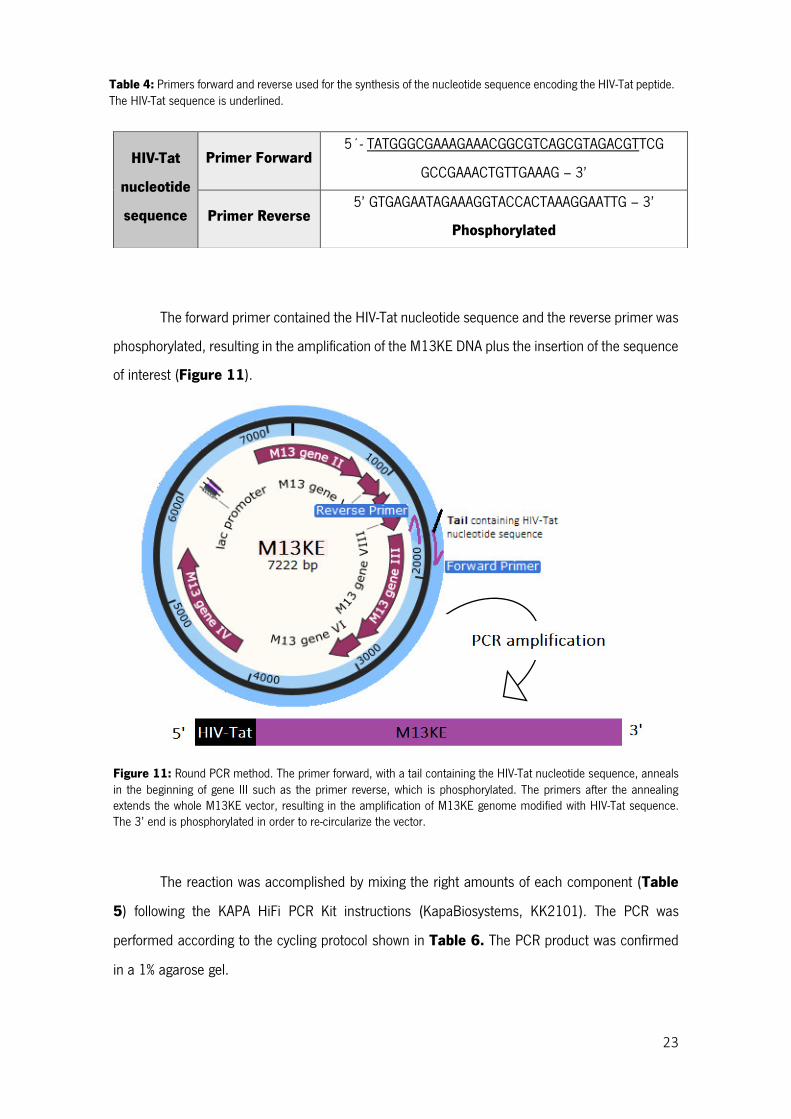
23
The forward primer contained the HIV-Tat nucleotide sequence and the reverse primer was
phosphorylated, resulting in the amplification of the M13KE DNA plus the insertion of the sequence
of interest (Figure 11).
Figure 11: Round PCR method. The primer forward, with a tail containing the HIV-Tat nucleotide sequence, anneals in the beginning of gene III such as the primer reverse, which is phosphorylated. The primers after the annealing extends the whole M13KE vector, resulting in the amplification of M13KE genome modified with HIV-Tat sequence. The 3’ end is phosphorylated in order to re-circularize the vector.
The reaction was accomplished by mixing the right amounts of each component (Table
5) following the KAPA HiFi PCR Kit instructions (KapaBiosystems, KK2101). The PCR was
performed according to the cycling protocol shown in Table 6. The PCR product was confirmed
in a 1% agarose gel.
HIV-Tat
nucleotide
sequence
Primer Forward 5´- TATGGGCGAAAGAAACGGCGTCAGCGTAGACGTTCG
GCCGAAACTGTTGAAAG – 3’
Primer Reverse 5’ GTGAGAATAGAAAGGTACCACTAAAGGAATTG – 3’
Phosphorylated
Table 4: Primers forward and reverse used for the synthesis of the nucleotide sequence encoding the HIV-Tat peptide. The HIV-Tat sequence is underlined.
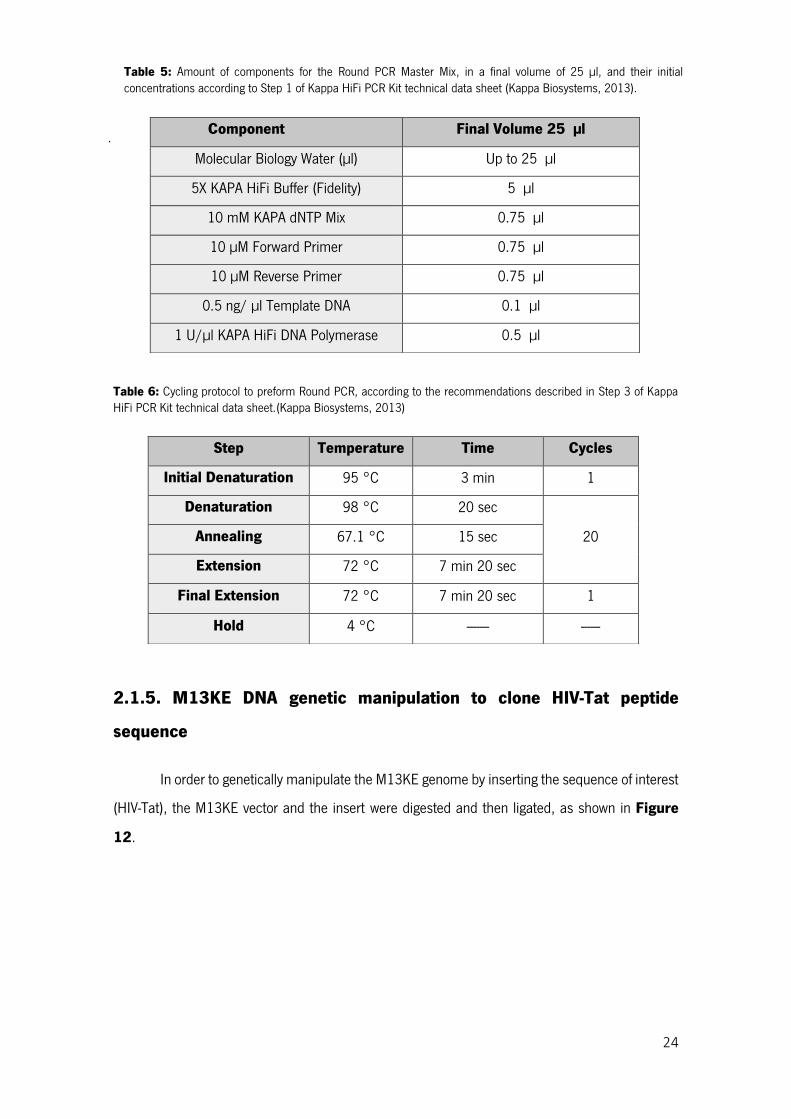
24
Table 6: Cycling protocol to preform Round PCR, according to the recommendations described in Step 3 of Kappa HiFi PCR Kit technical data sheet.(Kappa Biosystems, 2013)
2.1.5. M13KE DNA genetic manipulation to clone HIV-Tat peptide
sequence
In order to genetically manipulate the M13KE genome by inserting the sequence of interest
(HIV-Tat), the M13KE vector and the insert were digested and then ligated, as shown in Figure
12.
Table 5: Amount of components for the Round PCR Master Mix, in a final volume of 25 µl, and their initial concentrations according to Step 1 of Kappa HiFi PCR Kit technical data sheet (Kappa Biosystems, 2013).
Component Final Volume 25 µl
Molecular Biology Water (µl) Up to 25 µl
5X KAPA HiFi Buffer (Fidelity) 5 µl
10 mM KAPA dNTP Mix 0.75 µl
10 µM Forward Primer 0.75 µl
10 µM Reverse Primer 0.75 µl
0.5 ng/ µl Template DNA 0.1 µl
1 U/µl KAPA HiFi DNA Polymerase 0.5 µl
.
Step Temperature Time Cycles
Initial Denaturation 95 °C 3 min 1
Denaturation 98 °C 20 sec
20 Annealing 67.1 °C 15 sec
Extension 72 °C 7 min 20 sec
Final Extension 72 °C 7 min 20 sec 1
Hold 4 °C ------- ------
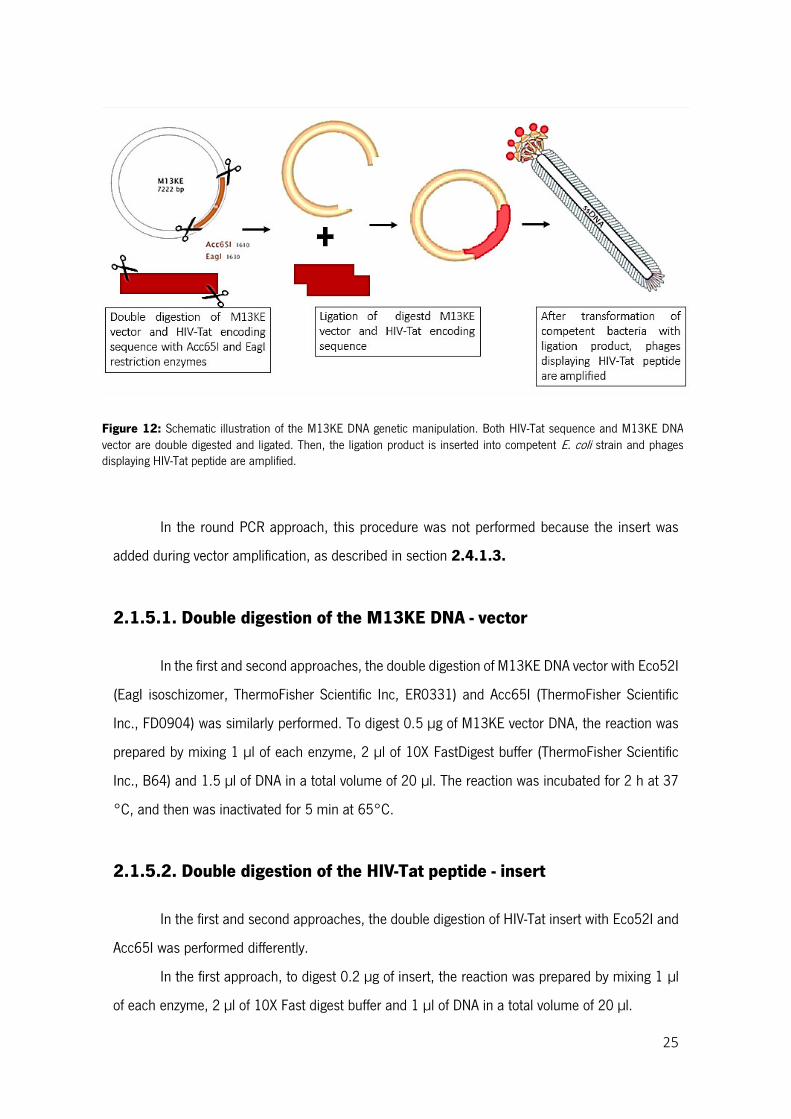
25
Figure 12: Schematic illustration of the M13KE DNA genetic manipulation. Both HIV-Tat sequence and M13KE DNA vector are double digested and ligated. Then, the ligation product is inserted into competent E. coli strain and phages displaying HIV-Tat peptide are amplified.
In the round PCR approach, this procedure was not performed because the insert was
added during vector amplification, as described in section 2.4.1.3.
2.1.5.1. Double digestion of the M13KE DNA - vector
In the first and second approaches, the double digestion of M13KE DNA vector with Eco52I
(EagI isoschizomer, ThermoFisher Scientific Inc, ER0331) and Acc65I (ThermoFisher Scientific
Inc., FD0904) was similarly performed. To digest 0.5 µg of M13KE vector DNA, the reaction was
prepared by mixing 1 µl of each enzyme, 2 µl of 10X FastDigest buffer (ThermoFisher Scientific
Inc., B64) and 1.5 µl of DNA in a total volume of 20 µl. The reaction was incubated for 2 h at 37
°C, and then was inactivated for 5 min at 65°C.
2.1.5.2. Double digestion of the HIV-Tat peptide - insert
In the first and second approaches, the double digestion of HIV-Tat insert with Eco52I and
Acc65I was performed differently.
In the first approach, to digest 0.2 µg of insert, the reaction was prepared by mixing 1 µl
of each enzyme, 2 µl of 10X Fast digest buffer and 1 µl of DNA in a total volume of 20 µl.
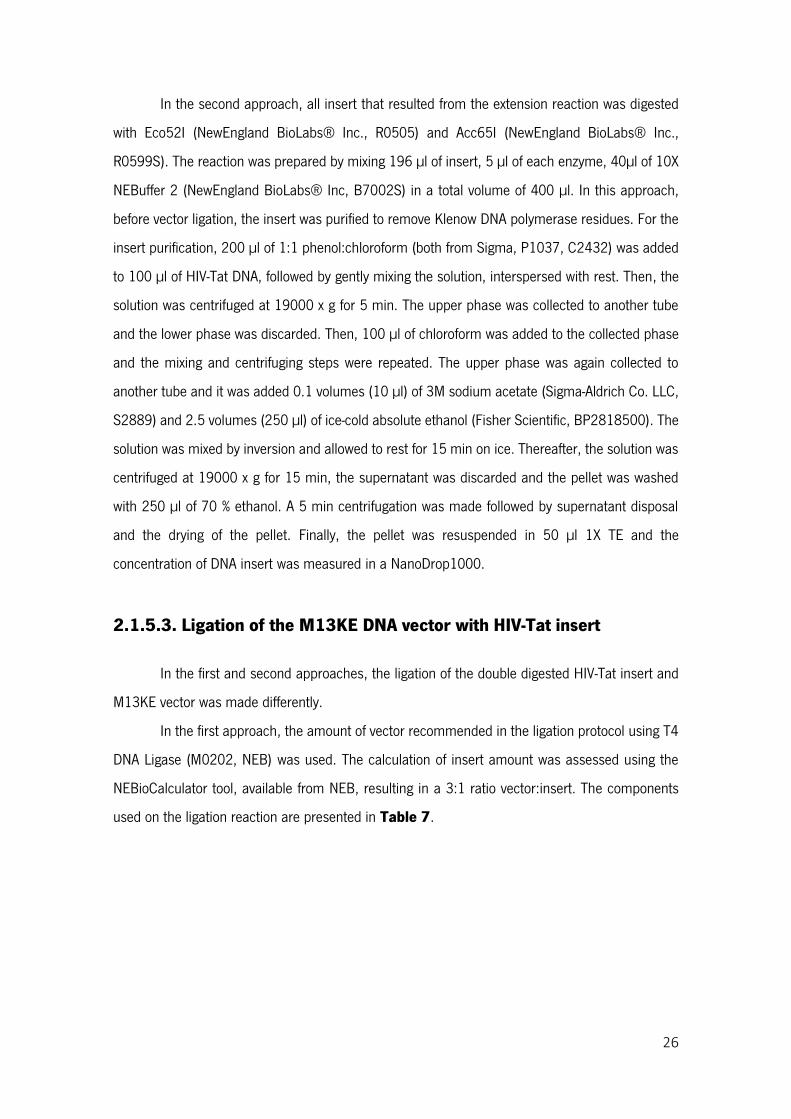
26
In the second approach, all insert that resulted from the extension reaction was digested
with Eco52I (NewEngland BioLabs® Inc., R0505) and Acc65I (NewEngland BioLabs® Inc.,
R0599S). The reaction was prepared by mixing 196 µl of insert, 5 µl of each enzyme, 40µl of 10X
NEBuffer 2 (NewEngland BioLabs® Inc, B7002S) in a total volume of 400 µl. In this approach,
before vector ligation, the insert was purified to remove Klenow DNA polymerase residues. For the
insert purification, 200 µl of 1:1 phenol:chloroform (both from Sigma, P1037, C2432) was added
to 100 µl of HIV-Tat DNA, followed by gently mixing the solution, interspersed with rest. Then, the
solution was centrifuged at 19000 x g for 5 min. The upper phase was collected to another tube
and the lower phase was discarded. Then, 100 µl of chloroform was added to the collected phase
and the mixing and centrifuging steps were repeated. The upper phase was again collected to
another tube and it was added 0.1 volumes (10 µl) of 3M sodium acetate (Sigma-Aldrich Co. LLC,
S2889) and 2.5 volumes (250 µl) of ice-cold absolute ethanol (Fisher Scientific, BP2818500). The
solution was mixed by inversion and allowed to rest for 15 min on ice. Thereafter, the solution was
centrifuged at 19000 x g for 15 min, the supernatant was discarded and the pellet was washed
with 250 µl of 70 % ethanol. A 5 min centrifugation was made followed by supernatant disposal
and the drying of the pellet. Finally, the pellet was resuspended in 50 µl 1X TE and the
concentration of DNA insert was measured in a NanoDrop1000.
2.1.5.3. Ligation of the M13KE DNA vector with HIV-Tat insert
In the first and second approaches, the ligation of the double digested HIV-Tat insert and
M13KE vector was made differently.
In the first approach, the amount of vector recommended in the ligation protocol using T4
DNA Ligase (M0202, NEB) was used. The calculation of insert amount was assessed using the
NEBioCalculator tool, available from NEB, resulting in a 3:1 ratio vector:insert. The components
used on the ligation reaction are presented in Table 7.
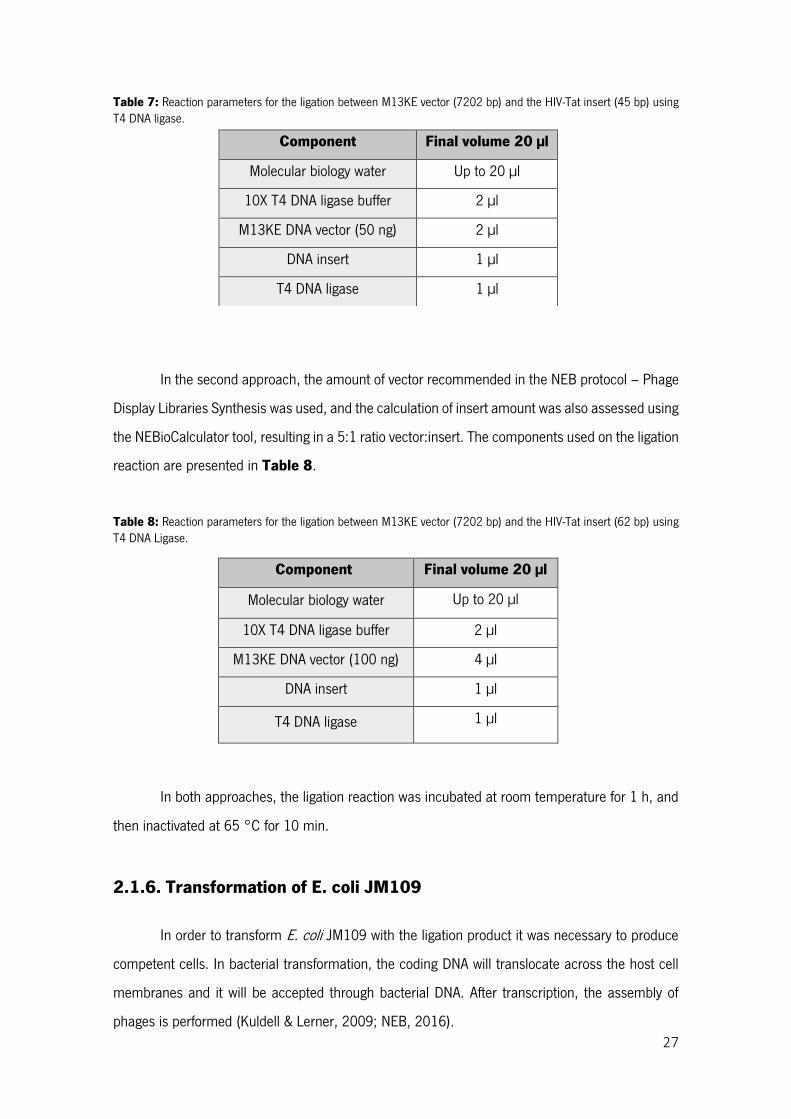
27
Table 7: Reaction parameters for the ligation between M13KE vector (7202 bp) and the HIV-Tat insert (45 bp) using T4 DNA ligase.
In the second approach, the amount of vector recommended in the NEB protocol – Phage
Display Libraries Synthesis was used, and the calculation of insert amount was also assessed using
the NEBioCalculator tool, resulting in a 5:1 ratio vector:insert. The components used on the ligation
reaction are presented in Table 8.
Table 8: Reaction parameters for the ligation between M13KE vector (7202 bp) and the HIV-Tat insert (62 bp) using T4 DNA Ligase.
Component Final volume 20 µl
Molecular biology water Up to 20 µl
10X T4 DNA ligase buffer 2 µl
M13KE DNA vector (100 ng) 4 µl
DNA insert 1 µl
T4 DNA ligase 1 µl
In both approaches, the ligation reaction was incubated at room temperature for 1 h, and
then inactivated at 65 °C for 10 min.
2.1.6. Transformation of E. coli JM109
In order to transform E. coli JM109 with the ligation product it was necessary to produce
competent cells. In bacterial transformation, the coding DNA will translocate across the host cell
membranes and it will be accepted through bacterial DNA. After transcription, the assembly of
phages is performed (Kuldell & Lerner, 2009; NEB, 2016).
Component Final volume 20 µl
Molecular biology water Up to 20 µl
10X T4 DNA ligase buffer 2 µl
M13KE DNA vector (50 ng) 2 µl
DNA insert 1 µl
T4 DNA ligase 1 µl
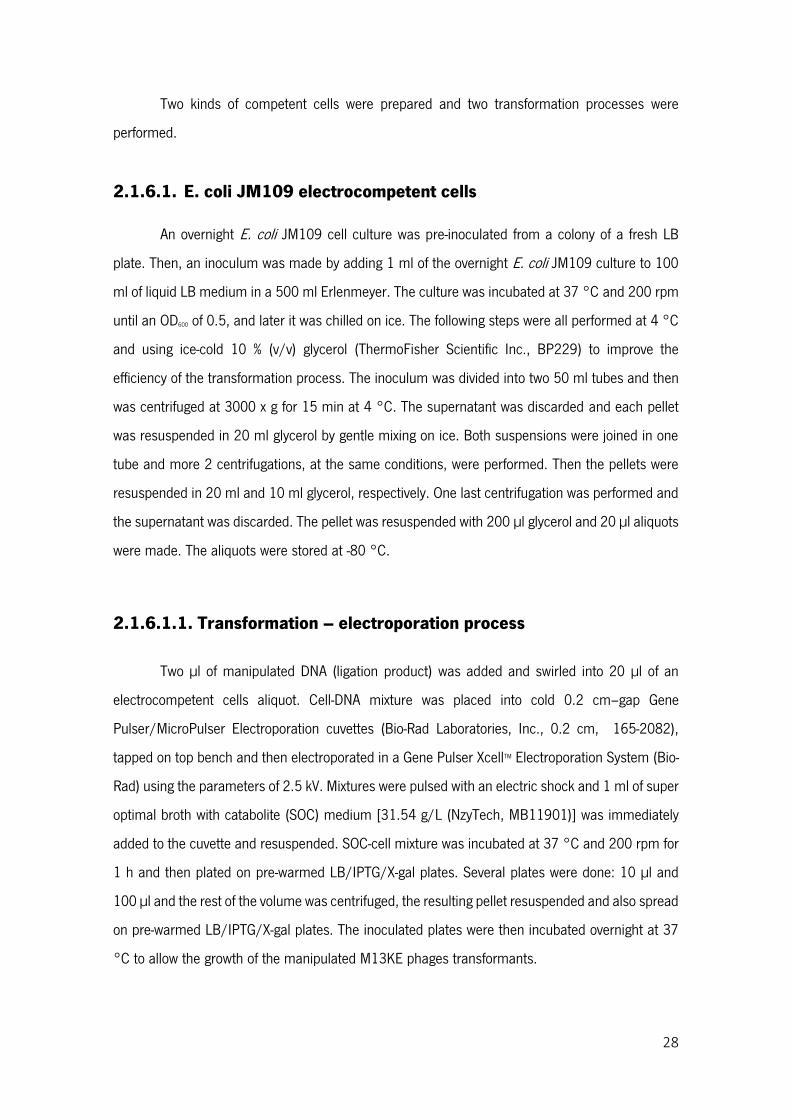
28
Two kinds of competent cells were prepared and two transformation processes were
performed.
2.1.6.1. E. coli JM109 electrocompetent cells
An overnight E. coli JM109 cell culture was pre-inoculated from a colony of a fresh LB
plate. Then, an inoculum was made by adding 1 ml of the overnight E. coli JM109 culture to 100
ml of liquid LB medium in a 500 ml Erlenmeyer. The culture was incubated at 37 °C and 200 rpm
until an OD600 of 0.5, and later it was chilled on ice. The following steps were all performed at 4 °C
and using ice-cold 10 % (v/v) glycerol (ThermoFisher Scientific Inc., BP229) to improve the
efficiency of the transformation process. The inoculum was divided into two 50 ml tubes and then
was centrifuged at 3000 x g for 15 min at 4 °C. The supernatant was discarded and each pellet
was resuspended in 20 ml glycerol by gentle mixing on ice. Both suspensions were joined in one
tube and more 2 centrifugations, at the same conditions, were performed. Then the pellets were
resuspended in 20 ml and 10 ml glycerol, respectively. One last centrifugation was performed and
the supernatant was discarded. The pellet was resuspended with 200 µl glycerol and 20 µl aliquots
were made. The aliquots were stored at -80 °C.
2.1.6.1.1. Transformation – electroporation process
Two µl of manipulated DNA (ligation product) was added and swirled into 20 µl of an
electrocompetent cells aliquot. Cell-DNA mixture was placed into cold 0.2 cm–gap Gene
Pulser/MicroPulser Electroporation cuvettes (Bio-Rad Laboratories, Inc., 0.2 cm, 165-2082),
tapped on top bench and then electroporated in a Gene Pulser XcellTM Electroporation System (Bio-
Rad) using the parameters of 2.5 kV. Mixtures were pulsed with an electric shock and 1 ml of super
optimal broth with catabolite (SOC) medium [31.54 g/L (NzyTech, MB11901)] was immediately
added to the cuvette and resuspended. SOC-cell mixture was incubated at 37 °C and 200 rpm for
1 h and then plated on pre-warmed LB/IPTG/X-gal plates. Several plates were done: 10 µl and
100 µl and the rest of the volume was centrifuged, the resulting pellet resuspended and also spread
on pre-warmed LB/IPTG/X-gal plates. The inoculated plates were then incubated overnight at 37
°C to allow the growth of the manipulated M13KE phages transformants.
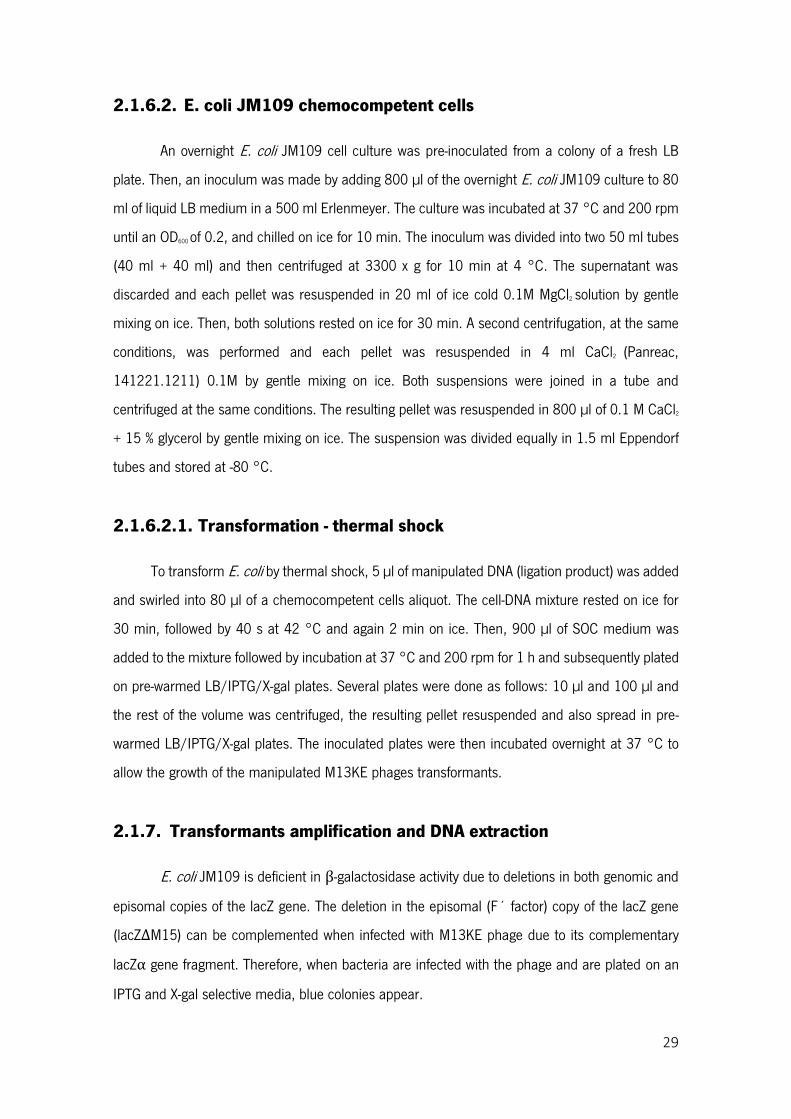
29
2.1.6.2. E. coli JM109 chemocompetent cells
An overnight E. coli JM109 cell culture was pre-inoculated from a colony of a fresh LB
plate. Then, an inoculum was made by adding 800 µl of the overnight E. coli JM109 culture to 80
ml of liquid LB medium in a 500 ml Erlenmeyer. The culture was incubated at 37 °C and 200 rpm
until an OD600 of 0.2, and chilled on ice for 10 min. The inoculum was divided into two 50 ml tubes
(40 ml + 40 ml) and then centrifuged at 3300 x g for 10 min at 4 °C. The supernatant was
discarded and each pellet was resuspended in 20 ml of ice cold 0.1M MgCl2 solution by gentle
mixing on ice. Then, both solutions rested on ice for 30 min. A second centrifugation, at the same
conditions, was performed and each pellet was resuspended in 4 ml CaCl2 (Panreac,
141221.1211) 0.1M by gentle mixing on ice. Both suspensions were joined in a tube and
centrifuged at the same conditions. The resulting pellet was resuspended in 800 µl of 0.1 M CaCl2
+ 15 % glycerol by gentle mixing on ice. The suspension was divided equally in 1.5 ml Eppendorf
tubes and stored at -80 °C.
2.1.6.2.1. Transformation - thermal shock
To transform E. coli by thermal shock, 5 µl of manipulated DNA (ligation product) was added
and swirled into 80 µl of a chemocompetent cells aliquot. The cell-DNA mixture rested on ice for
30 min, followed by 40 s at 42 °C and again 2 min on ice. Then, 900 µl of SOC medium was
added to the mixture followed by incubation at 37 °C and 200 rpm for 1 h and subsequently plated
on pre-warmed LB/IPTG/X-gal plates. Several plates were done as follows: 10 µl and 100 µl and
the rest of the volume was centrifuged, the resulting pellet resuspended and also spread in pre-
warmed LB/IPTG/X-gal plates. The inoculated plates were then incubated overnight at 37 °C to
allow the growth of the manipulated M13KE phages transformants.
2.1.7. Transformants amplification and DNA extraction
E. coli JM109 is deficient in -galactosidase activity due to deletions in both genomic and
episomal copies of the lacZ gene. The deletion in the episomal (F´ factor) copy of the lacZ gene
(lacZΔM15) can be complemented when infected with M13KE phage due to its complementary
lacZ gene fragment. Therefore, when bacteria are infected with the phage and are plated on an
IPTG and X-gal selective media, blue colonies appear.
30
After the overnight incubation period, random transformants from plates with well-
separated blue plaques were selected using a sterile white tip. Each individual blue plaque was
picked from the plate and transferred to a 50 ml tube with 15 ml LB medium, 150 µl E. coli JM1O9
from an overnight culture and 75 µl 1M MgCl2. Next, cultures were incubated at 37 °C and 200
rpm for 5 h. The cultures were centrifuged and the supernatants were filtered with a 0.2 µm PES
filter, and 500 µl of each phage solution were transferred to Eppendorf tubes containing 200 µl of
2.5 M polyethylene glycol (PEG 8000, Sigma, 89510)/ 20 % NaCl. The remaining was stored at 4
°C. The mixture in the Eppendorf tubes was gently mixed by inversion and allowed to stand at
room temperature for 15 min. Next, the suspensions were centrifuged at 19000 x g at 4 °C for 10
min and the supernatants were discarded. The pellets were resuspended in 100 µl iodide buffer
[10mM Tris-HCl pH 8, 1Mm EDTA and 4M sodium iodide ((Sigma, 409286)] and were gently
mixed. Then, 2 volumes of 1X TE were added, followed by the addition of 200 µl of 1:1 phenol:
chloroform. The tubes were mixed by inversion and centrifuged at 17500 x g for 5 min at 4°C. The
supernatants were collected to new tubes and 200 µl of chloroform was added. The steps of mixing,
centrifuging and supernatants collection to new tubes were repeated. Then 200 µl of ice-cold
absolute ethanol were added and, again, the steps of mixing and centrifuging were performed. The
supernatants were discarded and the pellets were resuspended in 1 ml ice-cold 70 % ethanol. The
tubes were again centrifuged, supernatants discarded and the pellets were allowed to dry at room
temperature. In the end, the dried pellets were resuspended in 30 µl 1X TE and quantified by
NanoDrop1000.
2.1.8. Confirmation of the modified clones
In order to confirm if the selected clones were positive, e.g. if the selected phages contain
in their genome the sequence of interest, the gene III was amplified by PCR. The components of
the reaction are presented in Table 9 and the cycling protocol in Table 10. In the end, the
amplified sequences were confirmed in a 1.5% agarose gel using SyBr safe green for bands
visualization.
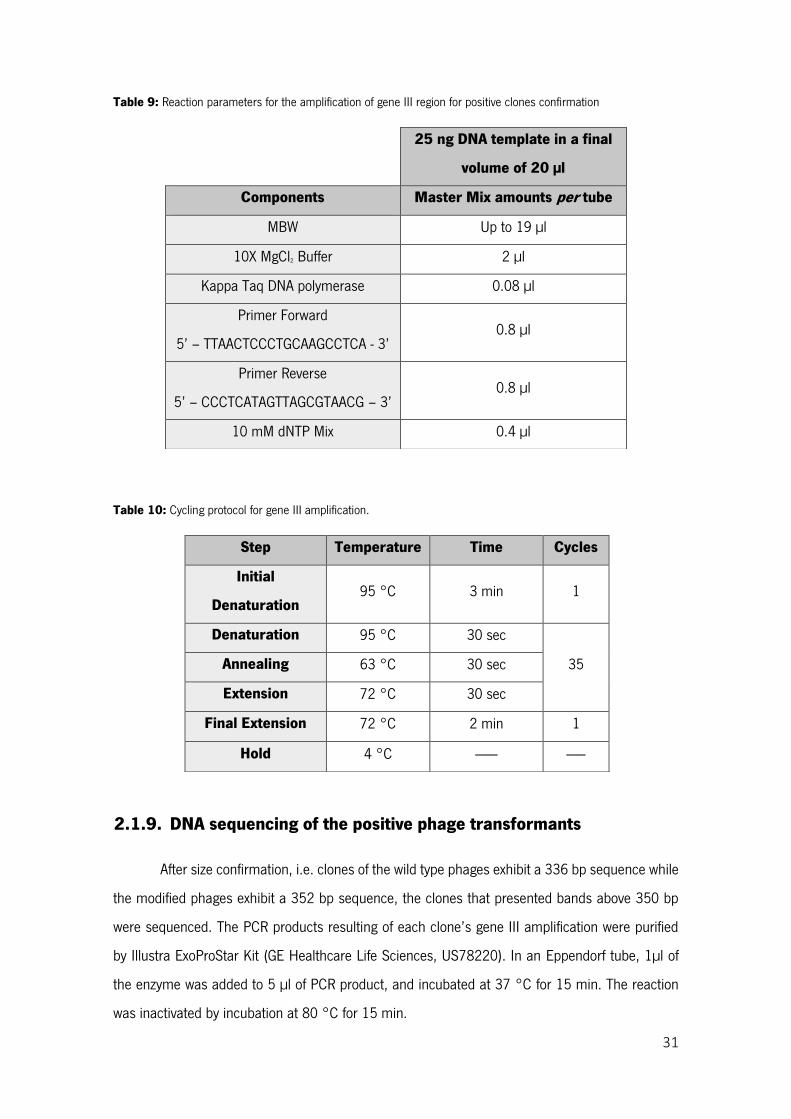
31
Table 9: Reaction parameters for the amplification of gene III region for positive clones confirmation
Table 10: Cycling protocol for gene III amplification.
2.1.9. DNA sequencing of the positive phage transformants
After size confirmation, i.e. clones of the wild type phages exhibit a 336 bp sequence while
the modified phages exhibit a 352 bp sequence, the clones that presented bands above 350 bp
were sequenced. The PCR products resulting of each clone’s gene III amplification were purified
by Illustra ExoProStar Kit (GE Healthcare Life Sciences, US78220). In an Eppendorf tube, 1µl of
the enzyme was added to 5 µl of PCR product, and incubated at 37 °C for 15 min. The reaction
was inactivated by incubation at 80 °C for 15 min.
25 ng DNA template in a final
volume of 20 µl
Components Master Mix amounts per tube
MBW Up to 19 µl
10X MgCl2 Buffer 2 µl
Kappa Taq DNA polymerase 0.08 µl
Primer Forward
5’ – TTAACTCCCTGCAAGCCTCA - 3’ 0.8 µl
Primer Reverse
5’ – CCCTCATAGTTAGCGTAACG – 3’ 0.8 µl
10 mM dNTP Mix 0.4 µl
Step Temperature Time Cycles
Initial
Denaturation 95 °C 3 min 1
Denaturation 95 °C 30 sec
35 Annealing 63 °C 30 sec
Extension 72 °C 30 sec
Final Extension 72 °C 2 min 1
Hold 4 °C ------- ------
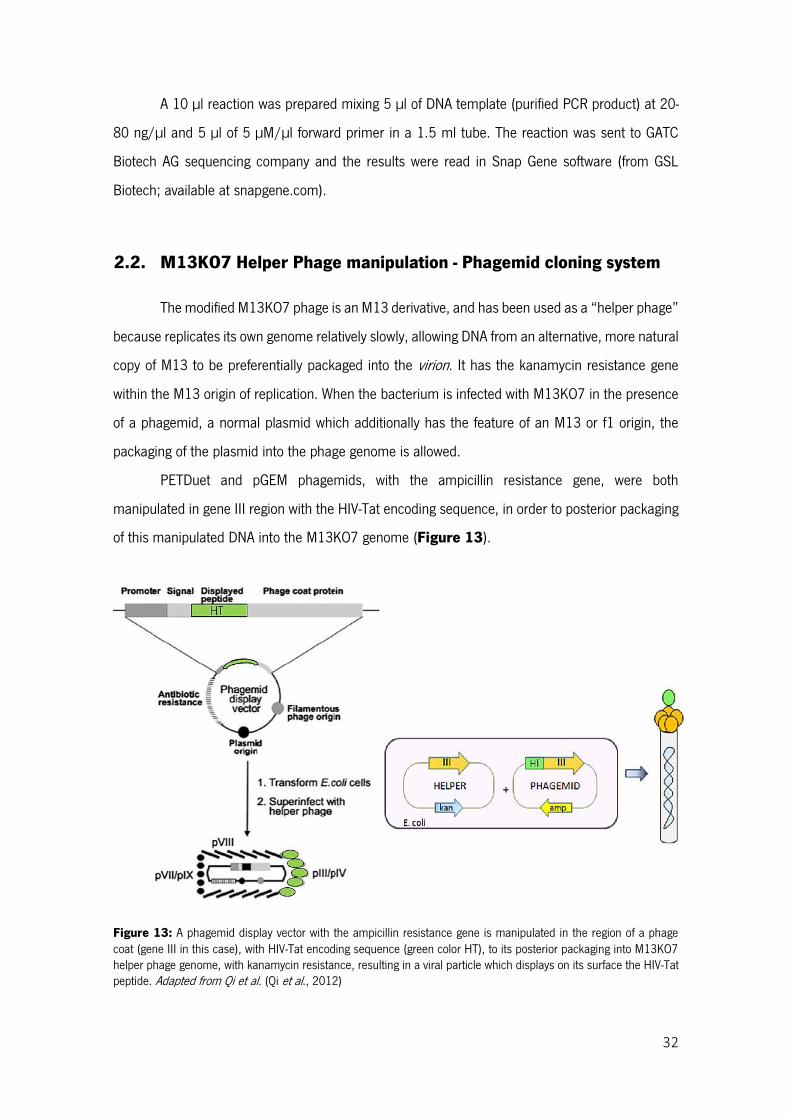
32
A 10 µl reaction was prepared mixing 5 µl of DNA template (purified PCR product) at 20-
80 ng/µl and 5 µl of 5 µM/µl forward primer in a 1.5 ml tube. The reaction was sent to GATC
Biotech AG sequencing company and the results were read in Snap Gene software (from GSL
Biotech; available at snapgene.com).
2.2. M13KO7 Helper Phage manipulation - Phagemid cloning system
The modified M13KO7 phage is an M13 derivative, and has been used as a “helper phage”
because replicates its own genome relatively slowly, allowing DNA from an alternative, more natural
copy of M13 to be preferentially packaged into the virion. It has the kanamycin resistance gene
within the M13 origin of replication. When the bacterium is infected with M13KO7 in the presence
of a phagemid, a normal plasmid which additionally has the feature of an M13 or f1 origin, the
packaging of the plasmid into the phage genome is allowed.
PETDuet and pGEM phagemids, with the ampicillin resistance gene, were both
manipulated in gene III region with the HIV-Tat encoding sequence, in order to posterior packaging
of this manipulated DNA into the M13KO7 genome (Figure 13).
Figure 13: A phagemid display vector with the ampicillin resistance gene is manipulated in the region of a phage coat (gene III in this case), with HIV-Tat encoding sequence (green color HT), to its posterior packaging into M13KO7 helper phage genome, with kanamycin resistance, resulting in a viral particle which displays on its surface the HIV-Tat peptide. Adapted from Qi et al. (Qi et al., 2012)
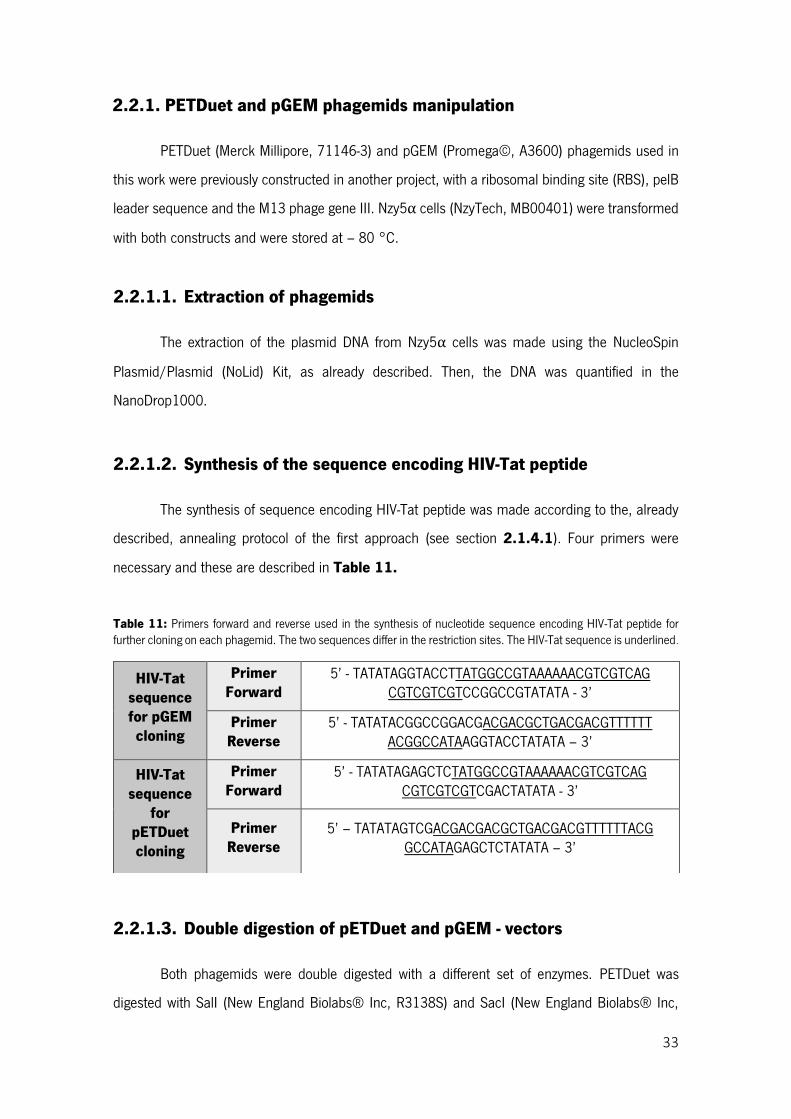
33
2.2.1. PETDuet and pGEM phagemids manipulation
PETDuet (Merck Millipore, 71146-3) and pGEM (Promega©, A3600) phagemids used in
this work were previously constructed in another project, with a ribosomal binding site (RBS), pelB
leader sequence and the M13 phage gene III. Nzy5 cells (NzyTech, MB00401) were transformed
with both constructs and were stored at – 80 °C.
2.2.1.1. Extraction of phagemids
The extraction of the plasmid DNA from Nzy5 cells was made using the NucleoSpin
Plasmid/Plasmid (NoLid) Kit, as already described. Then, the DNA was quantified in the
NanoDrop1000.
2.2.1.2. Synthesis of the sequence encoding HIV-Tat peptide
The synthesis of sequence encoding HIV-Tat peptide was made according to the, already
described, annealing protocol of the first approach (see section 2.1.4.1). Four primers were
necessary and these are described in Table 11.
Table 11: Primers forward and reverse used in the synthesis of nucleotide sequence encoding HIV-Tat peptide for further cloning on each phagemid. The two sequences differ in the restriction sites. The HIV-Tat sequence is underlined.
2.2.1.3. Double digestion of pETDuet and pGEM - vectors
Both phagemids were double digested with a different set of enzymes. PETDuet was
digested with SalI (New England Biolabs® Inc, R3138S) and SacI (New England Biolabs® Inc,
HIV-Tat
sequence
for pGEM
cloning
Primer
Forward
5’ - TATATAGGTACCTTATGGCCGTAAAAAACGTCGTCAG CGTCGTCGTCCGGCCGTATATA - 3’
Primer
Reverse
5’ - TATATACGGCCGGACGACGACGCTGACGACGTTTTTT ACGGCCATAAGGTACCTATATA – 3’
HIV-Tat
sequence
for
pETDuet
cloning
Primer
Forward
5’ - TATATAGAGCTCTATGGCCGTAAAAAACGTCGTCAG CGTCGTCGTCGACTATATA - 3’
Primer
Reverse
5’ – TATATAGTCGACGACGACGCTGACGACGTTTTTTACG GCCATAGAGCTCTATATA – 3’
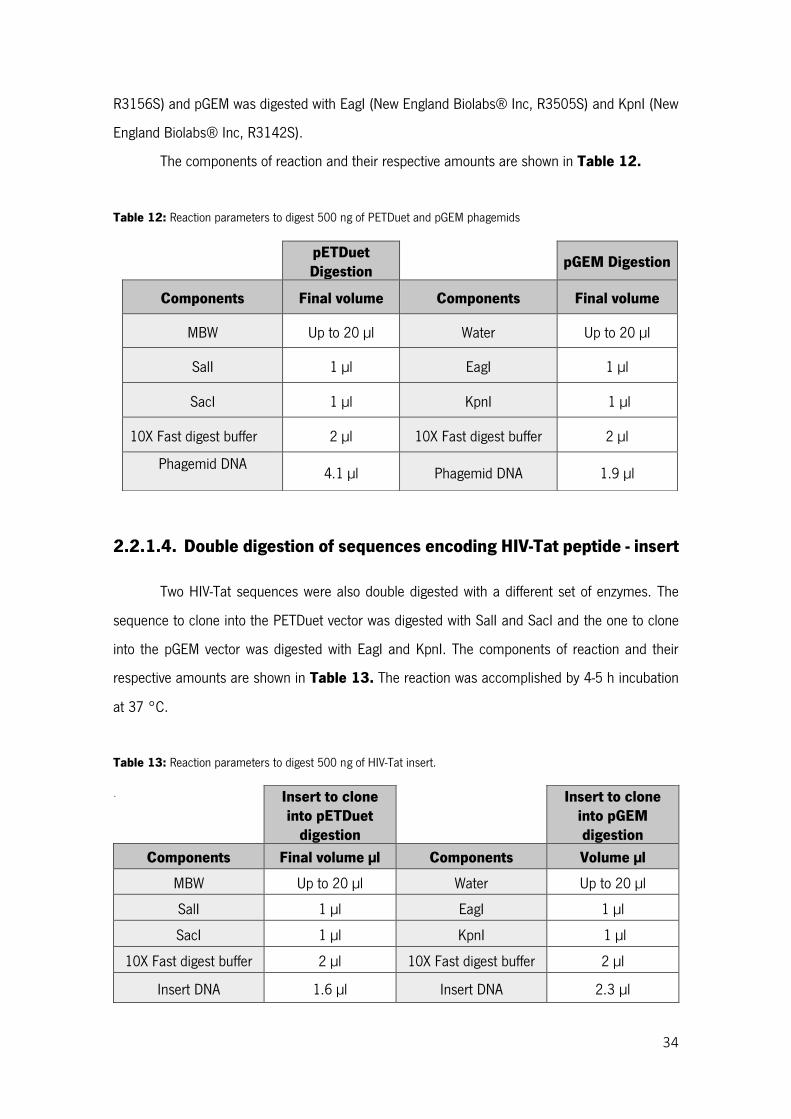
34
R3156S) and pGEM was digested with EagI (New England Biolabs® Inc, R3505S) and KpnI (New
England Biolabs® Inc, R3142S).
The components of reaction and their respective amounts are shown in Table 12.
Table 12: Reaction parameters to digest 500 ng of PETDuet and pGEM phagemids
2.2.1.4. Double digestion of sequences encoding HIV-Tat peptide - insert
Two HIV-Tat sequences were also double digested with a different set of enzymes. The
sequence to clone into the PETDuet vector was digested with SalI and SacI and the one to clone
into the pGEM vector was digested with EagI and KpnI. The components of reaction and their
respective amounts are shown in Table 13. The reaction was accomplished by 4-5 h incubation
at 37 °C.
Table 13: Reaction parameters to digest 500 ng of HIV-Tat insert.
pETDuet
Digestion pGEM Digestion
Components Final volume Components Final volume
MBW Up to 20 µl Water Up to 20 µl
SalI 1 µl EagI 1 µl
SacI 1 µl KpnI 1 µl
10X Fast digest buffer 2 µl 10X Fast digest buffer 2 µl
Phagemid DNA
4.1 µl Phagemid DNA 1.9 µl
Insert to clone
into pETDuet
digestion
Insert to clone
into pGEM
digestion
Components Final volume µl Components Volume µl
MBW Up to 20 µl Water Up to 20 µl
SalI 1 µl EagI 1 µl
SacI 1 µl KpnI 1 µl
10X Fast digest buffer 2 µl 10X Fast digest buffer 2 µl
Insert DNA 1.6 µl Insert DNA 2.3 µl
.
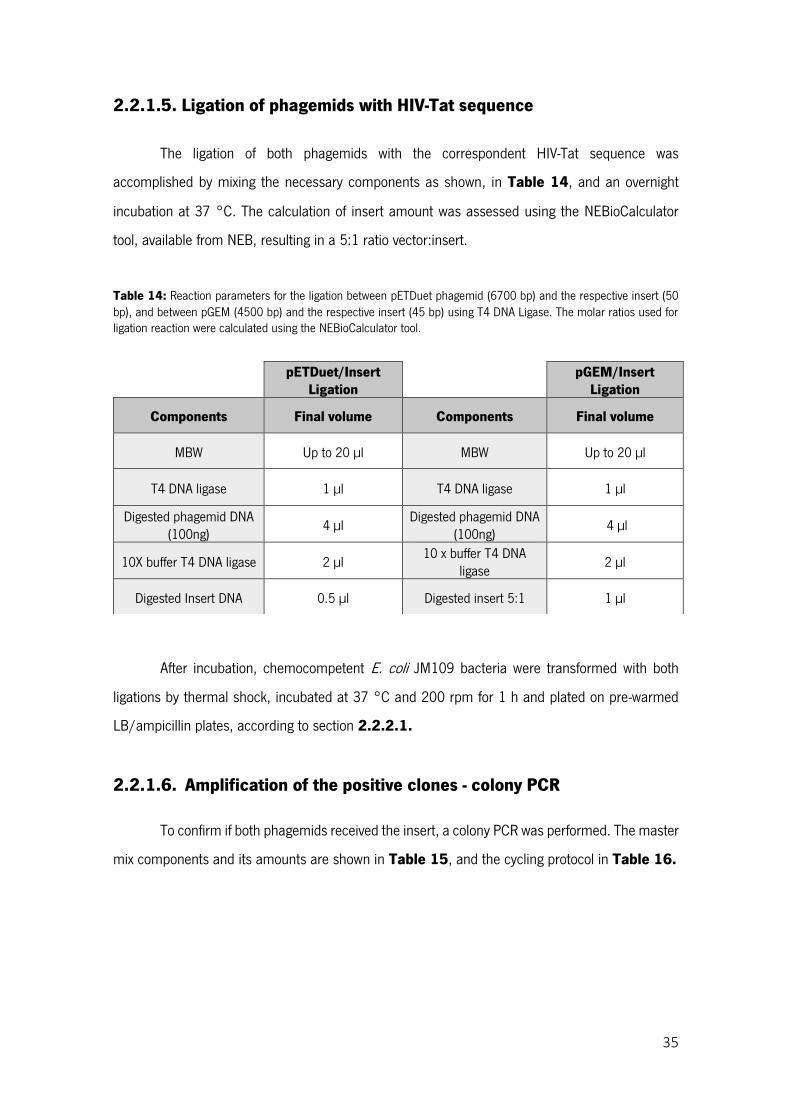
35
2.2.1.5. Ligation of phagemids with HIV-Tat sequence
The ligation of both phagemids with the correspondent HIV-Tat sequence was
accomplished by mixing the necessary components as shown, in Table 14, and an overnight
incubation at 37 °C. The calculation of insert amount was assessed using the NEBioCalculator
tool, available from NEB, resulting in a 5:1 ratio vector:insert.
Table 14: Reaction parameters for the ligation between pETDuet phagemid (6700 bp) and the respective insert (50 bp), and between pGEM (4500 bp) and the respective insert (45 bp) using T4 DNA Ligase. The molar ratios used for ligation reaction were calculated using the NEBioCalculator tool.
After incubation, chemocompetent E. coli JM109 bacteria were transformed with both
ligations by thermal shock, incubated at 37 °C and 200 rpm for 1 h and plated on pre-warmed
LB/ampicillin plates, according to section 2.2.2.1.
2.2.1.6. Amplification of the positive clones - colony PCR
To confirm if both phagemids received the insert, a colony PCR was performed. The master
mix components and its amounts are shown in Table 15, and the cycling protocol in Table 16.
pETDuet/Insert
Ligation
pGEM/Insert
Ligation
Components Final volume Components Final volume
MBW Up to 20 µl MBW Up to 20 µl
T4 DNA ligase 1 µl T4 DNA ligase 1 µl
Digested phagemid DNA (100ng)
4 µl Digested phagemid DNA
(100ng) 4 µl
10X buffer T4 DNA ligase 2 µl 10 x buffer T4 DNA
ligase 2 µl
Digested Insert DNA 0.5 µl Digested insert 5:1 1 µl
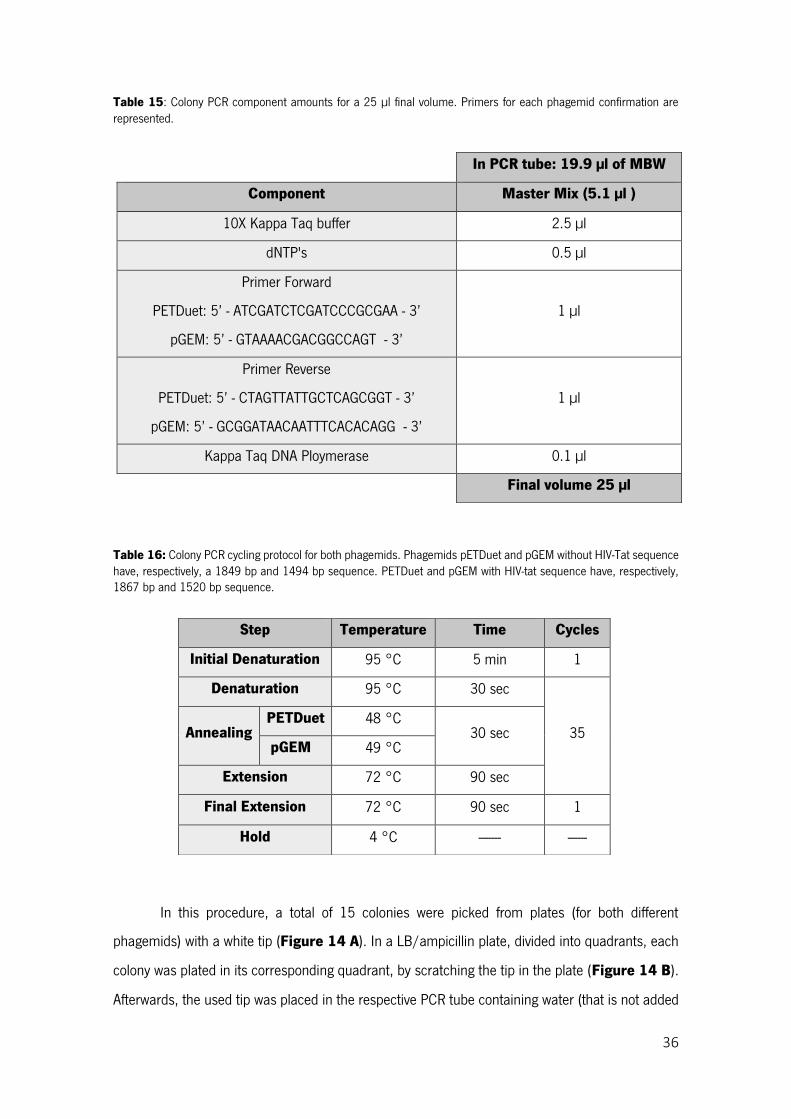
36
Table 15: Colony PCR component amounts for a 25 µl final volume. Primers for each phagemid confirmation are represented.
Table 16: Colony PCR cycling protocol for both phagemids. Phagemids pETDuet and pGEM without HIV-Tat sequence have, respectively, a 1849 bp and 1494 bp sequence. PETDuet and pGEM with HIV-tat sequence have, respectively, 1867 bp and 1520 bp sequence.
In this procedure, a total of 15 colonies were picked from plates (for both different
phagemids) with a white tip (Figure 14 A). In a LB/ampicillin plate, divided into quadrants, each
colony was plated in its corresponding quadrant, by scratching the tip in the plate (Figure 14 B).
Afterwards, the used tip was placed in the respective PCR tube containing water (that is not added
In PCR tube: 19.9 µl of MBW
Component Master Mix (5.1 µl )
10X Kappa Taq buffer 2.5 µl
dNTP's 0.5 µl
Primer Forward
PETDuet: 5’ - ATCGATCTCGATCCCGCGAA - 3’
pGEM: 5’ - GTAAAACGACGGCCAGT - 3’
1 µl
Primer Reverse
PETDuet: 5’ - CTAGTTATTGCTCAGCGGT - 3’
pGEM: 5’ - GCGGATAACAATTTCACACAGG - 3’
1 µl
Kappa Taq DNA Ploymerase 0.1 µl
Final volume 25 µl
Step Temperature Time Cycles
Initial Denaturation 95 °C 5 min 1
Denaturation 95 °C 30 sec
35 Annealing PETDuet 48 °C
30 sec pGEM 49 °C
Extension 72 °C 90 sec
Final Extension 72 °C 90 sec 1
Hold 4 °C ------- ------
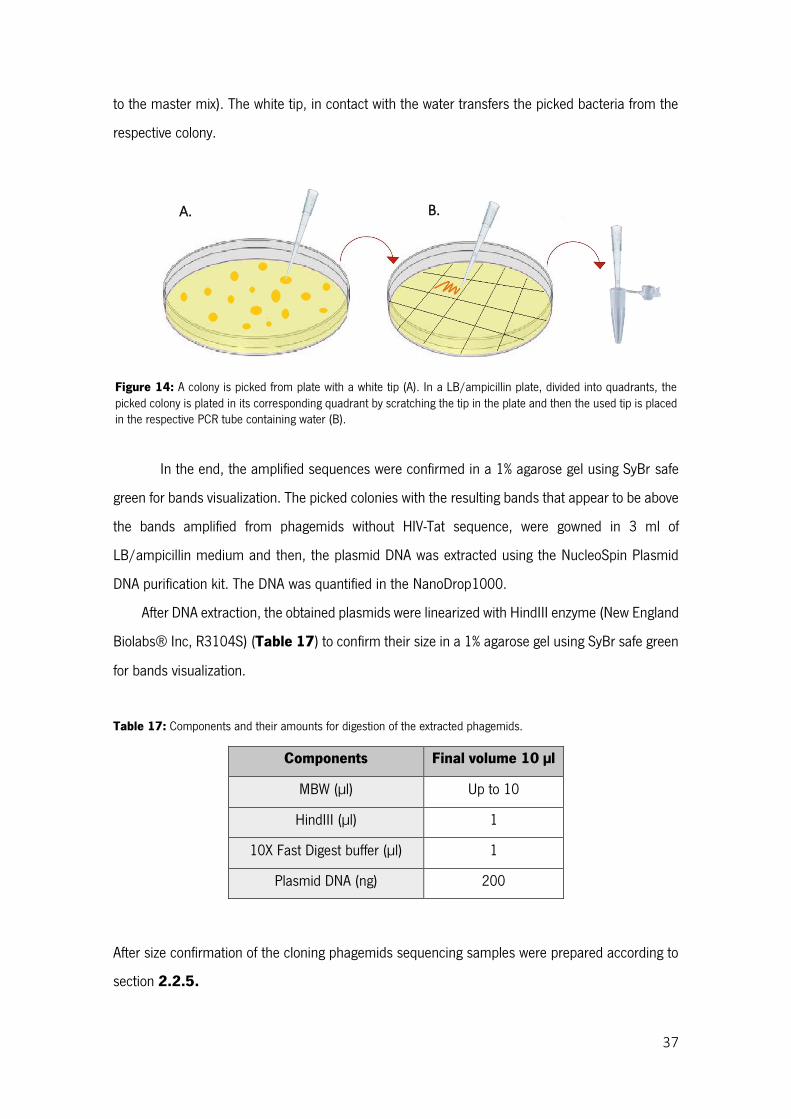
37
Figure 14: A colony is picked from plate with a white tip (A). In a LB/ampicillin plate, divided into quadrants, the picked colony is plated in its corresponding quadrant by scratching the tip in the plate and then the used tip is placed in the respective PCR tube containing water (B).
to the master mix). The white tip, in contact with the water transfers the picked bacteria from the
respective colony.
In the end, the amplified sequences were confirmed in a 1% agarose gel using SyBr safe
green for bands visualization. The picked colonies with the resulting bands that appear to be above
the bands amplified from phagemids without HIV-Tat sequence, were gowned in 3 ml of
LB/ampicillin medium and then, the plasmid DNA was extracted using the NucleoSpin Plasmid
DNA purification kit. The DNA was quantified in the NanoDrop1000.
After DNA extraction, the obtained plasmids were linearized with HindIII enzyme (New England
Biolabs® Inc, R3104S) (Table 17) to confirm their size in a 1% agarose gel using SyBr safe green
for bands visualization.
Table 17: Components and their amounts for digestion of the extracted phagemids.
Components Final volume 10 µl
MBW (µl) Up to 10
HindIII (µl) 1
10X Fast Digest buffer (µl) 1
Plasmid DNA (ng) 200
After size confirmation of the cloning phagemids sequencing samples were prepared according to
section 2.2.5.
A. B.
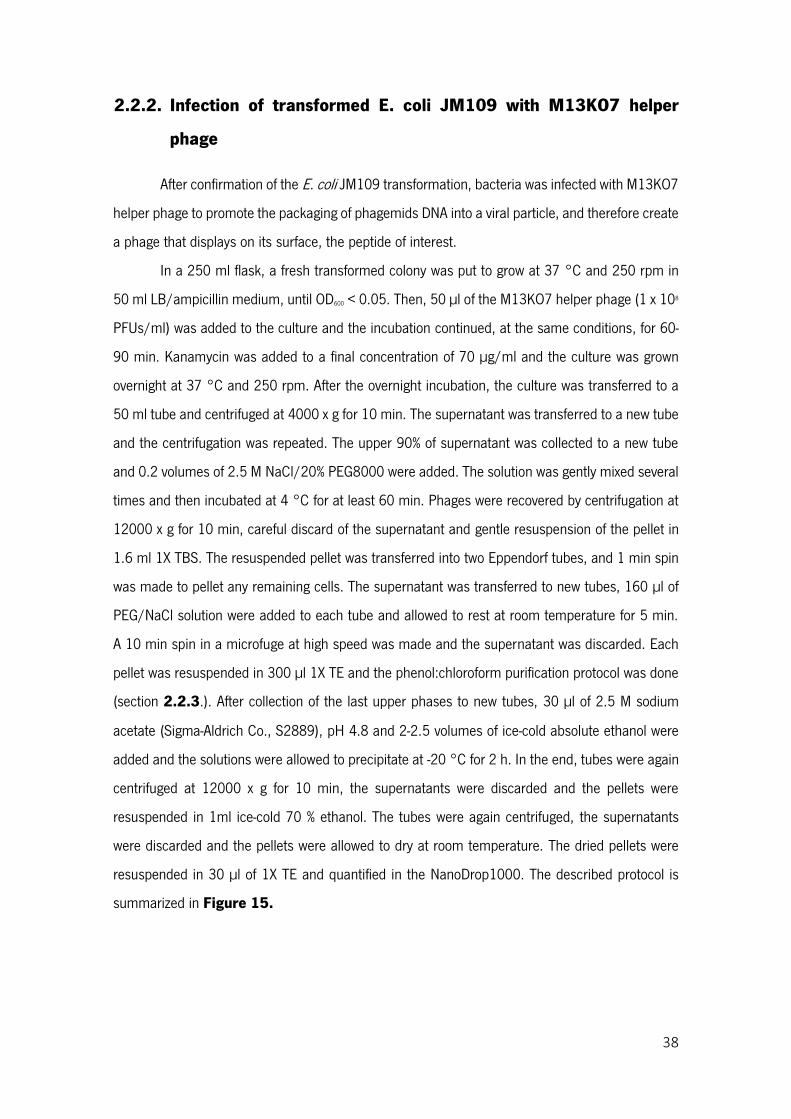
38
2.2.2. Infection of transformed E. coli JM109 with M13KO7 helper
phage
After confirmation of the E. coli JM109 transformation, bacteria was infected with M13KO7
helper phage to promote the packaging of phagemids DNA into a viral particle, and therefore create
a phage that displays on its surface, the peptide of interest.
In a 250 ml flask, a fresh transformed colony was put to grow at 37 °C and 250 rpm in
50 ml LB/ampicillin medium, until OD600 < 0.05. Then, 50 µl of the M13KO7 helper phage (1 x 10⁸
PFUs/ml) was added to the culture and the incubation continued, at the same conditions, for 60-
90 min. Kanamycin was added to a final concentration of 70 µg/ml and the culture was grown
overnight at 37 °C and 250 rpm. After the overnight incubation, the culture was transferred to a
50 ml tube and centrifuged at 4000 x g for 10 min. The supernatant was transferred to a new tube
and the centrifugation was repeated. The upper 90% of supernatant was collected to a new tube
and 0.2 volumes of 2.5 M NaCl/20% PEG8000 were added. The solution was gently mixed several
times and then incubated at 4 °C for at least 60 min. Phages were recovered by centrifugation at
12000 x g for 10 min, careful discard of the supernatant and gentle resuspension of the pellet in
1.6 ml 1X TBS. The resuspended pellet was transferred into two Eppendorf tubes, and 1 min spin
was made to pellet any remaining cells. The supernatant was transferred to new tubes, 160 µl of
PEG/NaCl solution were added to each tube and allowed to rest at room temperature for 5 min.
A 10 min spin in a microfuge at high speed was made and the supernatant was discarded. Each
pellet was resuspended in 300 µl 1X TE and the phenol:chloroform purification protocol was done
(section 2.2.3.). After collection of the last upper phases to new tubes, 30 µl of 2.5 M sodium
acetate (Sigma-Aldrich Co., S2889), pH 4.8 and 2-2.5 volumes of ice-cold absolute ethanol were
added and the solutions were allowed to precipitate at -20 °C for 2 h. In the end, tubes were again
centrifuged at 12000 x g for 10 min, the supernatants were discarded and the pellets were
resuspended in 1ml ice-cold 70 % ethanol. The tubes were again centrifuged, the supernatants
were discarded and the pellets were allowed to dry at room temperature. The dried pellets were
resuspended in 30 µl of 1X TE and quantified in the NanoDrop1000. The described protocol is
summarized in Figure 15.
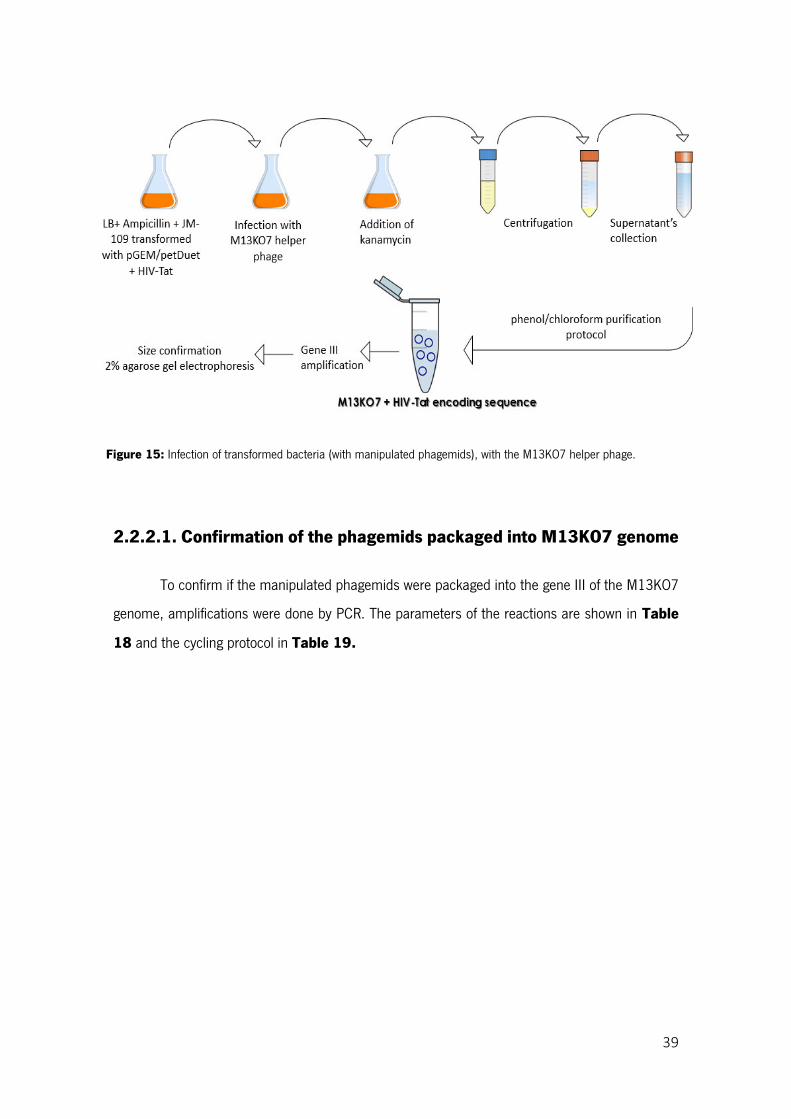
39
Figure 15: Infection of transformed bacteria (with manipulated phagemids), with the M13KO7 helper phage.
2.2.2.1. Confirmation of the phagemids packaged into M13KO7 genome
To confirm if the manipulated phagemids were packaged into the gene III of the M13KO7
genome, amplifications were done by PCR. The parameters of the reactions are shown in Table
18 and the cycling protocol in Table 19.
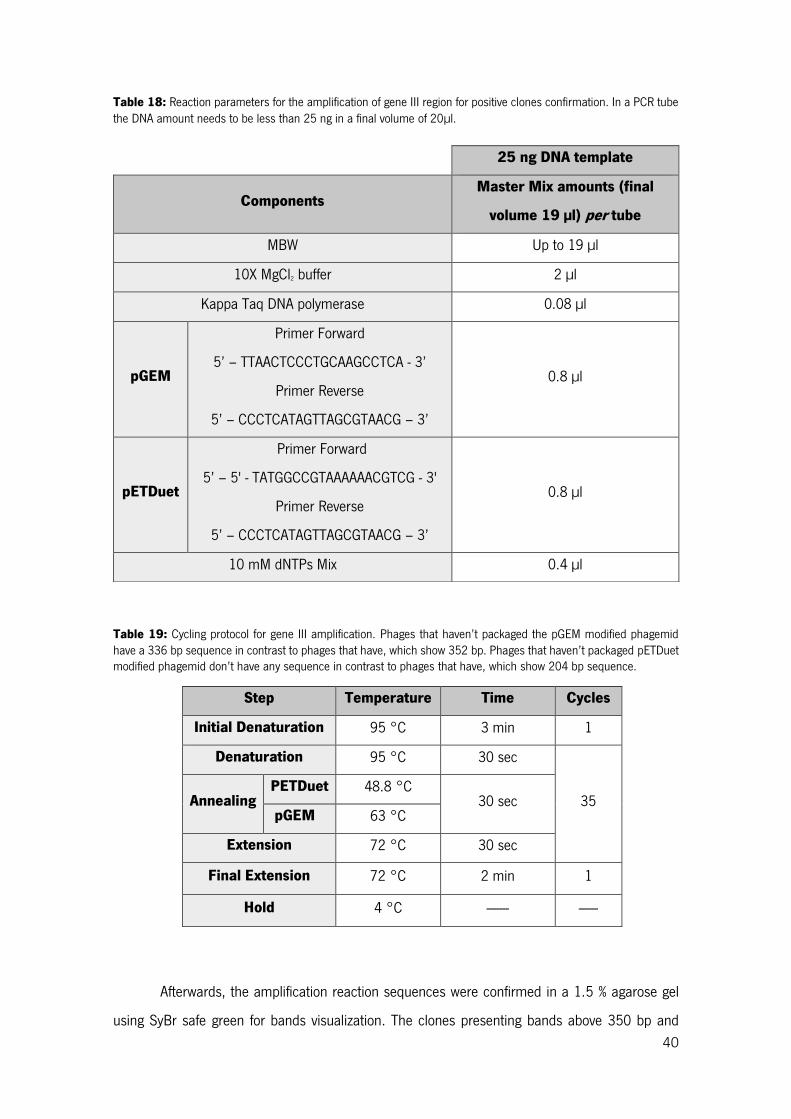
40
Table 18: Reaction parameters for the amplification of gene III region for positive clones confirmation. In a PCR tube the DNA amount needs to be less than 25 ng in a final volume of 20µl.
Table 19: Cycling protocol for gene III amplification. Phages that haven’t packaged the pGEM modified phagemid have a 336 bp sequence in contrast to phages that have, which show 352 bp. Phages that haven’t packaged pETDuet modified phagemid don’t have any sequence in contrast to phages that have, which show 204 bp sequence.
Afterwards, the amplification reaction sequences were confirmed in a 1.5 % agarose gel
using SyBr safe green for bands visualization. The clones presenting bands above 350 bp and
25 ng DNA template
Components Master Mix amounts (final
volume 19 µl) per tube
MBW Up to 19 µl
10X MgCl2 buffer 2 µl
Kappa Taq DNA polymerase 0.08 µl
pGEM
Primer Forward
5’ – TTAACTCCCTGCAAGCCTCA - 3’
Primer Reverse
5’ – CCCTCATAGTTAGCGTAACG – 3’
0.8 µl
pETDuet
Primer Forward
5’ – 5' - TATGGCCGTAAAAAACGTCG - 3'
Primer Reverse
5’ – CCCTCATAGTTAGCGTAACG – 3’
0.8 µl
10 mM dNTPs Mix 0.4 µl
Step Temperature Time Cycles
Initial Denaturation 95 °C 3 min 1
Denaturation 95 °C 30 sec
35 Annealing PETDuet 48.8 °C
30 sec pGEM 63 °C
Extension 72 °C 30 sec
Final Extension 72 °C 2 min 1
Hold 4 °C ------- ------
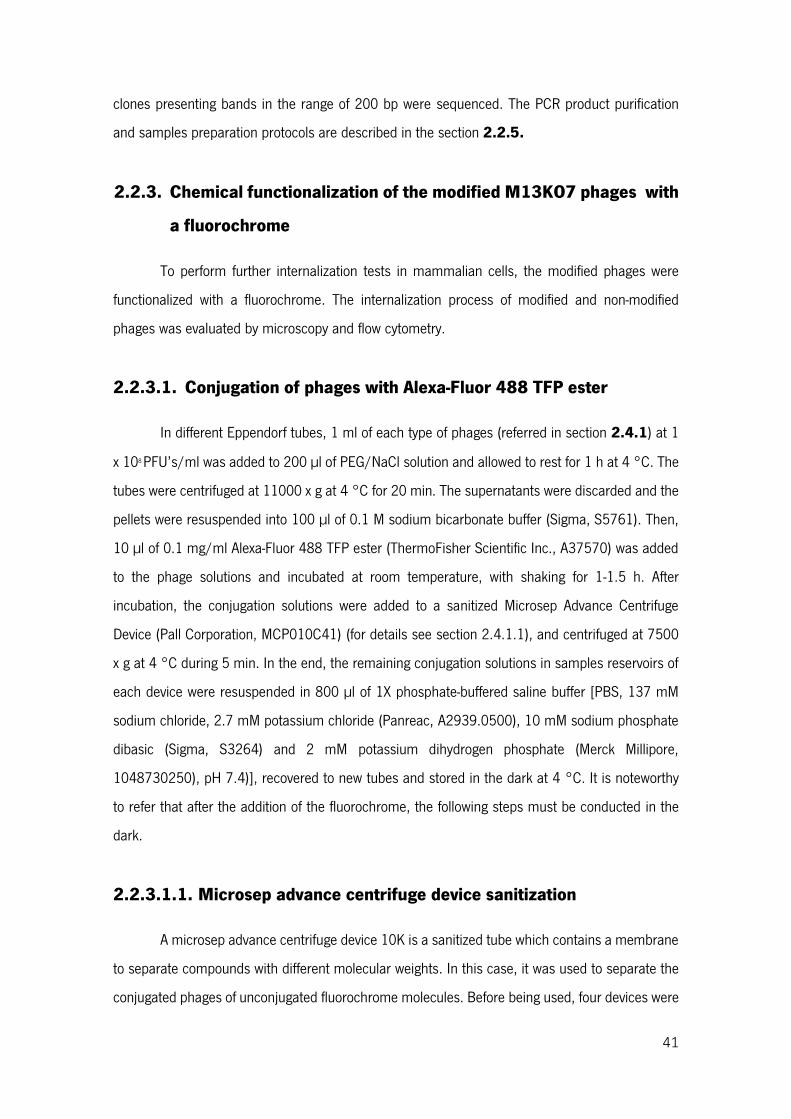
41
clones presenting bands in the range of 200 bp were sequenced. The PCR product purification
and samples preparation protocols are described in the section 2.2.5.
2.2.3. Chemical functionalization of the modified M13KO7 phages with
a fluorochrome
To perform further internalization tests in mammalian cells, the modified phages were
functionalized with a fluorochrome. The internalization process of modified and non-modified
phages was evaluated by microscopy and flow cytometry.
2.2.3.1. Conjugation of phages with Alexa-Fluor 488 TFP ester
In different Eppendorf tubes, 1 ml of each type of phages (referred in section 2.4.1) at 1
x 108 PFU’s/ml was added to 200 µl of PEG/NaCl solution and allowed to rest for 1 h at 4 °C. The
tubes were centrifuged at 11000 x g at 4 °C for 20 min. The supernatants were discarded and the
pellets were resuspended into 100 µl of 0.1 M sodium bicarbonate buffer (Sigma, S5761). Then,
10 µl of 0.1 mg/ml Alexa-Fluor 488 TFP ester (ThermoFisher Scientific Inc., A37570) was added
to the phage solutions and incubated at room temperature, with shaking for 1-1.5 h. After
incubation, the conjugation solutions were added to a sanitized Microsep Advance Centrifuge
Device (Pall Corporation, MCP010C41) (for details see section 2.4.1.1), and centrifuged at 7500
x g at 4 °C during 5 min. In the end, the remaining conjugation solutions in samples reservoirs of
each device were resuspended in 800 µl of 1X phosphate-buffered saline buffer [PBS, 137 mM
sodium chloride, 2.7 mM potassium chloride (Panreac, A2939.0500), 10 mM sodium phosphate
dibasic (Sigma, S3264) and 2 mM potassium dihydrogen phosphate (Merck Millipore,
1048730250), pH 7.4)], recovered to new tubes and stored in the dark at 4 °C. It is noteworthy
to refer that after the addition of the fluorochrome, the following steps must be conducted in the
dark.
2.2.3.1.1. Microsep advance centrifuge device sanitization
A microsep advance centrifuge device 10K is a sanitized tube which contains a membrane
to separate compounds with different molecular weights. In this case, it was used to separate the
conjugated phages of unconjugated fluorochrome molecules. Before being used, four devices were
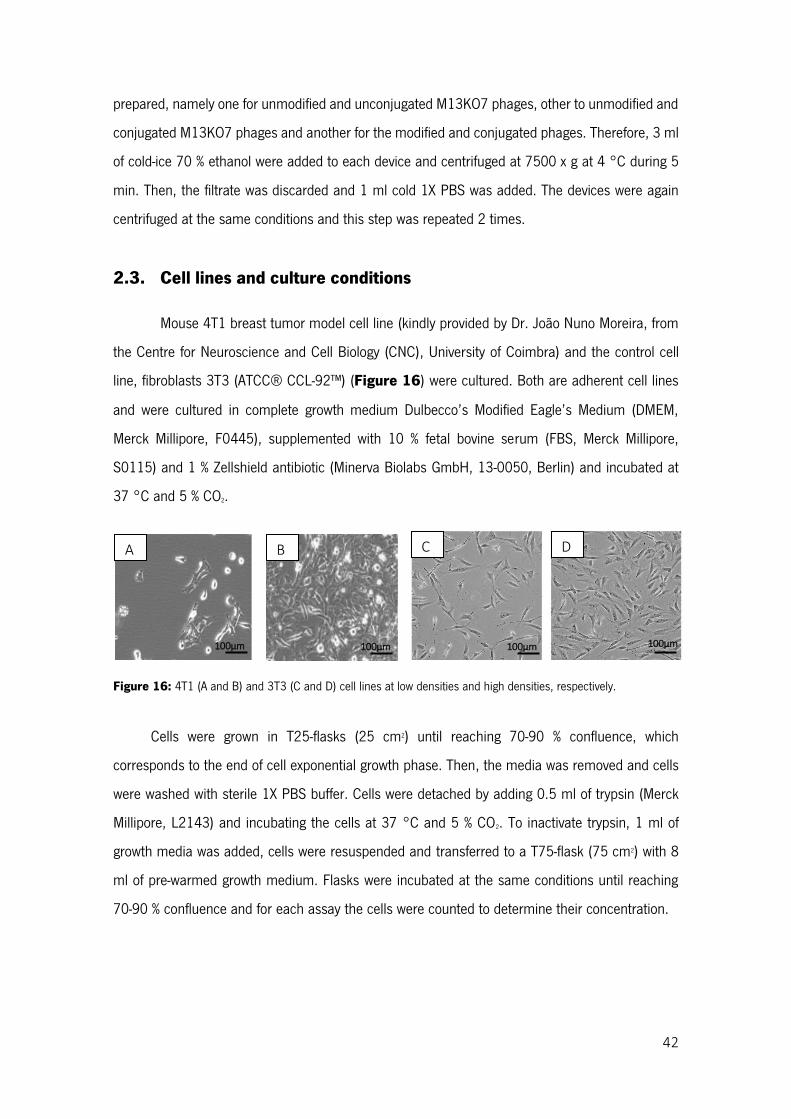
42
prepared, namely one for unmodified and unconjugated M13KO7 phages, other to unmodified and
conjugated M13KO7 phages and another for the modified and conjugated phages. Therefore, 3 ml
of cold-ice 70 % ethanol were added to each device and centrifuged at 7500 x g at 4 °C during 5
min. Then, the filtrate was discarded and 1 ml cold 1X PBS was added. The devices were again
centrifuged at the same conditions and this step was repeated 2 times.
2.3. Cell lines and culture conditions
Mouse 4T1 breast tumor model cell line (kindly provided by Dr. João Nuno Moreira, from
the Centre for Neuroscience and Cell Biology (CNC), University of Coimbra) and the control cell
line, fibroblasts 3T3 (ATCC® CCL-92™) (Figure 16) were cultured. Both are adherent cell lines
and were cultured in complete growth medium Dulbecco’s Modified Eagle’s Medium (DMEM,
Merck Millipore, F0445), supplemented with 10 % fetal bovine serum (FBS, Merck Millipore,
S0115) and 1 % Zellshield antibiotic (Minerva Biolabs GmbH, 13-0050, Berlin) and incubated at
37 °C and 5 % CO2.
Figure 16: 4T1 (A and B) and 3T3 (C and D) cell lines at low densities and high densities, respectively.
Cells were grown in T25-flasks (25 cm2) until reaching 70-90 % confluence, which
corresponds to the end of cell exponential growth phase. Then, the media was removed and cells
were washed with sterile 1X PBS buffer. Cells were detached by adding 0.5 ml of trypsin (Merck
Millipore, L2143) and incubating the cells at 37 °C and 5 % CO2. To inactivate trypsin, 1 ml of
growth media was added, cells were resuspended and transferred to a T75-flask (75 cm2) with 8
ml of pre-warmed growth medium. Flasks were incubated at the same conditions until reaching
70-90 % confluence and for each assay the cells were counted to determine their concentration.
B C D A
100µm 100µm 100µm 100µm
43
2.4. Cell internalization assays with Alexa-Fluor 488 TFP ester
2.4.1. Evaluation of cells internalization by flow cytometry
In a 6-well plate, cells were plated at a concentration of 7.5 x 10⁵/ml per well. For that
purpose, cells of a T75-flask with 90% confluence were detached with 1 ml of trypsine and
resuspended in 9 ml of growth medium (total volume 10 ml). In a Neubauer chamber, a 10 µl
drop was added and cells were counted. The concentration of cell/ml is given by the number of
counted cells multiplying by 104 and by the resuspension volume. The cells in 6-well plates were
incubated at the conditions already referred, for 24-36 h. The growth medium was removed of the
wells and cells were washed with 1X PBS. Then, phages conjugated with Alexa Fluor 488 TFP
ester, prepared previously as described in section 2.4.1 and its controls were added to the wells
containing cells as shown in Figure 17, and these were further incubated at 37 °C for 1.5 hours.
Figure 17: 4T1 cells were plated in 10 wells at 7.5 x 10⁵ cells/ml/well. Previous phages solutions and its controls were added to each well in a final volume of 1 ml of growth medium. C1 corresponds to the control 1, which contains only cells to evaluate cells autofluorescence; C2 corresponds to unmodified and unconjugated M13KO7 phages solution; C3 corresponds to unmodified and conjugated M13KO7 phages solution and A corresponds to modified and conjugated M13KO7 phages solutions.
After incubation, the growth medium plus phages solutions were discarded and cells were
washed 2 times with 1X PBS. Then, cells were detached with 500 µl trypsin and were gently
resuspended into 500 µl 1X PBS. Resuspended cells from each well were transferred for new tubes
and centrifuged at 300 x g at 4 °C for 5 min. Supernatants were discarded and pellets were gently
resuspended into 1 ml 1X PBS. Two extra centrifugations were made and in the last one, the pellets
were resuspended in 300 µl of 1X PBS and transferred to flow cytometry tubes. In the end, samples
were read in a flow cytometer (Beckman Coulter, Epics XLTM).
C1
Solution C2 400µl/well
Solution A 400µl/well
Solution C3 400µl/well
44
2.4.2. Evaluation of cells internalization by fluorescence microscopy
In a 12-well plate, 5 cover slips were placed, one per well, and cells were seeded at the
concentration of 1 x 10⁶/ml per well. The cells were incubated at the conditions already referred
and allowed to grow, in the cover slips, for 24 h. The growth medium was removed and the cover
slips with cells were washed 3 times with 1X PBS for 5 min. Then, 500 µl of 1X PBS with 3% bovine
serum albumin (BSA, NzyTech, MB04601) were added to the cells and these were allowed to rest
for 20 min. The solution was removed from each well and cover slips with cells were washed 3
times with 1X PBS for 5 min. Subsequently, to fix cells to the cover slips, paraformaldehyde (Sigma-
Aldrich Co., P6148) was added and cells were allowed to rest for 40 min at room temperature. In
the end, cover slips were washed one last time with 1X PBS and transferred to 35 mm dishes (one
dish per cover slip). Then, phages conjugated with Alexa Fluor 488 ester, prepared previously as
described in the section 2.4., and its controls were added to the cover slips and incubated at 37
°C for 1 h. After incubation time the cover slips were placed on glass slides and observed under
a fluorescence inverted microscope (Leica, DMI 3000B), at 60X magnification, coupled with a high-
sensitivity camera (LEICA, DFC450C) and 2 sets of filters: FITC (green filter, I3-450-490/515) and
TRITC (red filter, N2.1-BP 515-560/590). All images were acquired using the LAS 4.7 soſtware.
2.5. DOX chemical conjugation to M13KO7 phages
Doxorubicin (DOX, Applichem, A4361.0010) conjugation to M13KO7 wild type phage and
genetically modified phages was achieved by 1-(3-dimethylaminopropyl)-2-ethylcarbodiimide
hydrochloride (EDC)/N-hydroxysulfosuccinimide sodium salt 95 % (sulfo-NHS) chemistry.
Carboxylate groups (-COOH) of the major coat protein of phages react to sulfo-NHS in the presence
of a carbodiimide such as EDC, resulting in a semi-stable sulfo-NHS ester, which react with primary
amines (-NH2) of DOX forming amide crosslinks.(ThermoFisher, 2009) In a 1.5 ml Eppendorf tube,
one for each conjugation, 0.4 mg of EDC (AcrosOrg., 171440500) and 1.1 mg of sulfo-NHS
(AcrosOrg., 438650010) were weighed and M13KO7 phages, in 3X EDC activation buffer [0.3 M
4-Morpholineethanesulfonic acid monohydrate (MES, Sigma, 69892) and 1.5 M NaCl, pH 6], were
added. The compounds were mixed by inversion and the reaction was allowed to occur for 15 min
at room temperature. Then, 1.4 µl of 2-mercaptoethanol (Sigma-Aldrich Co. LLC, M6250) was
added to inactivate the EDC. DOX solubilized in 1 % ultra-pure water (UPW) was added at the
concentration of 200 µg/ml and the pH of the solution was increased above 7 by adding
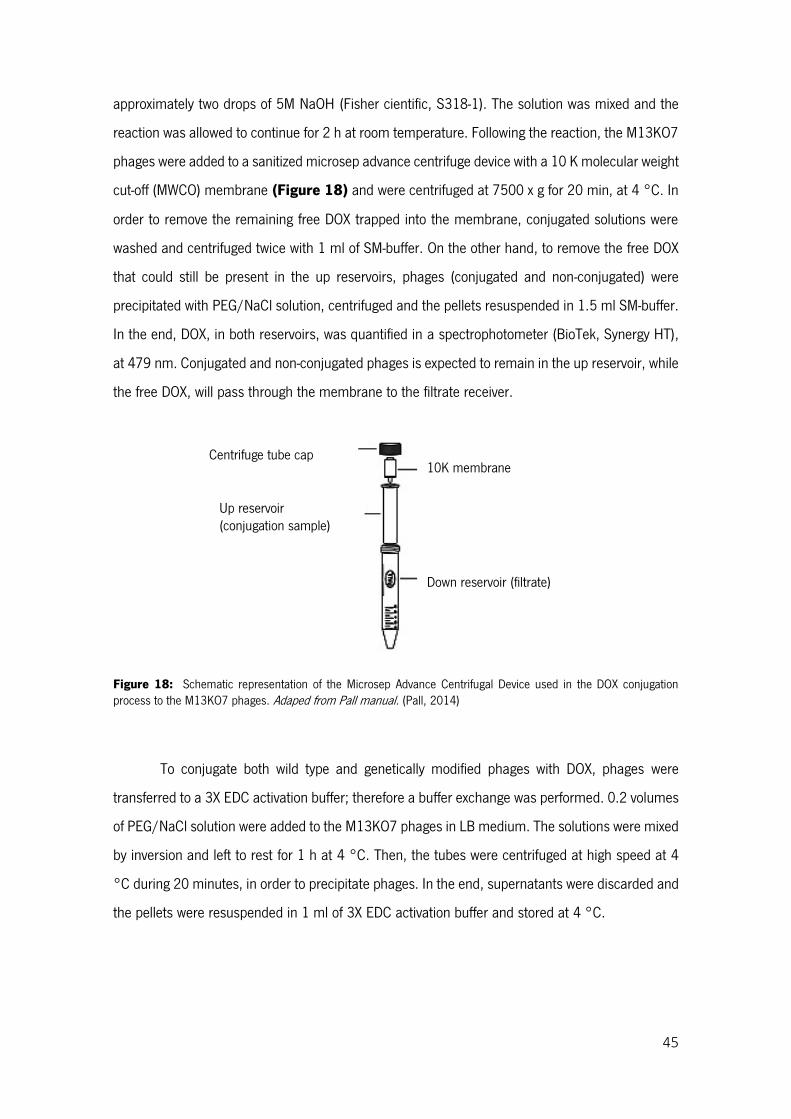
45
approximately two drops of 5M NaOH (Fisher cientific, S318-1). The solution was mixed and the
reaction was allowed to continue for 2 h at room temperature. Following the reaction, the M13KO7
phages were added to a sanitized microsep advance centrifuge device with a 10 K molecular weight
cut-off (MWCO) membrane (Figure 18) and were centrifuged at 7500 x g for 20 min, at 4 °C. In
order to remove the remaining free DOX trapped into the membrane, conjugated solutions were
washed and centrifuged twice with 1 ml of SM-buffer. On the other hand, to remove the free DOX
that could still be present in the up reservoirs, phages (conjugated and non-conjugated) were
precipitated with PEG/NaCl solution, centrifuged and the pellets resuspended in 1.5 ml SM-buffer.
In the end, DOX, in both reservoirs, was quantified in a spectrophotometer (BioTek, Synergy HT),
at 479 nm. Conjugated and non-conjugated phages is expected to remain in the up reservoir, while
the free DOX, will pass through the membrane to the filtrate receiver.
Figure 18: Schematic representation of the Microsep Advance Centrifugal Device used in the DOX conjugation process to the M13KO7 phages. Adaped from Pall manual. (Pall, 2014)
To conjugate both wild type and genetically modified phages with DOX, phages were
transferred to a 3X EDC activation buffer; therefore a buffer exchange was performed. 0.2 volumes
of PEG/NaCl solution were added to the M13KO7 phages in LB medium. The solutions were mixed
by inversion and left to rest for 1 h at 4 °C. Then, the tubes were centrifuged at high speed at 4
°C during 20 minutes, in order to precipitate phages. In the end, supernatants were discarded and
the pellets were resuspended in 1 ml of 3X EDC activation buffer and stored at 4 °C.
C
Up reservoir (conjugation sample)
Down reservoir (filtrate)
10K membrane Centrifuge tube cap
46
2.6. Cytotoxicity evaluation through Sulforhodamine B colorimetric
assay
In two 6-well plates, cells were seeded at the concentration of 1 x 10⁵/ml per well. The
trypan blue assay was used to discriminate between blue staining non-living cells and viable ones
(10 µl drop of the cell mixture plus 10 µl of trypan blue (Sigma-Aldrich Co., 93595) loaded into a
Neubauer chamber. The cells in both 6-well plates were incubated at the conditions already
referred, for 24-48 h. After the incubation time, the culture media was removed and replaced in
both plates. Next, conjugated M13KO7 wild type and modified phages were added to the cells and
three controls were used (cells without phages, cells with unconjugated M13KO7 wild type phages
and cells with DOX at the same concentration). One plate was incubated for 24 h and the other for
48 h. For each plate, in the end of the referred times of incubation, the media was discarded and
the wells were washed with approximately 2 ml 1X PBS. Next, 2ml of 1 % (v:v) acetic acid (VWR)
prepared in 10 % methanol (Fisher Scientific) was added to each well and the plates were sealed
with parafilm and placed 1.5 h at -20 °C . The acetic acid/methanol solution was removed from
the wells and the plate was allowed to completely dry at 37 °C. Next, 500 µl of 0.5 % (w:v)
sulforhodamine B (SRB, Sigma-Aldrich Co. LLC) in 1 % (v:v) acetic acid were added to each well
and the plates were covered with aluminum foil and incubated 1.5 h at 37 °C. The excess of non-
ligated SRB was discarded, the wells were washed with 1 % (v:v) acetic acid in distilled water and
then plates were, again, allowed to completely dry at 37 °C. In the end, 1 ml of 10 mM Tris-base
solution were added to the wells, and the plates, covered in foil, were stirred at room temperature
at 150 rpm to dissolve the SRB. In order to quantify the amount of cell mass the absorbance was
read at 540 nm.
47
3. Results and Discussion
As previously mentioned, the genetic manipulation of phages can be used for peptide
display, thus making phage particles a viable targeted drug delivery system (Lu & Koeris, 2011;
Molek & Bratkovič, 2015).
3.1. M13KE phage quantification
For the genetic manipulation of the M13 phage with HIV-Tat sequence, a large number of
factors must be considered, such as phage infection mechanism and its close relation with its coat
proteins (Marvin et al., 2014; Riechmann & Holliger, 1997) and bacterial host.
It is recommended that E. coli strain for M13KE manipulation contains an -
complementing gene, like E. coli JM109, in order to select transformants and then proceed to its
amplification. The LacZ gene of this bacterial strain can be complemented when infected with
M13KE phage, due to its complementary lacZ gene fragment (“Bacterial Strain JM109” 2016,
“E. coli genotypes” 2016).
In this work, M13KE filamentous phage selection, amplification and quantification was only
possible because, after infection, the bacterial hosts remain intact, which allows the formation of
blue colonies. Phage amplification occurs during the mid-log exponential growth of E. coli JM109,
as the number of phages would not be increased with longer incubation periods, because bacterial
density is so high at stationary phase that anaerobic respiration pathways are highly up-regulated
(Gallet et al., 2011; NEB, 2016; Rolfe et al., 2012).
After the first infection of E. coli JM109 strain with M13KE phages and its posterior
extraction, phages were quantified by plating serial dilutions in a LB/IPTG/X-gal plate, which was
incubated overnight at 37 °C. The dilution 10-8 was considered and 23 phage plaques were counted
(Figure 19), leading to a concentration of 2.3 x 10¹¹ PFUs/ml.
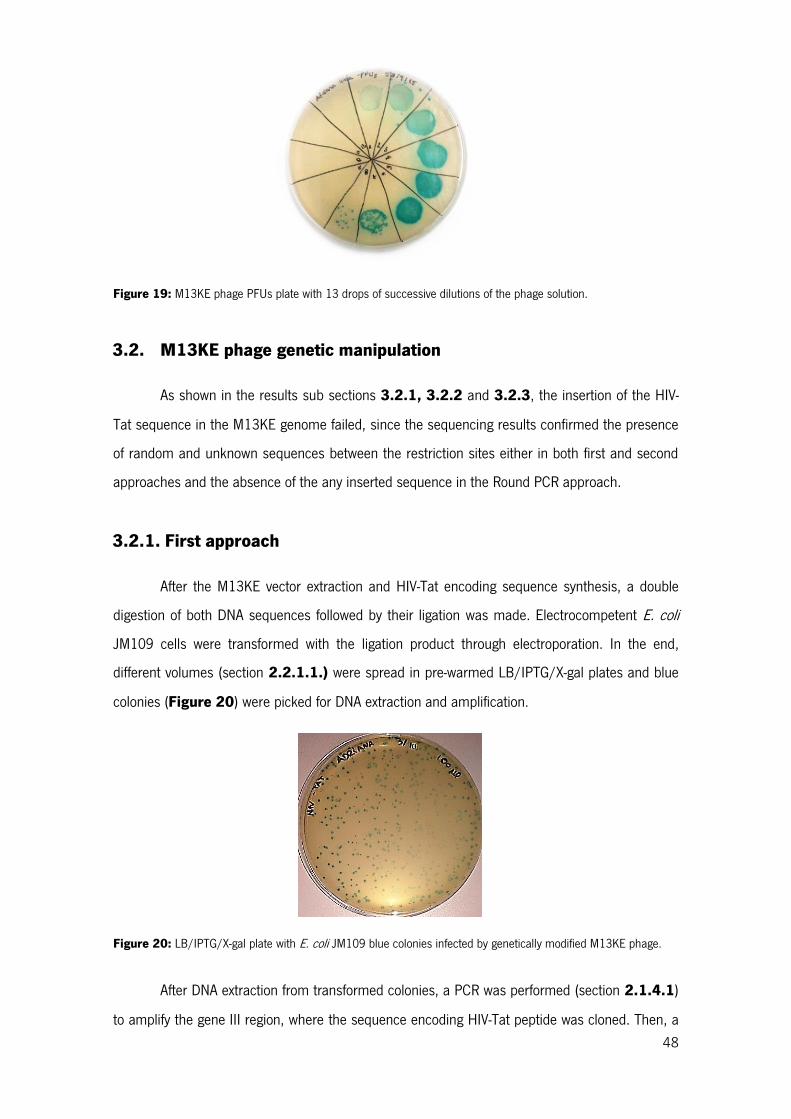
48
Figure 19: M13KE phage PFUs plate with 13 drops of successive dilutions of the phage solution.
3.2. M13KE phage genetic manipulation
As shown in the results sub sections 3.2.1, 3.2.2 and 3.2.3, the insertion of the HIV-
Tat sequence in the M13KE genome failed, since the sequencing results confirmed the presence
of random and unknown sequences between the restriction sites either in both first and second
approaches and the absence of the any inserted sequence in the Round PCR approach.
3.2.1. First approach
After the M13KE vector extraction and HIV-Tat encoding sequence synthesis, a double
digestion of both DNA sequences followed by their ligation was made. Electrocompetent E. coli
JM109 cells were transformed with the ligation product through electroporation. In the end,
different volumes (section 2.2.1.1.) were spread in pre-warmed LB/IPTG/X-gal plates and blue
colonies (Figure 20) were picked for DNA extraction and amplification.
Figure 20: LB/IPTG/X-gal plate with E. coli JM109 blue colonies infected by genetically modified M13KE phage.
After DNA extraction from transformed colonies, a PCR was performed (section 2.1.4.1)
to amplify the gene III region, where the sequence encoding HIV-Tat peptide was cloned. Then, a
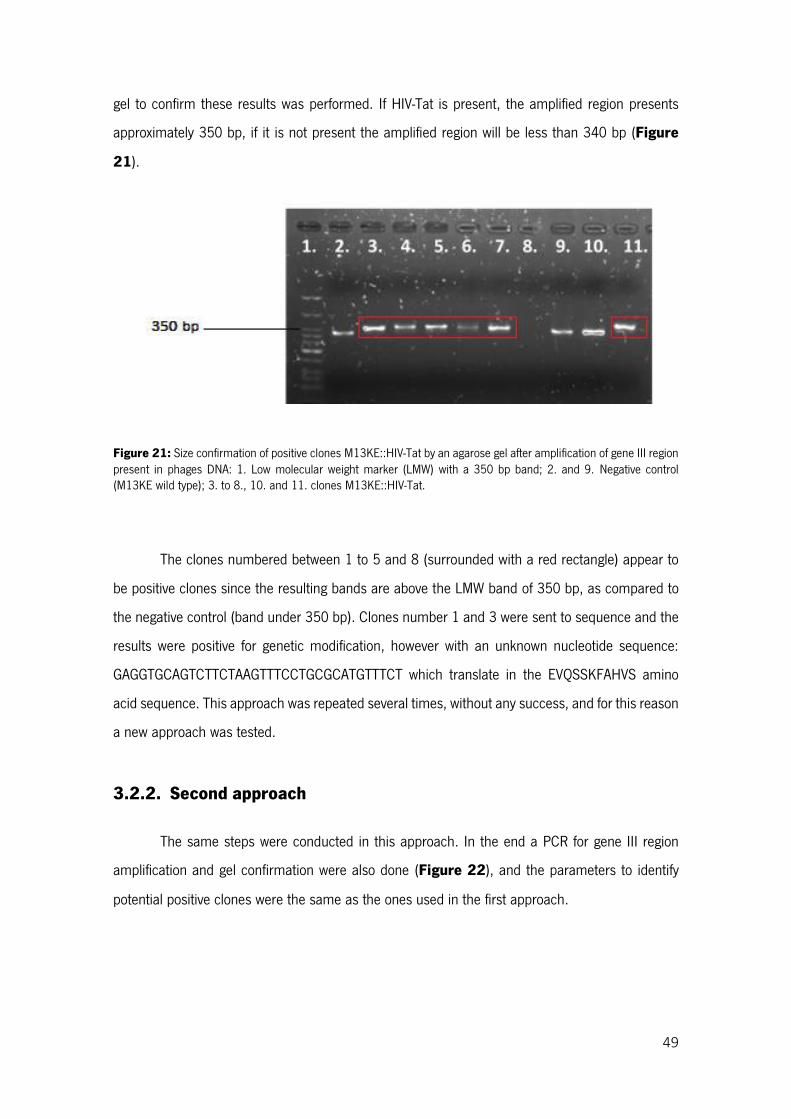
49
gel to confirm these results was performed. If HIV-Tat is present, the amplified region presents
approximately 350 bp, if it is not present the amplified region will be less than 340 bp (Figure
21).
Figure 21: Size confirmation of positive clones M13KE::HIV-Tat by an agarose gel after amplification of gene III region present in phages DNA: 1. Low molecular weight marker (LMW) with a 350 bp band; 2. and 9. Negative control (M13KE wild type); 3. to 8., 10. and 11. clones M13KE::HIV-Tat.
The clones numbered between 1 to 5 and 8 (surrounded with a red rectangle) appear to
be positive clones since the resulting bands are above the LMW band of 350 bp, as compared to
the negative control (band under 350 bp). Clones number 1 and 3 were sent to sequence and the
results were positive for genetic modification, however with an unknown nucleotide sequence:
GAGGTGCAGTCTTCTAAGTTTCCTGCGCATGTTTCT which translate in the EVQSSKFAHVS amino
acid sequence. This approach was repeated several times, without any success, and for this reason
a new approach was tested.
3.2.2. Second approach
The same steps were conducted in this approach. In the end a PCR for gene III region
amplification and gel confirmation were also done (Figure 22), and the parameters to identify
potential positive clones were the same as the ones used in the first approach.
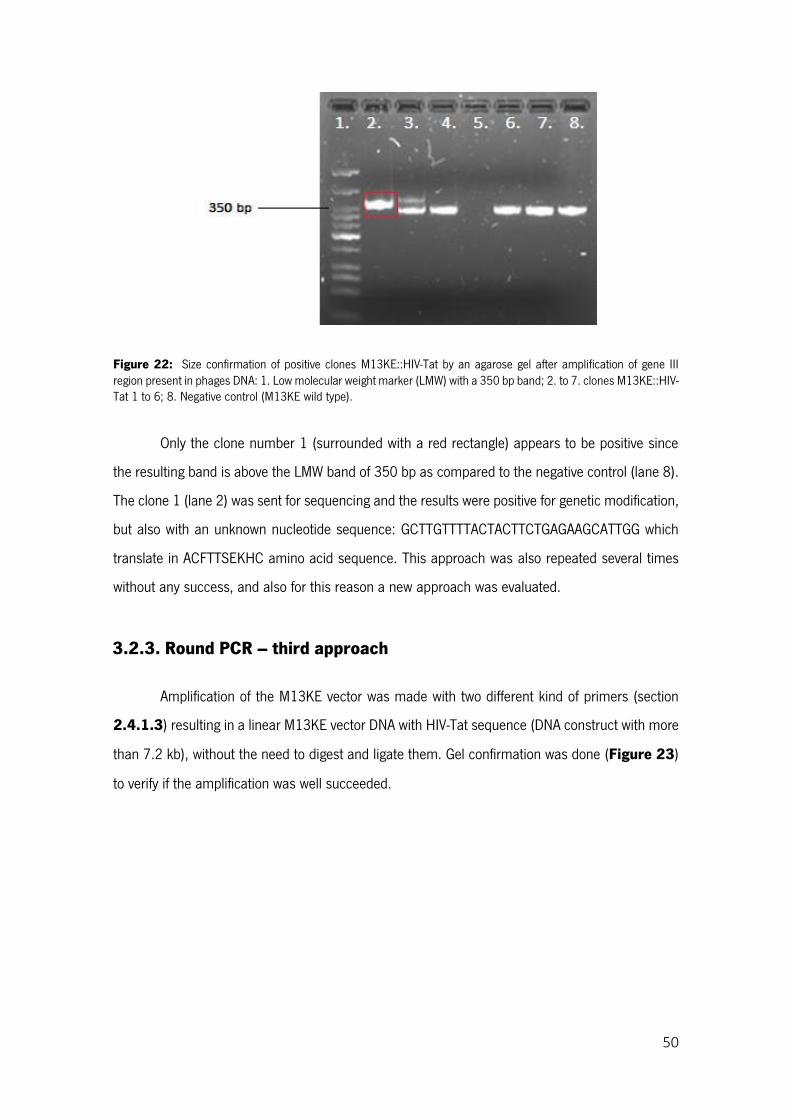
50
Figure 22: Size confirmation of positive clones M13KE::HIV-Tat by an agarose gel after amplification of gene III region present in phages DNA: 1. Low molecular weight marker (LMW) with a 350 bp band; 2. to 7. clones M13KE::HIV-Tat 1 to 6; 8. Negative control (M13KE wild type).
Only the clone number 1 (surrounded with a red rectangle) appears to be positive since
the resulting band is above the LMW band of 350 bp as compared to the negative control (lane 8).
The clone 1 (lane 2) was sent for sequencing and the results were positive for genetic modification,
but also with an unknown nucleotide sequence: GCTTGTTTTACTACTTCTGAGAAGCATTGG which
translate in ACFTTSEKHC amino acid sequence. This approach was also repeated several times
without any success, and also for this reason a new approach was evaluated.
3.2.3. Round PCR – third approach
Amplification of the M13KE vector was made with two different kind of primers (section
2.4.1.3) resulting in a linear M13KE vector DNA with HIV-Tat sequence (DNA construct with more
than 7.2 kb), without the need to digest and ligate them. Gel confirmation was done (Figure 23)
to verify if the amplification was well succeeded.
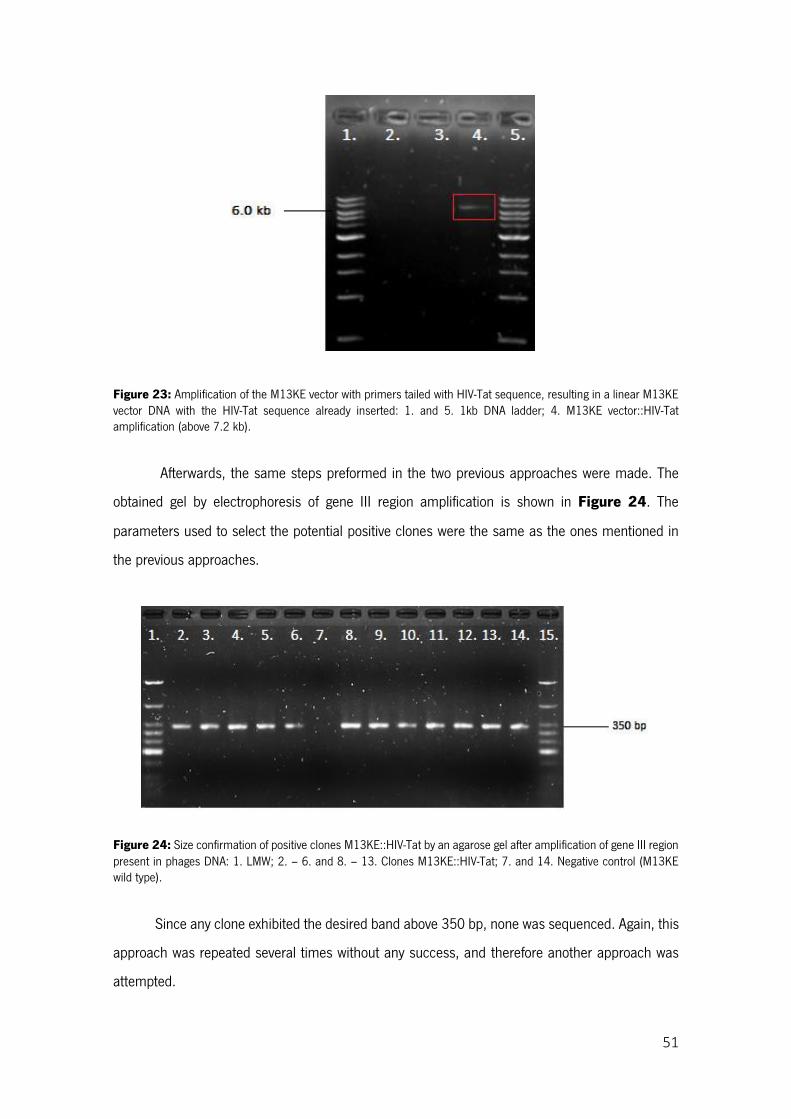
51
Figure 23: Amplification of the M13KE vector with primers tailed with HIV-Tat sequence, resulting in a linear M13KE vector DNA with the HIV-Tat sequence already inserted: 1. and 5. 1kb DNA ladder; 4. M13KE vector::HIV-Tat amplification (above 7.2 kb).
Afterwards, the same steps preformed in the two previous approaches were made. The
obtained gel by electrophoresis of gene III region amplification is shown in Figure 24. The
parameters used to select the potential positive clones were the same as the ones mentioned in
the previous approaches.
Figure 24: Size confirmation of positive clones M13KE::HIV-Tat by an agarose gel after amplification of gene III region present in phages DNA: 1. LMW; 2. – 6. and 8. – 13. Clones M13KE::HIV-Tat; 7. and 14. Negative control (M13KE wild type).
Since any clone exhibited the desired band above 350 bp, none was sequenced. Again, this
approach was repeated several times without any success, and therefore another approach was
attempted.
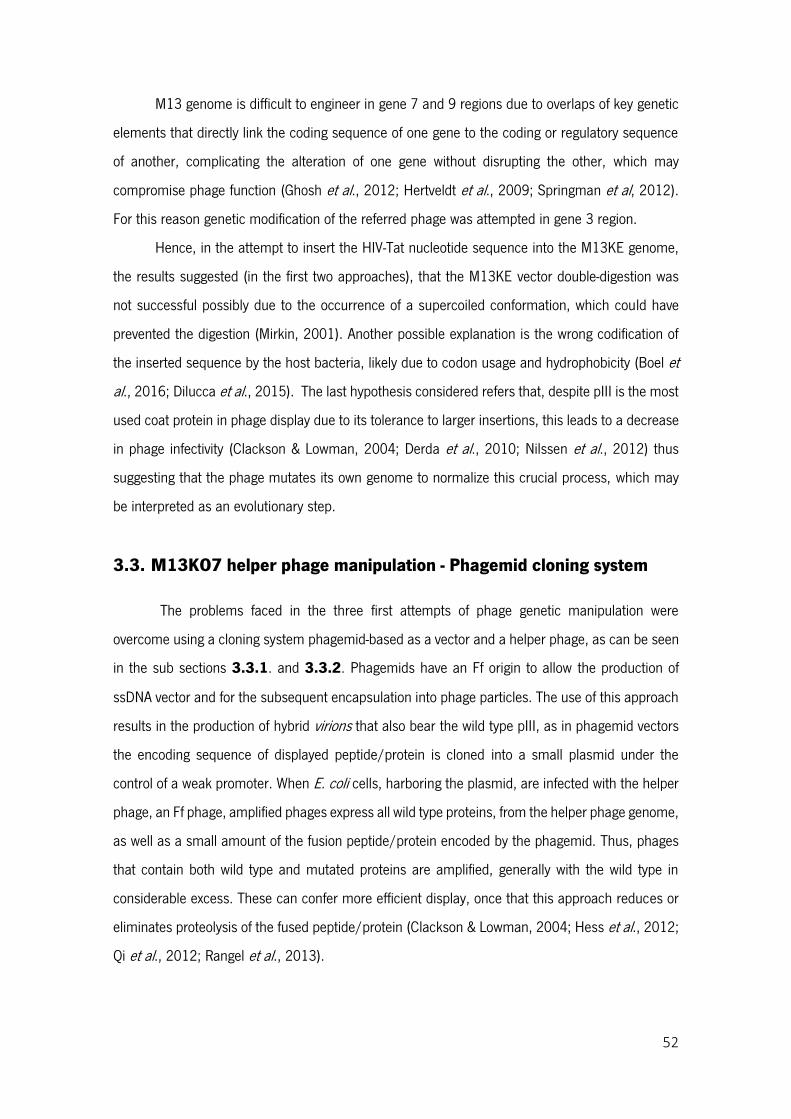
52
M13 genome is difficult to engineer in gene 7 and 9 regions due to overlaps of key genetic
elements that directly link the coding sequence of one gene to the coding or regulatory sequence
of another, complicating the alteration of one gene without disrupting the other, which may
compromise phage function (Ghosh et al., 2012; Hertveldt et al., 2009; Springman et al, 2012).
For this reason genetic modification of the referred phage was attempted in gene 3 region.
Hence, in the attempt to insert the HIV-Tat nucleotide sequence into the M13KE genome,
the results suggested (in the first two approaches), that the M13KE vector double-digestion was
not successful possibly due to the occurrence of a supercoiled conformation, which could have
prevented the digestion (Mirkin, 2001). Another possible explanation is the wrong codification of
the inserted sequence by the host bacteria, likely due to codon usage and hydrophobicity (Boel et
al., 2016; Dilucca et al., 2015). The last hypothesis considered refers that, despite pIII is the most
used coat protein in phage display due to its tolerance to larger insertions, this leads to a decrease
in phage infectivity (Clackson & Lowman, 2004; Derda et al., 2010; Nilssen et al., 2012) thus
suggesting that the phage mutates its own genome to normalize this crucial process, which may
be interpreted as an evolutionary step.
3.3. M13KO7 helper phage manipulation - Phagemid cloning system
The problems faced in the three first attempts of phage genetic manipulation were
overcome using a cloning system phagemid-based as a vector and a helper phage, as can be seen
in the sub sections 3.3.1. and 3.3.2. Phagemids have an Ff origin to allow the production of
ssDNA vector and for the subsequent encapsulation into phage particles. The use of this approach
results in the production of hybrid virions that also bear the wild type pIII, as in phagemid vectors
the encoding sequence of displayed peptide/protein is cloned into a small plasmid under the
control of a weak promoter. When E. coli cells, harboring the plasmid, are infected with the helper
phage, an Ff phage, amplified phages express all wild type proteins, from the helper phage genome,
as well as a small amount of the fusion peptide/protein encoded by the phagemid. Thus, phages
that contain both wild type and mutated proteins are amplified, generally with the wild type in
considerable excess. These can confer more efficient display, once that this approach reduces or
eliminates proteolysis of the fused peptide/protein (Clackson & Lowman, 2004; Hess et al., 2012;
Qi et al., 2012; Rangel et al., 2013).
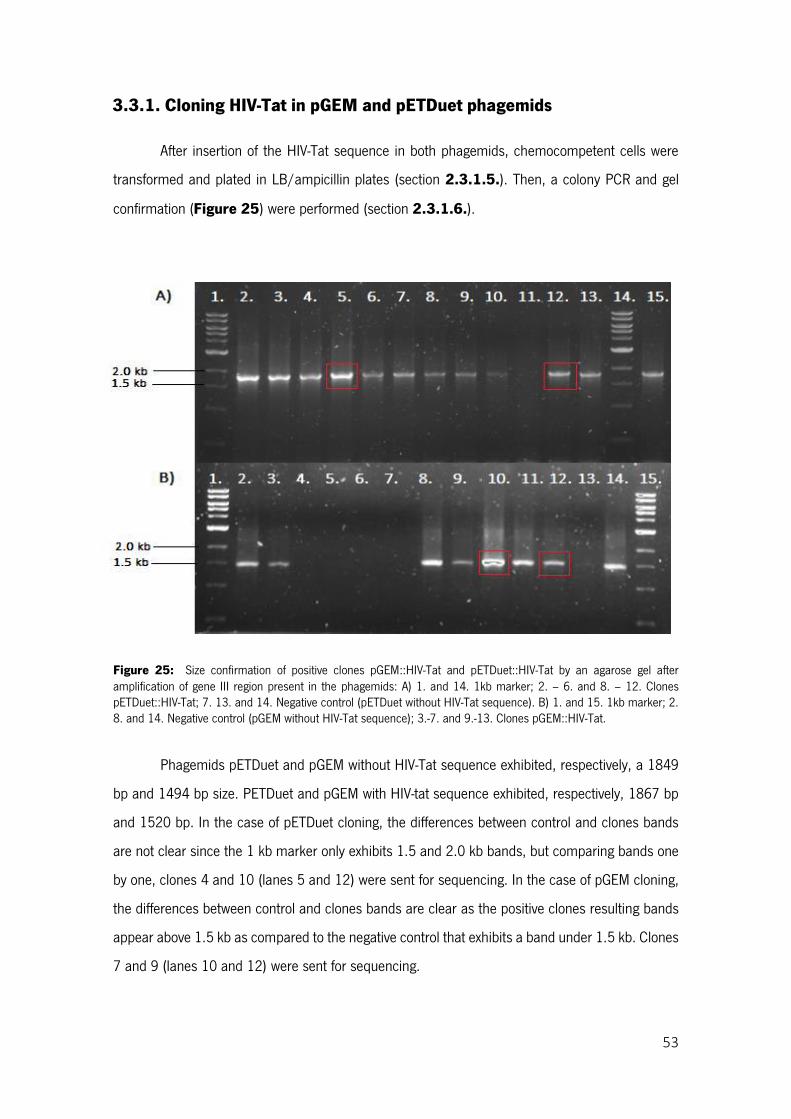
53
3.3.1. Cloning HIV-Tat in pGEM and pETDuet phagemids
After insertion of the HIV-Tat sequence in both phagemids, chemocompetent cells were
transformed and plated in LB/ampicillin plates (section 2.3.1.5.). Then, a colony PCR and gel
confirmation (Figure 25) were performed (section 2.3.1.6.).
Figure 25: Size confirmation of positive clones pGEM::HIV-Tat and pETDuet::HIV-Tat by an agarose gel after amplification of gene III region present in the phagemids: A) 1. and 14. 1kb marker; 2. – 6. and 8. – 12. Clones pETDuet::HIV-Tat; 7. 13. and 14. Negative control (pETDuet without HIV-Tat sequence). B) 1. and 15. 1kb marker; 2. 8. and 14. Negative control (pGEM without HIV-Tat sequence); 3.-7. and 9.-13. Clones pGEM::HIV-Tat.
Phagemids pETDuet and pGEM without HIV-Tat sequence exhibited, respectively, a 1849
bp and 1494 bp size. PETDuet and pGEM with HIV-tat sequence exhibited, respectively, 1867 bp
and 1520 bp. In the case of pETDuet cloning, the differences between control and clones bands
are not clear since the 1 kb marker only exhibits 1.5 and 2.0 kb bands, but comparing bands one
by one, clones 4 and 10 (lanes 5 and 12) were sent for sequencing. In the case of pGEM cloning,
the differences between control and clones bands are clear as the positive clones resulting bands
appear above 1.5 kb as compared to the negative control that exhibits a band under 1.5 kb. Clones
7 and 9 (lanes 10 and 12) were sent for sequencing.
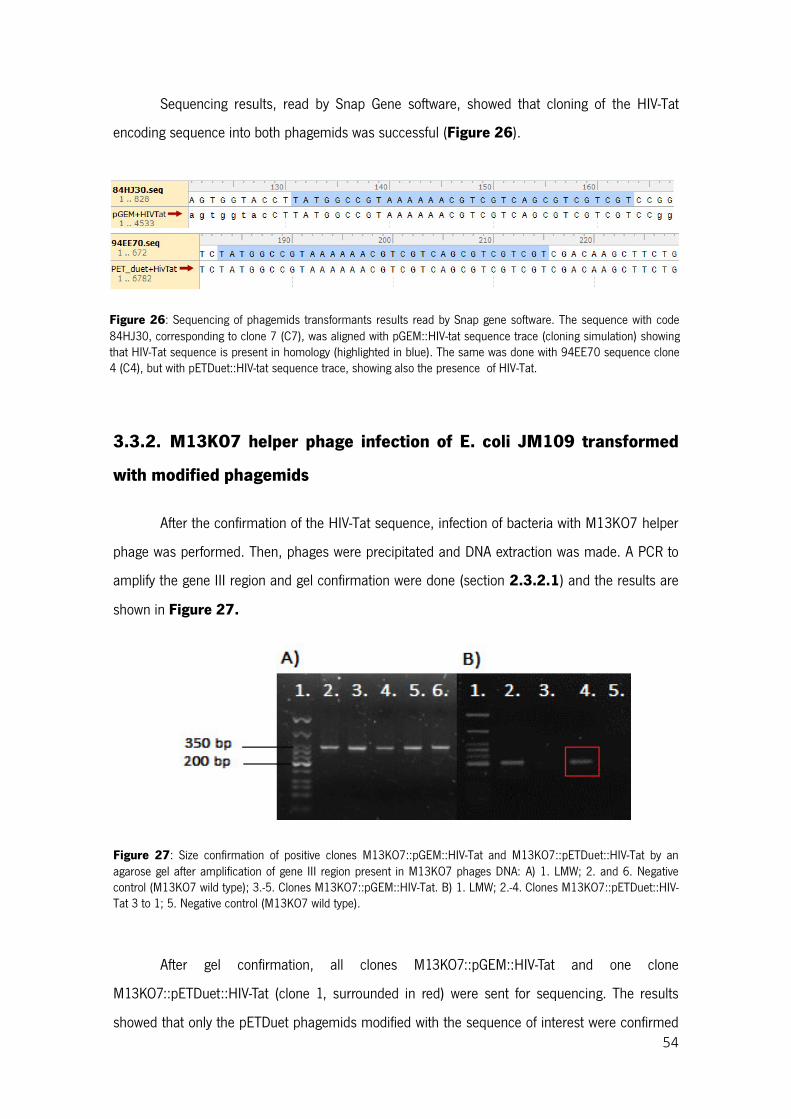
54
Sequencing results, read by Snap Gene software, showed that cloning of the HIV-Tat
encoding sequence into both phagemids was successful (Figure 26).
Figure 26: Sequencing of phagemids transformants results read by Snap gene software. The sequence with code
3.3.2. M13KO7 helper phage infection of E. coli JM109 transformed
with modified phagemids
After the confirmation of the HIV-Tat sequence, infection of bacteria with M13KO7 helper
phage was performed. Then, phages were precipitated and DNA extraction was made. A PCR to
amplify the gene III region and gel confirmation were done (section 2.3.2.1) and the results are
shown in Figure 27.
Figure 27: Size confirmation of positive clones M13KO7::pGEM::HIV-Tat and M13KO7::pETDuet::HIV-Tat by an agarose gel after amplification of gene III region present in M13KO7 phages DNA: A) 1. LMW; 2. and 6. Negative control (M13KO7 wild type); 3.-5. Clones M13KO7::pGEM::HIV-Tat. B) 1. LMW; 2.-4. Clones M13KO7::pETDuet::HIV-Tat 3 to 1; 5. Negative control (M13KO7 wild type).
After gel confirmation, all clones M13KO7::pGEM::HIV-Tat and one clone
M13KO7::pETDuet::HIV-Tat (clone 1, surrounded in red) were sent for sequencing. The results
showed that only the pETDuet phagemids modified with the sequence of interest were confirmed
Figure 26: Sequencing of phagemids transformants results read by Snap gene software. The sequence with code 84HJ30, corresponding to clone 7 (C7), was aligned with pGEM::HIV-tat sequence trace (cloning simulation) showing that HIV-Tat sequence is present in homology (highlighted in blue). The same was done with 94EE70 sequence clone 4 (C4), but with pETDuet::HIV-tat sequence trace, showing also the presence of HIV-Tat.
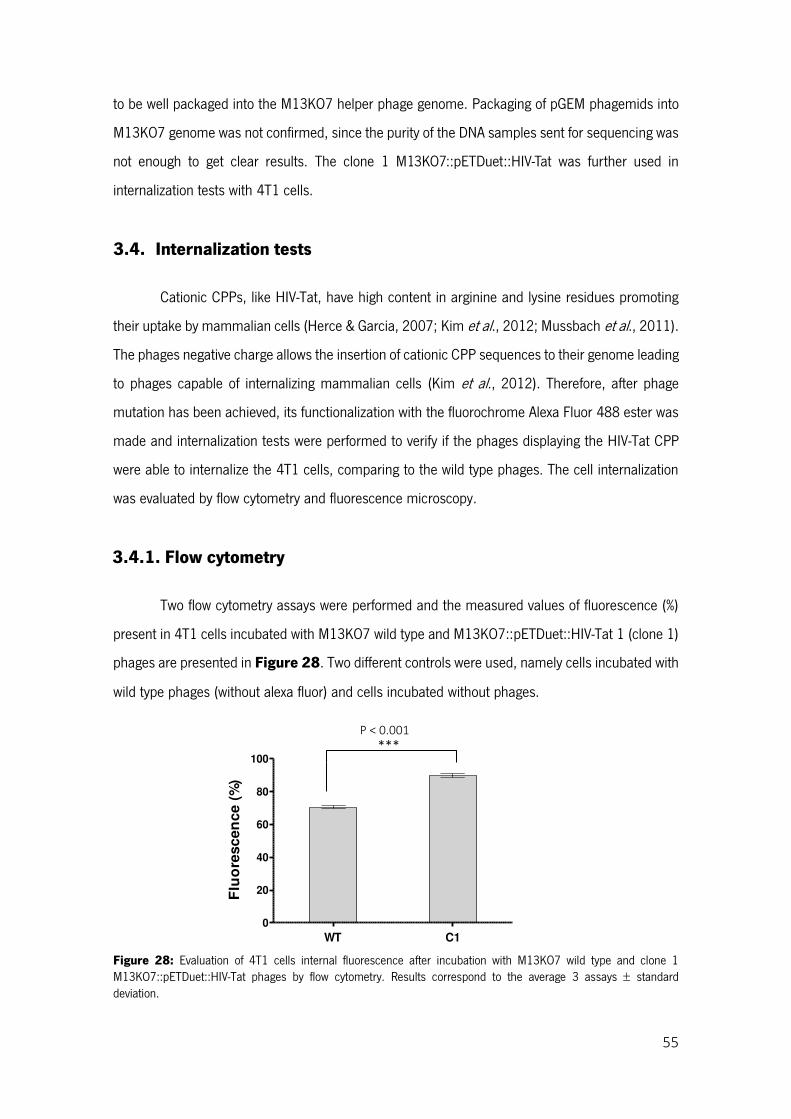
55
to be well packaged into the M13KO7 helper phage genome. Packaging of pGEM phagemids into
M13KO7 genome was not confirmed, since the purity of the DNA samples sent for sequencing was
not enough to get clear results. The clone 1 M13KO7::pETDuet::HIV-Tat was further used in
internalization tests with 4T1 cells.
3.4. Internalization tests
Cationic CPPs, like HIV-Tat, have high content in arginine and lysine residues promoting
their uptake by mammalian cells (Herce & Garcia, 2007; Kim et al., 2012; Mussbach et al., 2011).
The phages negative charge allows the insertion of cationic CPP sequences to their genome leading
to phages capable of internalizing mammalian cells (Kim et al., 2012). Therefore, after phage
mutation has been achieved, its functionalization with the fluorochrome Alexa Fluor 488 ester was
made and internalization tests were performed to verify if the phages displaying the HIV-Tat CPP
were able to internalize the 4T1 cells, comparing to the wild type phages. The cell internalization
was evaluated by flow cytometry and fluorescence microscopy.
3.4.1. Flow cytometry
Two flow cytometry assays were performed and the measured values of fluorescence (%)
present in 4T1 cells incubated with M13KO7 wild type and M13KO7::pETDuet::HIV-Tat 1 (clone 1)
phages are presented in Figure 28. Two different controls were used, namely cells incubated with
wild type phages (without alexa fluor) and cells incubated without phages.
Figure 28: Evaluation of 4T1 cells internal fluorescence after incubation with M13KO7 wild type and clone 1 M13KO7::pETDuet::HIV-Tat phages by flow cytometry. Results correspond to the average 3 assays standard deviation.
0
20
40
60
80
100
WT C1
Flu
ore
scen
ce (
%)
*** P < 0.001
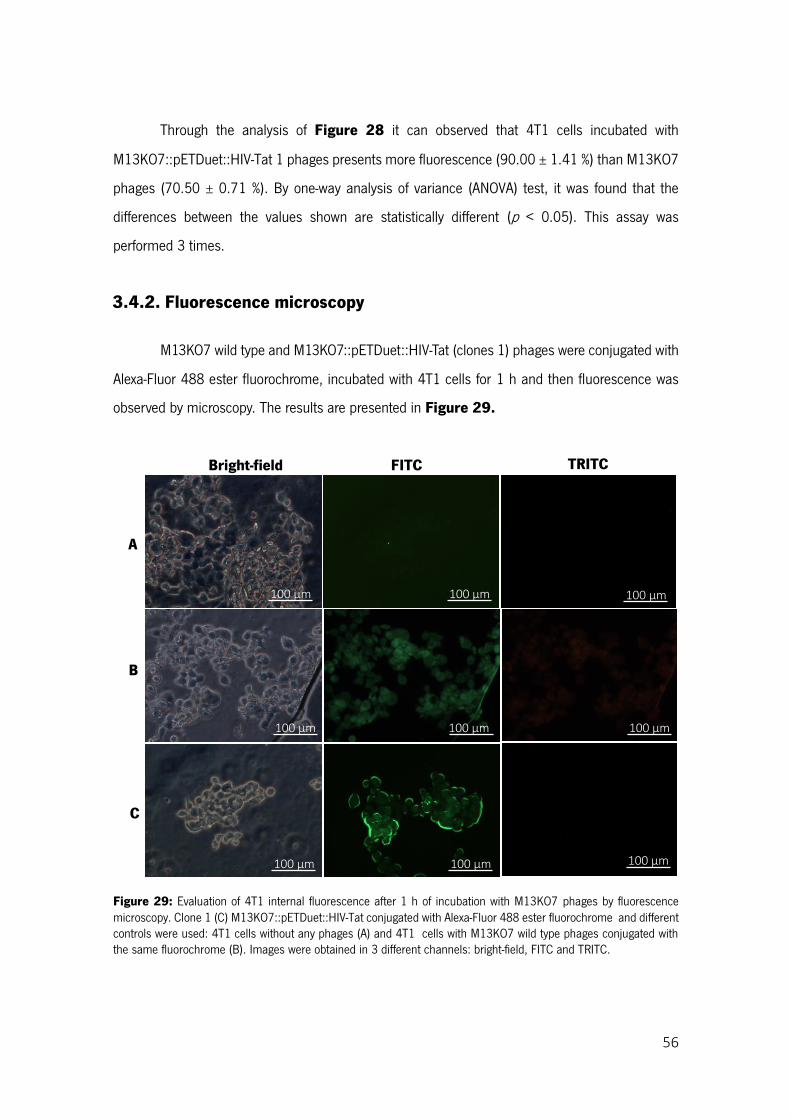
56
Through the analysis of Figure 28 it can observed that 4T1 cells incubated with
M13KO7::pETDuet::HIV-Tat 1 phages presents more fluorescence (90.00 ± 1.41 %) than M13KO7
phages (70.50 ± 0.71 %). By one-way analysis of variance (ANOVA) test, it was found that the
differences between the values shown are statistically different (p < 0.05). This assay was
performed 3 times.
3.4.2. Fluorescence microscopy
M13KO7 wild type and M13KO7::pETDuet::HIV-Tat (clones 1) phages were conjugated with
Alexa-Fluor 488 ester fluorochrome, incubated with 4T1 cells for 1 h and then fluorescence was
observed by microscopy. The results are presented in Figure 29.
Figure 29: Evaluation of 4T1 internal fluorescence after 1 h of incubation with M13KO7 phages by fluorescence microscopy. Clone 1 (C) M13KO7::pETDuet::HIV-Tat conjugated with Alexa-Fluor 488 ester fluorochrome and different controls were used: 4T1 cells without any phages (A) and 4T1 cells with M13KO7 wild type phages conjugated with the same fluorochrome (B). Images were obtained in 3 different channels: bright-field, FITC and TRITC.
A
B
C
100 µm 100 µm 100 µm
100 µm 100 µm 100 µm
100 µm 100 µm 100 µm
Bright-field FITC TRITC
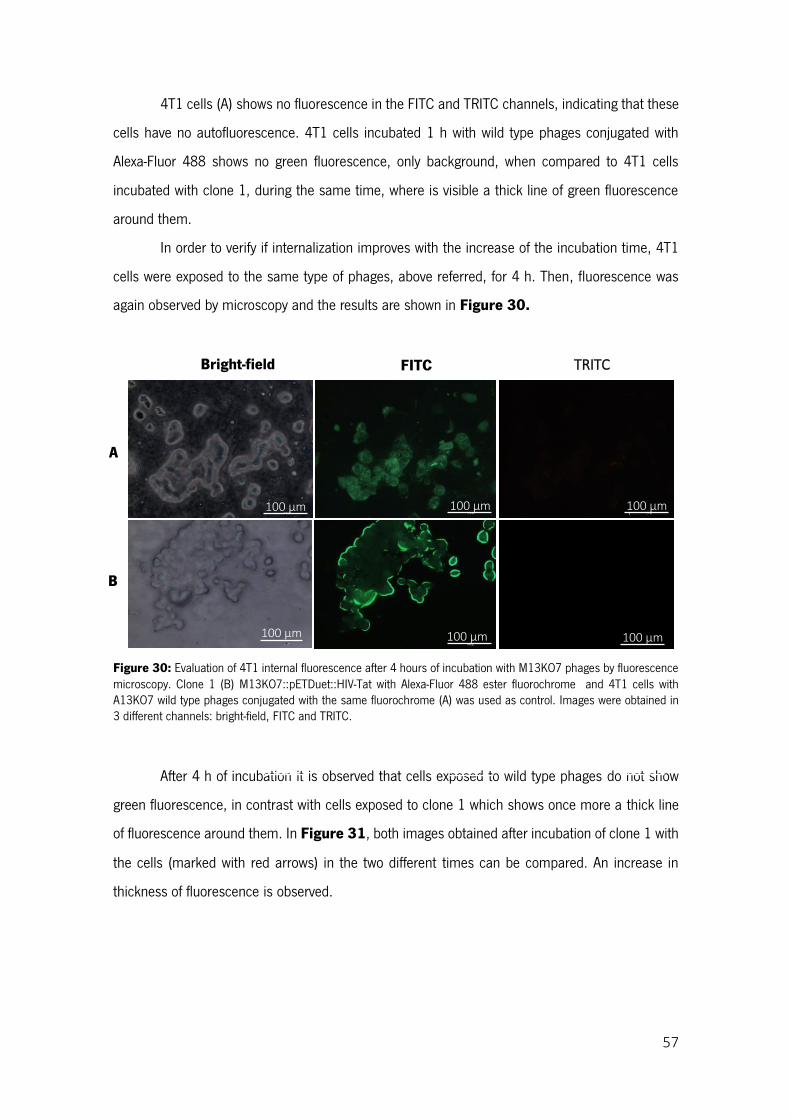
57
4T1 cells (A) shows no fluorescence in the FITC and TRITC channels, indicating that these
cells have no autofluorescence. 4T1 cells incubated 1 h with wild type phages conjugated with
Alexa-Fluor 488 shows no green fluorescence, only background, when compared to 4T1 cells
incubated with clone 1, during the same time, where is visible a thick line of green fluorescence
around them.
In order to verify if internalization improves with the increase of the incubation time, 4T1
cells were exposed to the same type of phages, above referred, for 4 h. Then, fluorescence was
again observed by microscopy and the results are shown in Figure 30.
Figure 30: Evaluation of 4T1 internal fluorescence after 4 hours of incubation with M13KO7 phages by fluorescence microscopy. Clone 1 (B) M13KO7::pETDuet::HIV-Tat with Alexa-Fluor 488 ester fluorochrome and 4T1 cells with A13KO7 wild type phages conjugated with the same fluorochrome (A) was used as control. Images were obtained in 3 different channels: bright-field, FITC and TRITC.
After 4 h of incubation it is observed that cells exposed to wild type phages do not show
green fluorescence, in contrast with cells exposed to clone 1 which shows once more a thick line
of fluorescence around them. In Figure 31, both images obtained after incubation of clone 1 with
the cells (marked with red arrows) in the two different times can be compared. An increase in
thickness of fluorescence is observed.
100 µm 100 µm
100 µm 100 µm
A
100 µm
100 µm
B
Bright-field FITC TRITC
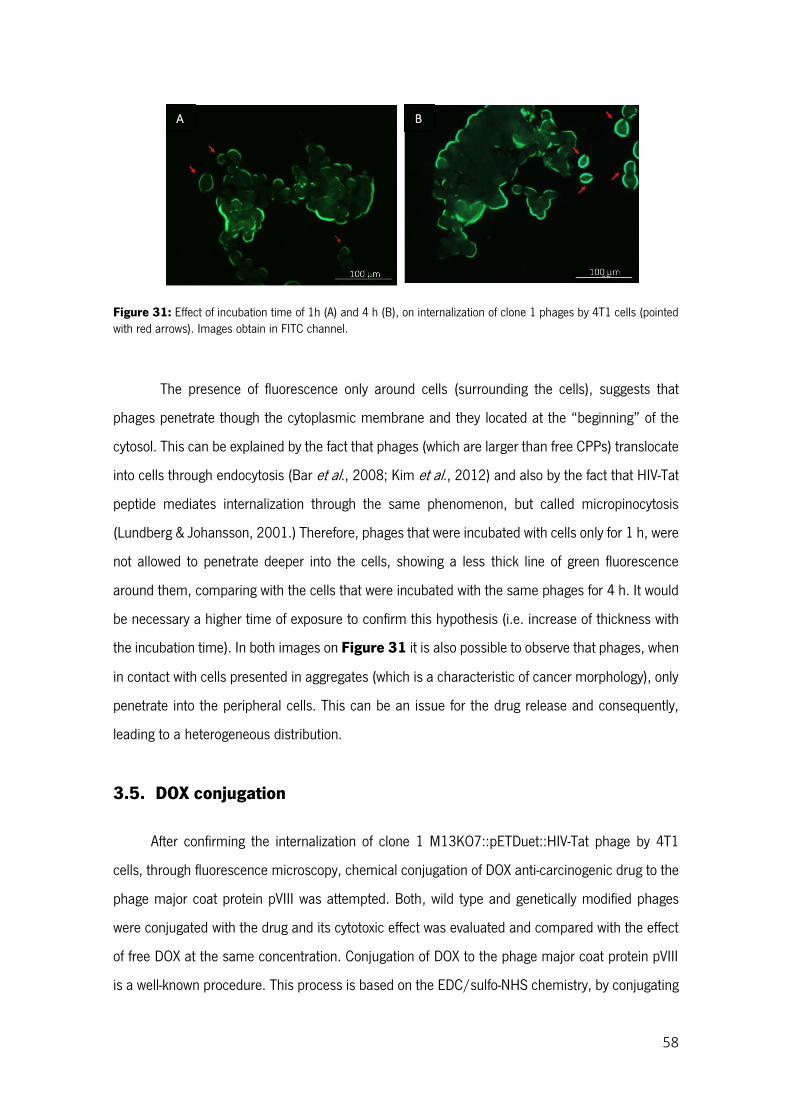
58
Figure 31: Effect of incubation time of 1h (A) and 4 h (B), on internalization of clone 1 phages by 4T1 cells (pointed with red arrows). Images obtain in FITC channel.
The presence of fluorescence only around cells (surrounding the cells), suggests that
phages penetrate though the cytoplasmic membrane and they located at the “beginning” of the
cytosol. This can be explained by the fact that phages (which are larger than free CPPs) translocate
into cells through endocytosis (Bar et al., 2008; Kim et al., 2012) and also by the fact that HIV-Tat
peptide mediates internalization through the same phenomenon, but called micropinocytosis
(Lundberg & Johansson, 2001.) Therefore, phages that were incubated with cells only for 1 h, were
not allowed to penetrate deeper into the cells, showing a less thick line of green fluorescence
around them, comparing with the cells that were incubated with the same phages for 4 h. It would
be necessary a higher time of exposure to confirm this hypothesis (i.e. increase of thickness with
the incubation time). In both images on Figure 31 it is also possible to observe that phages, when
in contact with cells presented in aggregates (which is a characteristic of cancer morphology), only
penetrate into the peripheral cells. This can be an issue for the drug release and consequently,
leading to a heterogeneous distribution.
3.5. DOX conjugation
After confirming the internalization of clone 1 M13KO7::pETDuet::HIV-Tat phage by 4T1
cells, through fluorescence microscopy, chemical conjugation of DOX anti-carcinogenic drug to the
phage major coat protein pVIII was attempted. Both, wild type and genetically modified phages
were conjugated with the drug and its cytotoxic effect was evaluated and compared with the effect
of free DOX at the same concentration. Conjugation of DOX to the phage major coat protein pVIII
is a well-known procedure. This process is based on the EDC/sulfo-NHS chemistry, by conjugating
A B
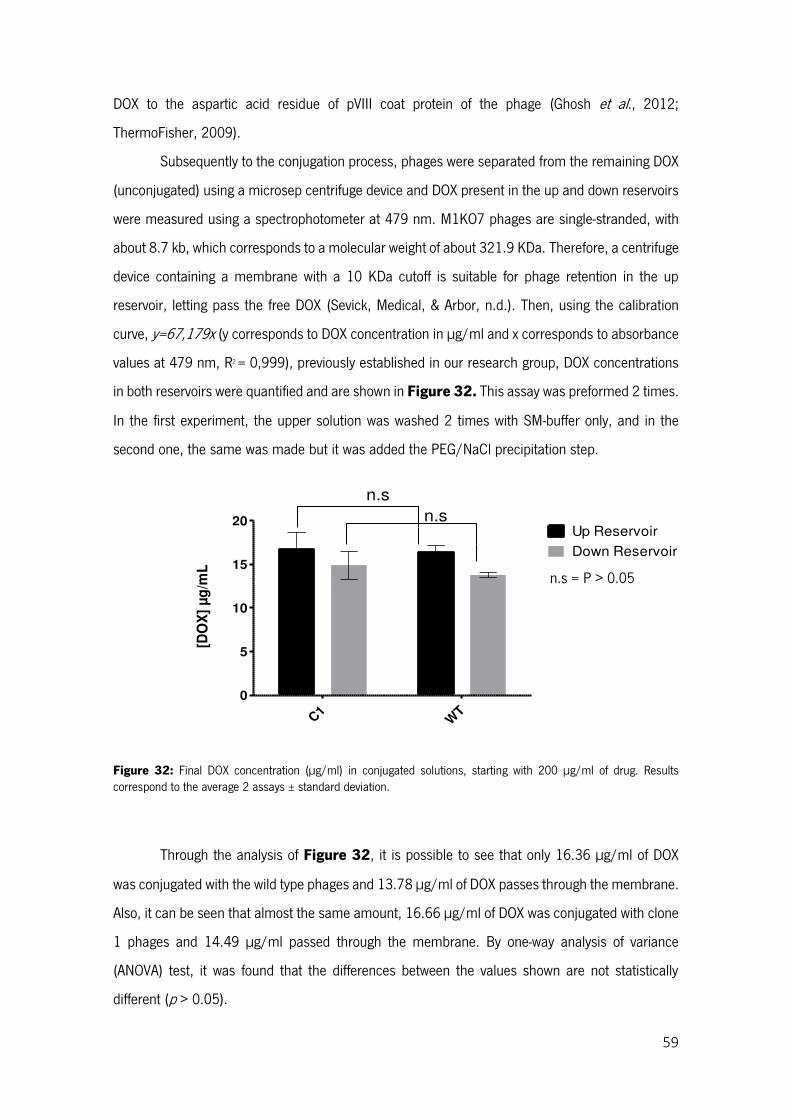
59
DOX to the aspartic acid residue of pVIII coat protein of the phage (Ghosh et al., 2012;
ThermoFisher, 2009).
Subsequently to the conjugation process, phages were separated from the remaining DOX
(unconjugated) using a microsep centrifuge device and DOX present in the up and down reservoirs
were measured using a spectrophotometer at 479 nm. M1KO7 phages are single-stranded, with
about 8.7 kb, which corresponds to a molecular weight of about 321.9 KDa. Therefore, a centrifuge
device containing a membrane with a 10 KDa cutoff is suitable for phage retention in the up
reservoir, letting pass the free DOX (Sevick, Medical, & Arbor, n.d.). Then, using the calibration
curve, y=67,179x (y corresponds to DOX concentration in µg/ml and x corresponds to absorbance
values at 479 nm, R2 = 0,999), previously established in our research group, DOX concentrations
in both reservoirs were quantified and are shown in Figure 32. This assay was preformed 2 times.
In the first experiment, the upper solution was washed 2 times with SM-buffer only, and in the
second one, the same was made but it was added the PEG/NaCl precipitation step.
Figure 32: Final DOX concentration (µg/ml) in conjugated solutions, starting with 200 µg/ml of drug. Results correspond to the average 2 assays ± standard deviation.
Through the analysis of Figure 32, it is possible to see that only 16.36 µg/ml of DOX
was conjugated with the wild type phages and 13.78 µg/ml of DOX passes through the membrane.
Also, it can be seen that almost the same amount, 16.66 µg/ml of DOX was conjugated with clone
1 phages and 14.49 µg/ml passed through the membrane. By one-way analysis of variance
(ANOVA) test, it was found that the differences between the values shown are not statistically
different (p > 0.05).
C1
WT
0
5
10
15
20Up Reservoir
Down Reservoir
n.s
n.s
[DO
X]
µg
/mL
n.s = P > 0.05
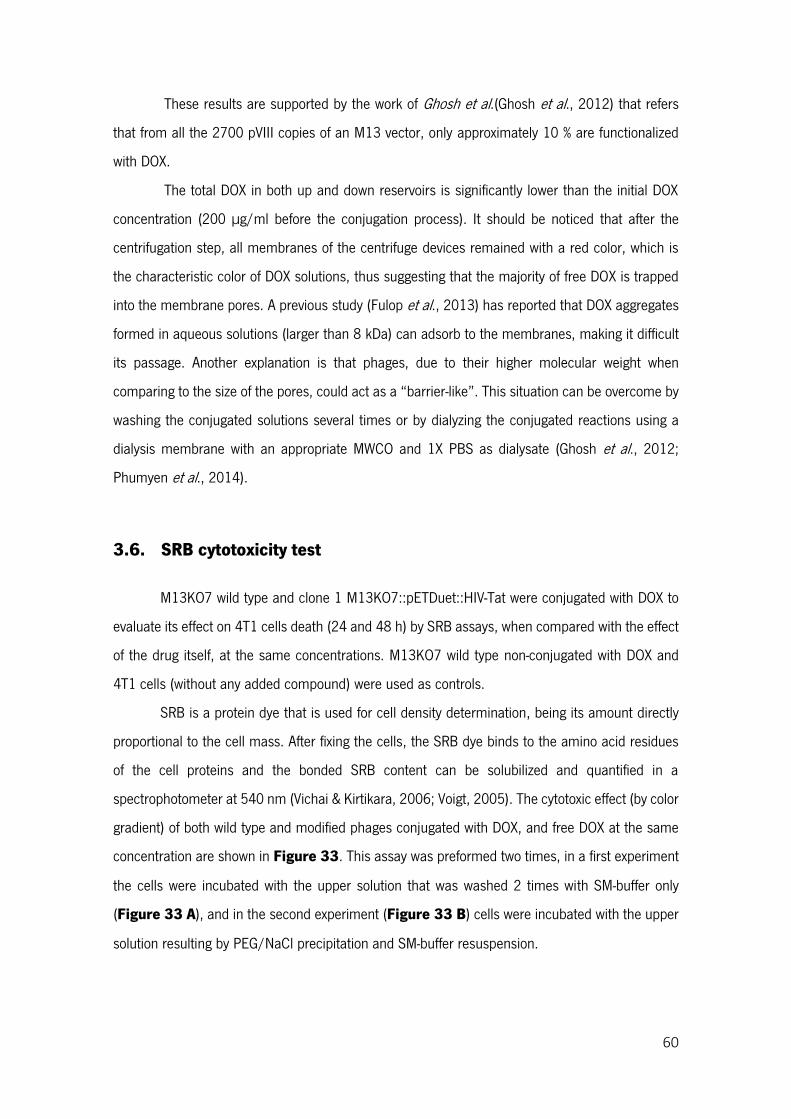
60
These results are supported by the work of Ghosh et al.(Ghosh et al., 2012) that refers
that from all the 2700 pVIII copies of an M13 vector, only approximately 10 % are functionalized
with DOX.
The total DOX in both up and down reservoirs is significantly lower than the initial DOX
concentration (200 µg/ml before the conjugation process). It should be noticed that after the
centrifugation step, all membranes of the centrifuge devices remained with a red color, which is
the characteristic color of DOX solutions, thus suggesting that the majority of free DOX is trapped
into the membrane pores. A previous study (Fulop et al., 2013) has reported that DOX aggregates
formed in aqueous solutions (larger than 8 kDa) can adsorb to the membranes, making it difficult
its passage. Another explanation is that phages, due to their higher molecular weight when
comparing to the size of the pores, could act as a “barrier-like”. This situation can be overcome by
washing the conjugated solutions several times or by dialyzing the conjugated reactions using a
dialysis membrane with an appropriate MWCO and 1X PBS as dialysate (Ghosh et al., 2012;
Phumyen et al., 2014).
3.6. SRB cytotoxicity test
M13KO7 wild type and clone 1 M13KO7::pETDuet::HIV-Tat were conjugated with DOX to
evaluate its effect on 4T1 cells death (24 and 48 h) by SRB assays, when compared with the effect
of the drug itself, at the same concentrations. M13KO7 wild type non-conjugated with DOX and
4T1 cells (without any added compound) were used as controls.
SRB is a protein dye that is used for cell density determination, being its amount directly
proportional to the cell mass. After fixing the cells, the SRB dye binds to the amino acid residues
of the cell proteins and the bonded SRB content can be solubilized and quantified in a
spectrophotometer at 540 nm (Vichai & Kirtikara, 2006; Voigt, 2005). The cytotoxic effect (by color
gradient) of both wild type and modified phages conjugated with DOX, and free DOX at the same
concentration are shown in Figure 33. This assay was preformed two times, in a first experiment
the cells were incubated with the upper solution that was washed 2 times with SM-buffer only
(Figure 33 A), and in the second experiment (Figure 33 B) cells were incubated with the upper
solution resulting by PEG/NaCl precipitation and SM-buffer resuspension.
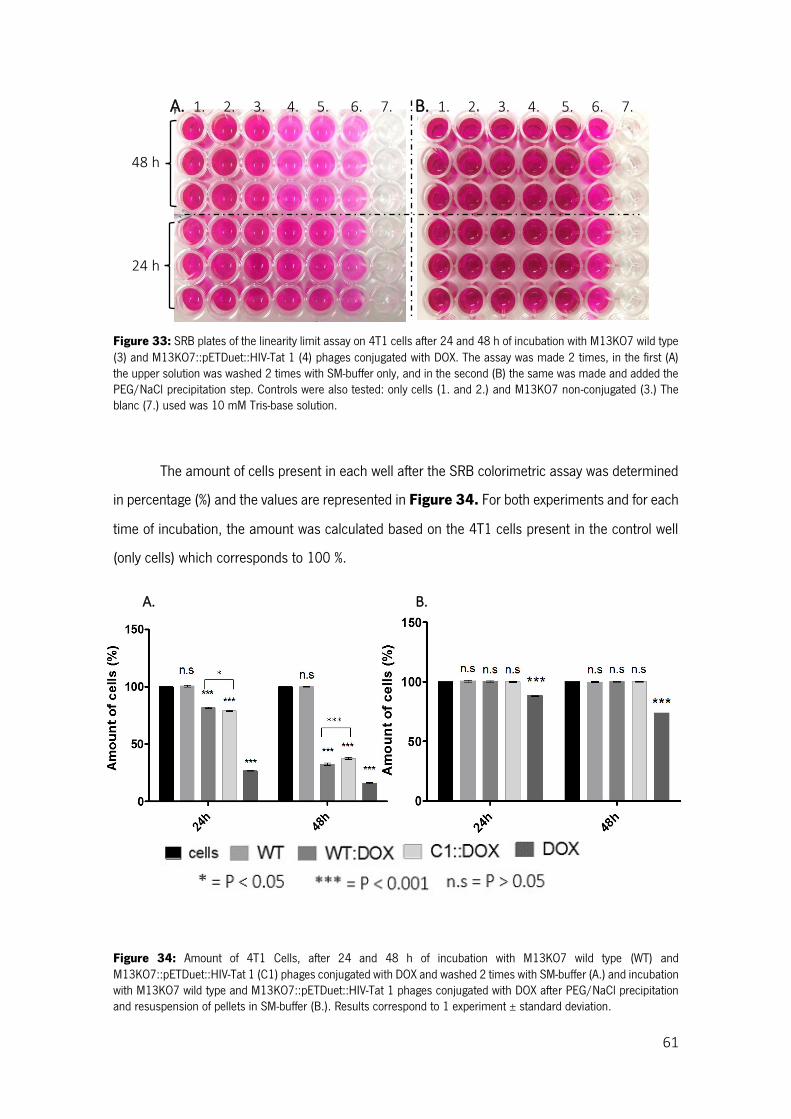
61
Figure 33: SRB plates of the linearity limit assay on 4T1 cells after 24 and 48 h of incubation with M13KO7 wild type (3) and M13KO7::pETDuet::HIV-Tat 1 (4) phages conjugated with DOX. The assay was made 2 times, in the first (A) the upper solution was washed 2 times with SM-buffer only, and in the second (B) the same was made and added the PEG/NaCl precipitation step. Controls were also tested: only cells (1. and 2.) and M13KO7 non-conjugated (3.) The blanc (7.) used was 10 mM Tris-base solution.
The amount of cells present in each well after the SRB colorimetric assay was determined
in percentage (%) and the values are represented in Figure 34. For both experiments and for each
time of incubation, the amount was calculated based on the 4T1 cells present in the control well
(only cells) which corresponds to 100 %.
Figure 34: Amount of 4T1 Cells, after 24 and 48 h of incubation with M13KO7 wild type (WT) and M13KO7::pETDuet::HIV-Tat 1 (C1) phages conjugated with DOX and washed 2 times with SM-buffer (A.) and incubation with M13KO7 wild type and M13KO7::pETDuet::HIV-Tat 1 phages conjugated with DOX after PEG/NaCl precipitation and resuspension of pellets in SM-buffer (B.). Results correspond to 1 experiment ± standard deviation.
A. 1. 2. 3. 4. 5. 6. 7. B. 1. 2. 3. 4. 5. 6. 7.
48 h
24 h
A. B.
62
It appears that the amount of cells incubated with conjugated non-precipitated DOX-
conjugated phages (WT::DOX A. and C1::DOX A.) decreases with time, comparing to the amount
of cells incubated with non-conjugated wild type phages (WT A.), which presents approximately
100 % of cells when compared with the control (cells A.). After 24 h, it can be seen a reduction in
the cells amount to approximately 82 % and 79 % and after 48 h to approximately 32 % and 38 %,
respectively. Free DOX (DOX A.) exhibits the higher cytotoxic effect reducing the amount of cells to
27 % and 16 % after 24 h and 48 h of incubation, respectively. By one-way analysis of variance
(ANOVA) test, it was found that the differences between the values of controls, in both assays, (cells
A./B. and WT A./B.) are not statistically different (p < 0.05) and between conjugated solutions
(WT::DOX A./B. and C1::DOX A./B.) and free DOX (A./B.) are statistically different. This assay was
preformed 1 time for each attempt.
Moreover, it can be seen that the amount of cells incubated with precipitated DOX-
conjugated phages (WT::DOX B. and C1::DOX B.) is not affected with the exposure time, comparing
to the amount of cells incubated with non-conjugated wild type phages (WT B.), presenting in this
case, all approximately 100 % of cells, when compared with the control (cells B.). Free DOX (DOX
B.) is the only with cytotoxic effect reducing the amount of cells to 87 % and 74 % after 24 h and
48 h of incubation, respectively.
The differences between the results obtained in the two experiments seem to lie on the
precipitation step added after the second conjugation attempt. This additional step, after a high-
speed centrifugation, separates the phages, which remain in the pellets, from any free DOX
remaining in the upper reservoir, which is removed by discarding the supernatants. Therefore, cell
death in the first experiments can be explained by the existence of some free DOX within the phages
conjugation solutions, but at a lower concentration than the control (cells with free DOX). The
absence of death in the second experiment, where the cells were incubated with precipitated
phages, supports this hypothesis, since the remaining free DOX was removed by centrifugation.
Therefore, these results suggest that DOX, when conjugated with phages, or rather with
internalizing phages, does not exhibit the envisaged activity. Free DOX mechanisms of action within
the cancer cells includes intercalation of DNA, inhibition of topoisomerase II and the production of
free radicals (Krushkal et al., 2016; Meredith & Dass, 2016). The EDC/sulfo-NHS chemistry leads
to the formation of a covalent bond between the phages major coat protein, pVIII, and DOX which
does not facilitate a controlled release of the drug at the targeted site (Kim et al., 2012). Therefore,
it is possible that DOX does not release from the phage preventing its envisaged action, which
could explain the results obtained.
63
4. Conclusions and futures perspectives
Drug delivery in cancer is important for optimizing the effect of drugs and to reduce toxic
side effects in situ (Aguilar, 2013).
The goal of this work was to develop a genetically and chemically manipulated M13 phage
in order to create a multifunctional drug delivery particle, by displaying HIV-Tat cell penetrating
peptide on the minor coat protein pIII of the phage and conjugating DOX, on the major coat protein
pVIII.
The genetic modification of M13 phage was achieved showing that the phagemid-cloning
system approach is a good strategy for phage DNA manipulation.
Phages with HIV-Tat sequence were used in internalization and cytotoxicity assays in
breast cancer cells. Through the analysis of the internalization results, it was concluded that phages
expressing the HIV-Tat peptide on its pIII coat protein are internalized by 4T1 cells, unlike the wild
type phages, and the internalization success depends on the incubation time. Further tests with
longer periods of incubation are required to confirm the internalization time dependency. In
addition, phages only penetrates into the periphery of the cells appearing that penetration into the
tumor (cells aggregates) is not achieved. Still genetic modified phages could be used, in the future,
as a method of diagnosis.
To preform cytotoxicity tests the genetically modified phages were chemically conjugated
with DOX. Analyzing the concentration of the conjugated drug it can be concluded that
functionalization of the coat protein VIII copies is limited and that DOX forms aggregates in aqueous
solutions which difficult its passage through 10K membranes and consequently its separation.
Cytotoxic effect was evaluated by the SRB assay and manipulated phages didn’t seems to exhibit
cytotoxic effect contrary to free DOX. This absence of cytotoxicity by genetically modified phages
may be due to the covalent bond between the phages major coat protein, pVIII, and DOX, which
does not facilitate a controlled release of the drug at the targeted site. Further replicated tests are
needed to confirm.
In the future, internalization tests need longer periods of incubation and cytotoxic tests
should be repeated in order to have more conclusive results. Also cathepsin-B cleavage site, as
DFK motif, could be inserted in the phage genome, specifically in the gene VIII, so that DFK could
be expressed on pVIII proteins and only then the phages should be conjugated with DOX. Cathepsin-
B, a lysosomal cysteine protease (Dubowchik & Firestone, 1998; Kim et al., 2012) is up-regulated
64
in cancer cells and will cleave the bond between DOX molecules and phages, thus allowing DOX
to freely act and kill cells.
The M13KO7::pETDuet::HIV-Tat phages herein engineered do not target any specific type
of cancer cell. Therefore, in the future, phages can also be modified with human breast cancer cell
recognition peptides, in order to allow discrimination between cancer and healthy cells. Through
this approach, a multifunctional phage-based nanoparticle for targeted drug delivery can be
obtained.
65
5. Bibliography
Aguilar, Z. P. (2013). Targeted Drug Delivery. Nanomaterials for Medical Applications. doi:10.1016/B978-0-12-385089-8.00005-4
Akashi-Tanaka, S., Fukutomi, T., Miyakawa, K., Uchiyama, N., Nanasawa, T., & Tsuda, H. (1999). Contrast-enhanced computed tomography detection of occult breast cancers presenting as axillary masses. Breast Cancer Research and Treatment, 55(1), 97–101. doi:10.1023/A:1006173113453
American Cancer Society. (2016). Retrieved June 14, 2016, from www.cancer.org
Aroui, S., Brahim, S., De Waard, M., Bréard, J., & Kenani, A. (2009). Efficient induction of apoptosis by doxorubicin coupled to cell-penetrating peptides compared to unconjugated doxorubicin in the human breast cancer cell line MDA-MB 231. Cancer Letters, 285(1), 28–38. doi:10.1016/j.canlet.2009.04.044
Bacterial Strain JM109. (2016). Retrieved March 16, 2016, from https://worldwide.promega.com/products/cloning-and-dna-markers/cloning-tools-and-competent-cells/bacterial-strains-and-competent-cells/bacterial-strain-jm109/
Bakhshinejad, B., Karimi, M., & Sadeghizadeh, M. (2014). Bacteriophages and medical oncology: targeted gene therapy of cancer. Medical Oncology (Northwood, London, England), 110(31), 1–11. doi:10.1007/s12032-014-0110-9
Bar, H., Yacoby, I., & Benhar, I. (2008). Killing cancer cells by targeted drug-carrying phage nanomedicines. BMC Biotechnology, 8, 37. doi:10.1186/1472-6750-8-37
Baran, E. T., & Reis, R. L. (2008). Particles for controlled drug delivery. Natural-Based Polymers for Biomedical Applications, 597–623. doi:10.1533/9781845694814.5.597
Bartella, L., & Dershaw, D. D. (2005). Magnetic Resonance Imaging of Invasive Breast Carcinoma. Breast MRI Diagnosis and Intervention, 173–183.
Bernado, C., Coelho, E., Tavares, S., Santos, A., & Santos, L. (2013). Desregulação de vias de sinalização no cancro. In O Essencial em... Sinalização Celular (Edições Af., pp. 261–273).
Bernard, J. M. L., & Francis, M. B. (2014). Chemical strategies for the covalent modification of filamentous phage. Frontiers in Microbiology, 5, 734: 1–7. doi:10.3389/fmicb.2014.00734
Bertrand, N., Wu, J., Xu, X., Kamaly, N. & Farokhzad, O. C. (2014). Cancer nanotechnology: The impact of passive and active targeting in the era of modern cancer biology. Advanced Drug Delivery Reviews, 66, 2–25. doi:10.1016/j.addr.2013.11.009
Black, L. W. (2015). Old, new, and widely true: The bacteriophage T4 DNA packaging mechanism. Virology, 480, 650–656. doi:10.1016/j.virol.2015.01.015
66
Boel, G., Letso, R., Neely, H., Price, W. N., Wong, K.-H., Su, M., … Hunt, J. F. (2016). Codon influence on protein expression in E. coli correlates with mRNA levels. Nature, 529(7586), 358–363. doi:10.1038/nature16509
Bolhassani, A. (2011). Potential efficacy of cell-penetrating peptides for nucleic acid and drug delivery in cancer. Biochimica et Biophysica Acta (BBA) - Reviews on Cancer, 1816(2), 232–246. doi:10.1016/j.bbcan.2011.07.006
Bose, A., & Wui Wong, T. (2015). Nanotechnology-Enabled Drug Delivery for Cancer Therapy. Nanotechnology Applications for Tissue Engineering. Elsevier Inc. doi:10.1016/B978-0-323-32889-0.00011-X
Brannon-Peppas, L., & Blanchette, J. O. (2012). Nanoparticle and targeted systems for cancer therapy. Advanced Drug Delivery Reviews, 64(SUPPL.), 206–212. doi:10.1016/j.addr.2012.09.033
Brant, W. E., & Helms, C. (2012). Fundamentals of Diagnostic Radiology. Wolters Kluwer Health. Retrieved from https://books.google.pt/books?id=uVeUWa3-1o8C
Burkin, M. A., & Gal’vidis, I. A. (2011). [Development and application of indirect competitive enzyme immunoassay for detection of neomycin in milk]. Prikladnaia biokhimiia i mikrobiologiia, 47(3), 355–361
Burstein, H. J. (2005). The distinctive nature of HER2-positive breast cancers. The New England Journal of Medicine, 353(16), 1652–1654. doi:10.1056/NEJMp058197
Burstein, H. J. (2011). Targeted Therapies in Breast Cancer. Oxford University Press. Retrieved from https://books.google.pt/books?id=6yKr3utpP-gC
Cantley, L. C., Auger, K. R., Carpenter, C., Duckworth, B., Graziani, A., Kapeller, R., & Soltoff, S. (1991). Oncogenes and signal transduction. Cell, 64(2), 281–302. doi:10.1016/0092-8674(91)90639-G
Carlson, R. W., Allred, D. C., Anderson, B. O., Burstein, H. J., Carter, W. B., Edge, S. B., … Wolff, a C. (2009). Breast cancer. Clinical practice guidelines in oncology. J Natl Compr Canc Netw, 7(2), 122–192.
Carrico, Z. M., Romanini, D. W., Mehl, R. A., & Francis, M. B. (2008). Oxidative coupling of peptides to a virus capsid containing unnatural amino acids. Chemical Communications, (10), 1205–1207. doi:10.1039/B717826C
Caudle, A. S., Yu, T.-K., Tucker, S. L., Bedrosian, I., Litton, J. K., Gonzalez-Angulo, A. M., … Mittendorf, E. a. (2012). Local-regional control according to surrogate markers of breast cancer subtypes and response to neoadjuvant chemotherapy in breast cancer patients undergoing breast conserving therapy. Breast Cancer Research, 14(3), R83. doi:10.1186/bcr3198
67
Chandran, P. R., & Thomas, R. T. (2015). Gold Nanoparticles in Cancer Drug Delivery. Nanotechnology Applications for Tissue Engineering. Elsevier Inc. doi:10.1016/B978-0-323-32889-0.00014-5
Chugh, A., Eudes, F., & Shim, Y.-S. (2010). Cell-penetrating peptides: Nanocarrier for macromolecule delivery in living cells. IUBMB Life, 62(3), 183–193. doi:10.1002/iub.297
Chung, W., Lee, D. Y., & Yoo, S. Y. (2014). Chemical modulation of M13 bacteriophage and its functional opportunities for nanomedicine. International Journal of Nanomedicine, 9(1), 5825–5836.
Clackson, T., & Lowman, H. B. (2004). Phage Display: A Practical Approach. OUP Oxford. Retrieved from https://books.google.pt/books?id=CRgfEbXfiAUC
Cooper, G. M. (2000). The Cell: A Molecular Approach. 2nd edition. Sunderland (MA): Sinauer Associates. Retrieved from http://www.ncbi.nlm.nih.gov/books/NBK9876/
Copolovici, D. M., Langel, K., & Eriste, E. (2014). Cell-Penetrating Peptides: Design, Synthesis, and Applications ¨, (3), 1972–1994.
Coulombe, P., & Meloche, S. (2007). Atypical mitogen-activated protein kinases: Structure, regulation and functions. Biochimica et Biophysica Acta - Molecular Cell Research, 1773(8), 1376–1387. doi:10.1016/j.bbamcr.2006.11.001
D’Herelle, F. (2007). On an invisible microbe antagonistic toward dysenteric bacilli: brief note by Mr. F. D’Herelle, presented by Mr. Roux. 1917. Research in Microbiology, 158(7), 553–4. doi:10.1016/j.resmic.2007.07.005
De Bresser, J., de Vos, B., van der Ent, F., & Hulsewé, K. (2010). Breast MRI in clinically and mammographically occult breast cancer presenting with an axillary metastasis: A systematic review. European Journal of Surgical Oncology, 36(2), 114–119. doi:10.1016/j.ejso.2009.09.007
Deporter, S. M., & Mcnaughton, B. R. (2014). Engineered M13 Bacteriophage Nanocarriers for Intracellular Delivery of Exogenous Proteins to Human Prostate Cancer Cells. Bioconjugate Chemistry, 25, 1620–1625.
Derda, R., Tang, S. K. Y., & Whitesides, G. M. (2010). Uniform amplification of phage with different growth characteristics in individual compartments consisting of monodisperse droplets. Angewandte Chemie (International Ed. in English), 49(31), 5301–5304. doi:10.1002/anie.201001143
Deutscher, S. L., & Kelly, K. A. (2011). Imaging with bacteriophage-derived probes. In Phage Nanobiotechnology (pp. 83–100). london: The Royal Society of Chemistry. doi:10.1039/9781847559920
Dhillon, a S., Hagan, S., Rath, O., & Kolch, W. (2007). MAP kinase signalling pathways in cancer. Oncogene, 26(22), 3279–3290. doi:10.1038/sj.onc.1210421
68
Dilucca, M., Cimini, G., Semmoloni, A., Deiana, A., & Giansanti, A. (2015). Codon Bias Patterns of E. coli’s Interacting Proteins. PloS One, 10(11), e0142127. doi:10.1371/journal.pone.0142127
Dong, J., Liu, W., Jiang, A., Zhang, K., & Chen, M. (2008). A novel peptide, selected from phage display library of random peptides, can efficiently target into human breast cancer cell. Chinese Science Bulletin, 53(6), 860–867. doi:10.1007/s11434-008-0162-3
Downward, J. (2003). Targeting RAS signalling pathways in cancer therapy. Nature Reviews. Cancer, 3(1), 11–22. doi:10.1038/nrc969
Dubowchik, G. M., & Firestone, R. A. (1998). Cathepsin B-sensitive dipeptide prodrugs. 1. A model study of structural requirements for efficient release of doxorubicin. Bioorg Med Chem Lett, 8. doi:10.1016/S0960-894X(98)00609-X
E. coli genotypes. (2016). Retrieved from March 18, 2016, http://openwetware.org/wiki/E._coli_genotypes#JM109
Ehrlich, G. K., Berthold, W., & Bailon, P. (2000). Phage display technology. Affinity selection by biopanning. Methods in Molecular Biology (Clifton, N.J.), 147, 195–208. doi:10.1385/1-59259-041-1:195
Evan, G. I., Evan, G. I., Vousden, K. H., & Vousden, K. H. (2001). Proliferation, cell cycle and apoptosis in cancer. Nature, 411(May), 342–348. doi:10.1038/35077213
Feng, S.-S., & Chien, S. (2003). Chemotherapeutic engineering: Application and further development of chemical engineering principles for chemotherapy of cancer and other diseases. Chemical Engineering Science, 58(18), 4087–4114. doi:10.1016/S0009-2509(03)00234-3
Fuchs, S. M., & Raines, R. T. (2007). Arginine grafting to endow cell permeability. ACS Chemical Biology, 2(3), 167–170. doi:10.1021/cb600429k
Fulop, Z., Gref, R., & Loftsson, T. (2013). A permeation method for detection of self-aggregation of doxorubicin in aqueous environment. International Journal of Pharmaceutics, 454(1), 559–561. doi:10.1016/j.ijpharm.2013.06.058
Gallet, R., Kannoly, S., & Wang, I.-N. (2011). Effects of bacteriophage traits on plaque formation. BMC Microbiology, 11(1), 1–16. doi:10.1186/1471-2180-11-181
Ghosh, D., Kohli, A. G., Moser, F., Endy, D., & Belcher, A. M. (2012). Refactored M13 bacteriophage as a platform for tumor cell imaging and drug delivery. ACS Synthetic Biology, 1(12), 576–582. doi:10.1021/sb300052u
Global Cancer Facts & Figures. (2016). International Agency for Research on Cancer. Retrieved June 16, 2016, from http://www.cancer.org/research/cancerfactsstatistics/global
GLOBOCAN 2012: Cancer Incidence, Mortality and Prevalence Worlwide in 2012. (2016). Retrieved June 16, 2016, from http://globocan.iarc.fr
69
Greenstein, D., & Brent R. (1990) “Introduction to Vectors Derived from Filamentous Phages”, in Current Protocols in Molecular Biology , Ausubel, F. M. Ed. 2003, 1.14.1– 1.14.5.
Hanahan, D., & Weinberg, R. a. (2011). Hallmarks of cancer: The next generation. Cell, 144(5), 646–674. doi:10.1016/j.cell.2011.02.013
Hendrix, R. W., Smith, M. C., Burns, R. N., Ford, M. E., & Hatfull, G. F. (1999). Evolutionary relationships among diverse bacteriophages and prophages: all the world’s a phage. Proceedings of the National Academy of Sciences of the United States of America, 96(5), 2192–2197. doi:10.1073/pnas.96.5.2192
Herce, H. D., & Garcia, A. E. (2007). Molecular dynamics simulations suggest a mechanism for translocation of the HIV-1 TAT peptide across lipid membranes. Proceedings of the National Academy of Sciences of the United States of America, 104(52), 20805–20810. doi:10.1073/pnas.0706574105
Hertveldt, K., Belien, T., & Volckaert, G. (2009). General M13 phage display: M13 phage display in identification and characterization of protein-protein interactions. Methods in Molecular Biology (Clifton, N.J.), 502, 321–339. doi:10.1007/978-1-60327-565-1_19
Hess, G. T., Cragnolini, J. J., Popp, M. W., Allen, M. A., Dougan, S. K., Spooner, E., … Guimaraes, C. P. (2012). An M13 bacteriophage display framework that allows sortase-mediated modification of surface-accessible phage proteins. Bioconjugate Chemistry, 23(7), 1478–1487. doi:10.1021/bc300130z
Hungaro, H. M., Lopez, M. E. S., Albino, L. a a, & Mendonc, R. C. S. (2014). Bacteriophage : The Viruses Infecting Bacteria and Their Multiple Applications. Reference Module in Earth Systems and Environmental Sciences, 1–12. doi:10.1016/B978-0-12-409548-9.09039-4
Hussain, N. (2000). Ligand-mediated tissue specific drug delivery. Advanced Drug Delivery Reviews, 43(2-3), 95–100. doi:10.1016/S0169-409X(00)00066-1
Hyman, P., & Abedon, S. T. (2009). Bacteriophage ( overview ). Elsevier, 322–338.
Jacobs, L., Finlayson, C., & Yang, S. C. (2010). Early Diagnosis and Treatment of Cancer Series: Breast Cancer: Expert Consult. Elsevier Health Sciences. Retrieved from https://books.google.pt/books?id=LCqw_pJc5MIC Kappa Biosystems,
KAPA HiFi PCR Kit (2013).
Kierny, M. R., Cunningham, T. D., & Kay, B. K. (2012). Detection of biomarkers using recombinant antibodies coupled to nanostructured platforms. Nano Reviews, 3(0), 1–24. doi:10.3402/nano.v3i0.17240
Kim, A., Shin, T.-H., Shin, S.-M., Pham, C. D., Choi, D.-K., Kwon, M.-H., & Kim, Y.-S. (2012). Cellular Internalization Mechanism and Intracellular Trafficking of Filamentous M13 Phages Displaying a Cell-Penetrating Transbody and TAT Peptide. PLoS ONE, 7(12), e51813. doi:10.1371/journal.pone.0051813
70
Kleinstreuer, C., Childress, E., & Kennedy, A. (2013). Targeted Drug Delivery: Multifunctional Nanoparticles and Direct Micro-Drug Delivery to Tumors. Transport in Biological Media. Elsevier Inc. doi:10.1016/B978-0-12-415824-5.00010-2
Krushkal, J., Zhao, Y., Hose, C., Monks, A., Doroshow, J. H., & Simon, R. (2016). Concerted changes in transcriptional regulation of genes involved in DNA methylation, demethylation, and folate-mediated one-carbon metabolism pathways in the NCI-60 cancer cell line panel in response to cancer drug treatment. Clinical Epigenetics, 8, 73. doi:10.1186/s13148-016-0240-3
Kuldell, N., & Lerner, N. (2009). Genome Refactoring. Morgan & Claypool Publishers. Retrieved from https://books.google.pt/books?id=PGSFbBNTo4gC
Kullberg, M., McCarthy, R., & Anchordoquy, T. J. (2013). Systemic tumor-specific gene delivery. Journal of Controlled Release : Official Journal of the Controlled Release Society, 172(3), 730–736. doi:10.1016/j.jconrel.2013.08.300
Kutateladze, M., & Adamia, R. (2010). Bacteriophages as potential new therapeutics to replace or supplement antibiotics. Trends in Biotechnology, 28(12), 591–595. doi:10.1016/j.tibtech.2010.08.001
Kwaśnikowski, P., Kristensen, P., & Markiewicz, W. T. (2005). Multivalent display system on filamentous bacteriophage pVII minor coat protein. Journal of Immunological Methods, 307(1-2), 135–43. doi:10.1016/j.jim.2005.10.002
Laurent-Puig, P., Lievre, A., & Blons, H. (2009). Mutations and response to epidermal growth factor receptor Inhibitors. Clinical Cancer Research, 15(4), 1133–1139. doi:10.1158/1078-0432.CCR-08-0905
Li, K., Chen, Y., Li, S., Nguyen, H. G., Niu, Z., You, S., … Wang, Q. (2010). Chemical Modification of M13 Bacteriophage and Its Application in Cancer Cell Imaging. Bioconjugate Chemistry, 21(7), 1369–1377. doi:10.1021/bc900405q
Livasy, C. a, Karaca, G., Nanda, R., Tretiakova, M. S., Olopade, O. I., Moore, D. T., & Perou, C. M. (2006). Phenotypic evaluation of the basal-like subtype of invasive breast carcinoma. Modern Pathology : An Official Journal of the United States and Canadian Academy of Pathology, Inc, 19(2), 264–271. doi:10.1038/modpathol.3800528
Lowe, S. W., Cepero, E., & Evan, G. (2004). Intrinsic tumour suppression. Nature, 432(7015), 307–315. doi:10.1038/nature03098
Lu, T. K., & Koeris, M. S. (2011). The next generation of bacteriophage therapy. Current Opinion in Microbiology, 14(5), 524–531. doi:10.1016/j.mib.2011.07.028
Lubischer, J. L. (2007). Book Review: The Cell Cycle, Principles of Control. Integrative and Comparative Biology, 47(5), 794–795. doi:10.1093/icb/icm060
Lundberg, M., & Johansson, M. (2001, August). Is VP22 nuclear homing an artifact? Nature Biotechnology. United States. doi:10.1038/90741
71
Luo, Y., & Prestwich, G. D. (2002). Cancer-targeted polymeric drugs. Curr Cancer Drug Targets, 2. doi:10.2174/1568009023333836
Ma, Y., Nolte, R. J. M., & Cornelissen, J. J. L. M. (2012). Virus-based nanocarriers for drug delivery. Advanced Drug Delivery Reviews, 64(9), 811–825. doi:10.1016/j.addr.2012.01.005
Macherey-Nagel. (2015). Plasmid DNA Purification - NucleoSpin Plasmid (Handbuch). Düren, Deutschland, (December).
Mäe, M., & Langel, U. (2006). Cell-penetrating peptides as vectors for peptide, protein and oligonucleotide delivery. Current Opinion in Pharmacology, 6(5), 509–514. doi:10.1016/j.coph.2006.04.004
Maiolino, S., Russo, A., Pagliara, V., Conte, C., Ungaro, F., Russo, G., & Quaglia, F. (2015). Biodegradable nanoparticles sequentially decorated with Polyethyleneimine and Hyaluronan for the targeted delivery of docetaxel to airway cancer cells. Journal of Nanobiotechnology, 13(1), 1–13. doi:10.1186/s12951-015-0088-2
Malinowski, D. P. (2007). Multiple biomarkers in molecular oncology. II. Molecular diagnostics applications in breast cancer management. Expert Review of Molecular Diagnostics, 7(3), 269–280. doi:10.1586/14737159.7.3.269
Mao, C. B. (2013). Filamentous Bacteriophages. Brenner’s Encyclopedia of Genetics, Second Edition (Vol. 3). Elsevier Inc. doi:10.1016/B978-0-12-374984-0.00528-3
Martins, I., & Ferreira, D. (2016). Artificial virus particles. In L. R. Rodrigues & M. Mota (Eds.), Bioinspired materials for medical applications: materials, technologies and devices. (pp. 425–448). Elsevier Science. doi:10.1016/B978-0-08-100741-9.00015-2
Marvin, D. A., Symmons, M. F., & Straus, S. K. (2014). Structure and assembly of filamentous bacteriophages. Progress in Biophysics and Molecular Biology, 114(2), 80–122. doi:10.1016/j.pbiomolbio.2014.02.003
Mendes, T. S., Kluskens, L. D., & Rodrigues, L. R. (2015). Triple negative breast cancer: nanosolutions for a big challenge. Advanced Science, (Accepted).
Meredith, A.-M., & Dass, C. R. (2016). Increasing role of the cancer chemotherapeutic doxorubicin in cellular metabolism. The Journal of Pharmacy and Pharmacology, 68(6), 729–741. doi:10.1111/jphp.12539
Messing, J., Gronenborn, B., Müller-Hill, B., & Hans Hopschneider, P. (1977). Filamentous coliphage M13 as a cloning vehicle: insertion of a HindII fragment of the lac regulatory region in M13 replicative form in vitro. Proceedings of the National Academy of Sciences of the United States of America, 74(9), 3642–3646. doi:10.1073/pnas.74.9.3642
Milla, P., Dosio, F., & Cattel, L. (2012). PEGylation of proteins and liposomes: a powerful and flexible strategy to improve the drug delivery. Current Drug Metabolism, 13(1), 105–119
72
Milletti, F. (2012). Cell-penetrating peptides: classes, origin, and current landscape. Drug Discovery Today, 17(15-16), 850–860. doi:10.1016/j.drudis.2012.03.002
Mirkin, S. M. (2001). DNA Topology : Fundamentals. Life Sciences, 123(c), 1–11. doi:10.1021/ja0156845
Moineau, S. (2013). Bacteriophage. Brenner’s Encyclopedia of Genetics, 1, 280–283. doi:10.1016/B978-0-12-374984-0.00131-5
Molek, P., & Bratkovič, T. (2015). Bacteriophages as scaffolds for bipartite display: designing Swiss army knives at a nanoscale. Bioconjugate Chemistry, 26, 367–378. doi:10.1021/acs.bioconjchem.5b00034
Molino, N. M., & Wang, S. W. (2014). Caged protein nanoparticles for drug delivery. Current Opinion in Biotechnology, 28(Figure 1), 75–82. doi:10.1016/j.copbio.2013.12.007
Moore, S. (2016). Round-the-horn site-directed mutagenesis. Retrieved March 20, 2016, from http://openwetware.org/wiki/%27Round-the-horn_site-directed_mutagenesis
Mosig, G., & Eiserling, F. (2006). T4 and related phages: Structure and development. In R. Calendar (Ed.), The bacteriophages (pp. 225–267). Oxford: Oxford University Press.
Moulineux, I. J. (2006). The T7 group. In R. Calendar (Ed.), The bacteriophages (pp. 277–301). Oxford: Oxford University Press.
Mussbach, F., Franke, M., Zoch, A., Schaefer, B., & Reissmann, S. (2011). Transduction of peptides and proteins into live cells by cell penetrating peptides. Journal of Cellular Biochemistry, 112(12), 3824–3833. doi:10.1002/jcb.23313
National Cancer Institute. (2016). Retrieved June 17, 2016, from www.cancer.gov
NEB. (2016). Ph . D . TM Phage Display Libraries.
Nilssen, N. R., Frigstad, T., Pollmann, S., Roos, N., Bogen, B., Sandlie, I., & Løset, G. Å. (2012, September). DeltaPhage—a novel helper phage for high-valence pIX phagemid display. Nucleic Acids Research. doi:10.1093/nar/gks341
Nobrega, F. L., Costa, A. R., Kluskens, L. D., & Azeredo, J. (2015). Revisiting phage therapy: new applications for old resources. Trends in Microbiology, 1–7. doi:10.1016/j.tim.2015.01.006
Noren, K. a, & Noren, C. J. (2001). Construction of high-complexity combinatorial phage display peptide libraries. Methods, 23(2), 169–178. doi:10.1006/meth.2000.1118
Olayioye, M. a. (2001). Update on HER-2 as a target for cancer therapy: intracellular signaling pathways of ErbB2/HER-2 and family members. Breast Cancer Research : BCR, 3(6), 385–389. doi:10.1186/bcr327
73
Onitilo, A. a., Engel, J. M., Greenlee, R. T., & Mukesh, B. N. (2009). Breast cancer subtypes based on ER/PR and Her2 expression: Comparison of clinicopathologic features and survival. Clinical Medicine and Research, 7(1-2), 4–13. doi:10.3121/cmr.2009.825
Pall. Microsep TM Advance Centrifugal Devices (2014).
Parkin, D. M., Pisani, P., & Ferlay, J. (1999). Global cancer statistics. CA Cancer J Clin, 49(2), 1,33–64. doi:10.3322/caac.20107.Available
Peer, D., Karp, J. M., Hong, S., Farokhzad, O. C., Margalit, R., & Langer, R. (2007). Nanocarriers as an emerging platform for cancer therapy. Nature Nanotechnology, 2(12), 751–760. doi:10.1038/nnano.2007.387
Phumyen, A., Jantasorn, S., Jumnainsong, A., & Leelayuwat, C. (2014). Doxorubicin-conjugated bacteriophages carrying anti-MHC class I chain-related A for targeted cancer therapy in vitro. OncoTargets and Therapy, 7, 2183–2195. doi:10.2147/OTT.S69315
Popp, M. W., Antos, J. M., Grotenbreg, G. M., Spooner, E., & Ploegh, H. L. (2007). Sortagging: a versatile method for protein labeling. Nat Chem Biol, 3(11), 707–708. Retrieved from http://dx.doi.org/10.1038/nchembio.2007.31
Poste, G. (1998). Molecular medicine and information-based targeted healthcare. Nature Biotechnology, 16 Suppl, 19–21. doi:10.1038/5403
Pusztaszeri, M., Soccal, P. M., Mach, N., Pache, J., & Kee, T. M. (2012). Pulmonary & Respiratory Medicine Cytopathological Diagnosis of Non Small Cell Lung Cancer : Recent Advances Including Rapid On-Site Evaluation , Novel Endoscopic Techniques and Molecular Tests. Lung Cancer. doi:10.4172/2161-105X.S5-002
Qi, H., Lu, H., Qiu, H.-J., Petrenko, V., & Liu, A. (2012). Phagemid vectors for phage display: properties, characteristics and construction. Journal of Molecular Biology, 417(3), 129–143. doi:10.1016/j.jmb.2012.01.038
Rakonjac, J., Bennett, N. J., Spagnuolo, J., Gagic, D., & Russel, M. (2011). Filamentous bacteriophage: biology, phage display and nanotechnology applications. Current Issues in Molecular Biology, 13(2), 51–76. doi:10.1002/9780470015902.a0000777
Rakonjac, J., Jovanovic, G., & Model, P. (1997). Filamentous phage infection-mediated gene expression: construction and propagation of the gIII deletion mutant helper phage R408d3. Gene, 198(1-2), 99–103.
Rangel, R., Dobroff, A. S., Guzman-Rojas, L., Salmeron, C. C., Gelovani, J. G., Sidman, R. L., … Arap, W. (2013). Targeting mammalian organelles with internalizing phage (iPhage) libraries. Nature Protocols, 8(10), 1916–1939. doi:10.1038/nprot.2013.119
Riechmann, L., & Holliger, P. (1997). The C-Terminal Domain of TolA Is the Coreceptor for Filamentous Phage Infection of E. coli. Cell, 90(2), 351–360. doi:10.1016/S0092-8674(00)80342-6
74
Rodi, D. J., & Makowski, L. (1999). Phage-display technology - Finding a needle in a vast molecular haystack. Current Opinion in Biotechnology, 10(1), 87–93. doi:10.1016/S0958-1669(99)80016-0
Rolfe, M. D., Rice, C. J., Lucchini, S., Pin, C., Thompson, A., Cameron, A. D. S., … Hinton, J. C. D. (2012). Lag phase is a distinct growth phase that prepares bacteria for exponential growth and involves transient metal accumulation. Journal of Bacteriology, 194(3), 686–701. doi:10.1128/JB.06112-11
Russel, M., Lowman, H. B., & Clackson, T. (2004). Introduction to phage biology and phage display. In Phage Display: A Laboratory Manual (pp. 1–26). Oxford: Oxford University Press.
Sambrook, J. and Russell, D.W. (2001). Molecular Cloning: A laboratory Manual, (3rd ed.). Cold Spring Harbor Laboratory Press, 3.17-3.32.
Sartorius, R., Pisu, P., D’Apice, L., Pizzella, L., Romano, C., Cortese, G., … De Berardinis, P. (2008). The use of filamentous bacteriophage fd to deliver MAGE-A10 or MAGE-A3 HLA-A2-restricted peptides and to induce strong antitumor CTL responses. Journal of Immunology (Baltimore, Md. : 1950), 180(6), 3719–3728
Sawant, R. R., Patel, N. R., & Torchilin, V. P. (2013). Therapeutic delivery using cell-penetrating peptides. European Journal of Nanomedicine, 5(3), 141–158. doi:10.1515/ejnm-2013-0005
Sevick, S. H., Medical, P., & Arbor, A. (n.d.). Compatibility of Various Pharmaceutical Agents with Pall Medical Supor ® Membrane Filter Devices.
Shetty, N., & Wilson, A. P. R. (2000). Sitafloxacin in the treatment of patients with infections caused by vancomycin-resistant enterococci and methicillin-resistant Staphylococcus aureus. Journal of Antimicrobial Chemotherapy, 46(4), 633–638.
Siegel, R., Naishadham, D., & Jemal, A. (2013). Cancer Statistics, 2013, 37(2), 408–14. doi:10.3322/caac.21166.
Singh, S. (2010). Nanomedicine-nanoscale drugs and delivery systems. Journal of Nanoscience and Nanotechnology, 10(12), 7906–7918
Sørlie, T., Perou, C. M., Tibshirani, R., Aas, T., Geisler, S., Johnsen, H., … Børresen-Dale, a L. (2001). Gene expression patterns of breast carcinomas distinguish tumor subclasses with clinical implications. Proceedings of the National Academy of Sciences of the United States of America, 98(19), 10869–10874. doi:10.1073/pnas.191367098
Springman, R., Molineux, I. J., Duong, C., Bull, R. J., & Bull, J. J. (2012). Evolutionary stability of a refactored phage genome. ACS Synthetic Biology, 1(9), 425–430. doi:10.1021/sb300040v
Srinivas, P. R., Barker, P., & Srivastava, S. (2002). Nanotechnology in Early Detection of Cancer. Laboratory Investigation, 82(5), 657–662. doi:10.1038/labinvest.3780460
75
Steichen, S. D., Caldorera-Moore, M., & Peppas, N. a. (2013). A review of current nanoparticle and targeting moieties for the delivery of cancer therapeutics. European Journal of Pharmaceutical Sciences, 48(3), 416–427. doi:10.1016/j.ejps.2012.12.006
Suhorutsenko, J., Oskolkov, N., Arukuusk, P., Kurrikoff, K., Eriste, E., Copolovici, D. M., & Langel, Ü. (2011). Cell-penetrating peptides, PepFects, show no evidence of toxicity and immunogenicity in vitro and in vivo. Bioconjugate Chemistry, 22(11), 2255–2262. doi:10.1021/bc200293d
Sulakvelidze, A. (2001). Bacteriophage Therapy. American Society for Microbiology, 45(31), 649–659. doi:10.1128/AAC.45.3.649
ThermoFisher. (2009). NHS & Sulfo-NHS, 0747(24500), 1–4. Retrieved from papers://95a21619-f0db-4d63-b765-20000f642a6a/Paper/p1091
Thorn, C. F., Oshiro, C., Marsh, S., Hernandez-Boussard, T., McLeod, H., Klein, T. E., & Altman, R. B. (2011). Doxorubicin pathways: pharmacodynamics and adverse effects. Pharmacogenetics and Genomics, 21(7), 440–446. doi:10.1097/FPC.0b013e32833ffb56
Torii, S., Yamamoto, T., Tsuchiya, Y., & Nishida, E. (2006). ERK MAP kinase in G cell cycle progression and cancer. Cancer Science, 97(8), 697–702. doi:10.1111/j.1349-7006.2006.00244.x
Torre, L. a, Bray, F., Siegel, R. L., Ferlay, J., Lortet-tieulent, J., & Jemal, A. (2015). Global Cancer Statistics, 2012, 00(00), 1–22. doi:10.3322/caac.21262.
Toy, R., Bauer, L., Hoimes, C., Ghaghada, K. B., & Karathanasis, E. (2014). Targeted Nanotechnology for Cancer Imaging. Advanced Drug Delivery Reviews, 76(2014), 79–97. doi:10.1016/j.addr.2014.08.002
Urruticoechea, A., Alemany, R., Balart, J., Villanueva, A., Viñals, F., & Capellá, G. (2010). Recent advances in cancer therapy: an overview. Current Pharmaceutical Design, 16(1), 3–10. doi:10.2174/138161210789941847
Vaks, L., & Benhar, I. (2011). In vivo characteristics of targeted drug-carrying filamentous bacteriophage nanomedicines. Journal of Nanobiotechnology, 9, 58. doi:10.1186/1477-3155-9-58
Van Houten, N. E., Henry, K. A., Smith, G. P., & Scott, J. K. (2010). Engineering filamentous phage carriers to improve focusing of antibody responses against peptides. Vaccine, 28(10), 2174–2185. doi:10.1016/j.vaccine.2009.12.059
Van Houten, N. E., Zwick, M. B., Menendez, A., & Scott, J. K. (2006). Filamentous phage as an immunogenic carrier to elicit focused antibody responses against a synthetic peptide. Vaccine, 24(19), 4188–4200. doi:10.1016/j.vaccine.2006.01.001
Vandersteegen, K., Mattheus, W., Ceyssens, P. J., Bilocq, F., de Vos, D., Pirnay, J. P., … Lavigne, R. (2011). Microbiological and molecular assessment of bacteriophage ISP for the control of Staphylococcus aureus. PLoS ONE, 6(9), 1–8. doi:10.1371/journal.pone.0024418
76
Vanneman, M., & Dranoff, G. (2012). Combining immunotherapy and targeted therapies in cancer treatment. Nature Reviews Cancer, 12(4), 237–251. doi:10.1038/nrc3237
Veiman, K.-L., Künnapuu, K., Lehto, T., Kiisholts, K., Pärn, K., Langel, Ü., & Kurrikoff, K. (2015). PEG shielded MMP sensitive CPPs for efficient and tumor specific gene delivery in vivo. Journal of Controlled Release, 209, 238–247. doi:10.1016/j.jconrel.2015.04.038
Velappan, N., Fisher, H. E., Pesavento, E., Chasteen, L., D’Angelo, S., Kiss, C., … Bradbury, A. R. M. (2010). A comprehensive analysis of filamentous phage display vectors for cytoplasmic proteins: an analysis with different fluorescent proteins. Nucleic Acids Research, 38(4), 1–16.
Vichai, V., & Kirtikara, K. (2006). Sulforhodamine B colorimetric assay for cytotoxicity screening. Nat. Protocols, 1(3), 1112–1116. Retrieved from http://dx.doi.org/10.1038/nprot.2006.179
Vieira, J. and Messing, J. (1987). R. Wu and L. Grossman(Ed.), Methods Enzymol. Academic Press, 153, 3-11.
Voigt, W. (2005). Sulforhodamine B assay and chemosensitivity. Methods in Molecular Medicine, 110, 39–48. doi:10.1385/1-59259-869-2:039
World Health Organization, N. (2008). The Global Burden of Disease: 2004 update. Update, 2010, 146. doi:10.1038/npp.2011.85
Yacoby, I., & Benhar, I. (2007). Targeted anti bacterial therapy. Infectious Disorders Drug Targets, 7(3), 221–229
Yata, T., Lee, K.-Y., Dharakul, T., Songsivilai, S., Bismarck, A., Mintz, P. J., & Hajitou, A. (2014). Hybrid Nanomaterial Complexes for Advanced Phage-guided Gene Delivery. Molecular Therapy—Nucleic Acids, 3(8), e185. doi:10.1038/mtna.2014.37
Zhang, H., Berezov, A., Wang, Q., Zhang, G., Drebin, J., Murali, R., & Greene, M. I. (2007). ErbB receptores: From oncogenes to targeted cancer therapies, 117(8), 2051–2058. doi:10.1172/JCI32278.The
Zhao, Y., & Adjei, A. a. (2014). The clinical development of MEK inhibitors. Nature Reviews. Clinical Oncology, 11(7), 385–400. doi:10.1038/nrclinonc.2014.83
Zorko, M., & Langel, U. (2005). Cell-penetrating peptides: mechanism and kinetics of cargo delivery. Advanced Drug Delivery Reviews, 57(4), 529–545. doi:10.1016/j.addr.2004.10.010