Embed Size (px)
Citation preview

Steven Winter Associates, Inc. - LGEA Report Sussex Community College – Building B/C Page 1/64
February 16, 2011
Sussex Community College
Administration & Art Gallery Building B/C
Local Government Energy Program Energy Audit Report FINAL
One College Hill Rd
Newton, NJ 07860
Project Number: LGEA79
Steven Winter Associates, Inc. 293 Route 18, Suite 330 Telephone (866) 676-1972 Building Systems Consultants East Brunswick, NJ 08816 Facsimile (203) 852-0741 www.swinter.com

Steven Winter Associates, Inc. - LGEA Report Sussex Community College – Building B/C Page 2/64
TABLE OF CONTENTS
TABLE OF CONTENTS .................................................................................................................. 2
EXECUTIVE SUMMARY ................................................................................................................. 3
HISTORICAL ENERGY CONSUMPTION ........................................................................................ 6
EXISTING FACILITY AND SYSTEMS DESCRIPTION .................................................................. 12
RENEWABLE AND DISTRIBUTED ENERGY MEASURES .......................................................... 22
PROPOSED ENERGY CONSERVATION MEASURES ................................................................ 25
APPENDIX A: EQUIPMENT LIST ................................................................................................. 46
APPENDIX B: LIGHTING STUDY ................................................................................................. 48
APPENDIX C: THIRD PARTY ENERGY SUPPLIERS .................................................................. 52
APPENDIX D: GLOSSARY AND METHOD OF CALCULATIONS ............................................... 54
APPENDIX E: STATEMENT OF ENERGY PERFORMANCE FROM ENERGY STAR® ............... 58
APPENDIX F: INCENTIVE PROGRAMS ....................................................................................... 59
APPENDIX G: ENERGY CONSERVATION MEASURES ............................................................. 61
APPENDIX H: VENDINGMISER™ AND SNACKMISER™ ENERGY SAVINGS .......................... 63
APPENDIX I: METHOD OF ANALYSIS ........................................................................................ 64

Steven Winter Associates, Inc. - LGEA Report Sussex Community College – Building B/C Page 3/64
EXECUTIVE SUMMARY The Administration and Art Gallery building is a three story building with a partial basement comprising a total conditioned floor area of 38,137 square feet. The original structure was built in 1960 with additions/renovations in 1998, 2000, 2004-5, and 2008. The following chart provides an overview of current energy usage in the building based on the analysis period of August 2009 through July 2010:
Table 1: State of Building-Energy Usage Electric
Usage, kWh/yr
Gas Usage, therms/yr
Annual Cost of Energy, $
Site Energy Use Intensity, kBtu/sq ft yr
Joint Energy Consumption, MMBtu/yr
Current 688,323 23,220 137,511 122.0 4,671
Proposed 554,251 7,542 92,534 69.0 2,642
Savings 134,072 15,678 44,977 53.0 2029
% Savings 19.5% 67.5% 32.7% 43.4% 43.4%
There may be energy procurement opportunities for the Administration and Art Gallery building to reduce annual electric utility costs, which are $4,130 higher when compared to the average estimated NJ commercial utility rates. SWA has also entered energy information about the Public Administration and Art Gallery building in the U.S. Environmental Protection Agency’s (EPA) ENERGY STAR® Portfolio Manager Energy benchmarking system. The resulting Site Energy Use Intensity is 122.0 kBtu/sq ft yr, while the average energy use intensity for campus type buildings is 120.0 kBtu/sq ft yr. Based on the current state of the building and its energy use, SWA recommends implementing various energy conservation measures from the savings detailed in Table 1. The measures are categorized by payback period in Table 2 below:
Table 2: Energy Conservation Measure Recommendations ECMs First Year
Savings ($) Simple Payback Period (years)
Initial Investment, $
CO2 Savings, lbs/yr
0-5 Year $14,628 2.4 $35,186 152,856 5-10 Year $4,584 6.8 $31,168 32,059 >10 year $25,765 15.2 $391,988 227,960
Total $44,977 10.2 $458,342 412,875
SWA estimates that implementing the recommended ECMs is equivalent to removing approximately 13 cars from the roads each year or the equivalent of planting 372 trees to offset the annual CO2 emissions generated. Further Recommendations: Other recommendations to increase building efficiency pertaining to capital improvements and operations and maintenance are (with additional information in the Proposed Further Recommendations section):
Capital Improvements o Replace exhaust fans

Steven Winter Associates, Inc. - LGEA Report Sussex Community College – Building B/C Page 4/64
o Replace window air conditioners o Install NEMA premium motors when replacements are required Operations and Maintenance o Maintain roofs o Maintain downspouts and cap flashing o Provide weather-stripping/air-sealing o Repair/seal wall cracks and penetrations o Provide water-efficient fixtures and controls o Use smart power electric strips
The recommended ECMs and the list above are cost-effective energy efficiency measures and building upgrades that will reduce operating expenses for Sussex Community College. Based on the requirements of the LGEA program, Sussex Community College must commit to implementing some of these measures, and must submit paperwork to the Local Government Energy Audit program within one year of this report’s approval to demonstrate that they have spent, net of other NJCEP incentives, at least 25% of the cost of the audit (per building). The minimum amount to be spent, net of other NJCEP incentives, is $2,239 (or 25% of $8,956). Financial Incentives and Other Program Opportunities The table below summarizes the recommended next steps that the Sussex Community College can take to achieve greater energy efficiency and reduce operating expenses.
Table 3: Next Steps for the Administration and Art Gallery building Recommended ECMs Incentive Program (Please refer to
Appendix F for details) Install (67) New CFL fixtures N/A Retrofit (3) Beverage vending machines with Vending Miser™ Direct Install Retrofit (1) Snack Vending Machine with Snack Miser™ Direct Install Install 2 new Daylight Sensors with incentives Smart Start, Direct Install Install 3 new Motion Sensors with incentives Smart Start, Direct Install Replace windows on 3rd N/A floor
There are various incentive programs that the Sussex Community College could apply for that could help lower the cost of installing the ECMs. For the Administration and Art Gallery building, and contingent upon available funding, SWA recommends the following incentive programs: • Direct Install 2010 Program: Commercial buildings with peak electric demand below 200kW
can receive up to 60% of installed cost of energy saving upgrades. • Smart Start: Most of energy savings equipment and design measures have moderate
incentives under this program. • Renewable Energy Incentive Program: Receive up to $0.75/Watt toward installation cost for
PV panels upon available funding. For each 1,000 kWh generated by PV renewable energy, receive a credit between $475 and $600.
• Utility Sponsored Programs: See available programs with JCP&L https://www.firstenergycorp.com/JCP_L/index.html and Elizabethtown Gas http://www.elizabethtowngas.com/Business/EnergySavings.aspx
• Energy Efficiency and Conservation Block Grant Rebate Program: Provides up to $20,000 per local government toward energy saving measures; http://njcleanenergy.com/EECBG
Please refer to Appendix F for further details.

Steven Winter Associates, Inc. - LGEA Report Sussex Community College – Building B/C Page 5/64
INTRODUCTION Launched in 2008, the Local Government Energy Audit (LGEA) Program provides subsidized energy audits for municipal and local government-owned facilities, including offices, courtrooms, Sussex Community College halls, police and libraries, sanitation buildings, transportation structures, schools and community centers. The Program will subsidize up to 100% of the cost of the audit. The Board of Public Utilities (BPUs) Office of Clean Energy has assigned TRC Energy Services to administer the Program. Steven Winter Associates, Inc. (SWA) is a 38-year-old architectural/engineering research and consulting firm, with specialized expertise in green technologies and procedures that improve the safety, performance, and cost effectiveness of buildings. SWA has a long-standing commitment to creating energy-efficient, cost-saving and resource-conserving buildings. As consultants on the built environment, SWA works closely with architects, developers, builders, and local, state, and federal agencies to develop and apply sustainable, ‘whole building’ strategies in a wide variety of building types: commercial, residential, educational and institutional. SWA performed an energy audit and assessment for the Administration and Art Gallery building at One College Hill Rd, Sussex Community College, 07901. The process of the audit included facility visits on August 24, 27, and September 17, 2010, benchmarking and energy bills analysis, assessment of existing conditions, energy modeling, energy conservation measures and other recommendations for improvements. The scope of work includes providing a summary of current building conditions, current operating costs, potential savings, and investment costs to achieve these savings. The facility description includes energy usage, occupancy profiles and current building systems along with a detailed inventory of building energy systems, recommendations for improvement and recommendations for energy purchasing and procurement strategies. The goal of this Local Government Energy Audit is to provide sufficient information to the Sussex Community College to make decisions regarding the implementation of the most appropriate and most cost-effective energy conservation measures for the Administration and Art Gallery building.
Steven Winter Associates, Inc. - LGEA Report Sussex Community College – Building B/C Page 6/64
HISTORICAL ENERGY CONSUMPTION
Energy usage, load profile and cost analysis
SWA reviewed utility bills from July 2008 through July 2010 that were received from the utility companies supplying the Administration and Art Gallery building with electric and natural gas. A 12 month period of analysis from August 2009 through July 2010 was used for all calculations and for purposes of benchmarking the building.
Electricity - The Administration and Art Gallery building is currently served by one electric meter. The Administration and Art Gallery building currently buys electricity from JCP&L at an average aggregated rate of $0.156/kWh. The Administration and Art Gallery building purchased approximately 688,323 kWh, or $107,377 worth of electricity, in the previous year. The average monthly demand was 156.0 kW and the annual peak demand was 175.6 kW. The chart below shows the monthly electric usage and costs. The dashed green line represents the approximate base-load or minimum electric usage required to operate the Administration and Art Gallery building.
Natural gas - The Administration and Art Gallery building is currently served by one meter for natural gas. The Administration and Art Gallery building currently buys natural gas from Elizabethtown Gas at an average aggregated rate of $1.298/therm. The Administration and Art Gallery building purchased approximately 23,220 therms, or $30,134 worth of natural gas, in the previous year. The following chart shows the monthly natural gas usage and costs. The green line represents the approximate base-load or minimum natural gas usage required to operate the Administration and Art Gallery building.
$0
$2,000
$4,000
$6,000
$8,000
$10,000
$12,000
010,00020,00030,00040,00050,00060,00070,00080,000
Aug
-09
Sep
-09
Oct
-09
Nov
-09
Dec
-09
Jan-
10Fe
b-10
Mar
-10
Apr
-10
May
-10
Jun-
10Ju
l-10
Elec
tric
Cos
t ($)
Elec
tric
Usa
ge (k
Wh)
Date (Month-Year)
Annual Electric Usage (kWh) and Cost($)
Electric Usage (kWh)Estimated Baseload (kWh)Electric Cost

Steven Winter Associates, Inc. - LGEA Report Sussex Community College – Building B/C Page 7/64
The previous chart shows the monthly natural gas usage along with the heating degree days or HDD. Heating degree days is the difference of the average daily temperature and a base temperature, on a particular day. The heating degree days are zero for the days when the average temperature exceeds the base temperature. SWA’s analysis used a base temperature of 65 degrees Fahrenheit.
$0 $1,000 $2,000 $3,000 $4,000 $5,000 $6,000 $7,000
0
1000
2000
3000
4000
5000
6000
Aug
-09
Sep
-09
Oct
-09
Nov
-09
Dec
-09
Jan-
10Fe
b-10
Mar
-10
Apr
-10
May
-10
Jun-
10Ju
l-10
Natu
ral G
as C
ost($
)
Natu
ral G
as U
sage
(the
rms)
Date (Month-Year)
Annual Natural Gas(therms) and Cost($)
Natural Gas Usage (therms)Estimated Baseload (therms)Natural Gas Cost
02004006008001,0001,2001,400
0
1,000
2,000
3,000
4,000
5,000
6,000
Aug
-09
Sep
-09
Oct
-09
Nov
-09
Dec
-09
Jan-
10Fe
b-10
Mar
-10
Apr
-10
May
-10
Jun-
10Ju
l-10
HDD
Natu
ral G
as U
sage
(the
rms)
Date (Month-Year)
Natural Gas Usage (therms) vs. Heating Degree Days (HDD)
Natural Gas Usage (therms)Heating Degree Days (HDD)

Steven Winter Associates, Inc. - LGEA Report Sussex Community College – Building B/C Page 8/64
The following graphs, pie charts, and table show energy use for the Public Administration and Art Gallery building based on utility bills for the 12 month period. Note: electrical cost at $46/MMBtu of energy is 3.5 times as expensive as natural gas at $13/MMBtu.
Energy benchmarking
SWA has entered energy information about the Administration and Art Gallery building in the U.S. Environmental Protection Agency’s (EPA) ENERGY STAR® Portfolio Manager Energy benchmarking system. This Administration and Art Gallery building facility is categorized as a non-eligible (“Other”) space type. Because it is an “Other” space type, there is no rating available. Consequently, the Administration and Art Gallery building is not eligible to receive a national energy performance rating at this time. The Site Energy Use Intensity is 122.0 kBtu/sq
MMBtu % MMBtu $ % $ $/MMBtu1,496 32% $68,385 50% 46
48 1% $2,209 2% 46294 6% $13,437 10% 46511 11% $23,347 17% 46
114 2% $1,478 1% 132,208 47% $28,656 21% 134,671 100% $137,511 100%
2,349 50% $107,378 78% 462,322 50% $30,134 22% 134,671 100% $137,511 100%
Annual Energy Consumption / Costs
Electric Misc.Electric For Cooling
Total Electric UsageTotal Gas Usage
Totals
Electric For HeatingLighting
Domestic Hot Water (Gas)Building Space Heating
Totals
Electric Misc.
Electric For Cooling
Electric For Heating
LightingDomestic Hot Water
(Gas)
Building Space
Heating (Gas)
Annual Energy Consumption (MMBtu)
Electric Misc.
Electric For Cooling
Electric For Heating
Lighting
Domestic Hot Water
(Gas)
Building Space
Heating (Gas)
Annual Energy Costs ($)

Steven Winter Associates, Inc. - LGEA Report Sussex Community College – Building B/C Page 9/64
ft yr compared to the national average of College/University buildings consuming 120.0 kBtu/sq ft yr. See ECM section for guidance on how to improve the building’s rating. Due to the nature of its calculation based upon a survey of existing buildings of varying usage, the national average for “Other” space types is very subjective, and is not an absolute bellwether for gauging performance. Additionally, should the Sussex Community College desire to improve the building energy use intensity there are other large scale and financially less advantageous improvements that can be made, such as envelope window, door and insulation upgrades that would help to improve the building.
Per the LGEA program requirements, SWA has assisted the Sussex Community College to create an ENERGY STAR® Portfolio Manager account and share the Administration and Art Gallery building facilities information to allow future data to be added and tracked using the benchmarking tool. SWA has shared this Portfolio Manager Account information with the Sussex Community College (user name of “Sussex Community College” with a password of “Sussex Community College”) and TRC Energy Services (user name of “TRC-LGEA”). Tariff analysis
As part of the utility bill analysis, SWA evaluated the current utility rates and tariffs. Tariffs are typically assigned to buildings based on size and building type. Tariff analysis is performed to determine if the rate that a building is contracted to pay with each utility provider is the best rate possible resulting in the lowest costs for electric and gas provision. Typically, the natural gas prices increase during the heating months when natural gas is used for heating. Some high gas price per therm fluctuations in the summer may be due to high energy costs that recently occurred and low use caps for the non-heating months.
0.02.04.06.08.0
10.012.014.016.018.020.0
Aug
-09
Sep
-09
Oct
-09
Nov
-09
Dec
-09
Jan-
10
Feb-
10
Mar
-10
Apr
-10
May
-10
Jun-
10
Jul-1
0
Site
Ene
rgy
Inte
nsity
(kB
tu/s
q ft.
)
Date (Month-Year)
Site Energy Intensity (kBtu/sq ft.)
Gas Energy IntensityElectric Energy Intensity

Steven Winter Associates, Inc. - LGEA Report Sussex Community College – Building B/C Page 10/64
Typically, electricity prices also increase during the cooling months when electricity is used for cooling. The supplier charges a market-rate price based on use, and the billing does not break down demand costs for all periods because usage and demand are included in the rate. Currently, the building is paying a general service rate for natural gas. Demand charges are not broken out in the bill. Thus the building pays for fixed costs such as meter reading charges during the summer months. The building is direct metered and currently purchases electricity at a general service rate for usage with an additional charge for electrical demand factored into each monthly bill. The general service rate for electric charges is market-rate based on usage and demand. Demand prices are reflected in the utility bills and can be verified by observing the price fluctuations throughout the year. Energy Procurement strategies
Billing analysis is conducted using an average aggregated rate that is estimated based on the total cost divided by the total energy usage per utility per 12 month period. Average aggregated rates do not separate demand charges from usage, and instead provide a metric of inclusive cost per unit of energy. Average aggregated rates are used in order to equitably compare building utility rates to average utility rates throughout the state of New Jersey. The average estimated NJ commercial utility rates for electric are $0.150/kWh, while Administration and Art Gallery building pays a rate of $0.156/kWh. The Administration and Art Gallery building annual electric utility costs are $4,130 higher, when compared to the average estimated NJ commercial utility rates. Electric bill analysis shows fluctuations up to 18% over the most recent 12 month period.
The average estimated NJ commercial utility rates for gas are $1.550/therm, while
0.020.040.060.080.0100.0120.0140.0160.0180.0200.0
$0.00$0.02$0.04$0.06$0.08$0.10$0.12$0.14$0.16$0.18$0.20
Aug
-09
Sep
-09
Oct
-09
Nov
-09
Dec
-09
Jan-
10Fe
b-10
Mar
-10
Apr
-10
May
-10
Jun-
10Ju
l-10
Elec
tric
Dem
and
(kW
)
Elec
tric
Pric
e ($
/kW
h)
Date (Month-Year)
Average Electric Price vs. Monthly Peak Demand(kW)
Electric Rate ($/kWh)Average NJ rate ($/kWh)Electric Demand (kW)

Steven Winter Associates, Inc. - LGEA Report Sussex Community College – Building B/C Page 11/64
Administration and Art Gallery building pays a competitive rate of $1.298/therm. Natural gas bill analysis shows fluctuations up to 55% over the most recent 12 month period.
Utility rate fluctuations may have been caused by adjustments between estimated and actual meter readings; others may be due to unusual high and recent escalating energy costs. SWA recommends that the Administration and Art Gallery building further explore opportunities of purchasing both natural gas and electricity from third-party suppliers in order to reduce rate fluctuation and ultimately reduce the annual cost of energy for the Administration and Art Gallery building. Appendix C contains a complete list of third-party energy suppliers for the Newton service area.
$0.00$0.20$0.40$0.60$0.80$1.00$1.20$1.40$1.60$1.80
Aug
-09
Sep
-09
Oct
-09
Nov
-09
Dec
-09
Jan-
10
Feb-
10
Mar
-10
Apr
-10
May
-10
Jun-
10
Jul-1
0Natu
ral G
as P
rice
($/th
erm
)
Date (Month-Year)
Annual Natural Gas Price ($/therm)
Natural Gas Rate ($/therm)Average NJ rate ($/therm)
Steven Winter Associates, Inc. - LGEA Report Sussex Community College – Building B/C Page 12/64
EXISTING FACILITY AND SYSTEMS DESCRIPTION
This section gives an overview of the current state of the facility and systems. Please refer to the Proposed Further Recommendations section for recommendations for improvement. Based on the visit from SWA on August 24, 27, and September 17, 2010, the following data was collected and analyzed.
Building Characteristics
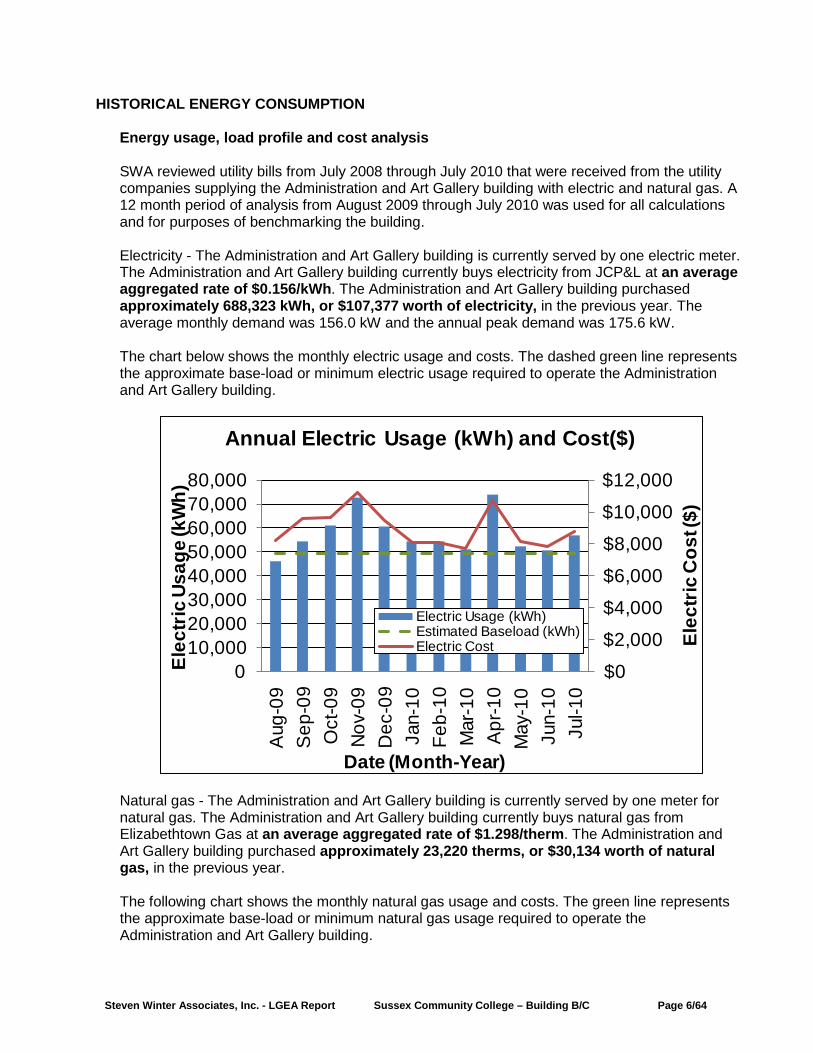
The three story with partial basement, 38,137 square foot Administration and Art Gallery building was originally built in 1960
with additions/renovations in 1998, 2000, 2004, and 2008. The Administration and Art Gallery building houses classrooms, art galleries, meeting rooms, storage spaces, mechanical rooms, IT area, executive offices, administrative offices, and bathrooms.
North East Façade and Main Entrance North West Façade
South West Façade South East Facing Façade Building Occupancy Profiles
There are approximately 100-140 people in the building at any given time; approximately 100 employees and 100 students when the Administration and Art Gallery building is in use weekdays from 8am through 10pm (approximately 80 hours/week on average). The Administration and Art Gallery building has 100 employees.
Building Envelope Due to unfavorable weather conditions (min. 18 deg. F delta-T in/outside and no/low wind), no exterior envelope infrared (IR) images were taken during the field audit.

Steven Winter Associates, Inc. - LGEA Report Sussex Community College – Building B/C Page 13/64
Exterior Walls
There are various types of exterior wall sections including the original building section with 5/8” lath and plaster interior with 6” CMU (Concrete Masonry Unit)
with no insulation. The exterior façade of this section consists of painted brick veneer or precast concrete. The newer wall sections contain 8” CMU, no insulation, 4” brick veneer and 5/8” gypsum board or painted CMU interiors. There is a small wall area at the entrance of the building consisting of painted plywood. There are some precast concrete exterior wall sections that are cracked or damaged (as seen in images below).
Note: Wall insulation levels
could not be verified in the field and are based on available construction plans or building management provided information.
Exterior and interior wall surfaces were inspected during the field audit. They were found to be in overall good, age-appropriate condition with
some signs of uncontrolled moisture, air-leakage or other energy-compromising issues detected on all facades.
The following specific exterior wall problem spots and areas were identified:
Insect burrowing in exterior wall
section near main entrance
Horizontal EIFS projections are directly exposed to the elements, lacking sufficient cover or flashing
Overgrown ground vegetation touching exterior wall surfaces
Horizontal CMU projections are directly exposed to the elements, lacking cover or flashing
Cracked stucco in overhang ceiling at main entrance to building

Steven Winter Associates, Inc. - LGEA Report Sussex Community College – Building B/C Page 14/64
Roof
The building’s roof is predominantly a flat, no parapet type over steel decking, with a dark-colored EPDM single membrane finish with gravel. There is a decorative metal seamed overhang on the C building section. This roof section was installed partially in 2006 and partially in 2008. One and a half inches of rigid
roof insulation was recorded. A smaller area of the roof is standing metal seam, pitched over 2-3” rigid insulation on plywood and steel decking.
Note: Roof insulation levels
could not be verified in the field, and are based on available construction plans and building management.
Roofs, related flashing, gutters and downspouts were inspected during the field audit. They were reported to be in overall good, age-appropriate condition, with
only a few signs of uncontrolled moisture, air-leakage or other energy-compromising issues.
Base The building’s base is composed of a below-grade basement with a slab floor with a perimeter footing with poured concrete foundation walls and no detectable slab edge/perimeter insulation
.
The building’s base and its perimeter were inspected for signs of uncontrolled moisture or water presence and other energy-compromising issues. Overall the base was reported to be in good condition with no signs of uncontrolled moisture, air-leakage and/or other energy-compromising issues neither visible on the interior nor exterior.
EPDM roof membrane with gravel
Pooled water without sufficient drainage pitch
Decorative metal seamed roof
Rotted plywood under ventilation fan
PV on roof

Steven Winter Associates, Inc. - LGEA Report Sussex Community College – Building B/C Page 15/64
Windows The building contains fixed, casement, and awning type windows with an aluminum clad frame, clear single glazing and interior mini blinds. The windows throughout the 3rd
floor of the building are the original 1960 windows. Many of the windows are inoperable, or difficult to operate. The perimeter caulking is cracked, brittle from age and weather, and should be replaced during the next major renovation as a capital improvement.
The 1st and 2nd
floor windows are tinted, low-E, insulated aluminum frame double pane windows, replaced during the 1995 renovation. They are fixed, awning, and casement style windows. These windows are in good condition.
Windows, shading devices, sills, related flashing and caulking were inspected as far as accessibility allowed for signs of moisture, air-leakage and other energy compromising issues. Overall, the windows were found to be in good condition with
no signs of uncontrolled moisture, air-leakage and/or other energy-compromising issues.
Older windows on 3rd floor, newer windows on 2nd
floor
Exterior doors The building contains
two different types of exterior doors:
• Two glass with aluminum/steel frame type exterior doors. They are located
in the front of the building and were replaced during renovations.
•
There are aluminum and metal doors located on the side entrances
Air-leakage at sleeved window/wall air-conditioning units
Cracked or aged caulk around frame/sill on the exterior
Single-glazed window with ineffective frame

Steven Winter Associates, Inc. - LGEA Report Sussex Community College – Building B/C Page 16/64
All exterior doors, thresholds, related flashing, caulking and weather-stripping were inspected for signs of moisture, air-leakage and other energy-compromising issues. Overall, the doors were found to be in acceptable/age appropriate condition with
only a few signs of uncontrolled moisture, air-leakage and/ or other energy-compromising issues.
Metal rusted door at side entrance
Building air-tightness Overall, the field auditors found the building to be reasonably air-tight with only a few areas of suggested improvements,
as described in more detail earlier in this chapter.
The air tightness of buildings helps maximize all other implemented energy measures and investments, and minimizes potentially costly long-term maintenance, repair and replacement expenses.
Mechanical Systems
Heating Ventilation Air Conditioning Part of the building is conditioned by one gas-fired packaged rooftop HVAC unit. The third floor is cooled by window air conditioners. There are two boilers that provide hot water for building heating. The faculty offices, on the lower level of the building are air conditioned by air handling units with direct expansion (DX) split cooling and hot water coils for heating. Equipment
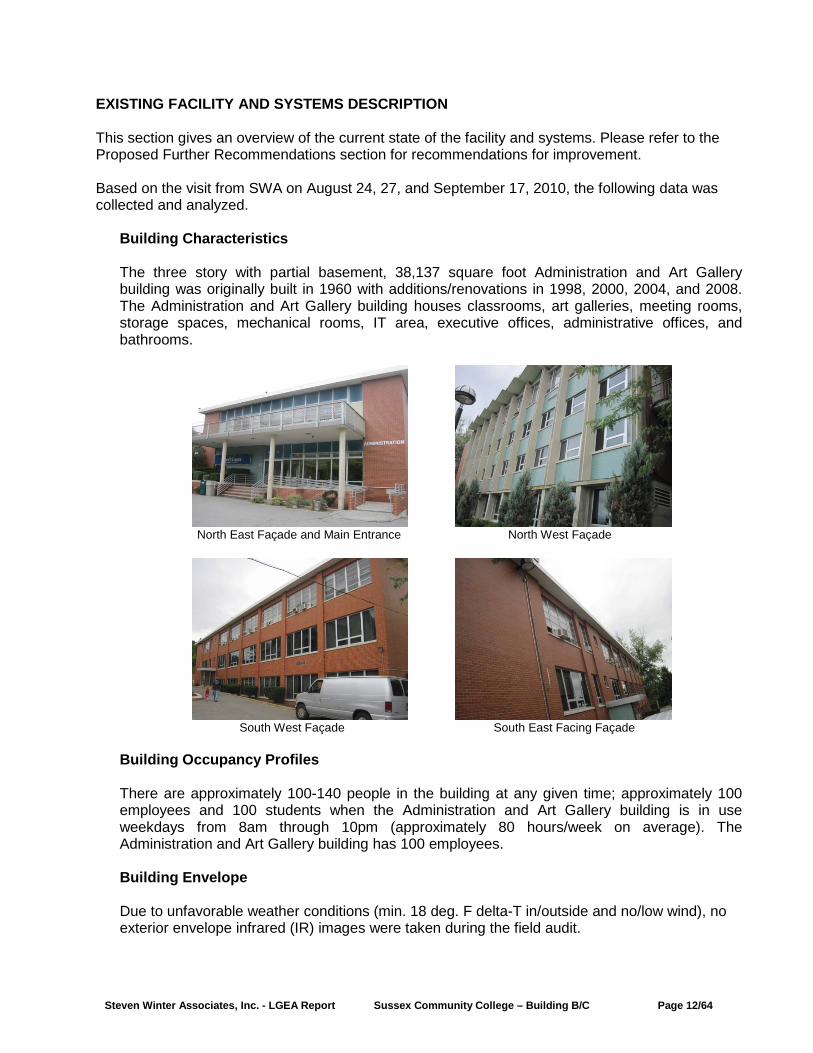
The B/C building contains a roof top packaged unit, air handling units, condensing units, boilers, and pumps. A comprehensive Equipment List can be found in Appendix A.
Two door types at side entrances of building in need of weather-stripping
Side door showing signs of rust

Steven Winter Associates, Inc. - LGEA Report Sussex Community College – Building B/C Page 17/64
There is one roof top gas fired packaged unit with a direct expansion (DX) system for cooling made up of an evaporator, condenser and refrigerant loop. It serves the IT area, business office, and art gallery. The unit was manufactured by Trane and installed in 2004. It has about 60% remaining service life and appears to be in good condition. It is a variable flow unit equipped with variable speed drives. The various spaces of the building are provided ventilation by outside air intake louvers on the rooftop units. The outside air louvers are motorized to allow economizer operation when the outside air conditions are favorable. The B/C building also contains two Magic-Air air handling units (AHUs) equipped with DX coils for cooling and hot water coils for heating the building. They serve the Faculty area. These were installed in 2005 and have about 67% of service life remaining. The units are in good condition. The various spaces of the building are provided ventilation by outside air intake louvers on these units. The units have two stages of cooling, and each stage is served by an independent condensing unit. There are four condensing units located outside on grade which are manufactured by Trane. These units have an efficiency of 10 SEER each and are in good condition.
Roof top packaged unit Air handling units Condensing Units
The heating hot water is produced by two (2) hot water boilers located in the boiler room. The boilers were manufactured by HB Smith and are rated for a capacity of 1,885 MBH each and were installed in the year 1961. They are operating beyond their expected service life of 23 years as published in the 2007 ASHRAE HVAC Applications Handbook. The burners were upgraded to Johnson Burners in the 1980’s to fire with natural gas. The third floor of the building is heated by hot water baseboards located under the windows. The baseboard units look in reasonable condition despite their age of about 30 years. The first floor of the building has perimeter hot water radiant panels on the perimeter which are in good condition. There are no hot water baseboards for spaces served by the roof top unit and by the Magic-Air units. The variable air volume (VAV) boxes are equipped with hot water coils. There are approximately 30 window air conditioners (WAC) serving the third floor. The WACs all have various capacities ranging from 1 ton to 2 tons of cooling, were installed in various years and have different manufacturing brands. Some of the WAC have ENERGY STAR®
labels.

Steven Winter Associates, Inc. - LGEA Report Sussex Community College – Building B/C Page 18/64
HB Smith Boilers Baseboard units Window Air Conditioners
There are seven roof mounted mushroom type exhaust fans which serve the bathrooms, mechanical room, and general building. Two of these fans are not in use anymore. All the exhaust fans are operating past their estimated service lives estimated to be ten years. Distribution Systems A typical rooftop unit arrangement draws in fresh air and brings it into a mixing box, where it is combined with return air from the building. A small portion of the return air is purged and vented outside prior to entering the mixing box. The mixed air inside the air handler is sent through a filter before passing through the evaporator or direct expansion (DX) coil. The air handler fan then pushes the air through the furnace section before the conditioned air is distributed into the building spaces. The DX system is only active in the cooling season. In between seasons only the blower will be active to provide fresh air to the building. There are five hot water pumps to provide hot water to the various heating coils, baseboards, and radiant panels. The pumps and respective motors are in good condition.
Hot water pumps
Controls There is a Trane Tracer building automation system (BAS) to monitor and control the HVAC equipment within the building. Reportedly, the BAS does not function as intended and is not programmed accurately to reflect the occupied and unoccupied modes. The winter night setback is maintained at 62 deg F, while the summer setback is maintained at 80 deg F. The equipment is not shut down during unoccupied modes in the summer and shoulder season. The baseboards are operated through the BAS and have no local temperature sensor for controls. Magic air units are similarly operated through the BAS, but

Steven Winter Associates, Inc. - LGEA Report Sussex Community College – Building B/C Page 19/64
there are temperature sensors located in the spaces served. There are multiple variable air volume (VAV) boxes which are connected to the BAS, which regulates the VAV dampers and VFD on the roof top unit. The boilers remain off during summer and there is no hot water supply to the VAV heating coils during summer. Window air conditioners are manually operated and meant to be turned off by the last person leaving. Domestic Hot Water There are two gas fired domestic hot water heaters in the building. The newer DHW was installed in 2007 and the older unit now remains as a back up. The older DHW is AO Smith, with 84 gallons tank and 199 MBH heating capacity. The newer DHW is also AO Smith, with 81 gallon tank and 199 MBH heating capacity. The estimated efficiency of the newer unit is about 82% and appears to be in satisfactory condition.
Domestic Hot Water Heaters
Electrical systems
Lighting See attached lighting schedule in Appendix B for a complete inventory of lighting throughout the building including estimated power consumption and proposed lighting recommendations. As of July 1, 2010 magnetic ballasts most commonly used for the operation of T12 lamps will no longer be produced for commercial and industrial applications. Also, many T12 lamps will be phased out of production starting July 2012. Interior Lighting - The Administration and Art Gallery building currently contains T12, T8, and a few halogen or incandescent lamps. Based on measurements of lighting levels for each space, there are no vastly over-illuminated areas.

Steven Winter Associates, Inc. - LGEA Report Sussex Community College – Building B/C Page 20/64
75w incandescent flood lamp found in track lighting in Gallery
Exit Lights - Exit signs were found to be LED type.
Exterior Lighting - The exterior lighting surveyed during the building audit was found to be a mix of Metal Halide and compact fluorescent fixtures. Exterior lights are on manual time clocks.
Exterior lighting time clock
Appliances and process
SWA has conducted a general survey of larger, installed equipment. Appliances and other miscellaneous equipment account for a significant portion of electrical usage within the building. Typically, appliances are referred to as “plug-load” equipment, since they are not inherent to the building’s systems, but rather plug into an electrical outlet. Equipment such as process motors, computers, computer servers, radio and dispatch equipment, refrigerators, vending machines, printers, etc… all create an electrical load on the building

Steven Winter Associates, Inc. - LGEA Report Sussex Community College – Building B/C Page 21/64
that is hard to separate out from the rest of the building’s energy usage based on utility analysis. Elevators The Administration and Art Gallery building is a two-story building with basement and one (three level) Schindler 2,500 lbs capacity hydraulic elevator with a 20 HP hydraulic pump driven by an Imperial Electric motor, Cat No. 217FAS0200001, Serial # 24MAY07. The elevator appears in satisfactory condition and no action is required at this time besides routine maintenance.
Other electrical systems The incoming power main transformer is owned/maintained by JCP&L and it appears in satisfactory condition. The building has photovoltaic panels located on the building roof to generate electricity. Please refer to the next section for details.

Steven Winter Associates, Inc. - LGEA Report Sussex Community College – Building B/C Page 22/64
RENEWABLE AND DISTRIBUTED ENERGY MEASURES Renewable energy is defined as any power source generated from sources which are naturally replenished, such as sunlight, wind and geothermal. Technology for renewable energy is improving, and the cost of installation is decreasing, due to both demand and the availability of state and federal government-sponsored funding. Renewable energy reduces the need for using either electricity or fossil fuel, therefore lowering costs by reducing the amount of energy purchased from the utility company. Technology such as photovoltaic panels or wind turbines, use natural resources to generate electricity on the site. Geothermal systems offset the thermal loads in a building by using water stored in the ground as either a heat sink or heat source. Solar thermal collectors heat a specified volume of water, reducing the amount of energy required to heat water using building equipment. Cogeneration or CHP allows you to generate electricity locally, while also taking advantage of heat wasted during the generation process. Existing systems
Currently, there is a solar photovoltaic renewable system installed at the Administration and Art Gallery building. Solar Photovoltaic Photovoltaic panels convert light energy received from the sun into a usable form of electricity. Panels can be connected into arrays and mounted directly onto building roofs, as well as installed onto built canopies over areas such as parking lots, building roofs or other open areas. Excess electricity generated from photovoltaic panels is sold back to the utility company through a net meter. Net-metering allows the utility to record the amount of electricity generated in order to pay credits to the consumer that can offset usage and demand costs on the electric bill. In addition to generation credits, the Sussex Community College is availing Solar Renewable Energy Credits (SRECs) that are subsidized by the state government. Specifically, the New Jersey State government pays a market-rate SREC to facilities that generate electricity in an effort to meet state-wide renewable energy requirements. The Administration and Art Gallery building has approximately 138 solar panels generating a maximum of 40 kW installed on the roof.
Solar PV panels on the building roof

Steven Winter Associates, Inc. - LGEA Report Sussex Community College – Building B/C Page 23/64
Evaluated Systems Solar Thermal Collectors Solar thermal collectors are not cost-effective for this building and would not be recommended due to the insufficient and intermittent use of domestic hot water throughout the building to justify the expenditure. Wind
The Administration and Art Gallery building is not a good candidate for wind power generation due to unfavorable wind conditions in this area of New Jersey, according to the following wind map by “Wind Powering America”, a US DOE analysis. Average wind speeds in Sussex County are less than 12mph, and most wind turbines tend to be efficient at speeds greater than this. Shown below are two wind maps for New Jersey with the location of Sussex Community College marked as a square.
New Jersey 50-Meter Wind Resource Maps New Jersey 30-Meter Wind Resource Maps
The first map shows the annual wind power estimates at 50 meters using NREL's standard classification system for utility-scale applications in relation to transmission lines and major cities. The second shows the annual wind speed estimates at 30 meters, which is useful for identifying areas that hold promise for small wind turbine applications. Wind speeds in Sussex County for both these type of applications are less than 12mph (5.3mph) and do not justify wind power systems. Please see the following for more details: http://www.windpoweringamerica.gov/where_is_wind_new_jersey.asp

Steven Winter Associates, Inc. - LGEA Report Sussex Community College – Building B/C Page 24/64
Geothermal The Administration and Art Gallery building is not a good candidate for a geothermal installation since it would require replacement of the entire existing HVAC system, of which major components still have 20% to 80% remaining useful lives. Estimated capital cost for installing a 100 ton geothermal heat pump system for this building is in the ball park of $1.1M, and estimated simple payback would be in excess of 20 years; however, for a new building, the simple payback for incremental cost and benefits over a conventional system is generally in the range of 4-6 years. Combined Heat and Power The Administration and Art Gallery building is not a good candidate for a CHP installation and would not be cost-effective due to the size and operations of the building. Typically, CHP is best suited for buildings with a high electrical base-load to accommodate the electricity generated, as well as a means for using waste heat generated. Typical applications include buildings with an absorption chiller, where waste heat would be used efficiently.

Steven Winter Associates, Inc. - LGEA Report Sussex Community College – Building B/C Page 25/64
PROPOSED ENERGY CONSERVATION MEASURES Energy Conservation Measures (ECMs) are recommendations determined for the building based on improvements over current building conditions. ECMs have been determined for the building based on installed cost, as well as energy and cost-savings opportunities. Recommendations: Energy Conservation Measures
In order to clearly present the overall energy opportunities for the building and ease the decision of which ECM to implement, SWA calculated each ECM independently and did not incorporate slight/potential overlaps between some of the listed ECMs (i.e. lighting change influence on heating/cooling.
EC
M #
Des
crip
tion
net e
st. E
CM
cos
t w
ith in
cent
ives
, $
kWh,
1st
yr s
avin
gs
ther
ms,
1st
yr
savi
ngs
kBtu
/sq
ft, 1
st y
r sa
ving
s
tota
l 1st
yr s
avin
gs,
$
life
of m
easu
re, y
rs
sim
ple
payb
ack,
yrs
annu
al re
turn
on
inve
stm
ent,
%
net p
rese
nt v
alue
, $
CO
2 re
duce
d, lb
s/yr
1 67 New CFL fixtures to be installed 627 10,243 0 0.9 1,933 5 0.3 342 8,175 18,341
2Retrofit (3) Beverage vending machines with Vending Miser™
597 4,836 0 0.4 754 10 0.8 116 5,773 8,659
3Retrofit (1) Snack Vending Machine with Snack Miser™
99 387 0 0.0 60 10 1.6 51 411 693
42 New Daylight Sensors to be installed with incentives
390 437 0 0.0 118 15 3.3 36 1,000 782
58 New motion sensors to be installed with incentives
1,600 8,195 0 0.7 1,278 15 1.3 73 13,443 14,673
676 New occupancy sensors to be installed with incentives
15,200 29,692 0 2.7 4,632 15 3.3 24 39,305 53,164
77 New bi-level fixtures to be installed with incentives
980 1,113 0 0.1 174 15 5.6 11 1,063 1,993
8124 New T8 fixtures to be installed with incentives
19,668 8,327 0 0.7 3,090 15 6.4 18 16,687 14,910
96 New photocells to be installed with incentives
1,200 965 0 0.1 150 15 8.0 6 571 1,727
106 New pulse start metal halide fixtures to be installed with incentives
4,238 2,190 0 0.2 377 15 11.2 3 204 3,921
11Provide demand controlled ventilation using Carbon Dioxide sensors
12,660 3,513 2740 7.5 4,105 12 3.1 24 27,713 36,493
12Install new Building Management System
150,000 39,170 1633 7.8 8,230 12 18.2 -3 -69,047 88,134
13Replace 40hp supply fan motor on packaged RTU with premium efficiency motor
2,727 9,251 0 0.8 1,443 15 1.9 46 14,255 16,564
14Replace 2 hp relief fan motor on packaged RTU with premium efficiency motor
1,286 1,948 0 0.2 304 15 4.2 17 2,290 3,488
15 Replace 2 existing hot water boilers 107,750 - 5000 13.1 7,990 30 13.5 5 44,885 55,115
16Replace 4 existing 10SEER condensing units
9,320 7,500 0 0.7 1,170 15 8.0 6 4,447 13,429
17 Replace windows on 3rd Floor 130,000 6,305 6305 17.1 9,167 30 14.2 4 45,129 80,789TOTALS 458,342 134,072 15,678 53.0 44,977 10.2 - - 412,875

Steven Winter Associates, Inc. - LGEA Report Sussex Community College – Building B/C Page 26/64
ECM#1: Install 67 New CFL Fixtures
During the field audit, SWA completed a building lighting inventory (see Appendix B). The existing lighting also contains inefficient incandescent lamps. SWA recommends that each incandescent lamp is replaced with a more efficient, Compact Fluorescent Lamp (CFL). CFLs are capable of providing equivalent or better light output while using less power when compared to incandescent, halogen and Metal Halide fixtures. CFL bulbs produce the same lumen output with less wattage than incandescent bulbs and last up to five times longer. The labor for the recommended installations is evaluated using prevailing electrical contractor wages. The building owner may decide to perform this work with in-house resources from the Maintenance Department on a scheduled, longer timeline than otherwise performed by a contractor. Installation cost: Estimated installed cost: $627 (Includes $125 of labor) Source of cost estimate: Manufacturers information Economics:
Des
crip
tion
est.
inst
alle
d co
st, $
est.
ince
ntiv
es, $
net e
st. E
CM
cos
t w
ith in
cent
ives
, $
kWh,
1st
yr s
avin
gs
kW, d
eman
d re
duct
ion/
mo
ther
ms,
1st
yr s
avin
gs
kBtu
/sq
ft, 1
st y
r sa
ving
s
est.
oper
atin
g co
st,
1st y
r sav
ings
, $
tota
l 1st
yr s
avin
gs, $
life
of m
easu
re, y
rs
est.
lifet
ime
cost
sa
ving
s, $
sim
ple
payb
ack,
yrs
annu
al re
turn
on
inve
stm
ent,
%
inte
rnal
rate
of r
etur
n,
%
net p
rese
nt v
alue
, $
CO
2
67 New CFL fixtures to be installed
redu
ced,
lbs/
yr
627 0 627 10,243 2.0 0 0.9 335 1,933 5 9,665 0.3 342 308 8,175 18,341
Assumptions: SWA calculated the savings for this measure using measurements taken during the field audit and using the billing analysis. SWA also assumed an aggregated 15 hrs/yr to replace aging burnt out lamps/fixtures vs. newly installed. Rebates/financial incentives: There is no incentive available for this measure at this time.
Please see Appendix F for more information on Incentive Programs.

Steven Winter Associates, Inc. - LGEA Report Sussex Community College – Building B/C Page 27/64
ECM#2: Retrofit 3 Existing Refrigerated Vending Machines with VendingMiser™ devices
Energy vending miser devices are now available for conserving energy used by beverage vending machines and coolers. There is not a need to purchase new machines to reduce operating costs and greenhouse gas emissions. When equipped with the vending miser devices, refrigerated beverage vending machines use less energy and are comparable in daily energy performance to new ENERGY STAR®
qualified machines. Vending miser devices incorporate innovative energy-saving technology into small plug-and-play devices that installs in minutes, either on the wall or on the vending machine. Vending miser devices use a Passive Infrared Sensor (PIR) to: Power down the machine when the surrounding area is vacant; Monitor the room's temperature; Automatically repower the cooling system at one- to three-hour intervals, independent of sales; Ensure the product stays cold.
Installation cost: Estimated installed cost: $597 (Includes $60 of labor) Source of cost estimate: Manufacturers information Economics:
Des
crip
tion
est.
inst
alle
d co
st, $
est.
ince
ntiv
es, $
net e
st. E
CM
cos
t w
ith in
cent
ives
, $
kWh,
1st
yr s
avin
gs
kW, d
eman
d re
duct
ion/
mo
ther
ms,
1st
yr s
avin
gs
kBtu
/sq
ft, 1
st y
r sa
ving
s
est.
oper
atin
g co
st,
1st y
r sav
ings
, $
tota
l 1st
yr s
avin
gs, $
life
of m
easu
re, y
rs
est.
lifet
ime
cost
sa
ving
s, $
sim
ple
payb
ack,
yrs
annu
al re
turn
on
inve
stm
ent,
%
inte
rnal
rate
of r
etur
n,
%
net p
rese
nt v
alue
, $
CO
2
Retrofit (3) Beverage vending machines with Vending Miser™
redu
ced,
lbs/
yr
597 0 597 4,836 1.0 0 0.4 0 754 10 7,544 0.8 116 126 5,773 8,659
Assumptions: SWA calculated the savings for this measure using measurements taken during the field audit and using the billing analysis. SWA assumes energy savings based on modeling calculator found at www.usatech.com or http://www.usatech.com/energy_management/energy_calculator.php .

Steven Winter Associates, Inc. - LGEA Report Sussex Community College – Building B/C Page 28/64
Rebates/financial incentives: NJ Clean Energy – Direct Install program (up to 60% of installed cost)
Please see Appendix F for more information on Incentive Programs and Appendix H for calculations.

Steven Winter Associates, Inc. - LGEA Report Sussex Community College – Building B/C Page 29/64
ECM#3: Install 1 Snack Vending Machine Energy Miser
Energy vending miser devices are now available for conserving energy used by beverage vending machines and coolers. There is not a need to purchase new machines to reduce operating costs and greenhouse gas emissions. Snack vending miser devices can be used on snack vending machines to achieve maximum energy savings that result in reduced operating costs and decreased greenhouse gas emissions with existing machines. Snack vending miser devices also use a Passive Infrared Sensor (PIR) to determine if there is anyone within 25 feet of the machine. It waits for 15 minutes of vacancy, then powers down the machine. If a customer approaches the machine while powered down, the snacks vending miser will sense the presence and immediately power up.
Installation cost: Estimated installed cost: $99 (Includes $20 of labor) Source of cost estimate: Manufacturers information Economics:
Des
crip
tion
est.
inst
alle
d co
st, $
est.
ince
ntiv
es, $
net e
st. E
CM
cos
t w
ith in
cent
ives
, $
kWh,
1st
yr s
avin
gs
kW, d
eman
d re
duct
ion/
mo
ther
ms,
1st
yr s
avin
gs
kBtu
/sq
ft, 1
st y
r sa
ving
s
est.
oper
atin
g co
st,
1st y
r sav
ings
, $
tota
l 1st
yr s
avin
gs, $
life
of m
easu
re, y
rs
est.
lifet
ime
cost
sa
ving
s, $
sim
ple
payb
ack,
yrs
annu
al re
turn
on
inve
stm
ent,
%
inte
rnal
rate
of r
etur
n,
%
net p
rese
nt v
alue
, $
CO
2
Retrofit (1) Snack Vending Machine with Snack Miser™
redu
ced,
lbs/
yr
99 0 99 387 0.1 0 0.0 0 60 10 604 1.6 51 60 411 693

Steven Winter Associates, Inc. - LGEA Report Sussex Community College – Building B/C Page 30/64
Assumptions: SWA calculated the savings for this measure using measurements taken during the field audit and using the billing analysis. SWA assumes energy savings based on modeling calculator found at www.usatech.com or http://www.usatech.com/energy_management/energy_calculator.php . Rebates/financial incentives: NJ Clean Energy – Direct Install program (Up to 60% of installed cost) Please see Appendix F for more information on Incentive Programs and Appendix H for calculations.

Steven Winter Associates, Inc. - LGEA Report Sussex Community College – Building B/C Page 31/64
ECM#4: Install 2 Day Lighting Sensors
During the field audit, SWA completed a building lighting inventory (see Appendix B). SWA observed that the existing lighting has minimal to no control via day lighting sensors. SWA identified a Hallway that could benefit from the installation of a day lighting sensor. SWA recommends installing one day lighting sensor where lighting fixtures are mounted above windows and where the payback on savings is justified. Ceiling mounted day light sensors measure the ambient light reflected from surfaces ranging from 0 to 6,500 foot candles. The labor for the recommended installations is evaluated using prevailing electrical contractor wages. The building owner may decide to perform this work with in-house resources from the Maintenance Department on a scheduled, longer timeline than otherwise performed by a contractor. Installation cost: Estimated installed cost: $390 (Includes $154 of labor) Source of cost estimate: Manufacturers information Economics:
Des
crip
tion
est.
inst
alle
d co
st, $
est.
ince
ntiv
es, $
net e
st. E
CM
cos
t w
ith in
cent
ives
, $
kWh,
1st
yr s
avin
gs
kW, d
eman
d re
duct
ion/
mo
ther
ms,
1st
yr s
avin
gs
kBtu
/sq
ft, 1
st y
r sa
ving
s
est.
oper
atin
g co
st,
1st y
r sav
ings
, $
tota
l 1st
yr s
avin
gs, $
life
of m
easu
re, y
rs
est.
lifet
ime
cost
sa
ving
s, $
sim
ple
payb
ack,
yrs
annu
al re
turn
on
inve
stm
ent,
%
inte
rnal
rate
of r
etur
n,
%
net p
rese
nt v
alue
, $
CO
2
2 New Daylight Sensors to be installed with incentives
redu
ced,
lbs/
yr
440 50 390 437 0.1 0 0.0 50 118 15 1,772 3.3 36 29 1,000 782
Assumptions: SWA calculated the savings for this measure using measurements taken during the field audit and using the billing analysis. Rebates/financial incentives: NJ Clean Energy - Daylight dimmers ($25 per fixture controlled) - Maximum incentive amount is $50.
Please see Appendix F for more information on Incentive Programs.

Steven Winter Associates, Inc. - LGEA Report Sussex Community College – Building B/C Page 32/64
ECM#5: Install 8 New Motion Sensors SWA recommends installing motion sensors in areas that are occupied only part of the day, and where payback on savings is justified. Typically, motion sensors have an adjustable time delay that shuts down the lights automatically if no motion is detected within a set time period. Advance micro-phonic lighting sensors include sound detection as a means to control lighting operation. Please see Appendix B for a detailed lighting inventory. Installation cost: Estimated installed cost: $1,600 (includes $616 of labor) Source of cost estimate: RS Means; Published and established costs, NJ Clean Energy Program, ENERGY STAR®
Economics:
Des
crip
tion
est.
inst
alle
d co
st, $
est.
ince
ntiv
es, $
net e
st. E
CM
cos
t w
ith in
cent
ives
, $
kWh,
1st
yr s
avin
gs
kW, d
eman
d re
duct
ion/
mo
ther
ms,
1st
yr s
avin
gs
kBtu
/sq
ft, 1
st y
r sa
ving
s
est.
oper
atin
g co
st,
1st y
r sav
ings
, $
tota
l 1st
yr s
avin
gs, $
life
of m
easu
re, y
rs
est.
lifet
ime
cost
sa
ving
s, $
sim
ple
payb
ack,
yrs
annu
al re
turn
on
inve
stm
ent,
%
inte
rnal
rate
of r
etur
n,
%
net p
rese
nt v
alue
, $
CO
2
8 New motion sensors to be installed with incentives
redu
ced,
lbs/
yr
1,760 160 1,600 8,195 1.6 0 0.7 0 1,278 15 19,176 1.3 73 80 13,443 14,673
Assumptions: SWA calculated the savings for this measure using measurements taken the days of the field visits and using the billing analysis. Rebates/financial incentives: NJ Clean Energy – Smart Start – Ceiling-mounted motion sensors ($20 per sensor). Maximum incentive amount is $160. Please see Appendix F for more information on Incentive Programs.

Steven Winter Associates, Inc. - LGEA Report Sussex Community College – Building B/C Page 33/64
ECM#6: Install 76 Lighting Occupancy Sensors
During the field audit, SWA completed a building lighting inventory (see Appendix B). SWA observed that the existing lighting has minimal to no control via occupancy sensors. SWA identified a number of areas that could benefit from the installation of occupancy sensors. SWA recommends installing occupancy sensors in areas that are occupied only part of the day and the payback on savings is justified. Typically, occupancy sensors have an adjustable time delay that shuts down the lights automatically if no motion is detected within a set time period. Advance micro-phonic lighting sensors include sound detection as a means to control lighting operation. The labor for the recommended installations is evaluated using prevailing electrical contractor wages. The building owner may decide to perform this work with in-house resources from the Maintenance Department on a scheduled, longer timeline than otherwise performed by a contractor. Installation cost: Estimated installed cost: $15,200 (Includes $5,852 of labor) Source of cost estimate: Manufacturers information Economics:
Des
crip
tion
est.
inst
alle
d co
st, $
est.
ince
ntiv
es, $
net e
st. E
CM
cos
t w
ith in
cent
ives
, $
kWh,
1st
yr s
avin
gs
kW, d
eman
d re
duct
ion/
mo
ther
ms,
1st
yr s
avin
gs
kBtu
/sq
ft, 1
st y
r sa
ving
s
est.
oper
atin
g co
st,
1st y
r sav
ings
, $
tota
l 1st
yr s
avin
gs, $
life
of m
easu
re, y
rs
est.
lifet
ime
cost
sa
ving
s, $
sim
ple
payb
ack,
yrs
annu
al re
turn
on
inve
stm
ent,
%
inte
rnal
rate
of r
etur
n,
%
net p
rese
nt v
alue
, $
CO
2
76 New occupancy sensors to be installed with incentives
redu
ced,
lbs/
yr
16,720 1,520 15,200 29,692 5.9 0 2.7 0 4,632 15 69,480 3.3 24 29 39,305 53,164
Assumptions: SWA calculated the savings for this measure using measurements taken during the field audit and using the billing analysis. Rebates/financial incentives: NJ Clean Energy - Occupancy sensors, wall mounted ($20 per control) - Maximum incentive amount is $1,520.
Please see Appendix F for more information on Incentive Programs.

Steven Winter Associates, Inc. - LGEA Report Sussex Community College – Building B/C Page 34/64
ECM#7: Install 7 New Bi-level T8 Fixtures in Stairwells On the day of the site visit, SWA completed a lighting inventory of Administration and Art Gallery building (see Appendix B). The building currently contains T12 and T8 fluorescent lighting fixtures that are operated 16 hours per day in stairwells. New technology called bi-level lighting, combines fluorescent lighting fixtures with an occupancy sensor. These efficient light fixtures operate at a minimal light level in order to meet code and safety requirements and power up to a higher level when any motion is detected in the stairwells. This building would be an appropriate application for these fixtures since there are large periods of time when the stairwells should be unoccupied. Installation cost: Estimated installed cost: $980 (includes $346 of labor) Source of cost estimate: RS Means; Published and established costs, NJ Clean Energy Program Economics:
Des
crip
tion
est.
inst
alle
d co
st, $
est.
ince
ntiv
es, $
net e
st. E
CM
cos
t w
ith in
cent
ives
, $
kWh,
1st
yr s
avin
gs
kW, d
eman
d re
duct
ion/
mo
ther
ms,
1st
yr s
avin
gs
kBtu
/sq
ft, 1
st y
r sa
ving
s
est.
oper
atin
g co
st,
1st y
r sav
ings
, $
tota
l 1st
yr s
avin
gs, $
life
of m
easu
re, y
rs
est.
lifet
ime
cost
sa
ving
s, $
sim
ple
payb
ack,
yrs
annu
al re
turn
on
inve
stm
ent,
%
inte
rnal
rate
of r
etur
n,
%
net p
rese
nt v
alue
, $
CO
2
7 New bi-level fixtures to be installed with incentives
redu
ced,
lbs/
yr
1,155 175 980 1,113 0.2 0 0.1 0 174 15 2,604 5.6 11 14 1,063 1,993
Assumptions: SWA calculated the savings for this measure using measurements taken the days of the field visits and using the billing analysis. SWA also assumed an aggregated 12 hrs/yr to replace aging burnt out lamps vs. newly installed. Rebates/financial incentives: NJ Clean Energy – SmartStart – bi-level T8 fluorescent fixtures ($25 per fixture). Maximum incentive amount is $175. Please see Appendix F for more information on Incentive Programs

Steven Winter Associates, Inc. - LGEA Report Sussex Community College – Building B/C Page 35/64
ECM#8: Install 124 New T8 Fixtures
During the field audit, SWA completed a building lighting inventory (see Appendix B). The existing lighting contains inefficient T12 fluorescent fixtures with magnetic ballasts. SWA recommends replacing each existing fixture with more efficient, T8 fluorescent fixtures with electronic ballasts. T8 fixtures with electronic ballasts provide equivalent or better light output while reducing energy consumption by 30% when compared to T12 fixtures with magnetic ballasts. T8 fixtures also provide better lumens for less wattage when compared to incandescent, halogen and Metal Halide fixtures. The labor for the recommended installations is evaluated using prevailing electrical contractor wages. The building owner may decide to perform this work with in-house resources from the Maintenance Department on a scheduled, longer timeline than otherwise performed by a contractor. Installation cost: Estimated installed cost: $19,668 (Includes $5,900 of labor) Source of cost estimate: Manufacturers information Economics:
Des
crip
tion
est.
inst
alle
d co
st, $
est.
ince
ntiv
es, $
net e
st. E
CM
cos
t w
ith in
cent
ives
, $
kWh,
1st
yr s
avin
gs
kW, d
eman
d re
duct
ion/
mo
ther
ms,
1st
yr s
avin
gs
kBtu
/sq
ft, 1
st y
r sa
ving
s
est.
oper
atin
g co
st,
1st y
r sav
ings
, $
tota
l 1st
yr s
avin
gs, $
life
of m
easu
re, y
rs
est.
lifet
ime
cost
sa
ving
s, $
sim
ple
payb
ack,
yrs
annu
al re
turn
on
inve
stm
ent,
%
inte
rnal
rate
of r
etur
n,
%
net p
rese
nt v
alue
, $
CO
2
124 New T8 fixtures to be installed with incentives
redu
ced,
lbs/
yr
21,528 1,860 19,668 8,327 1.7 0 0.7 1,791 3,090 15 46,344 6.4 18 11 16,687 14,910
Assumptions: SWA calculated the savings for this measure using measurements taken during the field audit and using the billing analysis. SWA also assumed an aggregated 5 hrs/yr to replace aging burnt out lamps/ballasts vs. newly installed. Rebates/financial incentives: NJ Clean Energy - Retrofit T12 with T8 fixtures with electronic ballasts ($15 per fixture) - Maximum incentive amount is $1,860.
Please see Appendix F for more information on Incentive Programs.

Steven Winter Associates, Inc. - LGEA Report Sussex Community College – Building B/C Page 36/64
ECM#9: Install 6 New Photocell Sensors On the day of the site visit, SWA completed a lighting inventory of the Administration and Art Gallery building (see Appendix B). The exterior lighting fixtures are currently operated by timers. SWA recommends installing photocell sensors in replacement of timers. Photocell sensors will help to reduce operating costs of lights left on during daytime hours. Installation cost: Estimated installed cost: $1,200 (includes $420 of labor) Source of cost estimate: RS Means; Published and established costs, NJ Clean Energy Program Economics:
Des
crip
tion
est.
inst
alle
d co
st, $
est.
ince
ntiv
es, $
net e
st. E
CM
cos
t w
ith in
cent
ives
, $
kWh,
1st
yr s
avin
gs
kW, d
eman
d re
duct
ion/
mo
ther
ms,
1st
yr s
avin
gs
kBtu
/sq
ft, 1
st y
r sa
ving
s
est.
oper
atin
g co
st,
1st y
r sav
ings
, $
tota
l 1st
yr s
avin
gs, $
life
of m
easu
re, y
rs
est.
lifet
ime
cost
sa
ving
s, $
sim
ple
payb
ack,
yrs
annu
al re
turn
on
inve
stm
ent,
%
inte
rnal
rate
of r
etur
n,
%
net p
rese
nt v
alue
, $
CO
2
6 New photocells to be installed with incentives
redu
ced,
lbs/
yr
1,320 120 1,200 965 0.2 0 0.1 0 150 15 2,257 8.0 6 7 571 1,727
Assumptions: SWA calculated the savings for this measure using measurements taken the days of the field visits and using the billing analysis. Rebates/financial incentives: NJ Clean Energy – Smart Start – Photocell sensors in existing facilities ($20 per control). Maximum incentive amount is $120. Please see Appendix F for more information on Incentive Programs.

Steven Winter Associates, Inc. - LGEA Report Sussex Community College – Building B/C Page 37/64
ECM#10: Install 6 New Pulse Start Metal Halide Fixtures
During the field audit, SWA completed a building interior as well as exterior lighting inventory (see Appendix B). The existing lighting contains standard probe start Metal Halide (MH) lamps. SWA recommends replacing the higher wattage MH fixtures with pulse start MH lamps which offer the advantages of standard probe start MH lamps, but minimize the disadvantages. They produce higher light output both initially and over time, operate more efficiently, produce whiter light, and turn on and re-strike faster. Due to these characteristics, energy savings can be realized via one-to-one substitution of lower-wattage systems, or by taking advantage of higher light output and reducing the number of fixtures required in the space. The labor for the recommended installations is evaluated using prevailing electrical contractor wages. The building owner may decide to perform this work with in-house resources from the Maintenance Department on a scheduled, longer timeline than otherwise performed by a contractor. Installation cost: Estimated installed cost: $4,238 (Includes $1,316 of labor) Source of cost estimate: Manufacturers information Economics:
Des
crip
tion
est.
inst
alle
d co
st, $
est.
ince
ntiv
es, $
net e
st. E
CM
cos
t w
ith in
cent
ives
, $
kWh,
1st
yr s
avin
gs
kW, d
eman
d re
duct
ion/
mo
ther
ms,
1st
yr s
avin
gs
kBtu
/sq
ft, 1
st y
r sa
ving
s
est.
oper
atin
g co
st,
1st y
r sav
ings
, $
tota
l 1st
yr s
avin
gs, $
life
of m
easu
re, y
rs
est.
lifet
ime
cost
sa
ving
s, $
sim
ple
payb
ack,
yrs
annu
al re
turn
on
inve
stm
ent,
%
inte
rnal
rate
of r
etur
n,
%
net p
rese
nt v
alue
, $
CO
2
6 New pulse start metal halide fixtures to be installed with incentives
redu
ced,
lbs/
yr
4,388 150 4,238 2,190 0.4 0 0.2 36 377 15 5,662 11.2 3 1 204 3,921
Assumptions: SWA calculated the savings for this measure using measurements taken during the field audit and using the billing analysis. SWA also assumed an aggregated 2 hrs/yr to replace aging burnt out lamps/ballasts vs. newly installed. Rebates/financial incentives: NJ Clean Energy - Pulse Start Metal Halide ($25 per fixture) - Maximum incentive amount is $150.
Please see Appendix F for more information on Incentive Programs.

Steven Winter Associates, Inc. - LGEA Report Sussex Community College – Building B/C Page 38/64
ECM#11: Provide Demand Control Ventilation using Carbon Dioxide Sensors The roof top unit serving the lower floors provides a fixed amount of outside air during operational hours. Conditioning outside air can be a significant portion of the heating or cooling load. Demand control ventilation involves providing carbon dioxide (CO2) sensors in the occupied spaces or return ducts which can partially or totally shut down the outside air intake dampers in the air handling unit when the space is underutilized or unoccupied. The spaces served are used frequently but may also remain vacant for long periods during the day. By keeping the CO2 level less than 1000ppm within the conditioned space, the outside air is reduced to the minimum allowable in compliance with ASHRAE requirements. This control method can greatly reduce the heating or cooling load seen by the roof top unit and therefore save energy. Along with the two carbon dioxide sensors on each floor (total of eight), necessary motorized air intake dampers and a controller will also have to be installed. Installation cost: Estimated installed cost: $12,660 (includes $5,500 labor) Source of cost estimate: RS Means Cost Data & Similar Projects Economics:
Des
crip
tion
est.
inst
alle
d co
st, $
est.
ince
ntiv
es, $
net e
st. E
CM
cos
t w
ith in
cent
ives
, $
kWh,
1st
yr s
avin
gs
kW, d
eman
d re
duct
ion/
mo
ther
ms,
1st
yr s
avin
gs
kBtu
/sq
ft, 1
st y
r sa
ving
s
est.
oper
atin
g co
st,
1st y
r sav
ings
, $
tota
l 1st
yr s
avin
gs, $
life
of m
easu
re, y
rs
est.
lifet
ime
cost
sa
ving
s, $
sim
ple
payb
ack,
yrs
annu
al re
turn
on
inve
stm
ent,
%
inte
rnal
rate
of r
etur
n,
%
net p
rese
nt v
alue
, $
CO
2
Provide demand controlled ventilation using Carbon Dioxide sensors
redu
ced,
lbs/
yr
12,660 0 12,660 3,513 0.7 2,740 7.5 0 4,105 12 49,255 3.1 24 31 27,713 36,493
Assumptions: SWA calculated the savings for this measure using nameplate data taken and using the billing analysis. SWA estimated the savings using bin data and assumed 10% outside air savings during occupied hours and 50% outside air savings during unoccupied modes. Roof top unit operates round the clock; SWA estimated hours of use during occupied mode as 5,500 hours. Rebates/financial incentives: There are no incentives available for this measure at this time from New Jersey Clean energy Program (NJCEP).

Steven Winter Associates, Inc. - LGEA Report Sussex Community College – Building B/C Page 39/64
ECM#12: Install new Building Management System
There is an existing Trane Tracer building management system. The existing system is not programmed correctly and many sensors and actuators don’t report data into this system. The current system is inadequate to handle the building needs of a tight HVAC controls, and has limited capability for setting occupied/unoccupied mode settings. SWA recommends the Sussex Community College to install a new Direct Digital Control (DDC) Building Automation System (BAS). The new BAS should be open source and be compatible with the existing state of art Automated Logic BMS at the A building. The BAS should be programmable with occupied/unoccupied modes settings and with night-setback schedules for building HVAC system. Space temperature sensors individually and collectively should report to the BAS, which in turn would control the heating and cooling valves on HVAC equipment. The new system would operate the HVAC system tightly and reduce wasteful energy. Savings in therms and kWh will be realized mainly from reducing the hours of operation of the roof top unit, resulting in ventilation load savings and fan savings. Installation cost: Estimated installed cost: $150,000 (estimated labor cost $80,000) Source of cost estimate: Similar projects Economics:
Des
crip
tion
est.
inst
alle
d co
st, $
est.
ince
ntiv
es, $
net e
st. E
CM
cos
t w
ith in
cent
ives
, $
kWh,
1st
yr s
avin
gs
kW, d
eman
d re
duct
ion/
mo
ther
ms,
1st
yr s
avin
gs
kBtu
/sq
ft, 1
st y
r sa
ving
s
est.
oper
atin
g co
st,
1st y
r sav
ings
, $
tota
l 1st
yr s
avin
gs, $
life
of m
easu
re, y
rs
est.
lifet
ime
cost
sa
ving
s, $
sim
ple
payb
ack,
yrs
annu
al re
turn
on
inve
stm
ent,
%
inte
rnal
rate
of r
etur
n,
%
net p
rese
nt v
alue
, $
CO
2
Install new Building Management System
redu
ced,
lbs/
yr
150,000 0 150,000 39,170 7.8 1,633 7.8 0 8,230 12 98,762 18.2 -3 -6 -69,047 88,134
Assumptions: SWA calculated the savings for this measure using nameplate data taken and using the billing analysis. SWA estimated the savings using bin data calculations. It is assumed that the new BMS would completely shut down the unit and the fans during summer and shoulder seasons during unoccupied modes. Approximately 2,000 hours of unit run time is estimated to be saved thus. The BMS for this building is assumed to be a part of the larger campus wide BMS, which incorporates lighting controls too; the lighting cost component of the BMS was excluded for calculations in this ECM. Rebates/financial incentives: There are no incentives available for this measure at this time from New Jersey Clean energy Program (NJCEP).

Steven Winter Associates, Inc. - LGEA Report Sussex Community College – Building B/C Page 40/64
ECM#13 & 14: Install NEMA Premium Efficiency Motors
Electric motors have a significant impact on the total energy operating costs in a building, and may vary widely in terms of energy efficiency. The NEMA Premium Motors energy efficiency program was established to assist users to optimize motor systems efficiency in light of power supply and utility deregulation issues. NEMA Premium motors help to optimize systems, thereby reducing electrical consumption and reducing pollution associated with electrical power generation. SWA noted that supply fan and relief fan motors on the roof top unit are of standard efficiency. SWA recommends replacing these motors with premium efficiency motors. Installation cost: Estimated installed cost: $4,013 (estimated labor cost $350) Source of cost estimate: Similar projects and DOE Motor Master International selection & savings analysis Economics:
Des
crip
tion
est.
inst
alle
d co
st, $
est.
ince
ntiv
es, $
net e
st. E
CM
cos
t w
ith in
cent
ives
, $
kWh,
1st
yr s
avin
gs
kW, d
eman
d re
duct
ion/
mo
ther
ms,
1st
yr s
avin
gs
kBtu
/sq
ft, 1
st y
r sa
ving
s
est.
oper
atin
g co
st,
1st y
r sav
ings
, $
tota
l 1st
yr s
avin
gs, $
life
of m
easu
re, y
rs
est.
lifet
ime
cost
sa
ving
s, $
sim
ple
payb
ack,
yrs
annu
al re
turn
on
inve
stm
ent,
%
inte
rnal
rate
of r
etur
n,
%
net p
rese
nt v
alue
, $
CO
2
Replace 40hp supply fan motor on packaged RTU with premium efficiency motor
redu
ced,
lbs/
yr
2,907 180 2,727 9,251 1.9 0 0.8 0 1,443 15 21,647 1.9 46 53 14,255 16,564
Replace 20 hp relief fan motor on packaged RTU with premium efficiency motor
1,411 125 1,286 1,948 0.4 0 0.2 0 304 15 4,558 4.2 17 21 2,290 3,488
Assumptions: SWA calculated the savings for this measure using nameplate data taken and using the billing analysis. The DOE Motor Master International selection and calculator was used considering equipment should operate for approximately 75% loading factor. Use hours were estimated to be 8760 hours for supply fan motor and 5,000 hours for the relief fan motor. Rebates/financial incentives: NJ Clean Energy - Premium three-phase motors ($45-$700 per motor); for 20 hp motors - $125/motor, and for 40 hp motor - $180/motor; maximum incentive available is $305.

Steven Winter Associates, Inc. - LGEA Report Sussex Community College – Building B/C Page 41/64
ECM #15: Replace Existing Hot Water Boilers (2)
The existing HB Smith boilers were installed in 1960s and have passed the end of their useful life. SWA recommends replacing both boilers under this measure. The initial efficiency of the existing boiler was approximately 80%, which is now estimated to be only around 65% due to performance degradation over time. SWA analyzed the economics of replacing and upgrading the boiler with new condensing technology. Condensing boilers allow condensation of moisture in flue gases resulting in lower flue gas temperatures with increased efficiencies up to 95%. The new high efficiency condensing boilers should have a guaranteed minimum thermal efficiency of 85% and efficiencies of up to 95% achievable during condensing mode at lower return water temperatures. Suggested new boiler capacity is about 1,500 MBH each. Installation cost Estimated installed cost: $107,750 (estimated labor cost of $38,500) Source of cost estimate: RS Means and similar projects Economics:
Des
crip
tion
est.
inst
alle
d co
st, $
est.
ince
ntiv
es, $
net e
st. E
CM
cos
t w
ith in
cent
ives
, $
kWh,
1st
yr s
avin
gs
kW, d
eman
d re
duct
ion/
mo
ther
ms,
1st
yr s
avin
gs
kBtu
/sq
ft, 1
st y
r sa
ving
s
est.
oper
atin
g co
st,
1st y
r sav
ings
, $
tota
l 1st
yr s
avin
gs, $
life
of m
easu
re, y
rs
est.
lifet
ime
cost
sa
ving
s, $
sim
ple
payb
ack,
yrs
annu
al re
turn
on
inve
stm
ent,
%
inte
rnal
rate
of r
etur
n,
%
net p
rese
nt v
alue
, $
CO
2
Replace 2 existing hot water boilers
redu
ced,
lbs/
yr
113,000 5,250 107,750 - 0.0 5,000 13.1 1,500 7,990 30 239,700 13.5 5 -2 44,885 55,115
Assumptions: SWA assumed the efficiency of the new condensing boilers as 90% for calculating the therms saved, and that of the existing boiler as 65%. Further, SWA estimated the current boilers’ contribution of total heat to the building in the proportion of installed capacity of the boilers and the roof top unit. Rebates/financial incentives: NJ Clean Energy - Gas-fired boilers ≤ 1500 MBH and 90%+ AFUE ($1.75 per MBH) – Maximum incentive amount is $5,250.

Steven Winter Associates, Inc. - LGEA Report Sussex Community College – Building B/C Page 42/64
ECM#16: Replace Four (4) 10SEER Condensing Units SWA recommends replacing the existing 2.5 ton condensing units serving floors 1C with ENERGY STAR® rated condensing units with higher operating efficiencies. A split-system central air conditioner consists of an outdoor metal cabinet called the condensing unit which contains the condenser coil and compressor, and an indoor cabinet contains the evaporator coil and supply air fan. Central air conditioners are rated according to their seasonal energy efficiency ratio (SEER - Btu/Watt-hr), which indicates the relative amount of energy needed to provide a specific cooling output. Each existing condensing unit has an estimated SEER rating of 10; the minimum SEER allowed today is 13. ENERGY STAR® label central air conditioners with SEER ratings of 13 or greater, and up to 16 SEER condensing units are now available. More information can be found in the “Products” section of the ENERGY STAR® website at: http://www.energystar.gov. SWA recommends 14 SEER units or greater. Installation cost: Estimated installed cost: $9,320 (includes $280 of labor) Source of cost estimate: Manufacturer’s data and similar projects Economics:
Des
crip
tion
est.
inst
alle
d co
st, $
est.
ince
ntiv
es, $
net e
st. E
CM
cos
t w
ith in
cent
ives
, $
kWh,
1st
yr s
avin
gs
kW, d
eman
d re
duct
ion/
mo
ther
ms,
1st
yr s
avin
gs
kBtu
/sq
ft, 1
st y
r sa
ving
s
est.
oper
atin
g co
st,
1st y
r sav
ings
, $
tota
l 1st
yr s
avin
gs, $
life
of m
easu
re, y
rs
est.
lifet
ime
cost
sa
ving
s, $
sim
ple
payb
ack,
yrs
annu
al re
turn
on
inve
stm
ent,
%
inte
rnal
rate
of r
etur
n,
%
net p
rese
nt v
alue
, $
CO
2
Replace 4 existing 10SEER condensing units
redu
ced,
lbs/
yr
10,240 920 9,320 7,500 1.5 0 0.7 0 1,170 15 17,550 8.0 6 7 4,447 13,429
Assumptions: SWA calculated the savings for this measure using nameplate data taken and using the billing analysis. SWA estimated annual electric savings calculated from ENERGY STAR®
online calculator.
Rebates/financial incentives: NJ Clean Energy – Unitary HVAC/Split Systems, 14 SEER minimum, $73- $92/ton; maximum incentive available is $920.

Steven Winter Associates, Inc. - LGEA Report Sussex Community College – Building B/C Page 43/64
ECM#17: Replace windows on 3rd
floor
The building contains fixed, casement, and awning type windows with an aluminum clad frame, clear single glazing and interior mini blinds. The windows throughout the 3rd floor of the building are the original 1960 windows. Many of the windows are inoperable, or difficult to operate. Further, the perimeter caulking is cracked and has become brittle from age and weather. A single pane window has little insulating value and acts as a thin barrier to the outside thus wasting useful heat during winter season. Double pane windows are more energy efficient because less heat leaves through a double pane window than through a single pane window. Double pane windows are built with a gap of air between two panes of glass and acts as an insulator. SWA recommends the Sussex Community College to replace approximately 65 windows on the 3rd
floor with double pane windows.
Installation cost: Estimated installed cost: $130,000 (includes $55,000 of labor) Source of cost estimate: Similar projects Economics:
Des
crip
tion
est.
inst
alle
d co
st, $
est.
ince
ntiv
es, $
net e
st. E
CM
cos
t w
ith in
cent
ives
, $
kWh,
1st
yr s
avin
gs
kW, d
eman
d re
duct
ion/
mo
ther
ms,
1st
yr s
avin
gs
kBtu
/sq
ft, 1
st y
r sa
ving
s
est.
oper
atin
g co
st,
1st y
r sav
ings
, $
tota
l 1st
yr s
avin
gs, $
life
of m
easu
re, y
rs
est.
lifet
ime
cost
sa
ving
s, $
sim
ple
payb
ack,
yrs
annu
al re
turn
on
inve
stm
ent,
%
inte
rnal
rate
of r
etur
n,
%
net p
rese
nt v
alue
, $
CO
2
Replace windows on 3rd Floor
redu
ced,
lbs/
yr
130,000 0 130,000 6,305 1.3 6305 17.1 0 9,167 30 275,024 14.2 4 -2 45,129 80,789
Assumptions: SWA calculated the savings for this measure using nameplate data taken and using the billing analysis. SWA estimated annual electric savings and gas savings based on HDD and CDD calculations based in Newark, NJ. Rebates/financial incentives: There are no incentives available for this measure at this time from New Jersey Clean energy Program (NJCEP). Please see Appendix F for more information on Incentive Programs.

Steven Winter Associates, Inc. - LGEA Report Sussex Community College – Building B/C Page 44/64
PROPOSED FURTHER RECOMMENDATIONS Capital Improvements Capital Improvements are recommendations for the building that may not be cost-effective at the current time, but that could yield a significant long-term payback. These recommendations should typically be considered as part of a long-term capital improvement plan. Capital improvements should be considered if additional funds are made available, or if the installed costs can be shared with other improvements, such as major building renovations. SWA recommends the following capital improvements for the Administration and Art Gallery building: • Replace exhaust fans- There are seven roof mounted mushroom type exhaust fans which serve
the bathrooms, mechanical room, and general building. Two of these fans are not in use anymore. The two disconnected units should be removed and roof penetrations should be thermally sealed. SWA recommends replacing the remaining five exhaust fans which are operating past their estimated service lives of ten years. The estimated installed cost of five new fans is $2,000.
• Replace window air conditioners - There are approximately 30 window air conditioners (WAC) serving the third floor. The WACs all have various capacities ranging from 1 ton through 2 tons of cooling, and were manufactured by various manufacturers, and installed at various times in the past. These are manually controlled and there is a good likelihood that the last person leaving may not turn off the unit. SWA recommends replacing all WACs with a central air system comprising a gas fired roof top packaged unit and variable air volume boxes serving each classroom, similar to the system already existing serving lower floors. The new system would cost approximately $225,000 and has an estimated simply pay back of 40 years or more.
• Install premium motors when replacements are required - Select NEMA Premium motors when replacing motors that have reached the end of their useful operating lives.
• Install waterless urinals campus-wide - Typical paybacks range from 1-3 years based on typical water and sewer savings, depending on use.
Operations and Maintenance Operations and Maintenance measures consist of low/no cost measures that are within the capability of the current building staff to handle. These measures typically require little investment, and they yield a short payback period. These measures may address equipment settings or staff operations that, when addressed will reduce energy consumption or costs.
• Maintain roofs - SWA recommends regular maintenance to verify water is draining correctly and
drains are cleaned.
• Maintain downspouts and cap flashing - Repair/install missing downspouts and cap flashing as needed to prevent water/moisture infiltration and insulation damage.
• Provide weather-stripping/air-sealing - SWA observed that exterior door weather-stripping was beginning to deteriorate in places. Doors and vestibules should be observed annually for deficient weather-stripping and replaced as needed. The perimeter of all window frames should also be regularly inspected, and any missing or deteriorated caulking should be re-caulked to

Steven Winter Associates, Inc. - LGEA Report Sussex Community College – Building B/C Page 45/64
provide an unbroken seal around the window frames. Any other accessible gaps or penetrations in the thermal envelope penetrations should also be sealed with caulk or spray foam.
• Repair/seal wall cracks and penetrations - SWA recommends as part of the maintenance program installing proper flashing and correct masonry efflorescence, and sealing wall cracks and penetrations wherever necessary in order to keep insulation dry and effective.
• Provide water-efficient fixtures and controls - Adding controlled on/off timers on all lavatory faucets is a cost-effective way to reduce domestic hot water demand and save water. Building staff can also easily install faucet aerators and/or low-flow fixtures to reduce water consumption. There are many retrofit options, which can be installed now or incorporated as equipment is replaced. Routine maintenance practices that identify and quickly address water leaks are a low-cost way to save water and energy. Retrofitting with more efficient water-consumption fixtures/appliances will reduce energy consumption for water heating, while also decreasing water/sewer bills. SWA recommends replacing the 2.2 gpm aerators in the bathrooms with 0.5 gpm faucets in bathrooms.
• SWA recommends that the building considers purchasing the most energy-efficient equipment,
including ENERGY STAR® labeled appliances, when equipment is installed or replaced. More information can be found in the “Products” section of the ENERGY STAR® website at: http://www.energystar.gov
.
• Use smart power electric strips - in conjunction with occupancy sensors to power down computer equipment when left unattended for extended periods of time.
• Create an energy educational program - that teaches how to minimize energy use. The U.S. Department of Energy offers free information for hosting energy efficiency educational programs and plans. For more information please visit: http://www1.eere.energy.gov/education/.
• Change filters on air handling and rooftop package units monthly to ensure efficient operation of
the blowers and ensure adequate air delivery to the spaces.
• Tighten belts on exhaust fans and blowers every three to six months - Tightening belts on belt-driven fans/blowers can maximize the overall efficiency of the equipment.
• Inspect air handling and rooftop package units’ coils for dirt buildup three to six months. These
conditions should be rectified if found because they will cause inefficient operation and possibly damage to the equipment.
The recommended ECMs and the list above are cost-effective energy efficiency measures and building upgrades that will reduce operating expenses for Sussex Community College. Based on the requirements of the LGEA program, Sussex Community College must commit to implementing some of these measures, and must submit paperwork to the Local Government Energy Audit program within one year of this report’s approval to demonstrate that they have spent, net of other NJCEP incentives, at least 25% of the cost of the audit (per building). The minimum amount to be spent, net of other NJCEP incentives, is $2,239 (or 25% of $8,956).
Steven Winter Associates, Inc. - LGEA Report Sussex Community College – Building B/C Page 46/64
APPENDIX A: EQUIPMENT LIST Inventory
Building System
Description Location Model# Fuel Space served Year Equip Installed
Remaining useful life %
HVAC Roof top packaged unit, gas fired heating, DX cooling, 75 tons cooling, R-22, 13000/8200 cfm/OA cfm, 40hp motor for supply fan, standard eff., 20hp relief fan motor
Roof Trane, model SFHFC75EH666C#AD9001A0Z00GL0NRT0Y8000#, S/N C04F05314
Gas/Elec.
Floors 1B, 2B, 2C, and mezzanine
2004 60%
Ventilation Roof mounted mushroom type exhaust fan
Roof Dayton, model 4YC68G, S/N 11511550 0809
Elec. New Bathrooms, B building
2009 90%
Ventilation Roof mounted mushroom type exhaust fan, est. 1/2 hp motor
Roof Penn, model LB 452 Elec. NIU est. 1998 0%
Ventilation Roof mounted mushroom type exhaust fan
Roof Nameplate N/A Elec. Lab exhaust; NIU
est. 1998 0%
Ventilation Roof mounted mushroom type exhaust fan
Roof Penn, model 4HX98B Elec. Bathrooms, B building
est. 1998 0%
Ventilation Roof mounted mushroom type exhaust fan, est. 1/2 hp motor
Roof Penn, model LB 452 Elec. President's office, board room
est. 1998 0%
Ventilation Roof mounted mushroom type exhaust fan, est. 1/2 hp motor
Roof Penn, model LB 452 Elec. Photography lab est. 1998 0%
DHW Domestic water heater, 199MBH in, 84 gallon tank, est. 75% eff.
Boiler room AO Smith, model BT 199 880, S/N MK91-0210470-880
Gas Used as a backup to the new DHW
1991 0%
DHW Domestic water heater, 199MBH in, 81 gallon tank, est. 82% eff.
Boiler room AO Smith, model BTR 199 118, S/N H07M005889
Gas Whole building 2007 77%
PV Utility interactive 3 phase inverter
Boiler room Xantrex, model PV-45208, S/N 3097
Elec. Whole building 2007 88%
Heating Hot water boiler, 12 sections heating, 1885MBH in, c/w Johnson Burner, type DH FG4GM, installed in late 1980s
Boiler room HB Smith, 450 Mills, S/N 04982
Gas Whole building est. 1961 0%
Heating Hot water boiler, 12 sections heating, 1885MBH in, c/w Johnson Burner, type DH FG4GM, installed in late 1980s
Boiler room HB Smith, 450 Mills, S/N 04982
Gas Whole building est. 1961 0%
DHW Domestic hot water circulation pump, 1/8HP, 115/1/60, 1.76A
Boiler room Taco, model 0011-BF4 Elec. Whole building 2007 85%
Heating Hot water pump, size 1.5X1.5.8, 50gpm @ 48' head, 1800rpm, 2hp motor, US Motor, model G154, 208-230/3/60, NEMA 80% eff.
Boiler room Armstrong, model 4380BF, S/N 0604
Elec. Hot water coils on VAVs
2005 75%
Heating Hot water pump, size 1.5X1.5.8, 50gpm @ 48' head, 1800rpm, 2hp motor, US Motor, model G154, 208-230/3/60, NEMA 80% eff.
Boiler room Armstrong, model 4380BF, S/N 0604
Elec. Hot water coils on VAVs
2005 75%

Steven Winter Associates, Inc. - LGEA Report Sussex Community College – Building B/C Page 47/64
Note: The remaining useful life of a system (in %) is an estimate based on the system date of built and existing conditions derived from visual inspection.
Building System
Description Location Model# Fuel Space served Year Equip Installed
Remaining useful life %
Heating ITT B&G motor, 3/4HP, 1750rpm, 208/3/60
Boiler room ITT Bell & Gossett, size 37T, Part no. M80039
Elec. Baseboard heaters
est. 1998 40%
Heating ITT B&G motor, 3/4HP, 1750rpm, 208/3/60
Boiler room ITT Bell & Gossett, size 37T, Indent no. MAG00G-7606B
Elec. Baseboard heaters
est. 1998 40%
Heating ITT B&G motor, 3/4HP est., 1750rpm, 208/3/60
Boiler room ITT Bell & Gossett, nameplate N/A
Elec. Baseboard heaters
est. 1998 40%
HVAC Air handler #1, 54MBH cooling, 70.2MBH heating, 1500cfm, 340cfm OA, 1hp fan motor
Mechanical Closet
MagicAire, model 48-BVX-D, S/N W05-849924
Elec. Floors 1C, Faculty Center
2005 67%
HVAC Air handler #2, 66MBH cooling, 95MBH heating, 1990cfm, 340cfm OA, 1,5hp fan motor
Mechanical Closet
MagicAire, model 60-BVX-D, S/N W05-849923
Elec. Floors 1C, Faculty Center
2005 67%
Ventilation Wall mounted mushroom type exhaust fan
Outside, on wall Loren Cook Elec. General exhaust B building
est. 1998 0%
Cooling CU-3: Condensing unit, 3 tons cooling, R-22, 208/3/60, MCA 21, 10SEER
Outside, on grade
Trane, model 2TTB036A1000AA, S/N5171KP73F
Elec. AHU-2, 2nd stage
2005 67%
Cooling CU-4: Condensing unit, 3 tons cooling, R-22, 208/3/60, MCA 21, 10 SEER
Outside, on grade
Trane, model 2TTB036A1000AA, S/N5171KRB3F
Elec. AHU-2, 1st stage
2005 67%
Cooling CU-2: Condensing unit, 2.5 tons cooling, R-22, 208/3/60, MCA 18, 10 SEER
Outside, on grade
Trane, model 2TTB030A1000AA, S/N52835W24F
Elec. AHU-1, 1st stage
2005 67%
Cooling CU-1: Condensing unit, 2.5 tons cooling, R-22, 208/3/60, MCA 18, 10 SEER
Outside, on grade
Trane, model 2TTB030A1000AA, S/N52835WM4F
Elec. AHU-1, 2nd stage
2005 67%
Ventilation Wall mounted mushroom type exhaust fan
Outside, on wall Loren Cook Elec. General exhaust C building
est. 1998 0%
Cooling Condensing unit, 3 tons cooling, 208/1/60, MCA 19.9
Outside, on grade
Goodman, model CKL36-1K, S/N 04057879580
Elec. IT 2005 67%
Cooling Condensing unit, 3 tons cooling, 208/1/60, MCA 22
Outside, on grade
Mitsubishi, model PU36EK, S/N 22E00472B
Elec. IT 2000 33%

Steven Winter Associates, Inc. - LGEA Report Sussex Community College – Building B/C Page 48/64
Appendix B: Lighting Study

Steven Winter Associates, Inc. - LGEA Report Sussex Community College – Building B/C Page 49/64

Steven Winter Associates, Inc. - LGEA Report Sussex Community College – Building B/C Page 50/64

Steven Winter Associates, Inc. - LGEA Report Sussex Community College – Building B/C Page 51/64
Legend Fixture Type Lamp Type Control Type Ballast Type Retrofit Category
Ceiling Suspended Recessed CFL 3'T12 8'T5 Autom. Timer (T) S (Self) N/A (None) Exit Sign Sconce Inc 3'T12 U-Shaped 8'T5 U-Shaped Bi-Level (BL) E (Electronic) T8 (Install new T8) High Bay Spotlight LED 3'T5 8'T8 Contact (Ct) M (Magnetic) T5 (Install new T5)
Parabolic Ceiling Mounted Track HPS 3'T5 U-Shaped 8'T8 U-Shaped Daylight & Motion (M) CFL (Install new CFL)
Parabolic Ceiling Suspended Vanity MH 3'T8 Circline - T5 Daylight & Switch (DLSw)
LEDex (Install new LED Exit)
Pendant Wall Mounted MV 3'T8 U-Shaped Circline - T8 Daylight Sensor (DL) LED (Install new LED)
Recessed Parabolic
Wall Suspended 1'T12 4'T5 Circline - T12 Delay Switch (DSw) D (De-lamping)
Ceiling Mounted Wallpack 1'T12 U-Shaped 4'T5 U-Shaped Fl. Dimmer (D) C (Controls Only)
Chandelier 1'T5 6'T12 Hal Motion Sensor (MS) PSMH (Install new Pulse-
Start Metal Halide) Equipment / Fume
Hood 1'T5 U-Shaped 6'T12 U-Shaped Induction Motion& Switch (MSw) Flood 1'T8 6'T5 Infrared None (N) Landscape 1'T8 U-Shaped 6'T5 U-Shaped LPS Occupancy Sensor (OS)
Low Bay 2'T12 U-Shaped 6'T8 Mixed Vapor Occupancy Sensor - CM (OSCM)
Parabolic Wall Mounted 2'T5 6'T8 U-Shaped Neon Photocell (PC)
Pole Mounted 2'T5 U-Shaped 8'T12 Quartz Halogen Switch (Sw) Pole Mounted Off Building 2'T8 U-Shaped 8'T12 U-Shaped

Steven Winter Associates, Inc. - LGEA Report Sussex Community College – Building B/C Page 52/64
APPENDIX C: THIRD PARTY ENERGY SUPPLIERS http://www.state.nj.us/bpu/commercial/shopping.html

Steven Winter Associates, Inc. - LGEA Report Sussex Community College – Building B/C Page 53/64

Steven Winter Associates, Inc. - LGEA Report Sussex Community College – Building B/C Page 54/64
APPENDIX D: GLOSSARY AND METHOD OF CALCULATIONS Net ECM Cost: The net ECM cost is the cost experienced by the customer, which is typically the total cost (materials + labor) of installing the measure minus any available incentives. Both the total cost and the incentive amounts are expressed in the summary for each ECM. Annual Energy Cost Savings (AECS): This value is determined by the audit firm based on the calculated energy savings (kWh or Therm) of each ECM and the calculated energy costs of the building. Lifetime Energy Cost Savings (LECS): This measure estimates the energy cost savings over the lifetime of the ECM. It can be a simple estimation based on fixed energy costs. If desired, this value can factor in an annual increase in energy costs as long as the source is provided. Simple Payback: This is a simple measure that displays how long the ECM will take to break-even based on the annual energy and maintenance savings of the measure. ECM Lifetime: This is included with each ECM so that the owner can see how long the ECM will be in place and whether or not it will exceed the simple payback period. Additional guidance for calculating ECM lifetimes can be found below. This value can come from manufacturer’s rated lifetime or warranty, the ASHRAE rated lifetime, or any other valid source. Operating Cost Savings (OCS): This calculation is an annual operating savings for the ECM. It is the difference in the operating, maintenance, and / or equipment replacement costs of the existing case versus the ECM. In the case where an ECM lifetime will be longer than the existing measure (such as LED lighting versus fluorescent) the operating savings will factor in the cost of replacing the units to match the lifetime of the ECM. In this case or in one where one-time repairs are made, the total replacement / repair sum is averaged over the lifetime of the ECM. Return on Investment (ROI): The ROI is expresses the percentage return of the investment based on the lifetime cost savings of the ECM. This value can be included as an annual or lifetime value, or both. Net Present Value (NPV): The NPV calculates the present value of an investment’s future cash flows based on the time value of money, which is accounted for by a discount rate (assumes bond rate of 3.2%). Internal Rate of Return (IRR): The IRR expresses an annual rate that results in a break-even point for the investment. If the owner is currently experiencing a lower return on their capital than the IRR, the project is financially advantageous. This measure also allows the owner to compare ECMs against each other to determine the most appealing choices. Gas Rate and Electric Rate ($/therm and $/kWh): The gas rate and electric rate used in the financial analysis is the total annual energy cost divided by the total annual energy usage for the 12 month billing period studied. The graphs of the monthly gas and electric rates reflect the total monthly energy costs divided by the monthly usage, and display how the average rate fluctuates throughout the year. The average annual rate is the only rate used in energy savings calculations.

Steven Winter Associates, Inc. - LGEA Report Sussex Community College – Building B/C Page 55/64
Calculation References
Term Definition ECM Energy Conservation Measure
AOCS Annual Operating Cost Savings AECS Annual Energy Cost Savings LOCS* Lifetime Operating Cost Savings LECS Lifetime Energy Cost Savings LCS Lifetime Cost Savings NPV Net Present Value IRR Internal Rate of Return DR Discount Rate
Net ECM Cost Total ECM Cost – Incentive LECS AECS X ECM Lifetime AOCS LOCS / ECM Lifetime LCS LOCS+LECS
Simple Payback Net ECM Cost / (AECS + AOCS) Lifetime ROI (LECS + LOCS – Net ECM Cost) / Net ECM Cost Annual ROI (Lifetime ROI / Lifetime) = [(AECS + OCS) / Net ECM Cost – (1 / Lifetime)]
* The lifetime operating cost savings are all avoided operating, maintenance, and/or component replacement costs over the lifetime of the ECM. This can be the sum of any annual operating savings, recurring or bulk (i.e. one-time repairs) maintenance savings, or the savings that comes from avoiding equipment replacement needed for the existing measure to meet the lifetime of the ECM (e.g. lighting change outs).
Excel NPV and IRR Calculation In Excel, function =IRR (values) and =NPV (rate, values) are used to quickly calculate the IRR and NPV of a series of annual cash flows. The investment cost will typically be a negative cash flow at year 0 (total cost - incentive) with years 1 through the lifetime receiving a positive cash flow from the annual energy cost savings and annual maintenance savings. The calculations in the example below are for an ECM that saves $850 annually in energy and maintenance costs (over a 10 year lifetime) and takes $5,000 to purchase and install after incentives:

Steven Winter Associates, Inc. - LGEA Report Sussex Community College – Building B/C Page 56/64
Solar PV ECM Calculation There are several components to the calculation: Costs: Material of PV system including panels, mounting and net-metering +
Labor Energy Savings: Reduction of kWh electric cost for life of panel, 25 years Incentive 1: NJ Renewable Energy Incentive Program (REIP), for systems of size
30kW or less, $0.75/Watt incentive subtracted from installation cost Incentive 2: Solar Renewable Energy Credits (SRECs) – Market-rate incentive.
Calculations assume $600/Megawatt hour consumed per year for a maximum of 15 years; added to annual energy cost savings for a period of 15 years. (Megawatt hour used is rounded to nearest 1,000 kWh)
Assumptions: A Solar Pathfinder device is used to analyze site shading for the building and determine maximum amount of full load operation based on available sunlight. When the Solar Pathfinder device is not implemented, amount of full load operation based on available sunlight is assumed to be 1,180 hours in New Jersey.
Total lifetime PV energy cost savings = kWh produced by panel * [$/kWh cost * 25 years + $600/Megawatt hour /1000 * 15 years]
ECM and Equipment Lifetimes Determining a lifetime for equipment and ECM’s can sometimes be difficult. The following table contains a list of lifetimes that the NJCEP uses in its commercial and industrial programs. Other valid sources are also used to determine lifetimes, such as the DOE, ASHRAE, or the manufacturer’s warranty. Lighting is typically the most difficult lifetime to calculate because the fixture, ballast, and bulb can all have different lifetimes. Essentially the ECM analysis will have different operating cost savings (avoided equipment replacement) depending on which lifetime is used. When the bulb lifetime is used (rated burn hours / annual burn hours), the operating cost savings is just reflecting the theoretical cost of replacing the existing case bulb and ballast over the life of the recommended bulb. Dividing by the bulb lifetime will give an annual operating cost savings. When a fixture lifetime is used (e.g. 15 years) the operating cost savings reflects the avoided bulb and ballast replacement cost of the existing case over 15 years minus the projected bulb and ballast replacement cost of the proposed case over 15 years. This will give the difference of the equipment replacement costs between the proposed and existing cases and when divided by 15 years will give the annual operating cost savings.

Steven Winter Associates, Inc. - LGEA Report Sussex Community College – Building B/C Page 57/64
New Jersey Clean Energy Program Commercial & Industrial Lifetimes
Measure Life Span Commercial Lighting — New 15 Commercial Lighting — Remodel/Replacement 15 Commercial Custom — New 18 Commercial Chiller Optimization 18 Commercial Unitary HVAC — New - Tier 1 15 Commercial Unitary HVAC — Replacement - Tier 1 15 Commercial Unitary HVAC — New - Tier 2 15 Commercial Unitary HVAC — Replacement Tier 2 15 Commercial Chillers — New 25 Commercial Chillers — Replacement 25 Commercial Small Motors (1-10 HP) — New or Replacement 20 Commercial Medium Motors (11-75 HP) — New or Replacement 20 Commercial Large Motors (76-200 HP) — New or Replacement 20 Commercial VSDs — New 15 Commercial VSDs — Retrofit 15 Commercial Comprehensive New Construction Design 18 Commercial Custom — Replacement 18 Industrial Lighting — New 15 Industrial Lighting — Remodel/Replacement 15 Industrial Unitary HVAC — New - Tier 1 15 Industrial Unitary HVAC — Replacement - Tier 1 15 Industrial Unitary HVAC — New - Tier 2 15 Industrial Unitary HVAC — Replacement Tier 2 15 Industrial Chillers — New 25 Industrial Chillers — Replacement 25 Industrial Small Motors (1-10 HP) — New or Replacement 20 Industrial Medium Motors (11-75 HP) — New or Replacement 20 Industrial Large Motors (76-200 HP) — New or Replacement 20 Industrial VSDs — New 15 Industrial VSDs — Retrofit 15 Industrial Custom — Non-Process 18 Industrial Custom — Process 10 Small Commercial Gas Furnace — New or Replacement 20 Small Commercial Gas Boiler — New or Replacement 20 Small Commercial Gas DHW — New or Replacement 10 C&I Gas Absorption Chiller — New or Replacement 25 C&I Gas Custom — New or Replacement (Engine Driven Chiller) 25 C&I Gas Custom — New or Replacement (Gas Efficiency Measures) 18 O&M savings 3 Compressed Air (GWh participant) 8

Steven Winter Associates, Inc. - LGEA Report Sussex Community College – Building B/C Page 58/64
APPENDIX E: STATEMENT OF ENERGY PERFORMANCE FROM ENERGY STAR®

Steven Winter Associates, Inc. - LGEA Report Sussex Community College – Building B/C Page 59/64
APPENDIX F: INCENTIVE PROGRAMS
New Jersey Clean Energy Pay for Performance
The NJ Clean Energy Pay for Performance (P4P) Program relies on a network of Partners who provide technical services to clients. LGEA participating clients who are not receiving Direct Energy Efficiency and Conservation Block Grants are eligible for P4P. SWA is an eligible Partner and can develop an Energy Reduction Plan for each project with a whole-building traditional energy audit, a financial plan for funding the energy measures and an installation construction schedule. The Energy Reduction Plan must define a comprehensive package of measures capable of reducing a building’s energy consumption by 15+%. P4P incentives are awarded upon the satisfactory completion of three program milestones: submittal of an Energy Reduction Plan prepared by an approved Program Partner, installation of the recommended measures and completion of a Post-Construction Benchmarking Report. The incentives for electricity and natural gas savings will be paid based on actual savings, provided that the minimum 15%performance threshold savings has been achieved. For further information, please see: http://www.njcleanenergy.com/commercial-industrial/programs/pay-performance/existing-buildings . Direct Install 2010 Program*
Direct Install is a division of the New Jersey Clean Energy Programs’ Smart Start Buildings. It is a turn-key program for small to mid-sized facilities to aid in upgrading equipment to more efficient types. It is designed to cut overall energy costs by upgrading lighting, HVAC and other equipment with energy efficient alternatives. The program pays up to 60% of the retrofit costs, including equipment cost and installation costs. Eligibility:
• Existing small and mid-sized commercial and industrial facilities with peak electrical demand below 200 kW within 12 months of applying
• Must be located in New Jersey • Must be served by one of the state’s public, regulated or natural gas companies
• Electric: Atlantic City Electric, Jersey Central Power & Light, Orange Rockland Electric, PSE&G
• Natural Gas: Elizabethtown Gas, New Jersey Natural Gas, PSE&G, South Jersey Gas Service
For the most up to date information on contractors in New Jersey who participate in this program, go to: http://www.njcleanenergy.com/commercial-industrial/programs/direct-install
Smart Start
New Jersey’s SmartStart Building Program is administered by New Jersey’s Office of Clean Energy. The program also offers design support for larger projects and technical assistance for smaller projects. If your project specifications do not fit into anything defined by the program, there are even incentives available for custom projects.

Steven Winter Associates, Inc. - LGEA Report Sussex Community College – Building B/C Page 60/64
There are a number of improvement options for commercial, industrial, institutional, government, and agricultural projects throughout New Jersey. Alternatives are designed to enhance quality while building in energy efficiency to save money. Project categories included in this program are New Construction and Additions, Renovations, Remodeling and Equipment Replacement. For the most up to date information on how to participate in this program, go to: http://www.njcleanenergy.com/commercial-industrial/programs/nj-smartstart-buildings/nj-smartstart-buildings.
Renewable Energy Incentive Program*
The Renewable Energy Incentive Program (REIP)
provides incentives that reduce the upfront cost of installing renewable energy systems, including solar, wind, and sustainable biomass. Incentives vary depending upon technology, system size, and building type. Current incentive levels, participation information, and application forms can be found at the website listed below.
Solar Renewable Energy Credits (SRECs) represent all the clean energy benefits of electricity generated from a solar energy system. SRECs can be sold or traded separately from the power, providing owners a source of revenue to help offset the cost of installation. All solar project owners in New Jersey with electric distribution grid-connected systems are eligible to generate SRECs. Each time a system generates 1,000 kWh of electricity an SREC is earned and placed in the customer's account on the web-based SREC tracking system. For the most up to date information on how to participate in this program, go to: http://www.njcleanenergy.com/renewable-energy/home/home.
Utility Sponsored Programs
Check with your local utility companies for further opportunities that may be available.
Energy Efficiency and Conservation Block Grant Rebate Program
The Energy Efficiency and Conservation Block Grant (EECBG) Rebate Program provides supplemental funding up to $20,000 for eligible New Jersey local government entities to lower the cost of installing energy conservation measures. Funding for the EECBG Rebate Program is provided through the American Recovery and Reinvestment Act (ARRA). For the most up to date information on how to participate in this program, go to: http://njcleanenergy.com/EECBG
Other Federal and State Sponsored Programs
Other federal and state sponsored funding opportunities may be available, including BLOCK and R&D grant funding. For more information, please check http://www.dsireusa.org/. *Subject to availability. Incentive program timelines might not be sufficient to meet the 25% in 12 months spending requirement outlined in the LGEA program.

Steven Winter Associates, Inc. - LGEA Report Sussex Community College – Building B/C Page 61/64
APPENDIX G: ENERGY CONSERVATION MEASURES
ECM Counter ECM description
est.
inst
alle
d co
st, $
est.
ince
ntiv
es,
$
net e
st. E
CM
co
st w
ith
ince
ntiv
es, $
kWh,
1st
yr
savi
ngs
kW, d
eman
d re
duct
ion/
mo
ther
ms,
1st
yr
savi
ngs
kBtu
/sq
ft, 1
st
yr s
avin
gs
est.
oper
atin
g co
st, 1
st y
r sa
ving
s, $
tota
l 1st
yea
r co
st s
avin
gs, $
life
of
mea
sure
, yrs
est.
lifet
ime
cost
sav
ings
, $
sim
ple
payb
ack,
yrs
lifet
ime
retu
rn
on in
vest
men
t, %
1 67 New CFL fixtures to be installed
627 0 627 10,243 2.0 0 0.9 335 1,933 5 9,665 0.3 1,709
2Retrofit (3) Beverage vending machines with Vending Miser™
597 0 597 4,836 1.0 0 0.4 0 754 10 7,544 0.8 1,164
5 8 New motion sensors to be installed with incentives
1,760 160 1,600 8,195 1.6 0 0.7 0 1,278 15 19,176 1.3 1,098
3 Retrofit (1) Snack Vending Machine with Snack Miser™
99 0 99 387 0.1 0 0.0 0 60 10 604 1.6 510
13Replace 40hp supply fan motor on packaged RTU with premium efficiency motor
2,907 180 2,727 9,251 1.9 0 0.8 0 1,443 15 21,647 1.9 694
11Provide demand controlled ventilation using Carbon Dioxide sensors
12,660 0 12,660 3,513 0.7 2,740 7.5 0 4,105 12 49,255 3.1 289
4 2 New Daylight Sensors to be installed with incentives
440 50 390 437 0.1 0 0.0 50 118 15 1,772 3.3 547
6 76 New occupancy sensors to be installed with incentives
16,720 1,520 15,200 29,692 5.9 0 2.7 0 4,632 15 69,480 3.3 357
14Replace 2 hp relief fan motor on packaged RTU with premium efficiency motor
1,411 125 1,286 1,948 0.4 0 0.2 0 304 15 4,558 4.2 254
TOTALS 37,221 2,035 35,186 68,502 14 2,740 13.2 385 14,628 183,700 2.4 -
0 to
5 Y
ear P
ayba
ck E
CM

Steven Winter Associates, Inc. - LGEA Report Sussex Community College – Building B/C Page 62/64
ECM Counter ECM description
est.
inst
alle
d co
st, $
est.
ince
ntiv
es,
$
net e
st. E
CM
co
st w
ith
ince
ntiv
es, $
kWh,
1st
yr
savi
ngs
kW, d
eman
d re
duct
ion/
mo
ther
ms,
1st
yr
savi
ngs
kBtu
/sq
ft, 1
st
yr s
avin
gs
est.
oper
atin
g co
st, 1
st y
r sa
ving
s, $
tota
l 1st
yea
r co
st s
avin
gs, $
life
of
mea
sure
, yrs
est.
lifet
ime
cost
sav
ings
, $
sim
ple
payb
ack,
yrs
lifet
ime
retu
rn
on in
vest
men
t, %
7 7 New bi-level fixtures to be installed with incentives
1,155 175 980 1,113 0.2 0 0.1 0 174 15 2,604 5.6 166
8 124 New T8 fixtures to be installed with incentives
21,528 1,860 19,668 8,327 1.7 0 0.7 1,791 3,090 15 46,344 6.4 272
16 Replace 4 existing 10SEER condensing units
10,240 920 9,320 7,500 1.5 0 0.7 0 1,170 15 17,550 8.0 88
9 6 New photocells to be installed with incentives
1,320 120 1,200 965 0.2 0 0.1 0 150 15 2,257 8.0 88
TOTALS 34,243 3,075 31,168 17,905 3.6 0 1.6 1,791 4,584 68,755 6.8 -
106 New pulse start metal halide fixtures to be installed with incentives
4,388 150 4,238 2,190 0.4 0 0.2 36 377 15 5,662 11.2 46
15 Replace 2 existing hot water boilers
113,000 5,250 107,750 0 0.0 5,000 13.1 1,500 7,990 30 239,700 13.5 164
17 Replace windows on 3rd Floor
130,000 0 130,000 6,305 1.3 6,305 17.1 0 9,167 30 275,024 14.2 112
12 Install new Building Management System
150,000 0 150,000 39,170 7.8 1,633 7.8 0 8,230 12 98,762 18.2 -34
TOTALS 397,388 5,400 391,988 47,665 9 12,938 38.2 1,536 25,765 619,148 15.2 -> 10
Yea
r Pay
bakc
(End
of
Life
EC
M)
5 to
10
Year
Pay
back

Steven Winter Associates, Inc. - LGEA Report Sussex Community College – Building B/C Page 63/64
APPENDIX H: VendingMiser™ and SnackMiser™ Energy Savings

Steven Winter Associates, Inc. - LGEA Report Sussex Community College – Building B/C Page 64/64
APPENDIX I: METHOD OF ANALYSIS
Assumptions and tools
Energy modeling tool: Established/standard industry assumptions, E-Quest Cost estimates: RS Means 2009 (Facilities Maintenance & Repair Cost Data)
RS Means 2009 (Building Construction Cost Data) RS Means 2009 (Mechanical Cost Data)
Published and established specialized equipment material and labor costs Cost estimates also based on utility bill analysis and prior experience with similar projects
Disclaimer
This engineering audit was prepared using the most current and accurate fuel consumption data available for the site. The estimates that it projects are intended to help guide the owner toward best energy choices. The costs and savings are subject to fluctuations in weather, variations in quality of maintenance, changes in prices of fuel, materials, and labor, and other factors. Although we cannot guarantee savings or costs, we suggest that you use this report for economic analysis of the building and as a means to estimate future cash flow.
THE RECOMMENDATIONS PRESENTED IN THIS REPORT ARE BASED ON THE RESULTS OF ANALYSIS, INSPECTION, AND PERFORMANCE TESTING OF A SAMPLE OF COMPONENTS OF THE BUILDING SITE. ALTHOUGH CODE-RELATED ISSUES MAY BE NOTED, SWA STAFF HAVE NOT COMPLETED A COMPREHENSIVE EVALUATION FOR CODE-COMPLIANCE OR HEALTH AND SAFETY ISSUES. THE OWNER(S) AND MANAGER(S) OF THE BUILDING(S) CONTAINED IN THIS REPORT ARE REMINDED THAT ANY IMPROVEMENTS SUGGESTED IN THIS SCOPE OF WORK MUST BE PERFORMED IN ACCORDANCE WITH ALL LOCAL, STATE, AND FEDERAL LAWS AND REGULATIONS THAT APPLY TO SAID WORK. PARTICULAR ATTENTION MUST BE PAID TO ANY WORK WHICH INVOLVES HEATING AND AIR MOVEMENT SYSTEMS, AND ANY WORK WHICH WILL INVOLVE THE DISTURBANCE OF PRODUCTS CONTAINING MOLD, ASBESTOS, OR LEAD.