Embed Size (px)
Citation preview
Adding Confidence to Seasonal Drought Forecasts Using
Reference Evapotranspiration Anomalies
U.S. Drought Monitor Forum
April 15th, 2015
Reno, NV
Dan McEvoy,
Graduate Research
Assistant and PhD
Candidate
Desert Research Institute
and University of Nevada,
Reno
Photo credit: Steve Carver

What is evaporative demand (E0)?
(Figure: http://www.fao.org/docrep/s2022e/s2022e07.htm)
• Evapotranspiration rate that
could occur given an unlimited
water supply
• Potential evapotranspiration
• Atmospheric demand
• Reference evapotranspiration
• Often estimated using
temperature alone, but a
physically based model should
be used
Physically-based E0 contains valuable information related to drought dynamics
“ATMOSPHERIC THIRST”
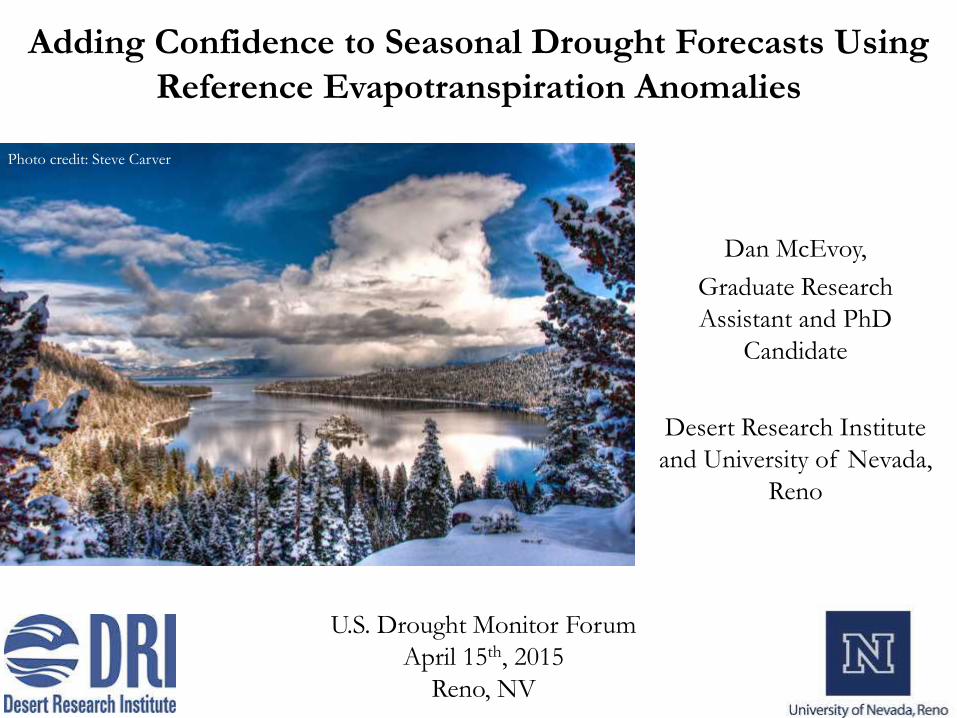
Reference Evapotranspiration (ETo)
ASCE Standardized Reference ET (Allen et al. 1998, 2005):
𝐸𝑇𝑜 =Δ
Δ + 𝛾(1 + 0.34𝑢2)
𝑅𝑛 − 𝐺
𝜆+
𝛾
Δ + 𝛾 1 + 0.34𝑢2
900
𝑇 + 273𝑢2(𝑒𝑠 − 𝑒𝑎)
Advective component
Radiative component
Rn = net radiation (shortwave + longwave)
G = ground heat flux (assumed to be zero)
T = mean daily temperature
U2 = mean daily wind speed at 2-m
es = saturation vapor pressure ((es_tmax+es_tmin)/2)
ea = actual vapor pressure (from q and surface pressure)
λ = latent heat of vaporization
Δ = slope of saturation vapor pressure-temperature curve
γ = psychrometric constant
Cn = 900 (grass reference)
Cd = 0.34 (grass reference)
Gridded weather/climate data:
• Maximum and temperature (2 m)
• Specific or relative humidity (2 m)
• Wind speed (10 m)
• Downward shortwave radiation at
surface

Evaporative Demand Drought Index (EDDI)
(EDDI; Hobbins et al. 2011, McEvoy et
al 2014)
• EDDI: same standardization procedure as SPI with ETo as only input
• Based on the historical probability distribution for a given accumulation window
• EDDI identifies current western “snow drought” despite above normal
precipitation in some locations.
Represents previous 6 months, October – March
• 4-km spatial resolution
• Daily temporal resolution
• METDATA, 1979-present
• (Abatzoglou 2011)
• http://metdata.northwest
knowledge.net/)
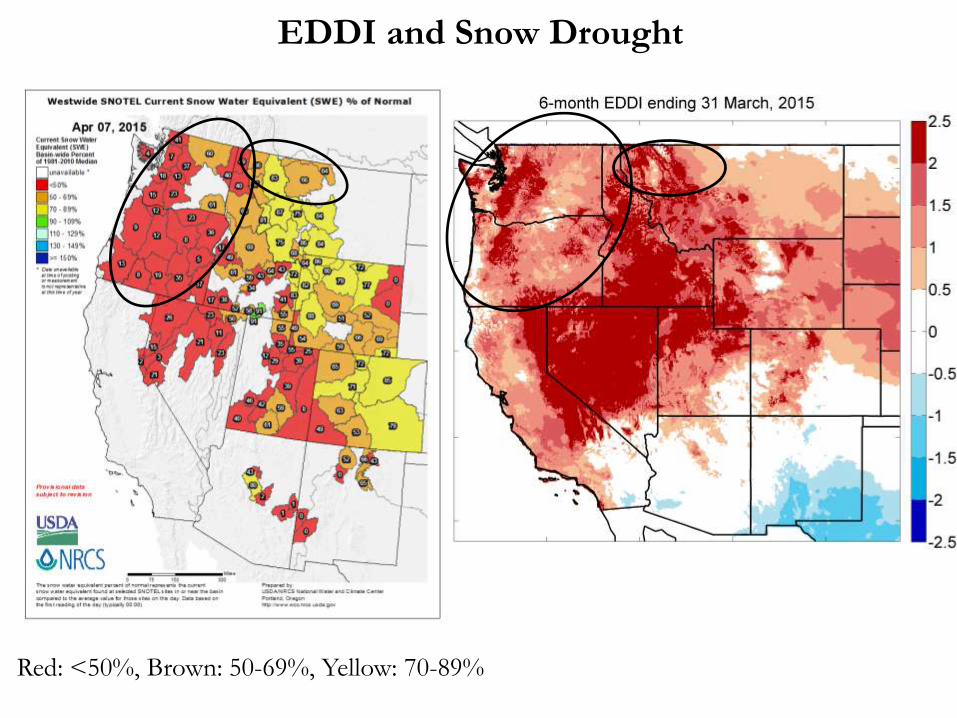
EDDI and Snow Drought
Red: <50%, Brown: 50-69%, Yellow: 70-89%

EDDI as an Early Warning Indicator: 2012
Evaporative Stress Index
(1-month ESI)
Standardized Soil Moisture
Index (1-month SSI)
Standardized Precipitation
Index (1-month SPI)
1-month EDDI
(ESI data provided courtesy Martha Anderson and Chris Hain)
USDM

Motivation: Poor Skill in Precipitation Forecasts
From Saha et al. 2014: “Except for the first month (lead 0), which is essentially weather
prediction in the first two weeks, there is no skill at all, which is a sobering conclusion”
Other studies also highlight this problem: e.g., Lavers et al. 2009, Yuan et al. 2011, Yuan et al. 2013,
Wood et al. 2015
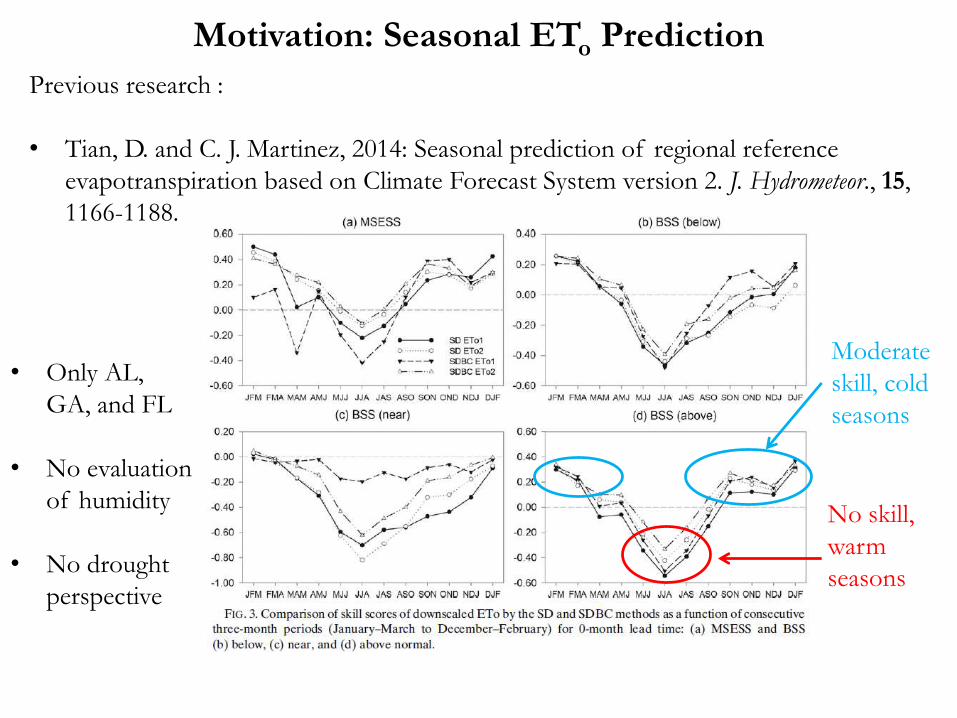
Motivation: Seasonal ETo Prediction
Previous research :
• Tian, D. and C. J. Martinez, 2014: Seasonal prediction of regional reference
evapotranspiration based on Climate Forecast System version 2. J. Hydrometeor., 15,
1166-1188.
Moderate
skill, cold
seasons
No skill,
warm
seasons
• Only AL,
GA, and FL
• No evaluation
of humidity
• No drought
perspective

(Karl and Koss, 1984)
CONUS Scale Analysis: Seasonal ETo Prediction
9 NCDC Climate Regions (Karl and Koss, 1984)
• CFSv2 Reforecast
• CFSR used as baseline observations
• Monthly mean Tmax, Tmin, specific
humidity, wind speed, solar radiation,
and precipitation
• Monthly mean ETo
• Deterministic skill: temporal anomaly
correlation (ensemble mean)
• Probabilistic skill: Heidke Skill score during
drought events
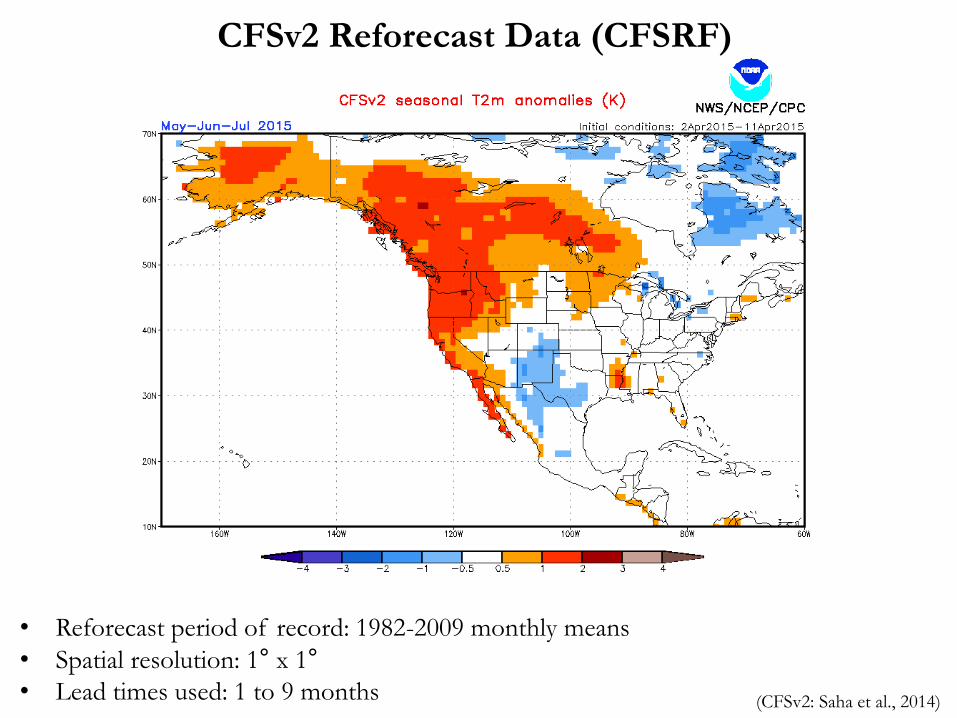
CFSv2 Reforecast Data (CFSRF)
(CFSv2: Saha et al., 2014)
• Reforecast period of record: 1982-2009 monthly means
• Spatial resolution: 1° x 1°
• Lead times used: 1 to 9 months

Season 1 ETo vs. PPT Regional Skill
• ETo forecasts almost always contain greater skill than PPT
• Certain regions and seasons contain a large skill gap
Lead 1-month, Season 1 AC

Case Study: 2002 Southwest Drought
• Forecasts initialized in March, 2002
• Spatial extent better predicted by ETo
• Severity poorly forecast by both metrics in southwest
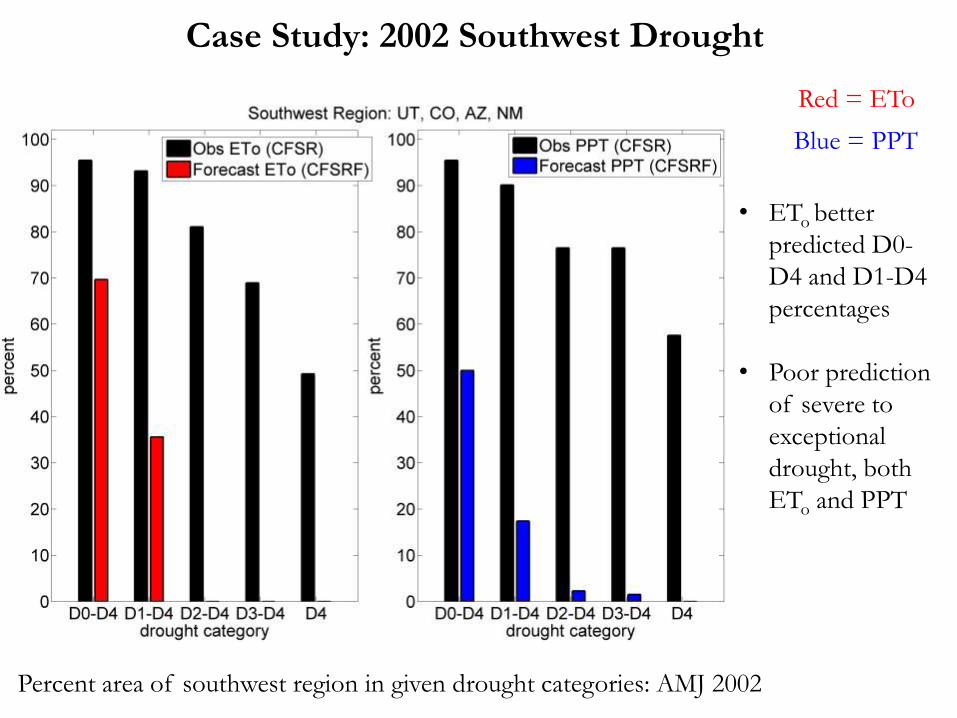
Case Study: 2002 Southwest Drought
• ETo better
predicted D0-
D4 and D1-D4
percentages
• Poor prediction
of severe to
exceptional
drought, both
ETo and PPT
Red = ETo
Blue = PPT
Percent area of southwest region in given drought categories: AMJ 2002
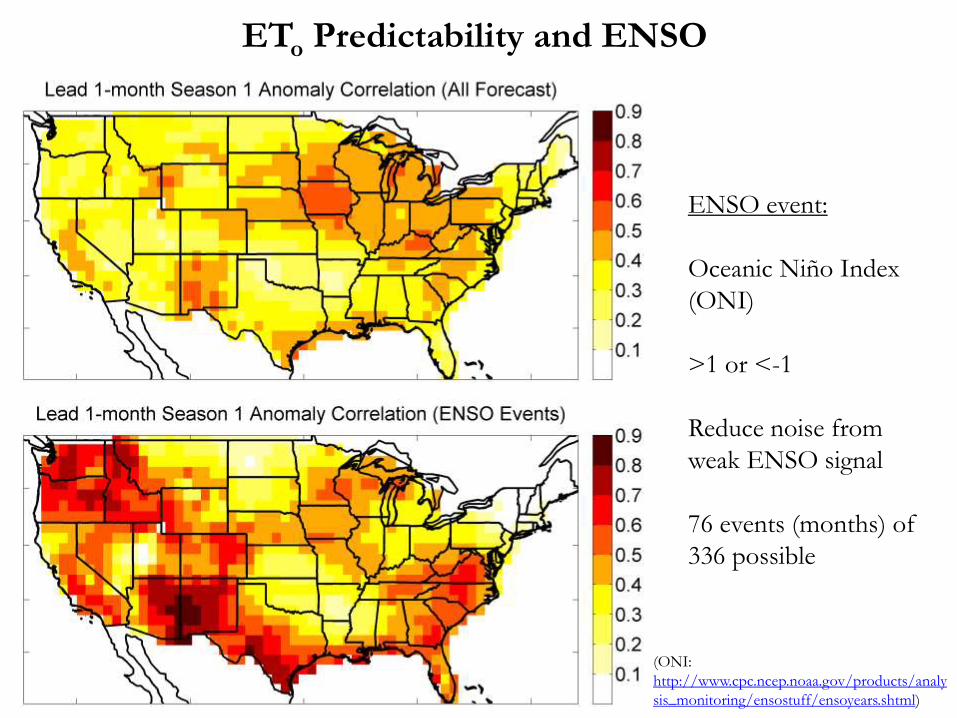
ETo Predictability and ENSO
ENSO event:
Oceanic Niño Index
(ONI)
>1 or <-1
Reduce noise from
weak ENSO signal
76 events (months) of
336 possible
(ONI:
http://www.cpc.ncep.noaa.gov/products/analy
sis_monitoring/ensostuff/ensoyears.shtml)
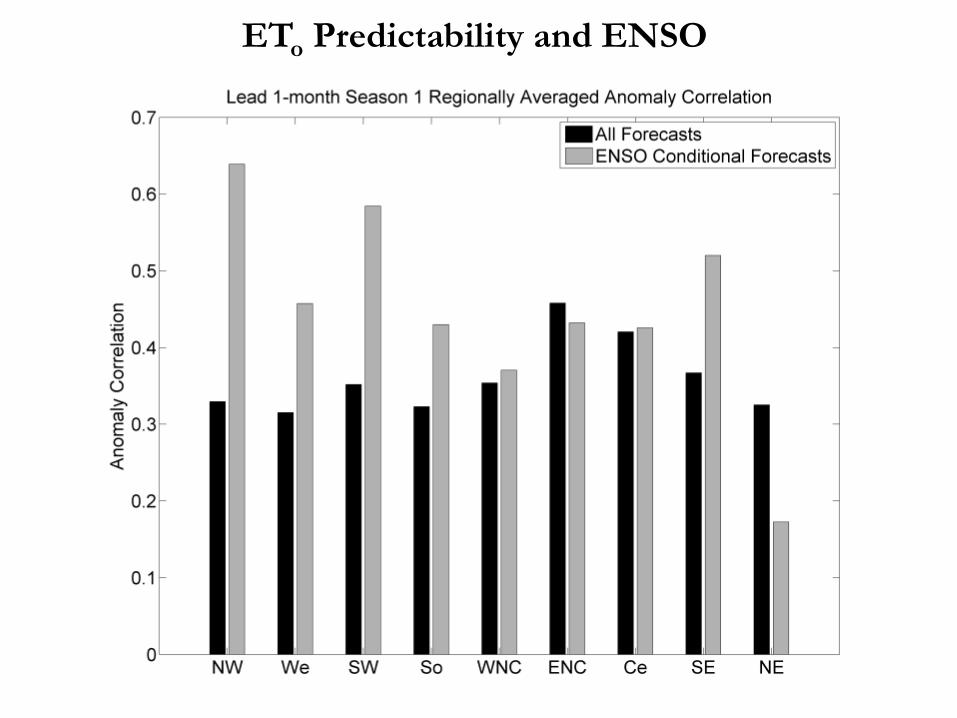
ETo Predictability and ENSO

Conclusions and Ongoing Efforts
• Skill analysis with second set of
observations (NARR or ERA-40)
• Produce experimental real-time
seasonal ETo forecast from CFSv2
• Apply analysis to NMME Phase II
output
Thank You!
Questions?
The use of ETo anomalies as a seasonal forecast tool could add confidence to
drought predictions when used in addition to PPT and other drought metrics.
NMME:
http://www.cpc.ncep.noaa.gov/prod
ucts/NMME/

CFSR E0 and Precipitation Anomalies
Climate
Forecast
System
Reanalysis
(CFSR)
(CFSR; Saha et al. 2010)