Embed Size (px)
Citation preview
Addendum to Quality Assurance Project Plan
Wenatchee River PCB and DDT Source Assessment April 2015 Publication No. 15-03-107

QAPP Addendum – Wenatchee River PCB and DDT
Publication Information Addendum This addendum is on the Department of Ecology’s website at https://fortress.wa.gov/ecy/publications/SummaryPages/1503107.html This addendum is an addition to an original Quality Assurance Project Plan. It is not a correction (errata) to the original plan. Data for this project will be available on Ecology’s Environmental Information Management (EIM) website at www.ecy.wa.gov/eim/index.htm. Search Study ID WHOB002. Activity Tracker code Ecology’s Activity Tracker code for this addendum is 14-040. Original Publication Quality Assurance Project Plan: Wenatchee River PCB and DDT Source Assessment Publication No. 14-03-117 https://fortress.wa.gov/ecy/publications/SummaryPages/1403117.html Authors and Contact Information William Hobbs Environmental Assessment Program Washington State Department of Ecology Olympia, Washington 98504-7710 For more information contact: Communications Consultant, phone 360-407-6834.
Any use of product or firm names in this publication is for descriptive purposes only and does not imply endorsement by the author or the Department of Ecology.
Accommodation Requests: To request ADA accommodation including materials in a format for the
visually impaired, call Ecology at 360-407-6834. Persons with impaired hearing may call Washington Relay Service at 711. Persons with speech disability may call TTY at 877-833-6341.
QAPP Addendum – Wenatchee River PCB and DDT Page 1 – April 2015
Addendum to Quality Assurance Project Plan
Wenatchee River PCB and DDT
Source Assessment
April 2015
Approved by: Signature: Date: April 2015 Lynda Jamison, Client, Water Quality Program, Central Regional Office Signature: Date: April 2015 Chris Coffin, Client’s Unit Supervisor, Water Quality Program, Central Regional Office
Signature: Date: April 2015 Charlie McKinney, Client’s Section Manager, Water Quality Program, Central Regional Office
Signature: Date: April 2015 William Hobbs, Author / Project Manager, EAP Signature: Date: April 2015 Dale Norton, Author’s Unit Supervisor, EAP Signature: Date: April 2015 Tom Mackie, Section Manager for the Study Area, EAP Signature: Date: April 2015 Will Kendra, Author’s Section Manager, EAP Signature: Date: April 2015 Joel Bird, Director, Manchester Environmental Laboratory Signature: Date: April 2015 Bill Kammin, Ecology Quality Assurance Officer Signatures are not available on the Internet version. EAP: Environmental Assessment Program
QAPP Addendum – Wenatchee River PCB and DDT Page 2 – April 2015
1.0 Table of Contents
Page
1.0 Table of Contents .....................................................................................................2
2.0 Abstract ....................................................................................................................5
3.0 Background ...................................................................................................................5
4.0 Project Description...................................................................................................5 4.2 Project objectives .............................................................................................5 4.7 Practical constraints .........................................................................................5
5.0 Organization and Schedule ......................................................................................6 5.4 Project schedule ...............................................................................................6 5.6 Budget and funding ..........................................................................................6
6.0 Quality Objectives ...................................................................................................6 6.1 Decision Quality Objectives (DQOs) ..............................................................6 6.2 Measurement Quality Objectives .....................................................................6
6.2.1 Targets for Precision, Bias, and Sensitivity ................................................6 6.2.2 Targets for Comparability, Representativeness, and Completeness ........7
7.0 Sampling Process Design (Experimental Design) ...................................................8 7.1 Study Design ....................................................................................................8
7.1.1 Field measurements ...................................................................................10 7.1.2 Sampling location and frequency...............................................................10 7.1.3 Parameters to be determined ......................................................................10
7.2 Maps or diagram ............................................................................................11 7.3 Assumptions underlying design .....................................................................11 7.4 Relation to objectives and site characteristics ...............................................11 7.5 Characteristics of existing data ......................................................................11
8.0 Sampling Procedures .............................................................................................12 8.1 Field measurement and field sampling SOPs ................................................12
8.1.1 Water sampling ..........................................................................................12 8.1.2 Biotic media ...............................................................................................13 8.1.3 Suspended Particulate Material/River Bed Sediments ..............................14
8.2 Containers, preservation methods, holding times ..........................................14 8.8 Other activities ...............................................................................................14
9.0 Measurement Methods ...........................................................................................14 9.2 Lab procedures table. .....................................................................................14 9.3 Sample preparation method(s) .......................................................................14
10.0 Quality Control (QC) Procedures ..........................................................................15 10.1 Table of field and lab QC required ................................................................15
QAPP Addendum – Wenatchee River PCB and DDT Page 3 – April 2015
11.0 Data Management Procedures ...............................................................................15 11.1 Data recording/reporting requirements ..........................................................15 11.2 Laboratory data package requirements ..........................................................15 11.5 EIM/STORET data upload procedures ..........................................................16
12.0 Audits and Reports .................................................................................................16
13.0 Data Verification ....................................................................................................16
14.0 Data Quality (Usability) Assessment .....................................................................16 14.4 Sampling design evaluation ...........................................................................16
15.0 References ..............................................................................................................16
16.0 Figures....................................................................................................................19
17.0 Tables .....................................................................................................................25
18.0 Appendix A. Continuous low-level aquatic monitoring ........................................36
QAPP Addendum – Wenatchee River PCB and DDT Page 4 – April 2015
List of Figures and Tables
Page
Figures
Figure 1: Proposed sample sites for Phase 2 PCB investigation. ......................................19
Figure 2: Proposed sample sites for Phase 2 DDT investigation. Irrigation canals are in red. ......................................................................................................................20
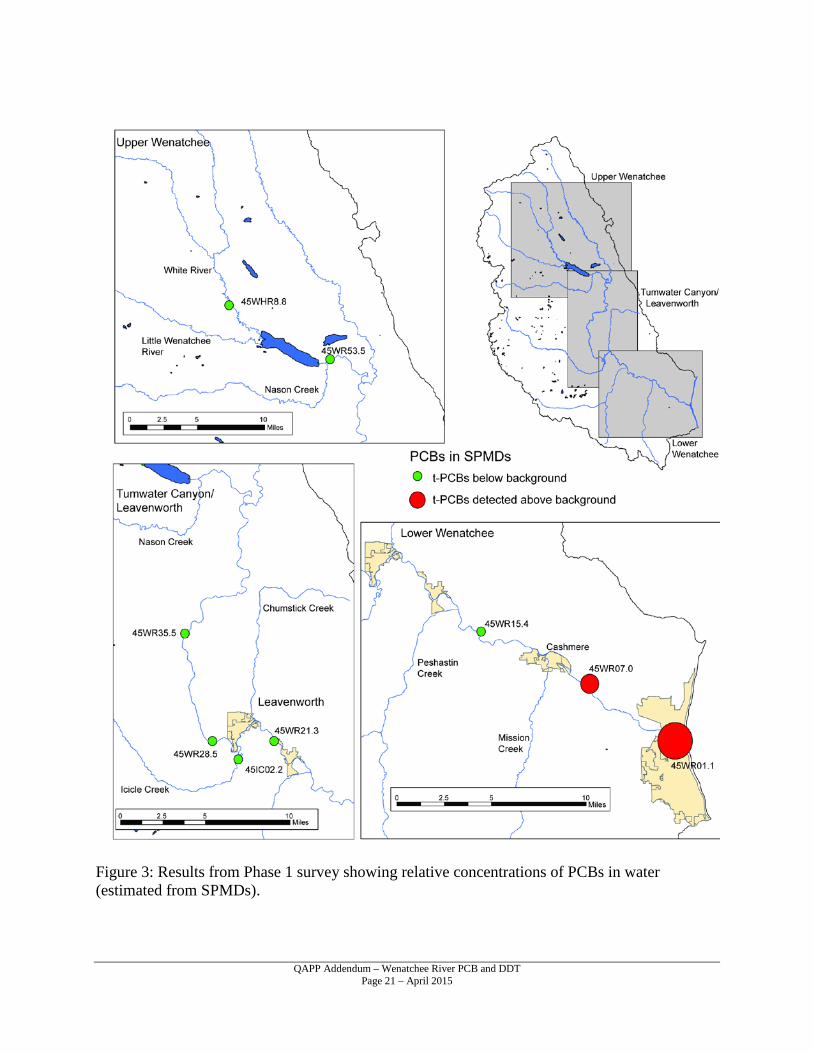
Figure 3: Results from Phase 1 survey showing relative concentrations of PCBs in water (estimated from SPMDs). .........................................................................21
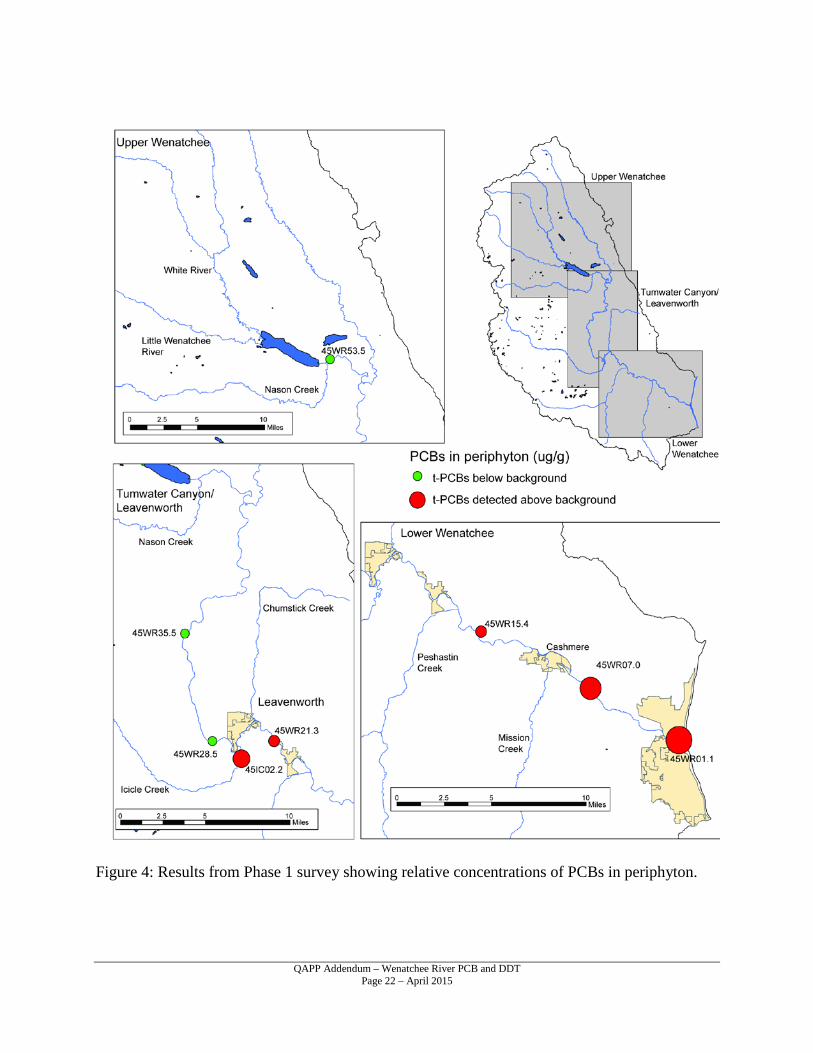
Figure 4: Results from Phase 1 survey showing relative concentrations of PCBs in periphyton. ..........................................................................................................22
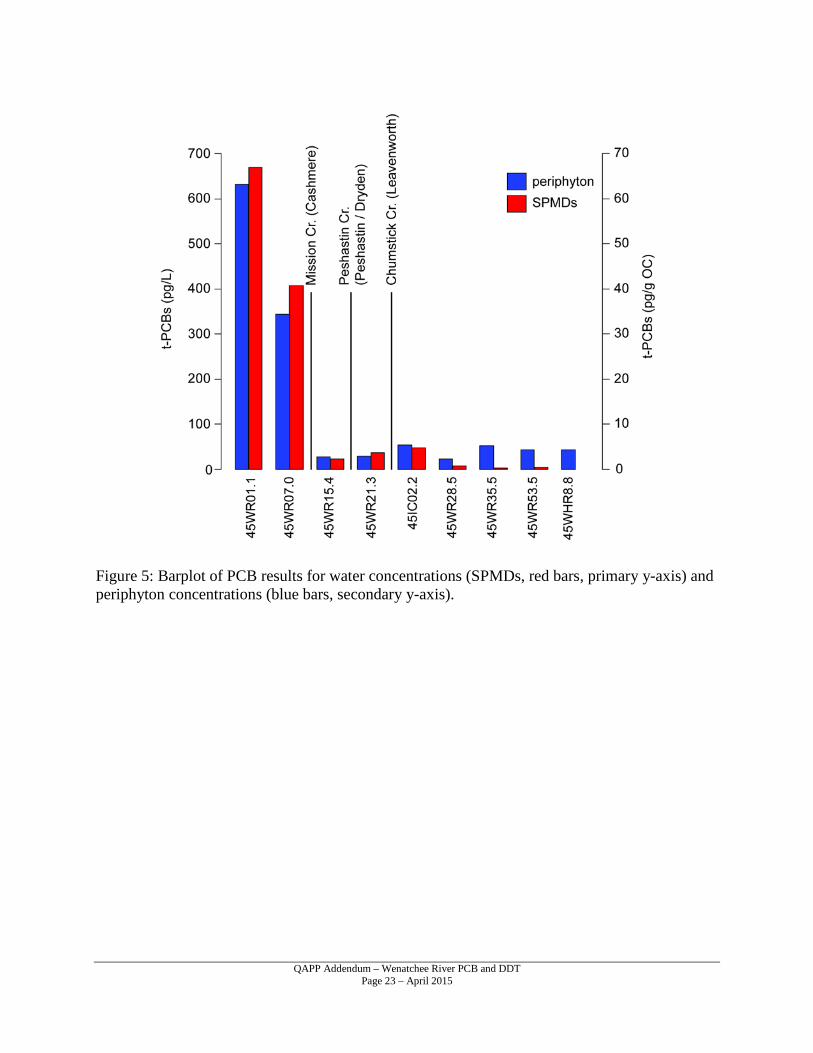
Figure 5: Barplot of PCB results for water concentrations (SPMDs, red bars, primary y-axis) and periphyton concentrations (blue bars, secondary y-axis). ...............23
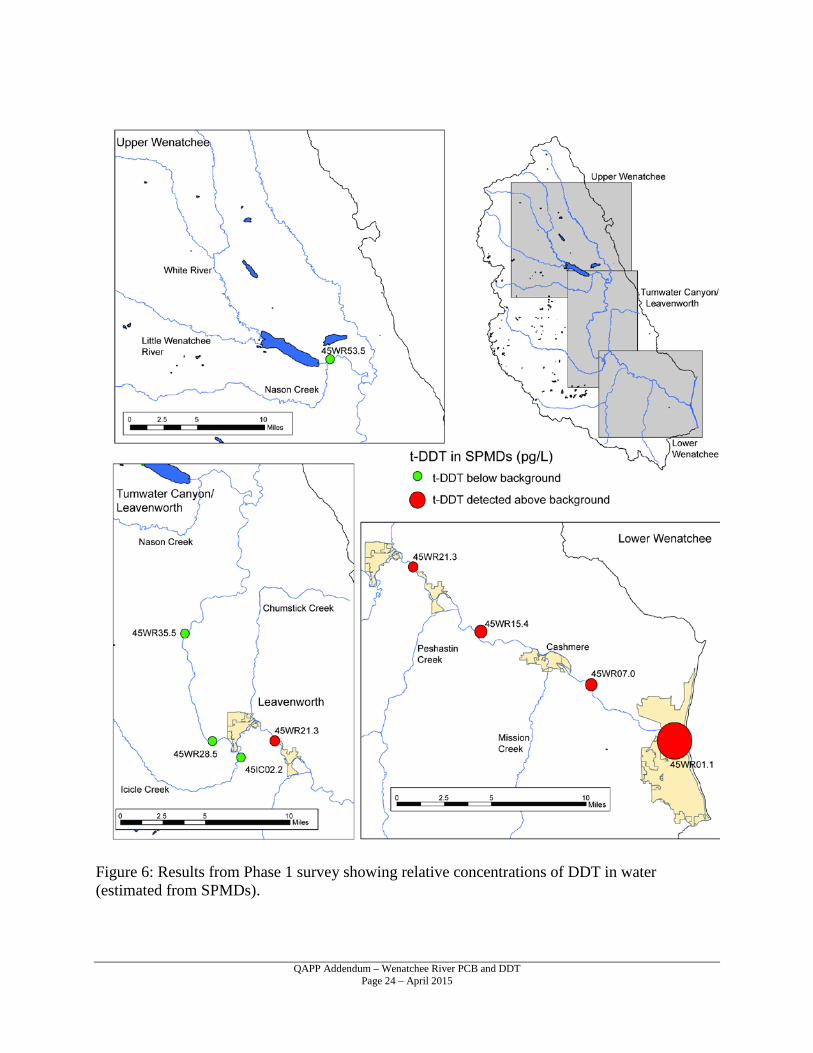
Figure 6: Results from Phase 1 survey showing relative concentrations of DDT in water (estimated from SPMDs). .........................................................................24
Tables
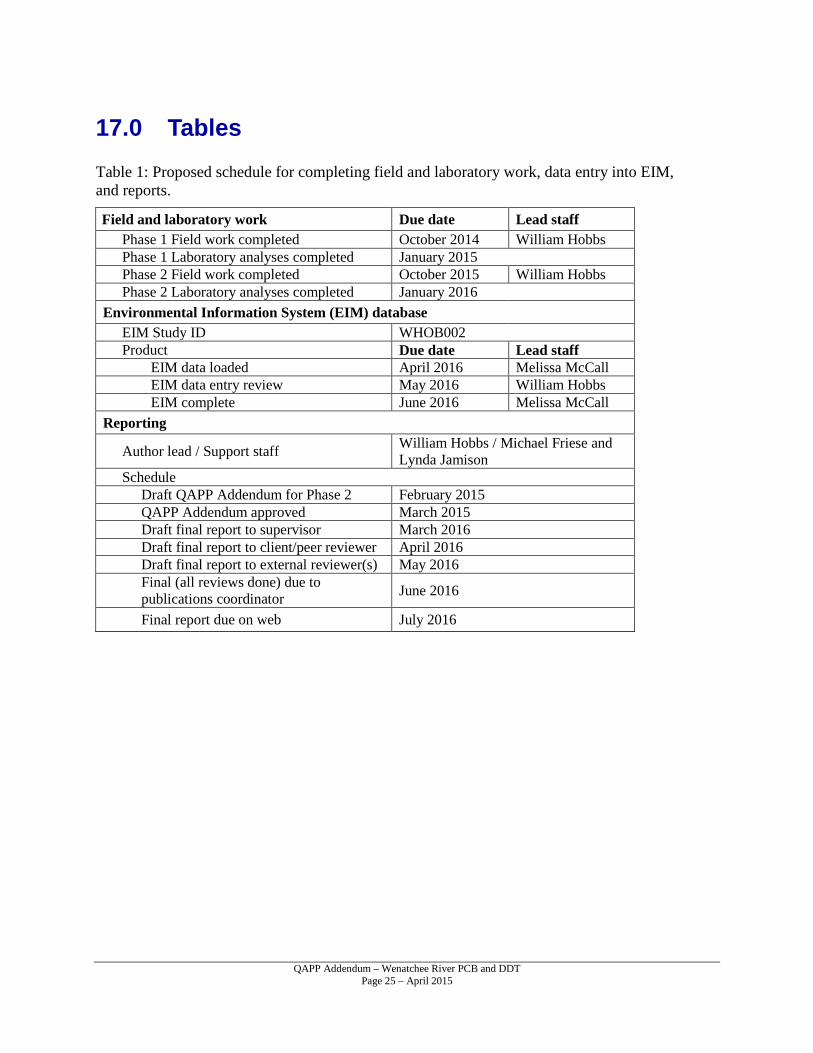
Table 1: Proposed schedule for completing field and laboratory work, data entry into EIM, and reports. ...............................................................................................25
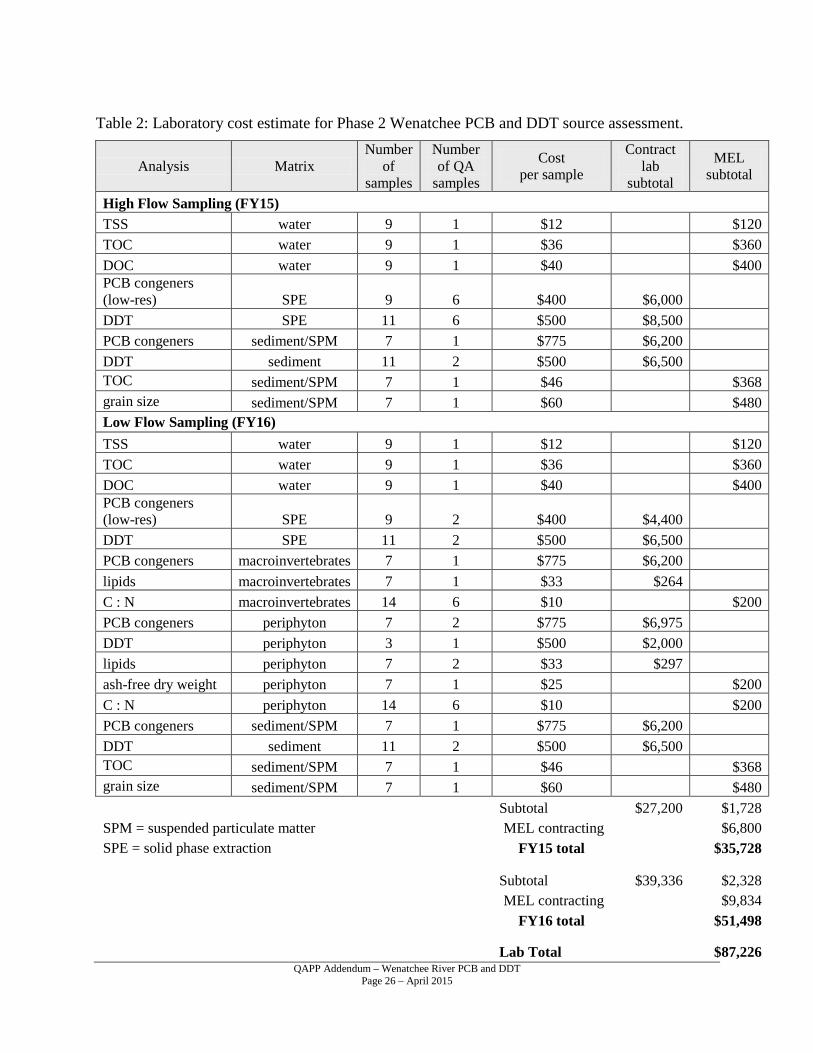
Table 2: Laboratory cost estimate for Phase 2 Wenatchee PCB and DDT source assessment. .........................................................................................................26
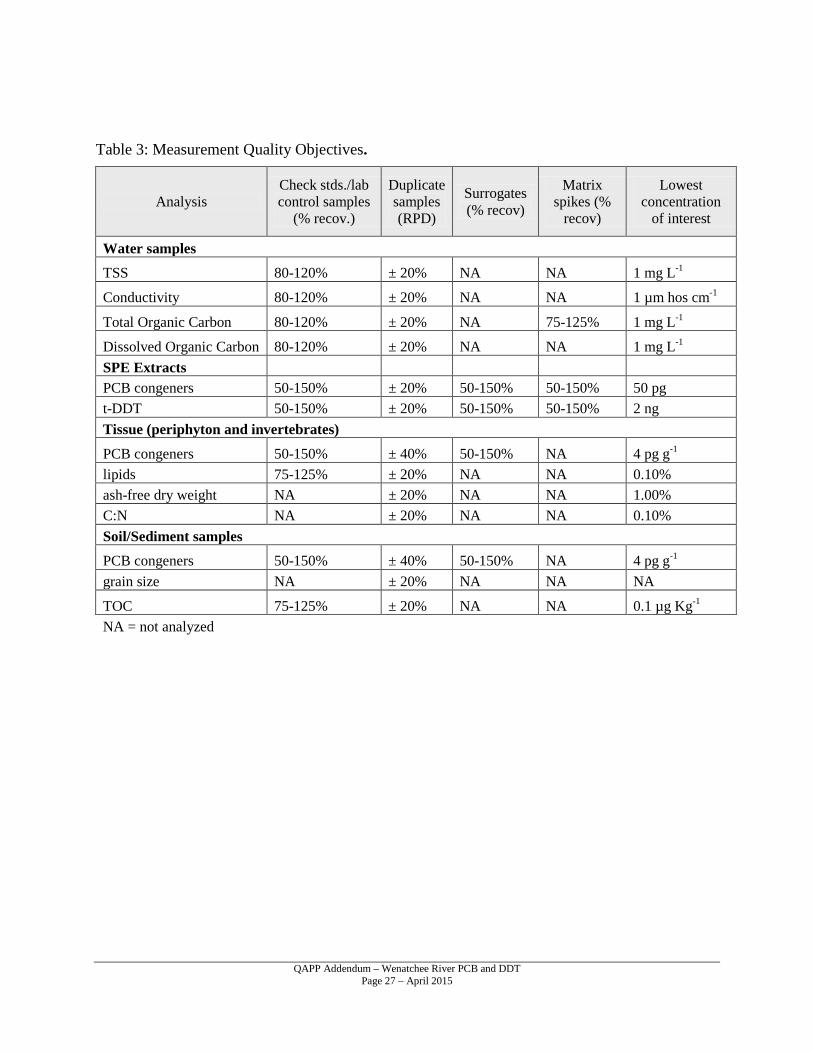
Table 3: Measurement Quality Objectives. .......................................................................27
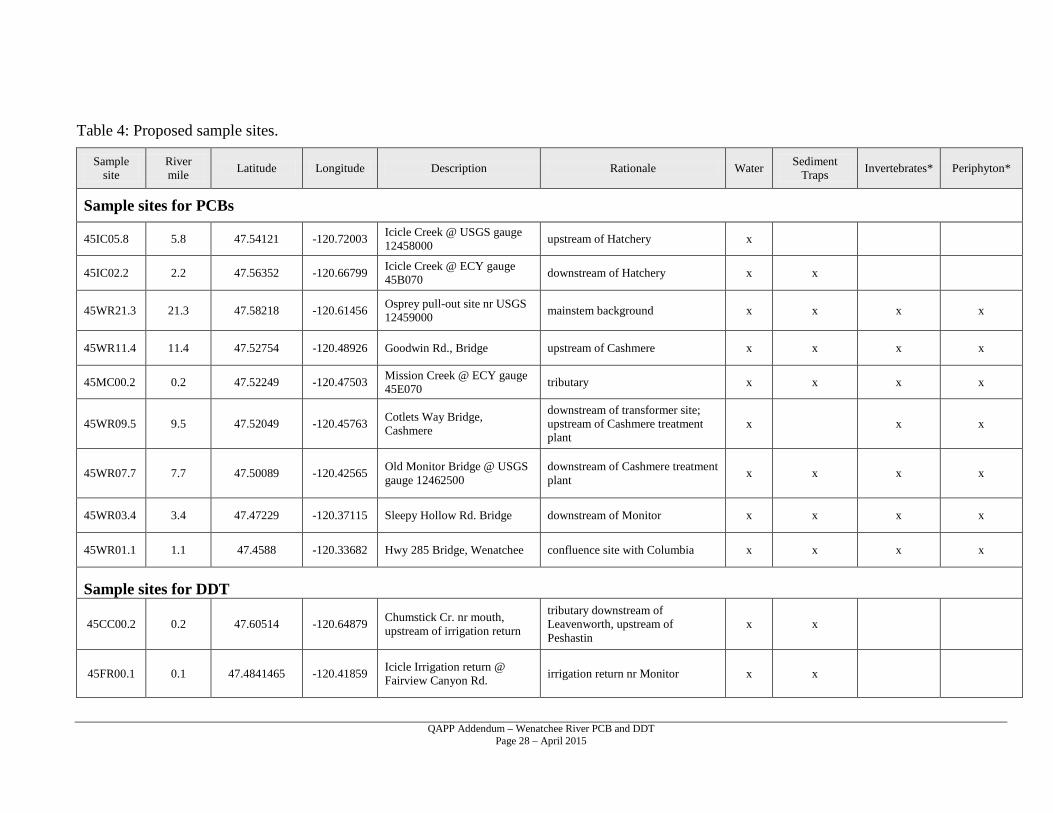
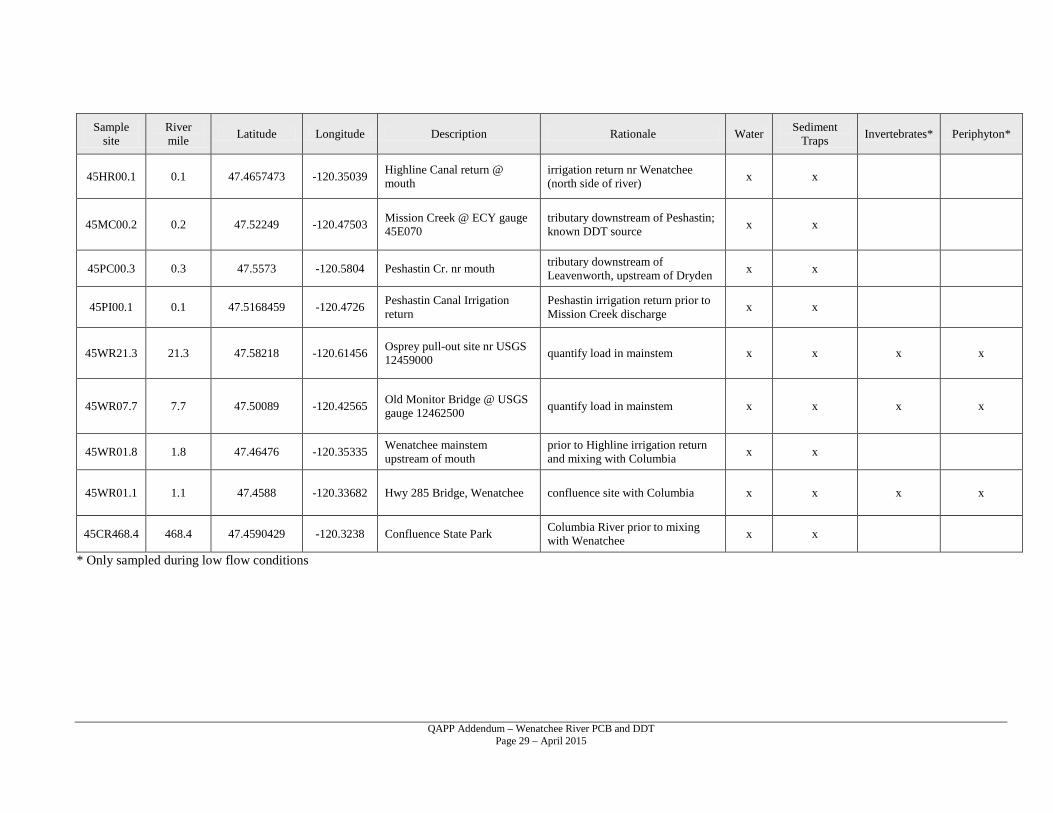
Table 4: Proposed sample sites. .........................................................................................28
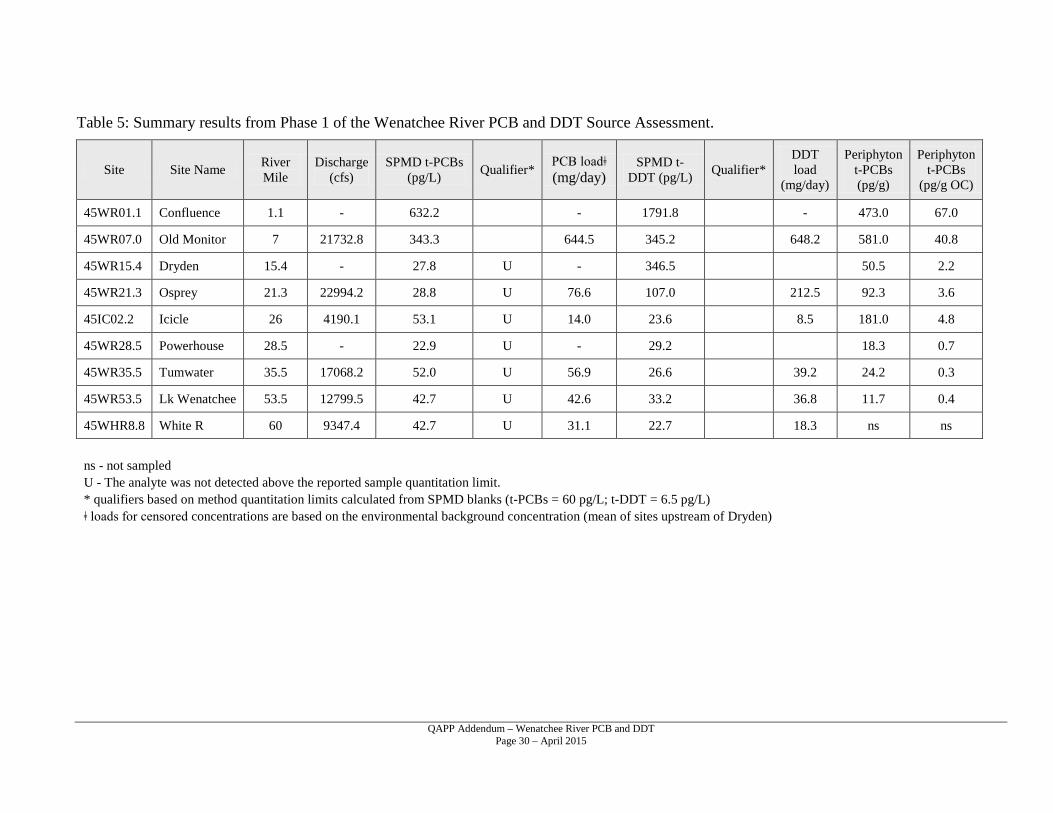
Table 5: Summary results from Phase 1 of the Wenatchee River PCB and DDT Source Assessment. ........................................................................................................30
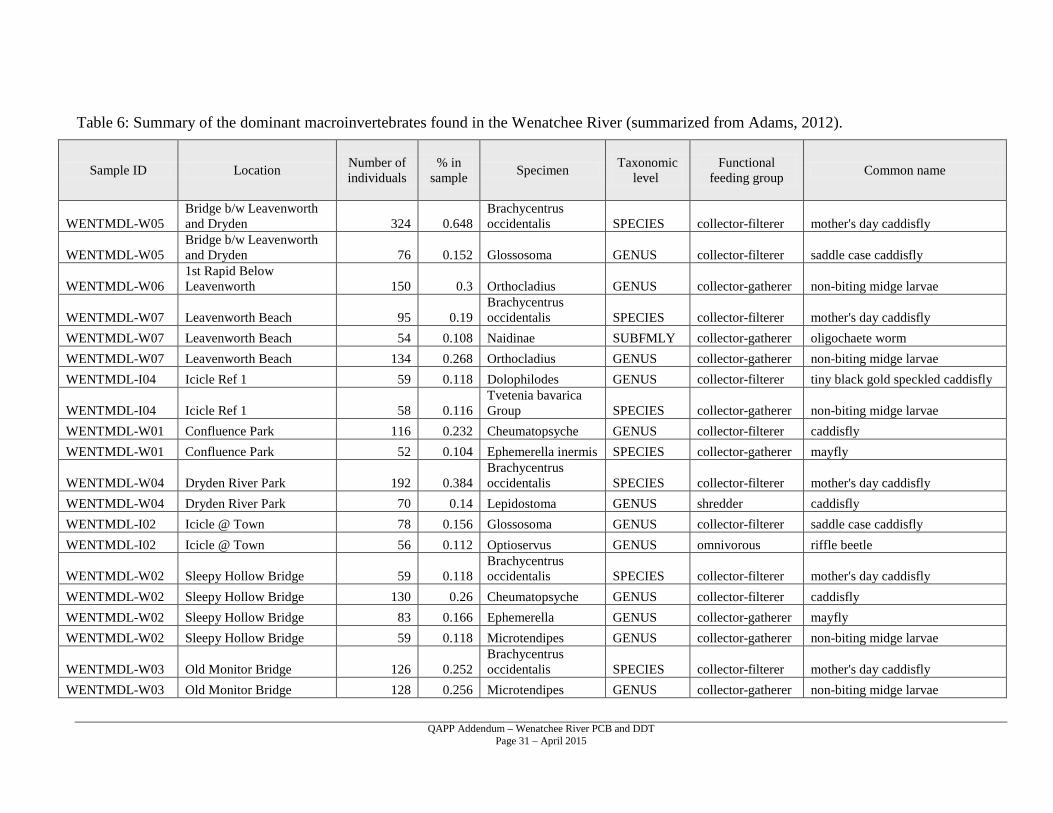
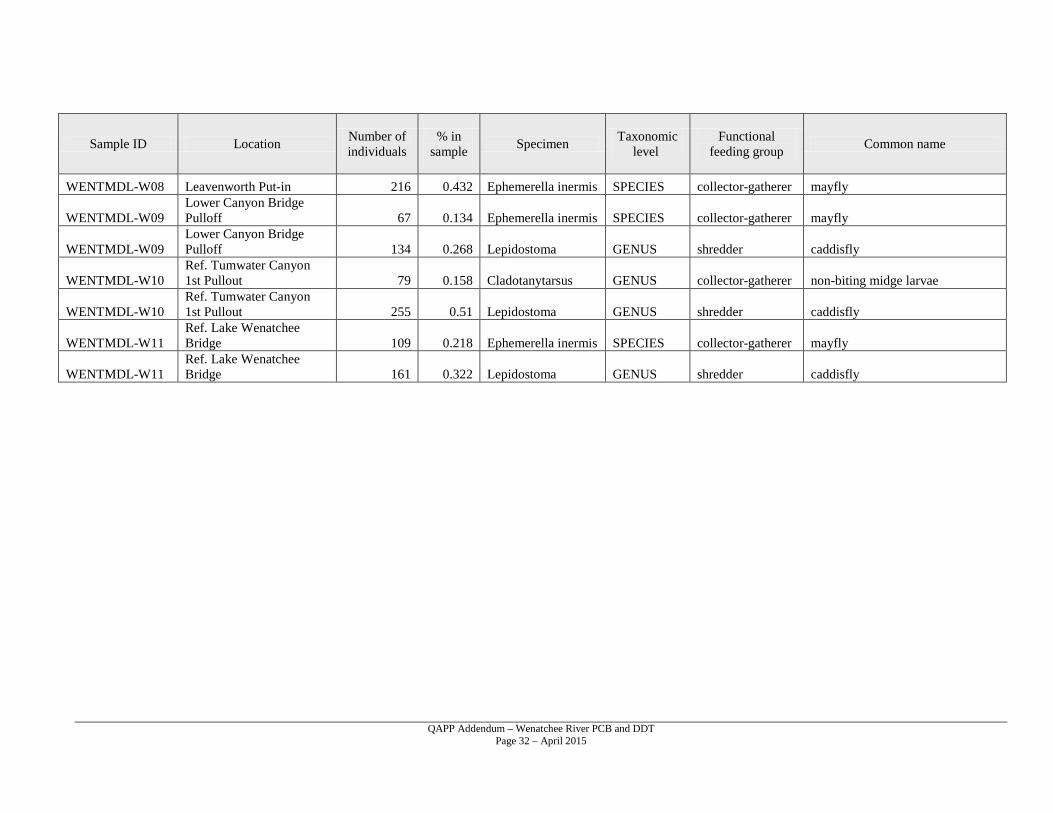
Table 6: Summary of the dominant macroinvertebrates found in the Wenatchee River (summarized from Adams, 2012). ......................................................................31
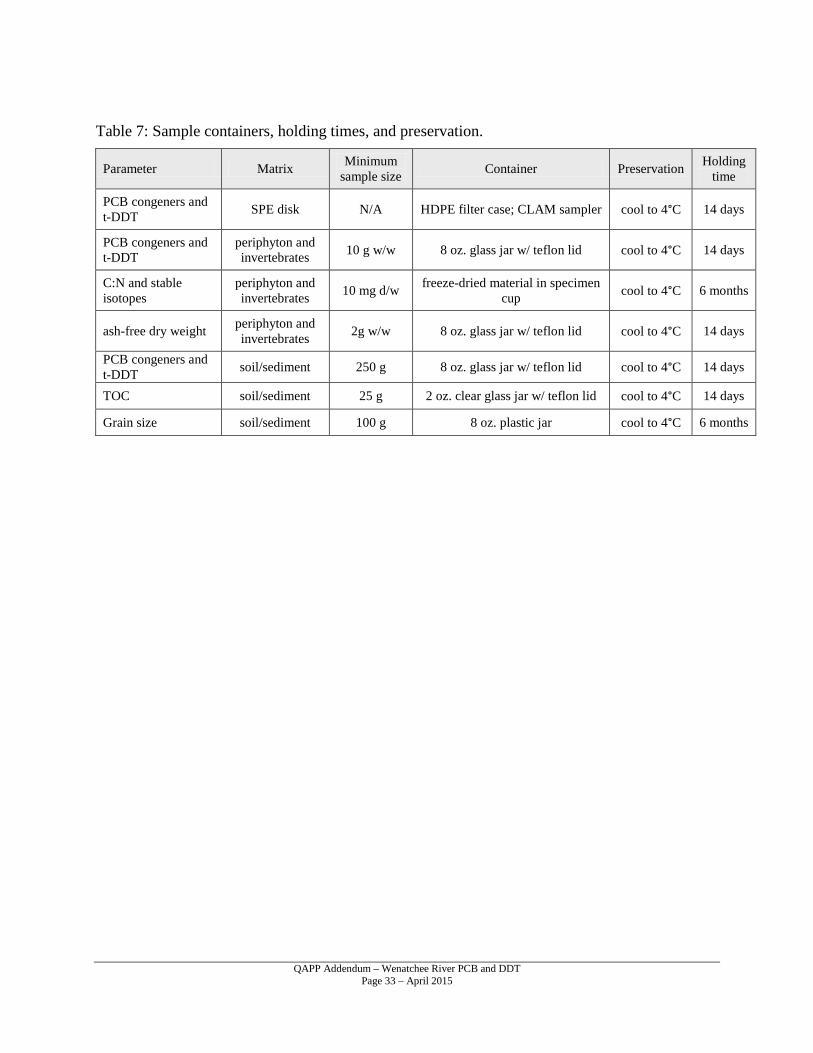
Table 7: Sample containers, holding times, and preservation. ..........................................33
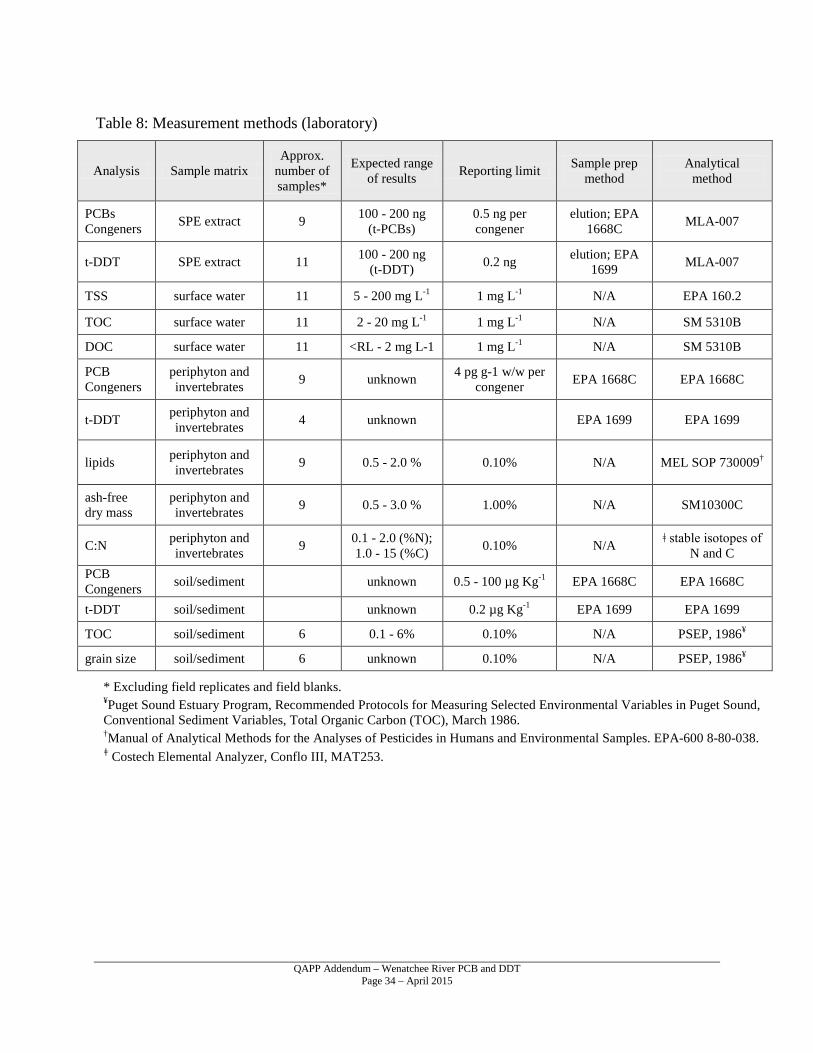
Table 8: Measurement methods (laboratory) .....................................................................34
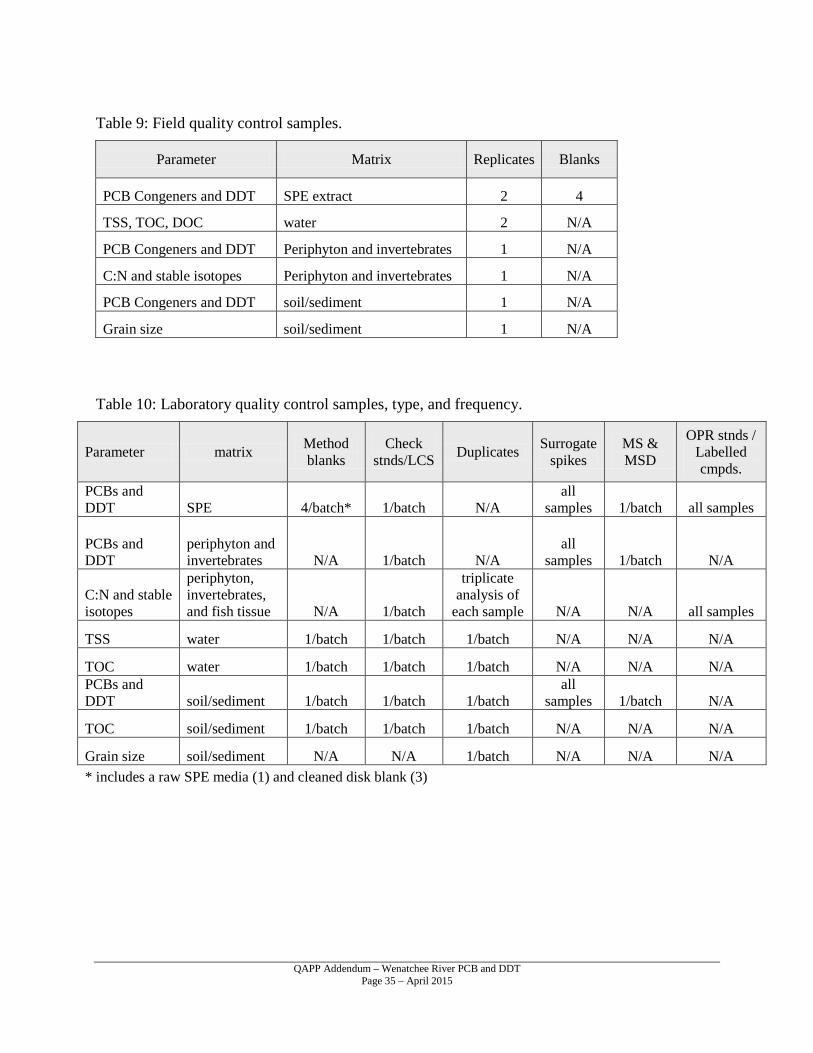
Table 9: Field quality control samples. ..............................................................................35
Table 10: Laboratory quality control samples, type, and frequency. .................................35
QAPP Addendum – Wenatchee River PCB and DDT Page 5 – April 2015
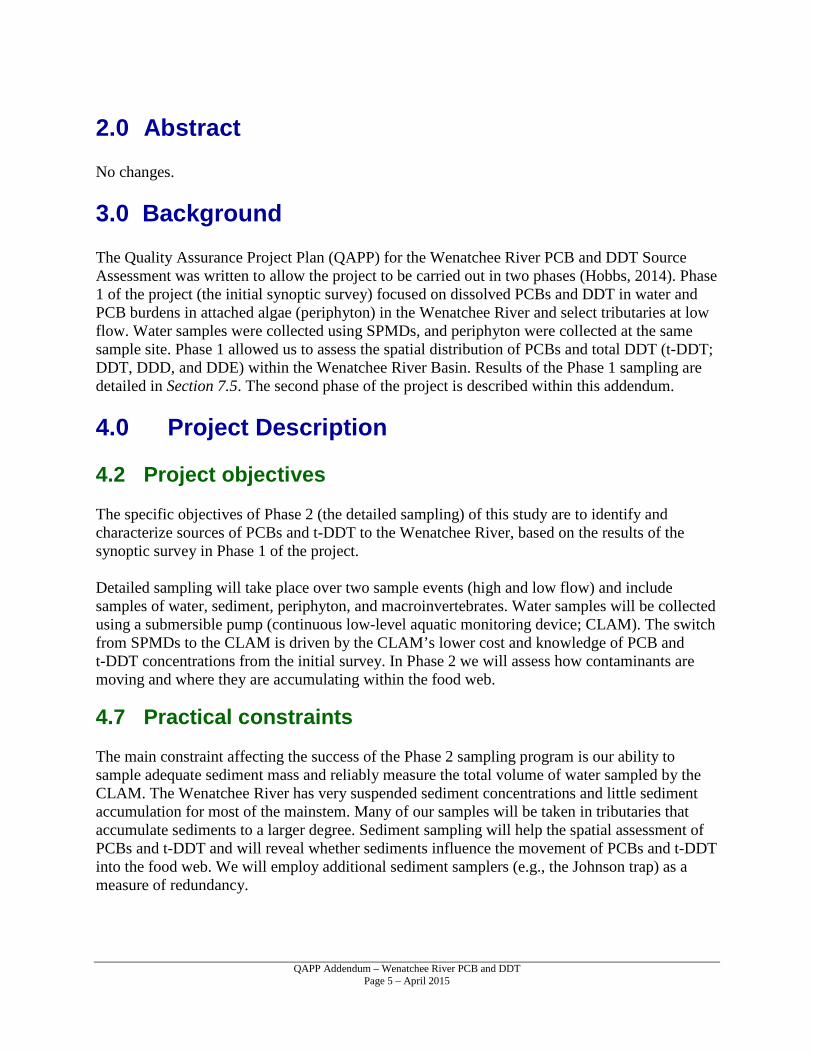
2.0 Abstract No changes. 3.0 Background The Quality Assurance Project Plan (QAPP) for the Wenatchee River PCB and DDT Source Assessment was written to allow the project to be carried out in two phases (Hobbs, 2014). Phase 1 of the project (the initial synoptic survey) focused on dissolved PCBs and DDT in water and PCB burdens in attached algae (periphyton) in the Wenatchee River and select tributaries at low flow. Water samples were collected using SPMDs, and periphyton were collected at the same sample site. Phase 1 allowed us to assess the spatial distribution of PCBs and total DDT (t-DDT; DDT, DDD, and DDE) within the Wenatchee River Basin. Results of the Phase 1 sampling are detailed in Section 7.5. The second phase of the project is described within this addendum. 4.0 Project Description
4.2 Project objectives The specific objectives of Phase 2 (the detailed sampling) of this study are to identify and characterize sources of PCBs and t-DDT to the Wenatchee River, based on the results of the synoptic survey in Phase 1 of the project. Detailed sampling will take place over two sample events (high and low flow) and include samples of water, sediment, periphyton, and macroinvertebrates. Water samples will be collected using a submersible pump (continuous low-level aquatic monitoring device; CLAM). The switch from SPMDs to the CLAM is driven by the CLAM’s lower cost and knowledge of PCB and t-DDT concentrations from the initial survey. In Phase 2 we will assess how contaminants are moving and where they are accumulating within the food web.
4.7 Practical constraints The main constraint affecting the success of the Phase 2 sampling program is our ability to sample adequate sediment mass and reliably measure the total volume of water sampled by the CLAM. The Wenatchee River has very suspended sediment concentrations and little sediment accumulation for most of the mainstem. Many of our samples will be taken in tributaries that accumulate sediments to a larger degree. Sediment sampling will help the spatial assessment of PCBs and t-DDT and will reveal whether sediments influence the movement of PCBs and t-DDT into the food web. We will employ additional sediment samplers (e.g., the Johnson trap) as a measure of redundancy.
QAPP Addendum – Wenatchee River PCB and DDT Page 6 – April 2015
The measurement of water pumped through and sampled by the CLAM will be quantified at each site, with the use of a new optical sensor from the manufacturer. This device has proven accurate (within 1%) in the lab and in preliminary field trials. It deserves mention as a practical constraint because it has not been tested in a true field deployment. 5.0 Organization and Schedule
5.4 Project schedule The overall project timeline is detailed in Table 1.
5.6 Budget and funding Phase 2 laboratory analysis will be completed by January 2016. The estimated analytical budget for Phase 2 of this project will total $87,226 (Table 2), which includes estimated laboratory costs and review of QA/QC. 6.0 Quality Objectives
6.1 Decision Quality Objectives (DQOs) There are no specific decision quality objectives for this project.
6.2 Measurement Quality Objectives A complete summary of measurement quality objectives (MQOs) for this project is detailed in Table 3. All laboratory quality assurance/quality control (QA/QC) measures are documented in MEL’s Laboratory Quality Assurance Manual (MEL, 2012). Laboratory quality control measures include the analysis of check standards, duplicates, spikes, and blanks. Check standards or laboratory control samples are perhaps the most important for the evaluation of analytical bias. Duplicates and matrix spikes help to evaluate any effects of sample matrix on the data quality. Blanks aid in determining interferences and bias for low concentrations near analytical detection limits. 6.2.1 Targets for Precision, Bias, and Sensitivity 6.2.1.1 Precision Field replicate samples will be collected at a frequency of 1 in 10. The defined relative percent difference for water and CLAM samplers is ± 20% and generally ± 40% for solids that tend to be more heterogeneous in nature. Replicates are collected either simultaneously or as close together as possible. Field splits will be possible for the periphyton and invertebrate tissues, where samples are split following homogenization in the lab.
QAPP Addendum – Wenatchee River PCB and DDT Page 7 – April 2015
6.2.1.2 Bias The bias of the lab instruments will be assessed by MEL and the contract lab through lab blanks and recovery of LCS and matrix spikes. The expected bias for the high-resolution analysis of PCBs and t-DDT is 50-150% recovery of matrix spikes (Table 3). Field trip blanks will be conducted for the CLAM. The field blank CLAM is taken into the field and opened for the same duration of time that the sample CLAM is exposed to the air during deployment. The blank is sealed, transported cold back to Ecology, and stored frozen. One field blank will be used. Laboratory CLAM blanks on sample media and materials will also be carried out. Raw solid-phase extraction (SPE) media and three assembled SPE disks will be analyzed to quantify the background manufacturing contamination. 6.2.1.3 Sensitivity The expected lowest concentration of interest for each parameter is detailed in Table 3. These values are based on the method detection limits for each parameter. 6.2.2 Targets for Comparability, Representativeness, and Completeness 6.2.2.1 Comparability To ensure comparability among projects, the following standard operating procedures (SOPs) will be followed: • Standard Operating Procedures for the Collection of Periphyton Samples for TMDL studies
(Mathieu et al., 2013). • Standard Operating Procedures and Minimum Requirements for the Collection of Freshwater
Benthic Macroinvertebrate data in Wadeable Streams and Rivers (Adams, 2010). • Standard Operating Procedure for Obtaining Freshwater Sediment Samples (Blakley, 2008). • Standard Operating Procedures for Decontaminating Field Equipment for Sampling Toxics in
the Environment (Friese, 2014). There is no approved SOP for the CLAM device. A detailed overview of the sampler is found in Appendix A. 6.2.2.2 Representativeness Sampling will take place during a high-flow period (May) and a low-flow period (September). We anticipate that the river at higher flow will have a higher sediment load, calculated as total suspended sediment (TSS). We will assess the PCB load under these conditions. Based on previous work in the Wenatchee River and Mission Creek, May is a period when high TSS can
QAPP Addendum – Wenatchee River PCB and DDT Page 8 – April 2015
be expected (Serdar and Era-Miller, 2004; Carroll and O’Neal, 2005). This approach will not quantify the partitioning of PCBs in the river, but it will show us spatially where there is potential for accumulation of PCB-laden sediments. In addition, the contribution of t-DDT from tributaries and irrigation returns to the Wenatchee River is likely to be greater during high flow/high TSS conditions. We will also repeat the timing of the low-flow sampling to be comparable to Phase 1 sampling and to represent baseflow conditions. Periphyton sampling proved an effective media to assess the spatial distribution of contaminants in the Wenatchee River. Phase 2 (detailed sampling) will include further periphyton samples for spatial assessment; they integrate PCBs over a longer period of time than the CLAM does. In addition, we will use periphyton and invertebrates to establish the pathway of PCBs and t-DDT to mountain whitefish. In order to assess the retention of contaminants in the CLAM –SPE disks, the contract lab will spike labeled congeners and compounds into the disks prior to deployment in the field. This effort is akin to using the performance reference compounds (PRCs) in the SPMDs during the first phase of the project. 6.2.2.3 Completeness Similar to Phase 1, a minimum of 2 reliable detections of low-level PCBs in the lower reach of the Wenatchee River (Fig. 9) will give a minimum completeness coverage of the basin. We will not be duplicating the field deployment of CLAMs, as we did in Phase 1 sampling. This is because the budget is limited and because the deployment time of only 36 hours decreases the likelihood of vandalism. 7.0 Sampling Process Design (Experimental
Design)
7.1 Study Design This study has been initiated because resident fish species in the Wenatchee River, particularly mountain whitefish (MWF; Prosopium williamsoni), have routinely had among the highest documented PCB concentrations in Washington (Seiders et al., 2012). MWF tissue is also contaminated with DDT and metabolites. Wenatchee MWF are accumulating PCBs and t-DDT from their diet and possibly absorbing dissolved PCBs from the water column. The Phase 1 sampling program was designed to assess water and algae concentrations. The Phase 2 sampling program will consider multiple media. Water samples will allow us to evaluate the spatial distribution and relative concentrations of dissolved PCBs and t-DDT within the Wenatchee River Basin. Through biotic and sediment sampling, we can assess how contaminants move and accumulate within the food web of the Wenatchee River and lead to excessive concentrations in fish tissue.

QAPP Addendum – Wenatchee River PCB and DDT Page 9 – April 2015
QAPP Addendum – Wenatchee River PCB and DDT Page 10 – April 2015
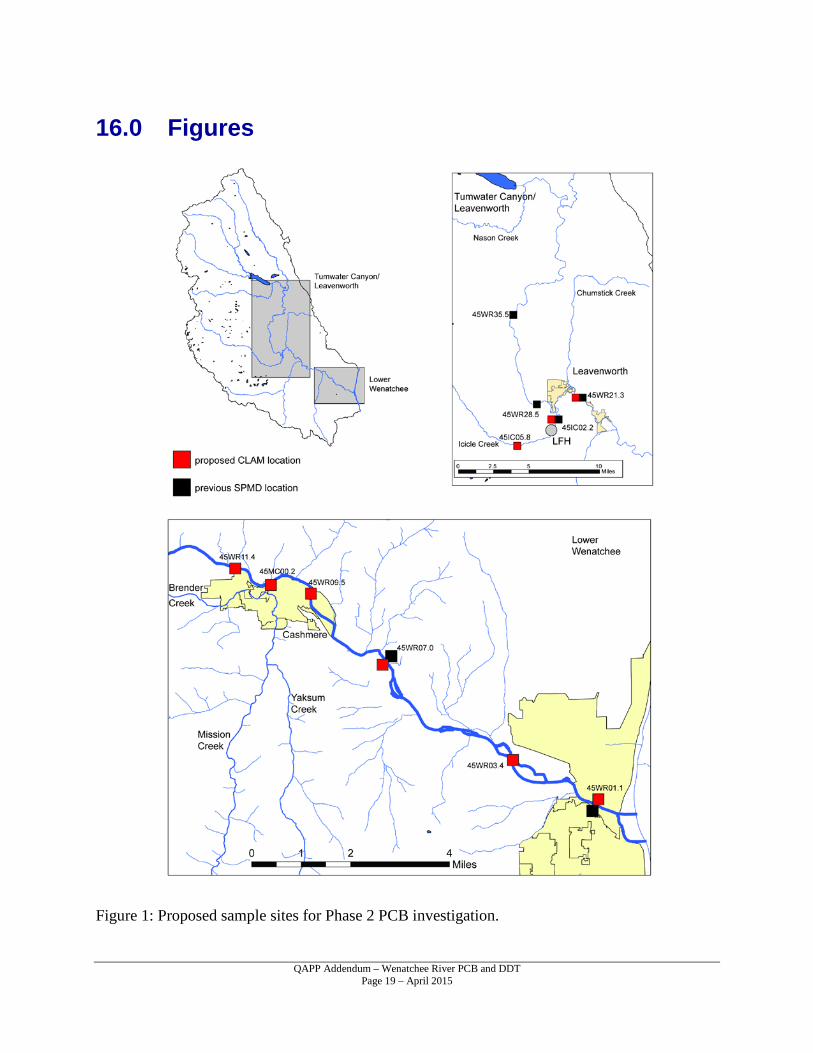
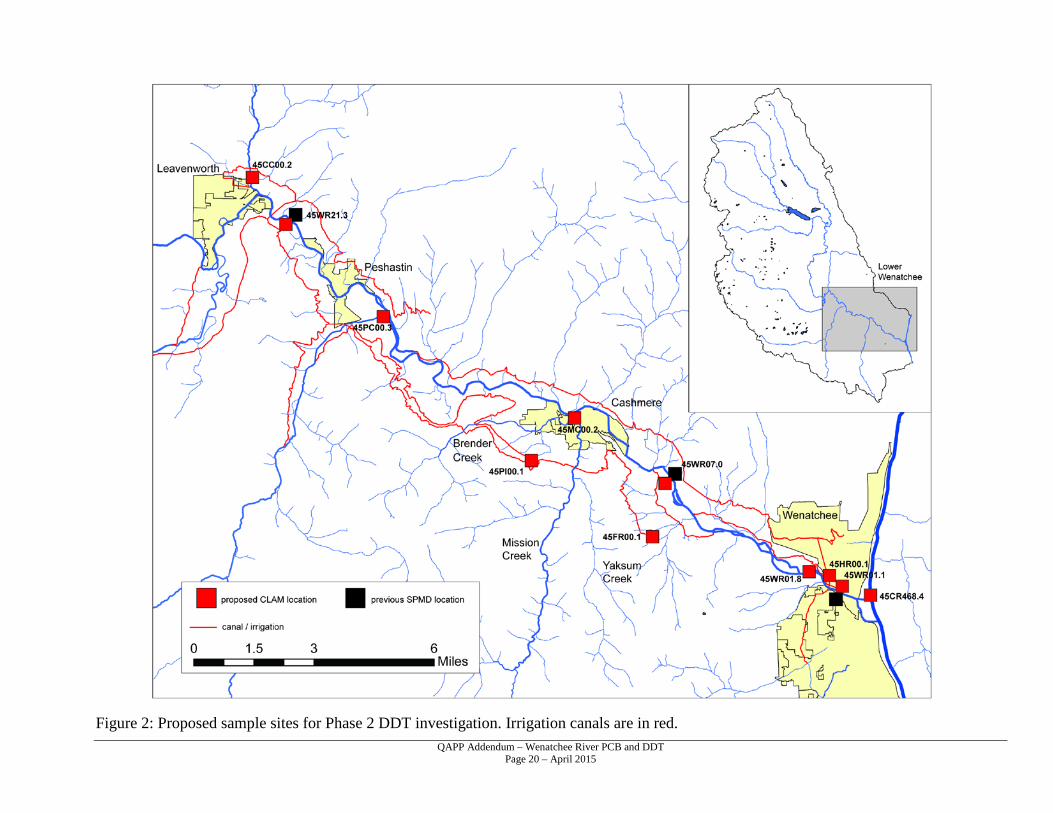
7.1.1 Field measurements Field observations of river flow, turbidity, and site conditions will be recorded at the time of sampling. Field measurements of pH, conductivity, and temperature will also be taken in concert with sampling at each site. 7.1.2 Sampling location and frequency The Phase 2 detailed sampling plan will focus on (1) the Lower Wenatchee River, from Dryden downstream and Icicle Creek for PCB sources, and (2) the Lower Wenatchee River, tributaries, and irrigation returns from Leavenworth downstream for t-DDT contributions. Sampling will address concentrations at high and low flow. Nine CLAM sampling locations will be established to further identify the source of PCBs. Eleven CLAM locations will be used to assess t-DDT levels (Figure 1 and 2; Table 4). The locations of the CLAMs are based on the Phase 1 initial survey that used SPMDs. Sampling will take place in spring (May) and late summer (September) of 2015. CLAM devices will be secured to cement blocks, tethered to the bank with rebar and cable, and immersed at the study site for approximately 36 hours. Ancillary parameters will be measured in grab samples collected at the time of CLAM deployment. All proposed sites have been previously verified through the Phase 1 sampling and the previous TMDL (Carroll and O’Neal, 2005). During the low-flow sampling, sites will be sampled for periphyton, invertebrates, and sediments (Table 4) Further field activities will include:
• Collecting mountain whitefish to analyze gut contents during the May sampling event. This is to confirm diet prior to the invertebrate sampling and provide data for any bioaccumulation models in the future.
• Surveying the river at low-flow to follow up on the discovery and removal of a transformer from the Wenatchee River near the City of Cashmere.
7.1.3 Parameters to be determined Media and parameters included in the sampling program are: • Water (sampled using continuous low-level aquatic monitoring (CLAM) pumps with solid
phase extraction disks) – PCBs and DDT. • Water (collected as grab samples) – total suspended solids (TSS), total organic carbon
(TOC), dissolved organic carbon (DOC). • Suspended sediments (collected using in-stream sediment traps) – PCBs, DDT, grain size,
and TOC. • Periphyton – PCBs, DDT (select samples), lipid content, carbon and nitrogen composition
and stable isotope ratios, and ash-free dry weight. • Macroinvertebrates – PCBs, DDT (select samples), lipid content, carbon and nitrogen
composition and stable isotope ratios, and ash-free dry weight.
QAPP Addendum – Wenatchee River PCB and DDT Page 11 – April 2015
High resolution gas chromatography/mass spectrometry (HR GC/MS) will be carried out to characterize PCB congener patterns (all 209 congeners will be reported) in media, except the CLAM-SPE disks, for the area of concern and to gain suitably low detection limits. Total-DDT will also be analyzed using HR GC/MS, except for the CLAM-SPE disks. For the CLAM-SPE disks, low resolution (LR) GC/MS will be used to analyze for all 209 PCB congeners and t-DDT. The concentrations measured in Phase 1 of the project are high enough that LR GC/MS will suffice and will save money for the project. Stable isotope ratios and elemental abundance of carbon (C) and (N) will be added to the suite of analysis on the biotic media. The use of nitrogen stable isotopes (δ15N) in particular has been helpful in previous studies to infer trophic position within the food web at a specific site (McIntyre and Beauchamp, 2007). Trophic position is an important factor in the accumulation of organochlorine and other bioaccumulative compounds. By analyzing the δ15N and PCB and t-DDT concentrations of biotic tissues in this study, we can show how the contaminants accumulate within the food web of the Wenatchee River.
7.2 Maps or diagram The findings from Phase 1 of the investigation are shown in Figures 3 through 6. In general, there is a clear pattern for both PCBs and DDT, which will help focus our efforts in Phase 2. The proposed locations of the CLAM samplers are detailed in Figures 1 and 2, and Table 4. The rationale for the site locations is detailed in Table 4.
7.3 Assumptions underlying design During the initial basin-wide survey, concentrations of dissolved PCBs and DDT were assessed using SPMDs and periphyton samples. The timing of this event was at low-flow (base flow) when groundwater was likely a significant hydrologic input. We are therefore assuming that the spatial distribution of PCBs and DDT during higher flow would have a similar distribution across the basin. Based on previous sampling using SPMDs, higher concentrations of PCBs prevail during low-flow periods (MacCarthy and Gale, 1999; Sandvik, 2009).
7.4 Relation to objectives and site characteristics No changes.
7.5 Characteristics of existing data The Phase 1 initial survey using SPMDs and periphyton showed some distinct spatial trends (Figure 3 and 4). The following observations can be made about PCBs in the Wenatchee River:
• PCB concentrations increase by an order of magnitude at Old Monitor Bridge, downstream of Cashmere (Table 5).
QAPP Addendum – Wenatchee River PCB and DDT Page 12 – April 2015
• Minor contamination (based on the periphyton sample) is present in Icicle Creek.
• Concentrations of PCBs bound to attached algae (periphyton) show a very similar trend to SPMDs (Figure 5). Periphyton represents the base of the food web in the Wenatchee River.
• Total suspended sediments and dissolved organic carbon were less than method detection limits during sampling, suggesting that most (~ 95%) of the measured PCBs were in dissolved form.
• PCB congener patterns at the highest measured sites (Table 5; Old Monitor and Confluence) suggest different sources.
The following observations can be made about t-DDT in the Wenatchee River:
• Total-DDT contamination is present from downstream of Leavenworth to the confluence with the Columbia River (Figure 6; Table 5).
• Possible inputs to the mainstem Wenatchee include: Chumstick Creek, Peshastin Creek, Mission Creek (Serdar and Era-Miller, 2004), and irrigation returns.
• Total suspended sediments and dissolved organic carbon were less than method detection limits during sampling, suggesting that most (~ 95%) of the measured t-DDT was in dissolved form.
• Significantly higher (by an order of magnitude) concentrations were measured at the confluence with the Columbia River, where waters are mixed.
8.0 Sampling Procedures
8.1 Field measurement and field sampling SOPs 8.1.1 Water sampling CLAM samplers are vessels for solid-phase extraction (SPE) disks, which are mainly used in a laboratory setting to concentrate organic contaminants from large volumes of sample (EPA 3535). Similar to SPMDs, they provide a time-integrated sample; however, they are not passive devices. CLAMs contain a small, sealed pump behind the SPE that draws water through the device at a rate of 5-70 ml per minute. The typical period of deployment is 24-36 hours. Biofouling of the device is the primary concern during deployment and therefore sampling during a period of high TSS may reduce the efficacy of the sampler. There is no established SOP for CLAMs; however, they are being used in a number of studies at Ecology (Coots, 2014; Hobbs, 2014). A more extensive description of the device and limitations can be found in Appendix A. The C-18 SPE media for hydrophobic compounds will be used in this sampling program. The SPE disks are shipped and secured in a high-density polypropylene cartridge. SPE disks will be supplied by CI Agent Storm-Water Solutions, the supplier of the CLAM device. Disks will be shipped directly to the contract laboratory where they can be cleaned and conditioned with solvents prior to use in the field. The SPE media will be spiked
QAPP Addendum – Wenatchee River PCB and DDT Page 13 – April 2015
with the same labeled PRC compounds as the SPMDs (PCB-31L, PCB-95L, and PCB 153L), however these compounds are present only to observe retention of PCBs in the field. For capturing organochlorine compounds, the C-18 media SPE will be used. CLAMs will be secured within the water column by tethering or anchoring to rebar or a cement block and deployed for ~ 36 hours. At retrieval, the SPE disks are removed from the devices and cooled on ice. Disks are shipped for extraction within 14 days. Using the mass of organic compounds analyzed within the SPE and the measured sample volume, an average water concentration over the period of deployment can be calculated. 8.1.2 Biotic media 8.1.2.1 Periphyton Described in the original QAPP (Hobbs, 2014). 8.1.2.2 Macroinvertebrates Benthic macroinvertebrates have been collected at some sites in the Wenatchee River Basin in previous studies (Adams, 2012). However, the goal of the previous assessments was taxonomic, leading to the calculation of biotic indices of environmental quality based on community structure. Indices were used to describe impacted areas of the river relative to nutrient, temperature, and dissolved oxygen stresses. In this study we are primarily interested in the PCB burdens of caddisfly larvae (Trichoptera spp.) and mayfly larvae (Ephemeroptera spp.). These two organisms are most abundant (Adams, 2012; Table 6), have similar diets and feeding habits (collector-filterers and collector-gatherers), and are likely the main food source for mountain whitefish (Northcote and Ennis, 1994). Samples will be collected using the standard kick-net approach (Adams, 2010) and picking specimens from overturned rocks in the riverbed. Taxonomic sampling usually targets complete community representation, but sampling for contaminant burdens requires only attaining enough sample mass from a consistent functional group. Staff will wear nitrile gloves while sampling and will pick specimens from either the net or the underside of rocks, using stainless steel tweezers. Specimens will be immediately placed in a cleaned glass jar and stored on ice. 8.1.2.3 Mountain Whitefish (MWF) Stomach Contents We will verify the diet of resident MWF before we sample invertebrates and will use this information in future bioaccumulation modeling. We will catch a small number of MWF in the spring of 2015 and analyze their gut contents. Fish will be caught, using hook and line, in locations near Leavenworth and Wenatchee, near the confluence. These two locations have historically shown the highest PCB concentrations in MWF (Seiders et al., 2012). Protocols of the Freshwater Fish Contaminant Monitoring Program will be followed, including gathering weight and length data in the field (Seiders et al., 2012). Approximately 10 fish at each location will be gathered for analysis. Fish will be stored on ice and transported back to Ecology for processing. Fish guts will be extracted and analyzed at the Ecology Benthic Lab. Age structures will be removed and each fish will be sexed. Tissue samples will be composited to give two,
QAPP Addendum – Wenatchee River PCB and DDT Page 14 – April 2015
five-fish composites. A small aliquot will be analyzed for C and N stable isotopes and the remainder archived for future analysis. 8.1.3 Suspended Particulate Material/River Bed Sediments Suspended sediment samples will be passively collected using sediment traps over a 2- to 4-week period. We will deploy samplers that have been designed for stormwater studies but function well in rivers (Lubliner, 2012). The Hamlin sampler is designed to segregate sediments into broad grain size subsamples, isolating the finer material. This finer material is of interest when organochlorine compounds are analyzed, because it contains a greater portion of particulate organic carbon to bind PCBs and DDT. The Johnson trap is an additional style of sediment trap that will also be deployed for redundancy. It collects suspended sediment in a polycarbonate tube fixed vertically to a cement block. We anticipate that with both deployments the suspended material will be a combination of fine bedload, bank erosion, and tributary inputs. We will retrieve and homogenize sediments in a stainless steel bowl, prior to subsampling in cleaned glass jars.
8.2 Containers, preservation methods, holding times Details of sample containers, preservation, and holding times are found in Table 7.
8.8 Other activities Invertebrate samples will be crushed and homogenized in stainless steel bowls using scalpels and spoons, to minimize the loss of tissue. We will not process the samples as we would fish tissue (Sandvik, 2014), because this would result in a loss of mass. The entire collected tissue mass will be extracted. 9.0 Measurement Methods
9.2 Lab procedures table. Laboratory procedures are detailed in Table 8. The same contract lab used in the Phase 1 initial sampling will be responsible for the analysis of PCB congeners and t-DDT in SPE media (contained in CLAM samplers), periphyton, invertebrates, and sediments. This will provide consistency in the lab environment, methods, and QC. Analysis of ancillary parameters will be carried out by MEL.
9.3 Sample preparation method(s) Established sample preparation methods are detailed in Table 8.
QAPP Addendum – Wenatchee River PCB and DDT Page 15 – April 2015
10.0 Quality Control (QC) Procedures
10.1 Table of field and lab QC required The necessary QC procedures for field and laboratory methods are detailed in Table 9 and 10. A detailed QC program for CLAMs, the SPE disks, and the raw media has not been formerly defined in an SOP. The following steps will be taken prior to and concomitant with the field work to assess potential contamination from manufacturing: • C-18 media will be used in SPE disks. • All SPE media will be acquired from the same manufactured batch, with the assistance of
CIAgent Solutions (CLAM supplier). • All SPE disks will be cleaned as per specified recommendations of the manufacturer and
spiked with 13C labeled congeners (PCB-31, PCB-95, and PCB-153) and DDT compounds for use as field standards to verify retention.
• Laboratory blanks will include one raw media and three cleaned disk blanks. The lab blanks will also be spiked and act as an on-going performance and recovery (OPR).
Following field deployment additional laboratory QC will be completed: • Spike the disks with EPA 1668C and 1699 surrogate solution and extract (or elute) the disks. • Assess the retention of labeled congeners. • Analyze field replicate. Establishment of the method detection limits (MDLs) will be overseen by MEL. MDLs will be based on laboratory QA considerations (information from blank or control samples and surrogate recoveries) and the number of samples. Anticipated reporting limits are detailed in Table 8. 11.0 Data Management Procedures
11.1 Data recording/reporting requirements PCB and t-DDT residual concentrations from the CLAM-SPE disks will be used to calculate an estimated dissolved concentration in water. A detailed methodology of calculating the estimated water concentration is found in Appendix A.
11.2 Laboratory data package requirements The data package from the contract lab will provide MEL with all the raw data that will include, but not be limited to, a text narrative; analytical result reports; analytical sequence (run) logs, chromatograms, and spectra for all standards, environmental samples, and batch QC samples; and preparation benchsheets. In addition, all of the necessary quality assurance and control documentation will be provided, including results from matrix spikes, replicates, and blanks.
QAPP Addendum – Wenatchee River PCB and DDT Page 16 – April 2015
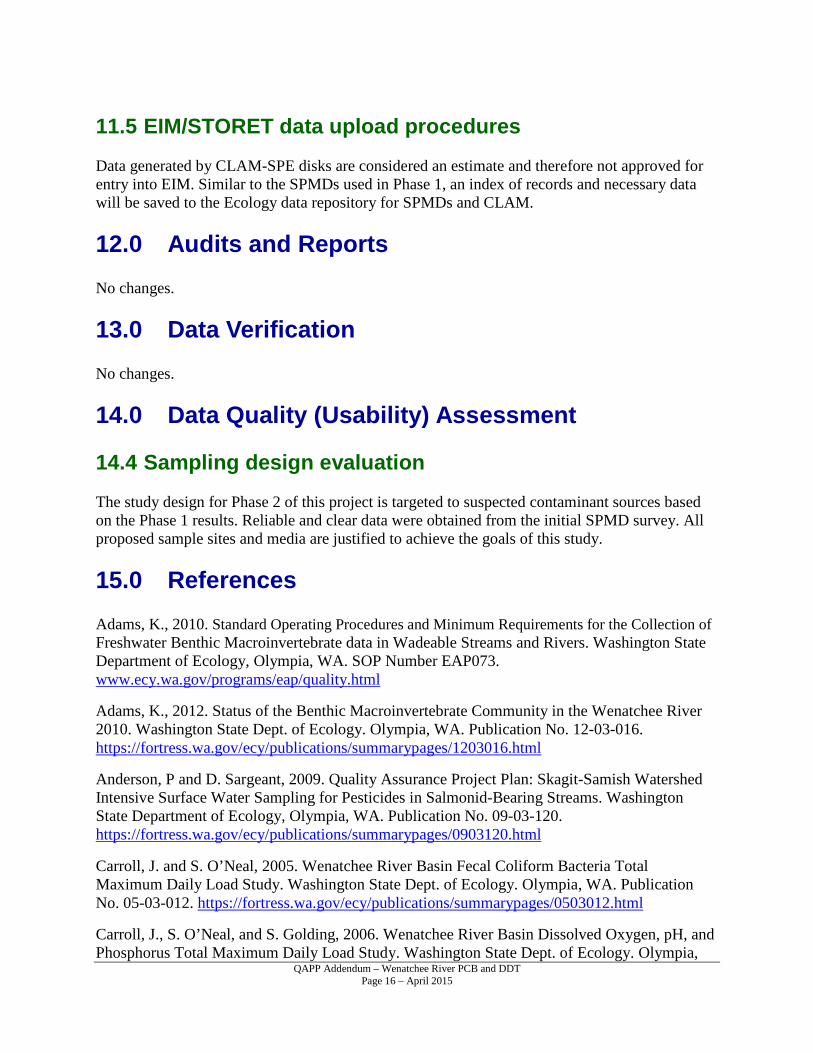
11.5 EIM/STORET data upload procedures Data generated by CLAM-SPE disks are considered an estimate and therefore not approved for entry into EIM. Similar to the SPMDs used in Phase 1, an index of records and necessary data will be saved to the Ecology data repository for SPMDs and CLAM. 12.0 Audits and Reports No changes. 13.0 Data Verification No changes. 14.0 Data Quality (Usability) Assessment
14.4 Sampling design evaluation The study design for Phase 2 of this project is targeted to suspected contaminant sources based on the Phase 1 results. Reliable and clear data were obtained from the initial SPMD survey. All proposed sample sites and media are justified to achieve the goals of this study. 15.0 References Adams, K., 2010. Standard Operating Procedures and Minimum Requirements for the Collection of Freshwater Benthic Macroinvertebrate data in Wadeable Streams and Rivers. Washington State Department of Ecology, Olympia, WA. SOP Number EAP073. www.ecy.wa.gov/programs/eap/quality.html
Adams, K., 2012. Status of the Benthic Macroinvertebrate Community in the Wenatchee River 2010. Washington State Dept. of Ecology. Olympia, WA. Publication No. 12-03-016. https://fortress.wa.gov/ecy/publications/summarypages/1203016.html
Anderson, P and D. Sargeant, 2009. Quality Assurance Project Plan: Skagit-Samish Watershed Intensive Surface Water Sampling for Pesticides in Salmonid-Bearing Streams. Washington State Department of Ecology, Olympia, WA. Publication No. 09-03-120. https://fortress.wa.gov/ecy/publications/summarypages/0903120.html
Carroll, J. and S. O’Neal, 2005. Wenatchee River Basin Fecal Coliform Bacteria Total Maximum Daily Load Study. Washington State Dept. of Ecology. Olympia, WA. Publication No. 05-03-012. https://fortress.wa.gov/ecy/publications/summarypages/0503012.html
Carroll, J., S. O’Neal, and S. Golding, 2006. Wenatchee River Basin Dissolved Oxygen, pH, and Phosphorus Total Maximum Daily Load Study. Washington State Dept. of Ecology. Olympia,
QAPP Addendum – Wenatchee River PCB and DDT Page 17 – April 2015
WA. Publication No. 06-03-018. https://fortress.wa.gov/ecy/publications/summarypages/0603018.html
Coots, R., 2014. PCB Method Comparison of High and Low Resolution Sediment Analysis. Washington State Dept. of Ecology. Olympia, WA. Publication No.14-03-009. https://fortress.wa.gov/ecy/publications/summarypages/1403009.html
Friese, M., 2014. Standard Operating Procedures for Decontaminating Field Equipment for Sampling Toxics in the Environment. Washington State Department of Ecology, Olympia, WA. SOP Number EAP090. www.ecy.wa.gov/programs/eap/quality.html
Hobbs, W., 2014. Quality Assurance Project Plan: Wenatchee River PCB and DDT Source Assessment. Washington State Dept. of Ecology. Olympia, WA. Publication No. 14-03-117. https://fortress.wa.gov/ecy/publications/summarypages/1403117.html
Lombard, S. and C. Kirchmer, 2004. Guidelines for Preparing Quality Assurance Project Plans for Environmental Studies. Washington State Department of Ecology, Olympia, WA. Publication No. 04-03-030. https://fortress.wa.gov/ecy/publications/SummaryPages/0403030.html
Lubliner, B., 2012. Evaluation of Stormwater Suspended Particulate Matter Samplers. Washington State Dept. of Ecology. Olympia, WA. Publication No. 12-03-053. https://fortress.wa.gov/ecy/publications/summarypages/1203053.html
MacKay, D., W.Y. Shui, and K.C. Ma, 1997. Illustrated handbook of physical-chemical properties and environmental fate for organic chemicals. Vol. 5: Pesticide chemicals. CRC Press, Boca Raton, FL.
MacCarthy, K.A. and R.W. Gale, 1999. Investigation of the Distribution of Organochlorine and Polycyclic Aromatic Hydrocarbon Compounds in the Lower Columbia River Using Semipermeable Membrane Devices. U.S. Geological Survey, Portland, Oregon. Water Resources Investigations Report 99-4051.
Mathieu, N., S. Collyard, and T. Mohamedali, 2013. Standard Operating Procedures for the Collection of Periphyton Samples for TMDL studies. Washington State Department of Ecology, Olympia, WA. SOP Number EAP085. www.ecy.wa.gov/programs/eap/quality.html
MEL, 2008. Manchester Environmental Laboratory Lab Users Manual, Ninth Edition. Manchester Environmental Laboratory, Washington State Department of Ecology, Manchester, WA.
MEL, 2012. Manchester Environmental Laboratory Quality Assurance Manual. Manchester Environmental Laboratory, Washington State Department of Ecology, Manchester, WA.
McIntyre, J. and D. Beauchamp, 2007. Age and trophic position dominate bioaccumulation of mercury and organochlorines in the food web of Lake Washington. Science of The Total Environment, 372(2-3), 571-584.

QAPP Addendum – Wenatchee River PCB and DDT Page 18 – April 2015
Northcote, T.G. and G.L. Ennis, 1994. Mountain Whitefish Biology and Habitat Use in Relation to Compensation and Improvement Possibilities. Review in Fisheries Science. 2: 347-371.
Sandvik, P., 2009. Washington State Toxics Monitoring Program: Trends Monitoring for Chlorinated Pesticides, PCBs, and PBDEs in Washington Rivers and Lakes, 2007. Washington State Dept. of Ecology. Olympia, WA. Publication No. 09-03-013. https://fortress.wa.gov/ecy/publications/summarypages/0903013.html
Sandvik, P., 2014. Standard Operating Procedures for Resecting Finfish Whole Body, Body Parts or Tissue Samples. Washington State Department of Ecology, Olympia, WA. SOP Number EAP007. www.ecy.wa.gov/programs/eap/quality.html
Sargeant, D., E. Newell, P. Anderson, and A. Cook, 2013. Surface Water Monitoring Program for Pesticide in Salmon-Bearing Streams, 2009-2011 Triennial Report. A Cooperative Study by the Washington State Departments of Ecology and Agriculture. Washington State Dept. of Ecology. Olympia, WA. Publication No. 13-03-002. https://fortress.wa.gov/ecy/publications/summarypages/1303002.html
Seiders, K., C. Deligeannis, and M. Friese, 2012. Washington State Toxics Monitoring Program: Freshwater Fish Tissue Component, 2010. Washington State Dept. of Ecology. Olympia, WA. Publication No. 12-03-023. https://fortress.wa.gov/ecy/publications/summarypages/1203023.html
Serdar, D. and B. Era-Miller, 2004. DDT Contamination and Transport in the Lower Mission Creek Basin, Chelan County. Washington State Dept. of Ecology. Olympia, WA. Publication No. 04-03-043. https://fortress.wa.gov/ecy/publications/summarypages/0403043.html
WAC 173-201A. Water Quality Standards for Surface Waters in the State of Washington. Washington State Department of Ecology, Olympia, WA. www.ecy.wa.gov/laws-rules/ecywac.html
WAC 173-204. Sediment Management Standards in the State of Washington. Washington State Department of Ecology, Olympia, WA. www.ecy.wa.gov/laws-rules/ecywac.html
QAPP Addendum – Wenatchee River PCB and DDT Page 19 – April 2015
16.0 Figures
Figure 1: Proposed sample sites for Phase 2 PCB investigation.
QAPP Addendum – Wenatchee River PCB and DDT Page 20 – April 2015
Figure 2: Proposed sample sites for Phase 2 DDT investigation. Irrigation canals are in red.
QAPP Addendum – Wenatchee River PCB and DDT Page 21 – April 2015
Figure 3: Results from Phase 1 survey showing relative concentrations of PCBs in water (estimated from SPMDs).
QAPP Addendum – Wenatchee River PCB and DDT Page 22 – April 2015
Figure 4: Results from Phase 1 survey showing relative concentrations of PCBs in periphyton.
QAPP Addendum – Wenatchee River PCB and DDT Page 23 – April 2015
Figure 5: Barplot of PCB results for water concentrations (SPMDs, red bars, primary y-axis) and periphyton concentrations (blue bars, secondary y-axis).
QAPP Addendum – Wenatchee River PCB and DDT Page 24 – April 2015
Figure 6: Results from Phase 1 survey showing relative concentrations of DDT in water (estimated from SPMDs).
QAPP Addendum – Wenatchee River PCB and DDT Page 25 – April 2015
17.0 Tables Table 1: Proposed schedule for completing field and laboratory work, data entry into EIM, and reports.
Field and laboratory work Due date Lead staff Phase 1 Field work completed October 2014 William Hobbs Phase 1 Laboratory analyses completed January 2015 Phase 2 Field work completed October 2015 William Hobbs Phase 2 Laboratory analyses completed January 2016
Environmental Information System (EIM) database EIM Study ID WHOB002 Product Due date Lead staff
EIM data loaded April 2016 Melissa McCall EIM data entry review May 2016 William Hobbs EIM complete June 2016 Melissa McCall
Reporting
Author lead / Support staff William Hobbs / Michael Friese and Lynda Jamison
Schedule Draft QAPP Addendum for Phase 2 February 2015 QAPP Addendum approved March 2015 Draft final report to supervisor March 2016 Draft final report to client/peer reviewer April 2016 Draft final report to external reviewer(s) May 2016 Final (all reviews done) due to publications coordinator June 2016
Final report due on web July 2016
QAPP Addendum – Wenatchee River PCB and DDT Page 26 – April 2015
Table 2: Laboratory cost estimate for Phase 2 Wenatchee PCB and DDT source assessment.
Analysis Matrix Number
of samples
Number of QA
samples
Cost per sample
Contract lab
subtotal
MEL subtotal
High Flow Sampling (FY15) TSS water 9 1 $12 $120 TOC water 9 1 $36
$360
DOC water 9 1 $40
$400 PCB congeners (low-res) SPE 9 6 $400 $6,000
DDT SPE 11 6 $500 $8,500 PCB congeners sediment/SPM 7 1 $775 $6,200 DDT sediment 11 2 $500 $6,500 TOC sediment/SPM 7 1 $46
$368
grain size sediment/SPM 7 1 $60 $480 Low Flow Sampling (FY16) TSS water 9 1 $12 $120 TOC water 9 1 $36
$360
DOC water 9 1 $40
$400 PCB congeners (low-res) SPE 9 2 $400 $4,400
DDT SPE 11 2 $500 $6,500 PCB congeners macroinvertebrates 7 1 $775 $6,200 lipids macroinvertebrates 7 1 $33 $264 C : N macroinvertebrates 14 6 $10
$200
PCB congeners periphyton 7 2 $775 $6,975 DDT periphyton 3 1 $500 $2,000 lipids periphyton 7 2 $33 $297 ash-free dry weight periphyton 7 1 $25
$200
C : N periphyton 14 6 $10
$200 PCB congeners sediment/SPM 7 1 $775 $6,200
DDT sediment 11 2 $500 $6,500 TOC sediment/SPM 7 1 $46
$368
grain size sediment/SPM 7 1 $60 $480
Subtotal $27,200 $1,728 SPM = suspended particulate matter
MEL contracting
$6,800
SPE = solid phase extraction
FY15 total
$35,728
Subtotal $39,336 $2,328
MEL contracting
$9,834
FY16 total
$51,498
Lab Total $87,226
QAPP Addendum – Wenatchee River PCB and DDT Page 27 – April 2015
Table 3: Measurement Quality Objectives.
Analysis Check stds./lab control samples
(% recov.)
Duplicate samples (RPD)
Surrogates (% recov)
Matrix spikes (%
recov)
Lowest concentration
of interest
Water samples
TSS 80-120% ± 20% NA NA 1 mg L-1
Conductivity 80-120% ± 20% NA NA 1 µm hos cm-1
Total Organic Carbon 80-120% ± 20% NA 75-125% 1 mg L-1
Dissolved Organic Carbon 80-120% ± 20% NA NA 1 mg L-1 SPE Extracts
PCB congeners 50-150% ± 20% 50-150% 50-150% 50 pg t-DDT 50-150% ± 20% 50-150% 50-150% 2 ng Tissue (periphyton and invertebrates)
PCB congeners 50-150% ± 40% 50-150% NA 4 pg g-1 lipids 75-125% ± 20% NA NA 0.10% ash-free dry weight NA ± 20% NA NA 1.00% C:N NA ± 20% NA NA 0.10% Soil/Sediment samples
PCB congeners 50-150% ± 40% 50-150% NA 4 pg g-1 grain size NA ± 20% NA NA NA
TOC 75-125% ± 20% NA NA 0.1 µg Kg-1 NA = not analyzed
QAPP Addendum – Wenatchee River PCB and DDT Page 28 – April 2015
Table 4: Proposed sample sites.
Sample site
River mile Latitude Longitude Description Rationale Water Sediment
Traps Invertebrates* Periphyton*
Sample sites for PCBs
45IC05.8 5.8 47.54121 -120.72003 Icicle Creek @ USGS gauge 12458000 upstream of Hatchery x
45IC02.2 2.2 47.56352 -120.66799 Icicle Creek @ ECY gauge 45B070 downstream of Hatchery x x
45WR21.3 21.3 47.58218 -120.61456 Osprey pull-out site nr USGS 12459000 mainstem background x x x x
45WR11.4 11.4 47.52754 -120.48926 Goodwin Rd., Bridge upstream of Cashmere x x x x
45MC00.2 0.2 47.52249 -120.47503 Mission Creek @ ECY gauge 45E070 tributary x x x x
45WR09.5 9.5 47.52049 -120.45763 Cotlets Way Bridge, Cashmere
downstream of transformer site; upstream of Cashmere treatment plant
x x x
45WR07.7 7.7 47.50089 -120.42565 Old Monitor Bridge @ USGS gauge 12462500
downstream of Cashmere treatment plant x x x x
45WR03.4 3.4 47.47229 -120.37115 Sleepy Hollow Rd. Bridge downstream of Monitor x x x x
45WR01.1 1.1 47.4588 -120.33682 Hwy 285 Bridge, Wenatchee confluence site with Columbia x x x x
Sample sites for DDT
45CC00.2 0.2 47.60514 -120.64879 Chumstick Cr. nr mouth, upstream of irrigation return
tributary downstream of Leavenworth, upstream of Peshastin
x x
45FR00.1 0.1 47.4841465 -120.41859 Icicle Irrigation return @ Fairview Canyon Rd. irrigation return nr Monitor x x
QAPP Addendum – Wenatchee River PCB and DDT Page 29 – April 2015
Sample site
River mile Latitude Longitude Description Rationale Water Sediment
Traps Invertebrates* Periphyton*
45HR00.1 0.1 47.4657473 -120.35039 Highline Canal return @ mouth
irrigation return nr Wenatchee (north side of river) x x
45MC00.2 0.2 47.52249 -120.47503 Mission Creek @ ECY gauge 45E070
tributary downstream of Peshastin; known DDT source x x
45PC00.3 0.3 47.5573 -120.5804 Peshastin Cr. nr mouth tributary downstream of Leavenworth, upstream of Dryden x x
45PI00.1 0.1 47.5168459 -120.4726 Peshastin Canal Irrigation return
Peshastin irrigation return prior to Mission Creek discharge x x
45WR21.3 21.3 47.58218 -120.61456 Osprey pull-out site nr USGS 12459000 quantify load in mainstem x x x x
45WR07.7 7.7 47.50089 -120.42565 Old Monitor Bridge @ USGS gauge 12462500 quantify load in mainstem x x x x
45WR01.8 1.8 47.46476 -120.35335 Wenatchee mainstem upstream of mouth
prior to Highline irrigation return and mixing with Columbia x x
45WR01.1 1.1 47.4588 -120.33682 Hwy 285 Bridge, Wenatchee confluence site with Columbia x x x x
45CR468.4 468.4 47.4590429 -120.3238 Confluence State Park Columbia River prior to mixing with Wenatchee x x
* Only sampled during low flow conditions
QAPP Addendum – Wenatchee River PCB and DDT Page 30 – April 2015
Table 5: Summary results from Phase 1 of the Wenatchee River PCB and DDT Source Assessment.
Site Site Name River Mile
Discharge (cfs)
SPMD t-PCBs (pg/L) Qualifier* PCB loadǂ
(mg/day) SPMD t-
DDT (pg/L) Qualifier* DDT load
(mg/day)
Periphyton t-PCBs (pg/g)
Periphyton t-PCBs
(pg/g OC)
45WR01.1 Confluence 1.1 - 632.2 - 1791.8 - 473.0 67.0
45WR07.0 Old Monitor 7 21732.8 343.3 644.5 345.2 648.2 581.0 40.8
45WR15.4 Dryden 15.4 - 27.8 U - 346.5 50.5 2.2
45WR21.3 Osprey 21.3 22994.2 28.8 U 76.6 107.0 212.5 92.3 3.6
45IC02.2 Icicle 26 4190.1 53.1 U 14.0 23.6 8.5 181.0 4.8
45WR28.5 Powerhouse 28.5 - 22.9 U - 29.2 18.3 0.7
45WR35.5 Tumwater 35.5 17068.2 52.0 U 56.9 26.6 39.2 24.2 0.3
45WR53.5 Lk Wenatchee 53.5 12799.5 42.7 U 42.6 33.2 36.8 11.7 0.4
45WHR8.8 White R 60 9347.4 42.7 U 31.1 22.7 18.3 ns ns
ns - not sampled U - The analyte was not detected above the reported sample quantitation limit.
* qualifiers based on method quantitation limits calculated from SPMD blanks (t-PCBs = 60 pg/L; t-DDT = 6.5 pg/L) ǂ loads for censored concentrations are based on the environmental background concentration (mean of sites upstream of Dryden)
QAPP Addendum – Wenatchee River PCB and DDT Page 31 – April 2015
Table 6: Summary of the dominant macroinvertebrates found in the Wenatchee River (summarized from Adams, 2012).
Sample ID Location Number of individuals
% in sample Specimen Taxonomic
level Functional
feeding group Common name
WENTMDL-W05 Bridge b/w Leavenworth and Dryden 324 0.648
Brachycentrus occidentalis SPECIES collector-filterer mother's day caddisfly
WENTMDL-W05 Bridge b/w Leavenworth and Dryden 76 0.152 Glossosoma GENUS collector-filterer saddle case caddisfly
WENTMDL-W06 1st Rapid Below Leavenworth 150 0.3 Orthocladius GENUS collector-gatherer non-biting midge larvae
WENTMDL-W07 Leavenworth Beach 95 0.19 Brachycentrus occidentalis SPECIES collector-filterer mother's day caddisfly
WENTMDL-W07 Leavenworth Beach 54 0.108 Naidinae SUBFMLY collector-gatherer oligochaete worm WENTMDL-W07 Leavenworth Beach 134 0.268 Orthocladius GENUS collector-gatherer non-biting midge larvae WENTMDL-I04 Icicle Ref 1 59 0.118 Dolophilodes GENUS collector-filterer tiny black gold speckled caddisfly
WENTMDL-I04 Icicle Ref 1 58 0.116 Tvetenia bavarica Group SPECIES collector-gatherer non-biting midge larvae
WENTMDL-W01 Confluence Park 116 0.232 Cheumatopsyche GENUS collector-filterer caddisfly WENTMDL-W01 Confluence Park 52 0.104 Ephemerella inermis SPECIES collector-gatherer mayfly
WENTMDL-W04 Dryden River Park 192 0.384 Brachycentrus occidentalis SPECIES collector-filterer mother's day caddisfly
WENTMDL-W04 Dryden River Park 70 0.14 Lepidostoma GENUS shredder caddisfly WENTMDL-I02 Icicle @ Town 78 0.156 Glossosoma GENUS collector-filterer saddle case caddisfly WENTMDL-I02 Icicle @ Town 56 0.112 Optioservus GENUS omnivorous riffle beetle
WENTMDL-W02 Sleepy Hollow Bridge 59 0.118 Brachycentrus occidentalis SPECIES collector-filterer mother's day caddisfly
WENTMDL-W02 Sleepy Hollow Bridge 130 0.26 Cheumatopsyche GENUS collector-filterer caddisfly WENTMDL-W02 Sleepy Hollow Bridge 83 0.166 Ephemerella GENUS collector-gatherer mayfly WENTMDL-W02 Sleepy Hollow Bridge 59 0.118 Microtendipes GENUS collector-gatherer non-biting midge larvae
WENTMDL-W03 Old Monitor Bridge 126 0.252 Brachycentrus occidentalis SPECIES collector-filterer mother's day caddisfly
WENTMDL-W03 Old Monitor Bridge 128 0.256 Microtendipes GENUS collector-gatherer non-biting midge larvae
QAPP Addendum – Wenatchee River PCB and DDT Page 32 – April 2015
Sample ID Location Number of individuals
% in sample Specimen Taxonomic
level Functional
feeding group Common name
WENTMDL-W08 Leavenworth Put-in 216 0.432 Ephemerella inermis SPECIES collector-gatherer mayfly
WENTMDL-W09 Lower Canyon Bridge Pulloff 67 0.134 Ephemerella inermis SPECIES collector-gatherer mayfly
WENTMDL-W09 Lower Canyon Bridge Pulloff 134 0.268 Lepidostoma GENUS shredder caddisfly
WENTMDL-W10 Ref. Tumwater Canyon 1st Pullout 79 0.158 Cladotanytarsus GENUS collector-gatherer non-biting midge larvae
WENTMDL-W10 Ref. Tumwater Canyon 1st Pullout 255 0.51 Lepidostoma GENUS shredder caddisfly
WENTMDL-W11 Ref. Lake Wenatchee Bridge 109 0.218 Ephemerella inermis SPECIES collector-gatherer mayfly
WENTMDL-W11 Ref. Lake Wenatchee Bridge 161 0.322 Lepidostoma GENUS shredder caddisfly
QAPP Addendum – Wenatchee River PCB and DDT Page 33 – April 2015
Table 7: Sample containers, holding times, and preservation.
Parameter Matrix Minimum sample size Container Preservation Holding
time
PCB congeners and t-DDT SPE disk N/A HDPE filter case; CLAM sampler cool to 4°C 14 days
PCB congeners and t-DDT
periphyton and invertebrates 10 g w/w 8 oz. glass jar w/ teflon lid cool to 4°C 14 days
C:N and stable isotopes
periphyton and invertebrates 10 mg d/w freeze-dried material in specimen
cup cool to 4°C 6 months
ash-free dry weight periphyton and invertebrates 2g w/w 8 oz. glass jar w/ teflon lid cool to 4°C 14 days
PCB congeners and t-DDT soil/sediment 250 g 8 oz. glass jar w/ teflon lid cool to 4°C 14 days
TOC soil/sediment 25 g 2 oz. clear glass jar w/ teflon lid cool to 4°C 14 days
Grain size soil/sediment 100 g 8 oz. plastic jar cool to 4°C 6 months
QAPP Addendum – Wenatchee River PCB and DDT Page 34 – April 2015
Table 8: Measurement methods (laboratory)
Analysis Sample matrix Approx.
number of samples*
Expected range of results Reporting limit Sample prep
method Analytical
method
PCBs Congeners SPE extract 9 100 - 200 ng
(t-PCBs) 0.5 ng per congener
elution; EPA 1668C MLA-007
t-DDT SPE extract 11 100 - 200 ng (t-DDT) 0.2 ng elution; EPA
1699 MLA-007
TSS surface water 11 5 - 200 mg L-1 1 mg L-1 N/A EPA 160.2
TOC surface water 11 2 - 20 mg L-1 1 mg L-1 N/A SM 5310B
DOC surface water 11 <RL - 2 mg L-1 1 mg L-1 N/A SM 5310B
PCB Congeners
periphyton and invertebrates 9 unknown 4 pg g-1 w/w per
congener EPA 1668C EPA 1668C
t-DDT periphyton and invertebrates 4 unknown EPA 1699 EPA 1699
lipids periphyton and invertebrates 9 0.5 - 2.0 % 0.10% N/A MEL SOP 730009†
ash-free dry mass
periphyton and invertebrates 9 0.5 - 3.0 % 1.00% N/A SM10300C
C:N periphyton and invertebrates 9 0.1 - 2.0 (%N);
1.0 - 15 (%C) 0.10% N/A ǂ stable isotopes of N and C
PCB Congeners soil/sediment unknown 0.5 - 100 µg Kg-1 EPA 1668C EPA 1668C
t-DDT soil/sediment unknown 0.2 µg Kg-1 EPA 1699 EPA 1699
TOC soil/sediment 6 0.1 - 6% 0.10% N/A PSEP, 1986¥
grain size soil/sediment 6 unknown 0.10% N/A PSEP, 1986¥
* Excluding field replicates and field blanks. ¥Puget Sound Estuary Program, Recommended Protocols for Measuring Selected Environmental Variables in Puget Sound, Conventional Sediment Variables, Total Organic Carbon (TOC), March 1986. †Manual of Analytical Methods for the Analyses of Pesticides in Humans and Environmental Samples. EPA-600 8-80-038. ǂ Costech Elemental Analyzer, Conflo III, MAT253.
QAPP Addendum – Wenatchee River PCB and DDT Page 35 – April 2015
Table 9: Field quality control samples.
Parameter Matrix Replicates Blanks
PCB Congeners and DDT SPE extract 2 4
TSS, TOC, DOC water 2 N/A
PCB Congeners and DDT Periphyton and invertebrates 1 N/A
C:N and stable isotopes Periphyton and invertebrates 1 N/A
PCB Congeners and DDT soil/sediment 1 N/A
Grain size soil/sediment 1 N/A
Table 10: Laboratory quality control samples, type, and frequency.
Parameter matrix Method blanks
Check stnds/LCS Duplicates Surrogate
spikes MS & MSD
OPR stnds / Labelled cmpds.
PCBs and DDT SPE 4/batch* 1/batch N/A
all samples 1/batch all samples
PCBs and DDT
periphyton and invertebrates N/A 1/batch N/A
all samples 1/batch N/A
C:N and stable isotopes
periphyton, invertebrates, and fish tissue N/A 1/batch
triplicate analysis of
each sample N/A N/A all samples
TSS water 1/batch 1/batch 1/batch N/A N/A N/A
TOC water 1/batch 1/batch 1/batch N/A N/A N/A PCBs and DDT soil/sediment 1/batch 1/batch 1/batch
all samples 1/batch N/A
TOC soil/sediment 1/batch 1/batch 1/batch N/A N/A N/A
Grain size soil/sediment N/A N/A 1/batch N/A N/A N/A * includes a raw SPE media (1) and cleaned disk blank (3)
QAPP Addendum – Wenatchee River PCB and DDT Page 36 – April 2015
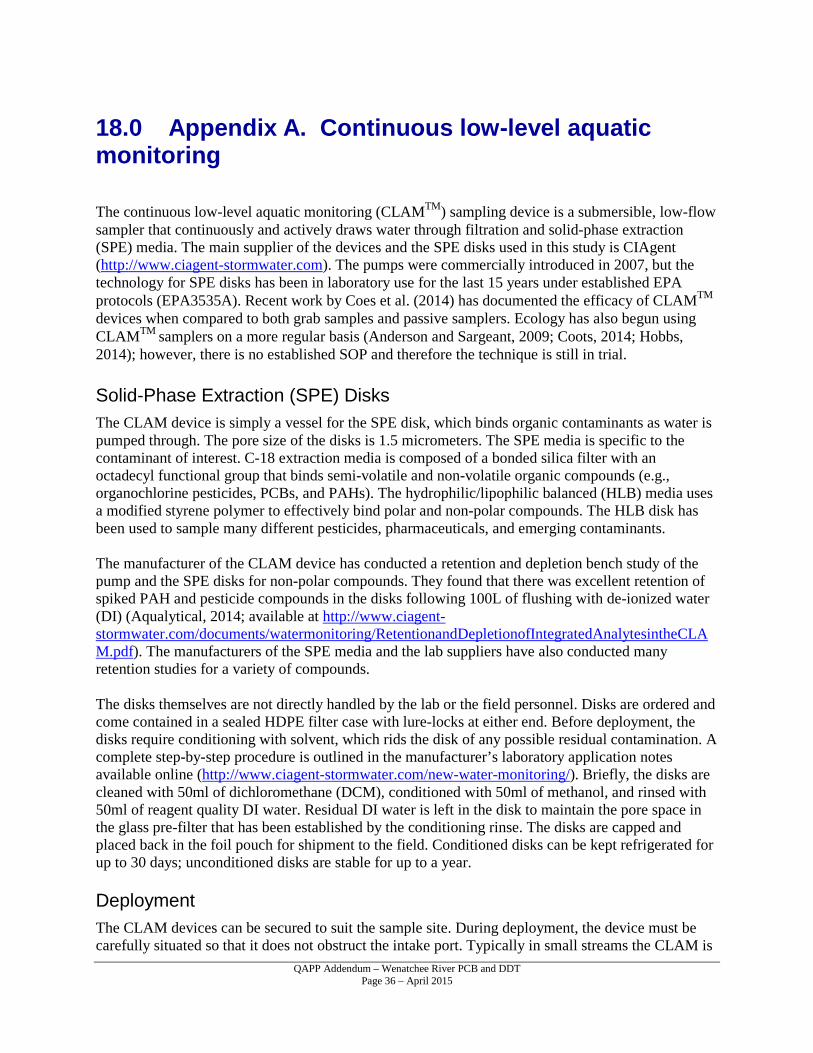
18.0 Appendix A. Continuous low-level aquatic monitoring The continuous low-level aquatic monitoring (CLAMTM) sampling device is a submersible, low-flow sampler that continuously and actively draws water through filtration and solid-phase extraction (SPE) media. The main supplier of the devices and the SPE disks used in this study is CIAgent (http://www.ciagent-stormwater.com). The pumps were commercially introduced in 2007, but the technology for SPE disks has been in laboratory use for the last 15 years under established EPA protocols (EPA3535A). Recent work by Coes et al. (2014) has documented the efficacy of CLAMTM
devices when compared to both grab samples and passive samplers. Ecology has also begun using CLAMTM
samplers on a more regular basis (Anderson and Sargeant, 2009; Coots, 2014; Hobbs, 2014); however, there is no established SOP and therefore the technique is still in trial. Solid-Phase Extraction (SPE) Disks The CLAM device is simply a vessel for the SPE disk, which binds organic contaminants as water is pumped through. The pore size of the disks is 1.5 micrometers. The SPE media is specific to the contaminant of interest. C-18 extraction media is composed of a bonded silica filter with an octadecyl functional group that binds semi-volatile and non-volatile organic compounds (e.g., organochlorine pesticides, PCBs, and PAHs). The hydrophilic/lipophilic balanced (HLB) media uses a modified styrene polymer to effectively bind polar and non-polar compounds. The HLB disk has been used to sample many different pesticides, pharmaceuticals, and emerging contaminants. The manufacturer of the CLAM device has conducted a retention and depletion bench study of the pump and the SPE disks for non-polar compounds. They found that there was excellent retention of spiked PAH and pesticide compounds in the disks following 100L of flushing with de-ionized water (DI) (Aqualytical, 2014; available at http://www.ciagent-stormwater.com/documents/watermonitoring/RetentionandDepletionofIntegratedAnalytesintheCLAM.pdf). The manufacturers of the SPE media and the lab suppliers have also conducted many retention studies for a variety of compounds. The disks themselves are not directly handled by the lab or the field personnel. Disks are ordered and come contained in a sealed HDPE filter case with lure-locks at either end. Before deployment, the disks require conditioning with solvent, which rids the disk of any possible residual contamination. A complete step-by-step procedure is outlined in the manufacturer’s laboratory application notes available online (http://www.ciagent-stormwater.com/new-water-monitoring/). Briefly, the disks are cleaned with 50ml of dichloromethane (DCM), conditioned with 50ml of methanol, and rinsed with 50ml of reagent quality DI water. Residual DI water is left in the disk to maintain the pore space in the glass pre-filter that has been established by the conditioning rinse. The disks are capped and placed back in the foil pouch for shipment to the field. Conditioned disks can be kept refrigerated for up to 30 days; unconditioned disks are stable for up to a year. Deployment The CLAM devices can be secured to suit the sample site. During deployment, the device must be carefully situated so that it does not obstruct the intake port. Typically in small streams the CLAM is
QAPP Addendum – Wenatchee River PCB and DDT Page 37 – April 2015
positioned with the intake facing downstream and the device is suspended at 2/3 the channel depth. In a shallow stream (such as Pine Creek) U-shaped rebar can be hammered into the streambed and the device suspended horizontally. In a deeper stream or lake, a concrete block with a float attached by cable and positioned just below the water surface can be used as line to attach the CLAM to (Anderson and Sargeant, 2009). Before deployment, the flow rate of the device must be measured. Protocols describing a step-by-step method can be found at the manufacturer’s website (http://www.ciagent-stormwater.com/new-water-monitoring/). The device is assembled and the battery pack is hooked up; this starts the internal pump. The device and extraction media are not compromised if the pump runs out of the water during set-up. A stainless steel bucket is filled with water from the site and the CLAM is placed in the bucket. Air is purged from the filter and then flow rate can be measured. A syringe is attached to the discharge port of the CLAM, with tubing, and the collected water volume is measured in the syringe and timed with a stopwatch. This procedure is repeated until the flow rate is consistent. The device can now be deployed and time of deployment recorded. Recent additions to the CLAM system include an independent flow totalizer. An optical flow meter is attached in-line with the discharge tube of the device to accurately (within 1%) record the total volume pumped in milliliters. Retrieval The typical time of deployment for the CLAM is 12 to 36 hours. The device’s battery pack limits the maximum time of deployment, and the water turbidity limits the minimum time of deployment. Suspended solids can slow flow rate by clogging the filter, ultimately stopping flow; this could result in a lost sample. Therefore, in turbid waters field personnel need to either return to the pump periodically to verify the pump is still running or deploy the pump for less time. There are no experimentally derived guidelines for time of deployment in turbid waters, since times vary dramatically with particle size and streamflow. Before removing the device, personnel should take notes on its condition and exact time of retrieval. The flow rate of the CLAM is then measured as per the deployment. Currently, the user must then assume that the flow rate between the time of deployment and retrieval is linear. This flow rate is then used to calculate the total volume of water extracted over the period of deployment. The following example illustrates this process. The CLAM is deployed at 1500 on March 3 and retrieved at 1200 March 4. The flow rate at deployment was 50 ml min-1 and at retrieval had decreased to 20 ml min-1. The mean flow is therefore 35 ml min-1
and the total time of deployment is 21 hours. The total volume of water extracted is 44.1 L. The CLAM is pulled from the water and disassembled at the site. The SPE disk is removed and placed back in the foil shipping pouch. The disks are placed in a cooler on ice until shipped directly to the lab. Refrigerated SPE disks have a holding time of 14 days.
QAPP Addendum – Wenatchee River PCB and DDT Page 38 – April 2015
Analysis SPE disks are shipped directly to the lab, accompanied by a standard chain of custody form. SPE disks are generally considered “other” as a matrix description and not water samples. While there is not an established SOP for the CLAM deployed SPEs, the contract lab should have an SOP for large volume extraction in the lab using similar or the same media. Established preparatory procedures should be in place from previous projects using CLAM samplers. To analyze the total contaminant concentration bound to the SPE media, the lab must completely elute the deployed disks into separatory funnels. The disks are first rinsed with acetone to remove any water from the disk and then rinsed with dichloromethane to elute the disk. Before the DCM is added, the disk is spiked with a surrogate for laboratory QC of the separatory funnel extraction. The sample is concentrated using micro-Kuderna-Danish distillation under an N2 atmosphere. The final extract volume is 1.0 mL. The extract is then run according to the methods pertaining to the contaminant of concern (e.g., GC/ECD in the case of toxaphene). Data Calculations and Reporting The final quantified concentration is derived from the mass of the compound per milliliter of extract. The concentration of the compound in the sampled water is then calculated, using the total volume of water pumped through the CLAM. The following example illustrates this process. If the concentration of toxaphene in the extract is 5.05 ng ml-1, and the final volume of extract was 2.0 ml, there is 10.1 ng of toxaphene in the sample. If 44.1 L of water were sampled, as described earlier, the concentration is therefore 0.23 ng L-1. Given that we are assuming the flow rate of the device is linear from deployment to retrieval, we can only consider the total water volume sampled to be an estimate. Therefore, the derived water concentration is an estimate and should be qualified as such. References Anderson, P and D. Sargeant, 2009. Quality Assurance Project Plan: Skagit-Samish Watershed Intensive Surface Water Sampling for Pesticides in Salmonid-Bearing Streams. Washington State Department of Ecology, Olympia, WA. Publication No. 09-03-120. https://fortress.wa.gov/ecy/publications/summarypages/0903120.html
Coes, A.L., N.V. Paretti, W.T. Foreman, J.L. Iverson, and D.A. Alvarez, 2014. Sampling trace organic compounds in water: A comparison of a continuous active sampler to continuous passive and discrete sampling methods. Science of the Total Environment, 473-474: 731-741.
Coots, R., 2014. PCB Method Comparison of High and Low Resolution Sediment Analysis. Washington State Dept. of Ecology. Olympia, WA. Publication No.14-03-009. https://fortress.wa.gov/ecy/publications/summarypages/1403009.html