Embed Size (px)
Citation preview
7/28/2019 Add Maths Functions
http://slidepdf.com/reader/full/add-maths-functions 1/16
Higher
Mathematics
HSN21200
This document was produced specially for the HSN.uk.net website, and we require that any
copies or derivative works attribute the work to Higher Still Notes.
For more details about the copyright on these notes, please see
http://creativecommons.org/licenses/by-nc-sa/2.5/scotland/
hsn .uk.net
UNIT 1 OUTCOME 2
Functions and Graphs
Contents
Functions and Graphs 18
1 Sets 18
2 Functions 19
3 Composite Functions 22
4 Inverse Functions 23
5 Exponential Functions 246 Introduction to Logarithms 25
7 Radians 26
8 Exact Values 26
9 Trigonometric Functions 27
10 Graph Transformations 27
7/28/2019 Add Maths Functions
http://slidepdf.com/reader/full/add-maths-functions 2/16
Higher Mathematics Unit 1 – Functions and Graphs
Page 18 HSN21200hsn.uk.net
OUTCOME 2
Functions and Graphs
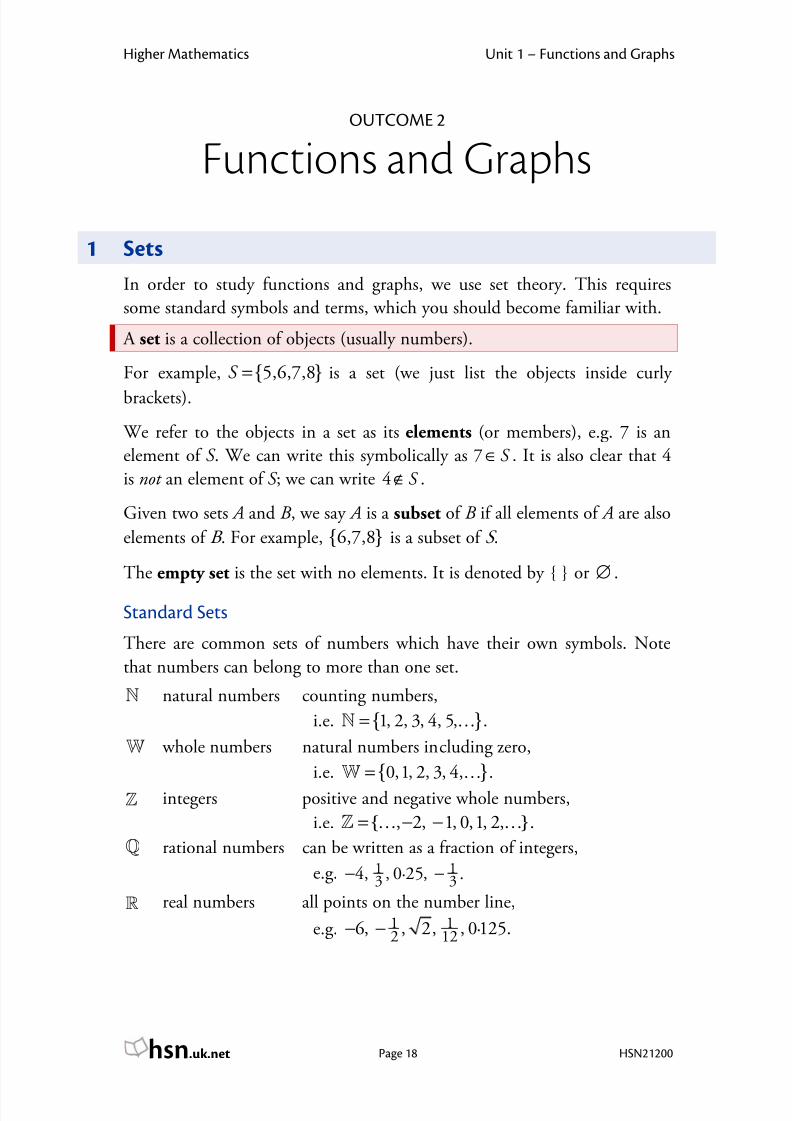
1 Sets
In order to study functions and graphs, we use set theory. This requires
some standard symbols and terms, which you should become familiar with.
A set is a collection of objects (usually numbers).
For example, { }5,6,7,8S = is a set (we just list the objects inside curly
brackets).
We refer to the objects in a set as its elements (or members), e.g. 7 is an
element of S . We can write this symbolically as 7 S ∈ . It is also clear that 4
is not an element of S ; we can write 4 S ∉ .
Given two sets A and B , we say A is a subset of B if all elements of A are also
elements of B . For example, { }6,7,8 is a subset of S .
The empty set is the set with no elements. It is denoted by { } or ∅ .
Standard Sets
There are common sets of numbers which have their own symbols. Note
that numbers can belong to more than one set.
ℕ natural numbers counting numbers,
i.e. { } 1, 2, 3, 4, 5, .=ℕ …
W whole numbers natural numbers including zero,
i.e. { } 0,1, 2, 3, 4, .= …W
ℤ integers positive and negative whole numbers,
i.e. { } , 2, 1, 0,1, 2, .= − −ℤ … …
ℚ rational numbers can be written as a fraction of integers,
e.g. 1 13 34, , 0·25, .− −
ℝ real numbers all points on the number line,
e.g. 1 12 126, , 2, , 0·125.− −
7/28/2019 Add Maths Functions
http://slidepdf.com/reader/full/add-maths-functions 3/16
Higher Mathematics Unit 1 – Functions and Graphs
Page 19 HSN21200hsn.uk.net
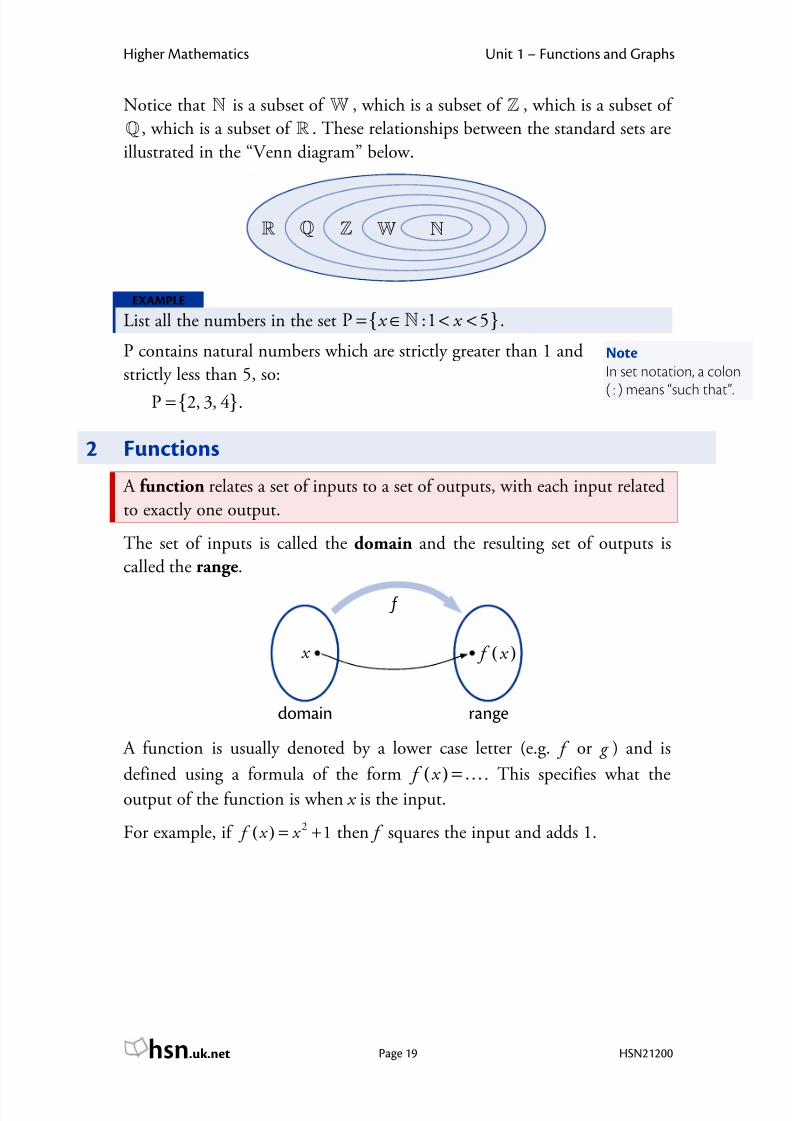
Notice that ℕ is a subset of W , which is a subset of ℤ , which is a subset of
ℚ , which is a subset of ℝ . These relationships between the standard sets are
illustrated in the “Venn diagram” below.
EXAMPLE
List all the numbers in the set { }P :1 5 x x = ∈ < <ℕ .
P contains natural numbers which are strictly greater than 1 and
strictly less than 5, so:
{ } P 2, 3, 4 .=
2 Functions
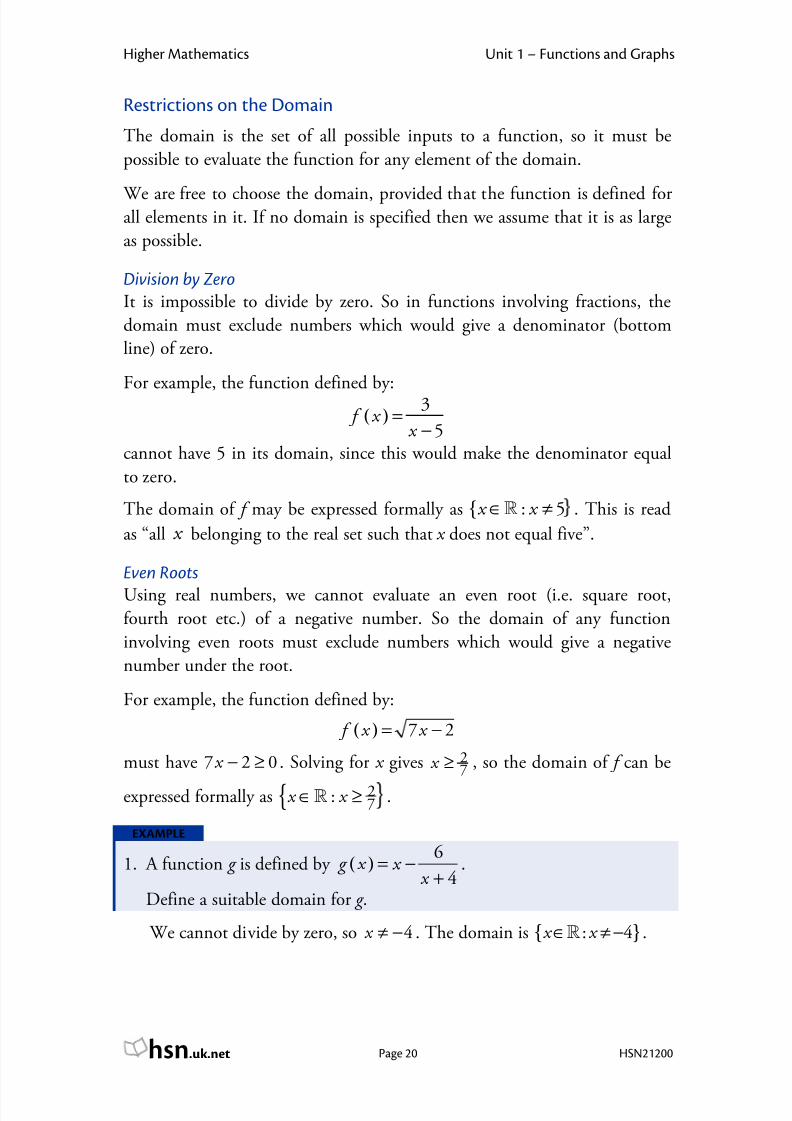
A function relates a set of inputs to a set of outputs, with each input related
to exactly one output.
The set of inputs is called the domain and the resulting set of outputs is
called the range.
A function is usually denoted by a lower case letter (e.g. f or g ) and is
defined using a formula of the form ( ) f x = …. This specifies what the
output of the function is when x is the input.
For example, if ( )2 1 f x x = + then f squares the input and adds 1.
f
rangedomain
x ( ) f x
W NQR Z
Note
In set notation, a colon
( : ) means “such that”.
7/28/2019 Add Maths Functions
http://slidepdf.com/reader/full/add-maths-functions 4/16
Higher Mathematics Unit 1 – Functions and Graphs
Page 20 HSN21200hsn.uk.net
Restrictions on the Domain
The domain is the set of all possible inputs to a function, so it must be
possible to evaluate the function for any element of the domain.
We are free to choose the domain, provided that the function is defined forall elements in it. If no domain is specified then we assume that it is as large
as possible.
Division by Zero
It is impossible to divide by zero. So in functions involving fractions, the
domain must exclude numbers which would give a denominator (bottom
line) of zero.
For example, the function defined by:( )
3
5 f x
x =
−
cannot have 5 in its domain, since this would make the denominator equal
to zero.
The domain of f may be expressed formally as { : 5 x x ∈ ≠ℝ . This is read
as “all x belonging to the real set such that x does not equal five”.
Even Roots
Using real numbers, we cannot evaluate an even root (i.e. square root,fourth root etc.) of a negative number. So the domain of any function
involving even roots must exclude numbers which would give a negative
number under the root.
For example, the function defined by:
( ) 7 2 f x x = −
must have 7 2 0 x − ≥ . Solving for x gives 27 x ≥ , so the domain of f can be
expressed formally as { 27: x x ∈ ≥ℝ .
EXAMPLE
1. A function g is defined by ( )6
4 g x x
x = −
+.
Define a suitable domain for g .
We cannot divide by zero, so 4 x ≠ − . The domain is { }: 4 x x ∈ ≠ −ℝ .
7/28/2019 Add Maths Functions
http://slidepdf.com/reader/full/add-maths-functions 5/16
Higher Mathematics Unit 1 – Functions and Graphs
Page 21 HSN21200hsn.uk.net
Identifying the Range
Recall that the range is the set of possible outputs. Some functions cannot
produce certain values so these are not in the range.
For example:( ) 2 f x x =
does not produce negative values, since any number squared is either
positive or zero.
Looking at the graph of a function makes identifying its range more
straightforward.
If we consider the graph of ( ) y f x = (shown to the
left) it is clear that there are no negative y -values.
The range can be stated as ( ) ≥ 0 f x .
Note that the range also depends on the choice of domain. For example, if
the domain of ( )2 f x x = is chosen to be { }: 3 x x ∈ ≥ℝ then the range can
be stated as ( ) 9 f x ≥ .
EXAMPLE
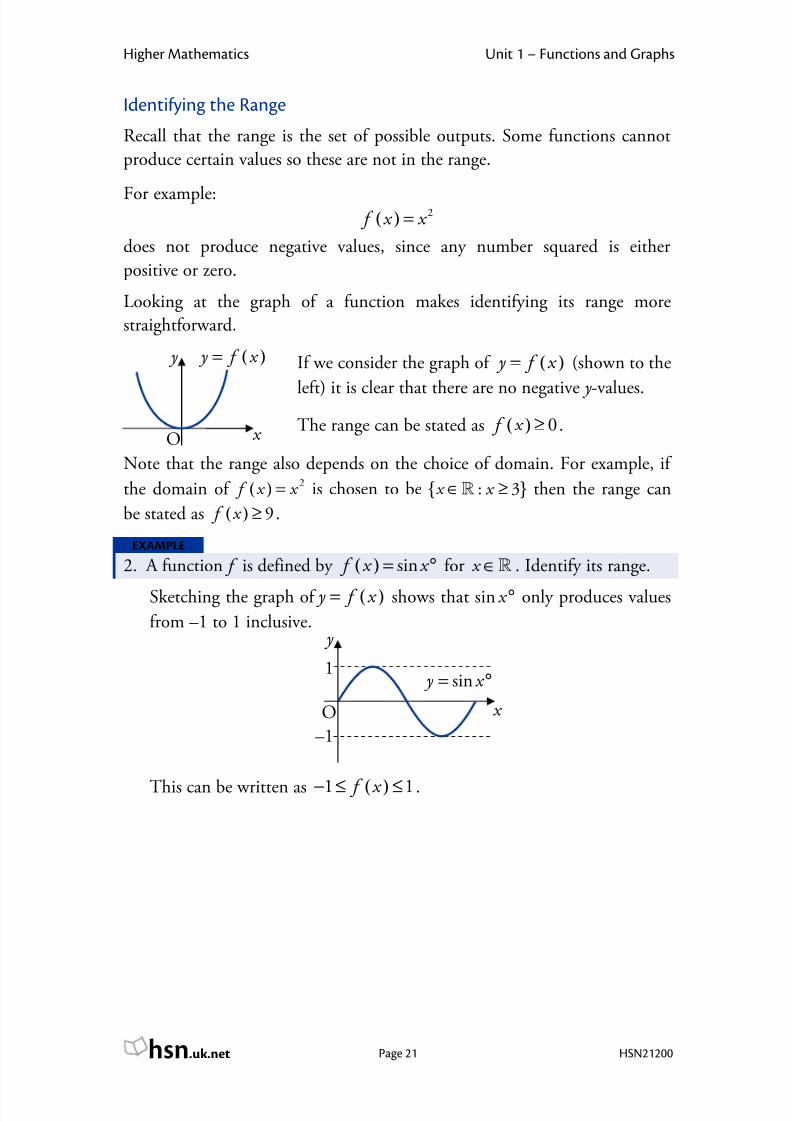
2. A function f is defined by ( ) sin f x x = ° for x ∈ ℝ . Identify its range.
Sketching the graph of ( ) y f x = shows that sin x ° only produces values
from –1 to 1 inclusive.
This can be written as ( )1 1 f x − ≤ ≤ .
x
1
–1
sin y x = °
O
y
( ) y f x = y
O x
7/28/2019 Add Maths Functions
http://slidepdf.com/reader/full/add-maths-functions 6/16
Higher Mathematics Unit 1 – Functions and Graphs
Page 22 HSN21200hsn.uk.net
3 Composite Functions
Two functions can be “composed” to form a new composite function.
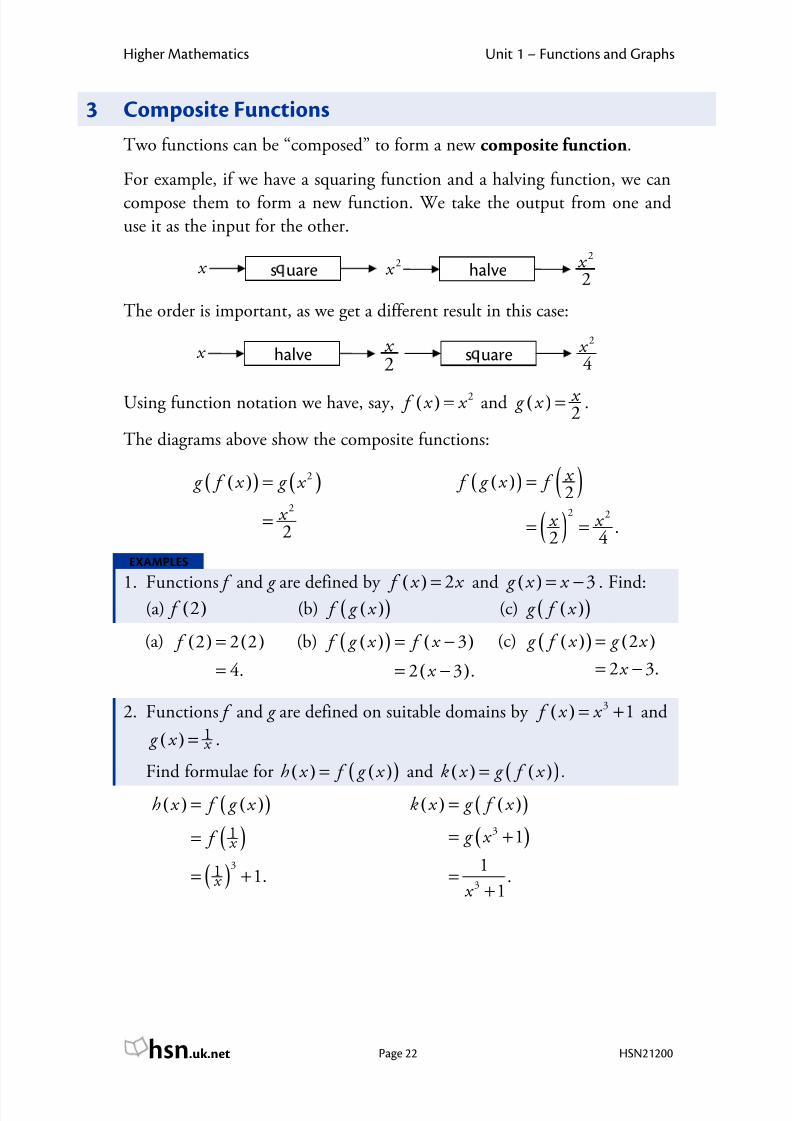
For example, if we have a squaring function and a halving function, we can
compose them to form a new function. We take the output from one anduse it as the input for the other.
The order is important, as we get a different result in this case:
Using function notation we have, say, ( ) 2 f x x = and ( )2 x g x = .
The diagrams above show the composite functions:
( )( ) ( )2
2
2
g f x g x
x
=
=
( )( ) ( )
( )2 2
2
.2 4
x f g x f
x x
=
= =
EXAMPLES
1. Functions f and g are defined by ( ) 2 f x x = and ( ) 3 g x x = − . Find:(a) ( )2 f (b) ( )( ) f g x (c) ( )( ) g f x
(a) ( ) ( )2 2 2
4.
f =
=
(b) ( )( ) ( )
( )
3
2 3 .
f g x f x
x
= −
= −
(c) ( )( ) ( )2
2 3.
g f x g x
x
=
= −
2. Functions f and g are defined on suitable domains by ( ) 3 1 f x x = + and
( ) 1 x g x = .
Find formulae for ( ) ( )( )h x f g x = and ( ) ( )( )k x g f x = .
( ) ( )( )
( )
( )3
1
1 1.
x
x
h x f g x
f
=
=
= +
( ) ( )( )
( )3
3
1
1.
1
k x g f x
g x
x
=
= +
=+
halve x s uare2
4 x
2 x
s uare2 x x halve
2
2 x
7/28/2019 Add Maths Functions
http://slidepdf.com/reader/full/add-maths-functions 7/16
Higher Mathematics Unit 1 – Functions and Graphs
Page 23 HSN21200hsn.uk.net
4 Inverse Functions
The idea of an inverse function is to reverse the effect of the original
function. It is the “opposite” function.
You should already be familiar with this idea – for example, doubling a number can be reversed by halving the result. That is, multiplying by two
and dividing by two are inverse functions.
The inverse of the function f is usually denoted 1 f − (read as “ f inverse”).
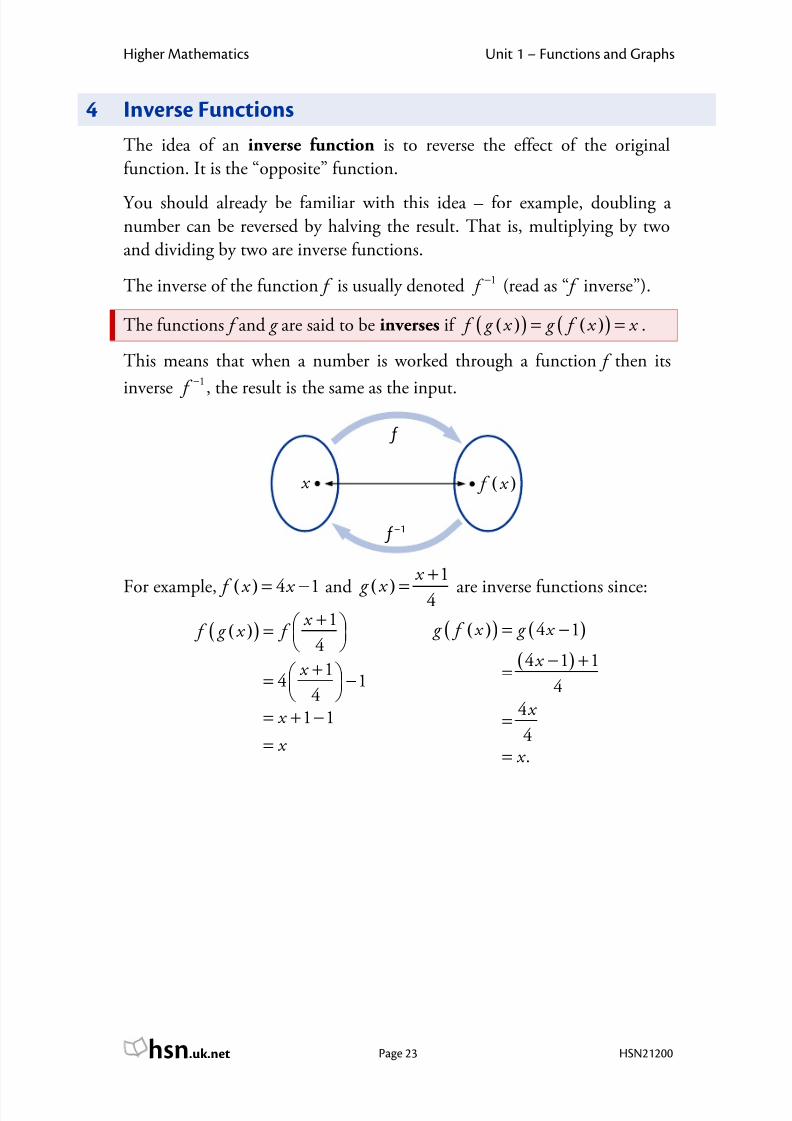
The functions f and g are said to be inverses if ( )( ) ( )( ) f g x g f x x = = .
This means that when a number is worked through a function f then its
inverse1
f −
, the result is the same as the input.
For example, ( ) 4 1 f x x = − and ( )
1
4
x g x
+
= are inverse functions since:
( )( )1
4
14 1
41 1
x f g x f
x
x
x
+ =
+ = −
= + −
=
( )( ) ( )
( )
4 1
4 1 1
44
4.
g f x g x
x
x
x
= −
− +=
=
=
f
x ( ) f x
f –1
7/28/2019 Add Maths Functions
http://slidepdf.com/reader/full/add-maths-functions 8/16
Higher Mathematics Unit 1 – Functions and Graphs
Page 24 HSN21200hsn.uk.net
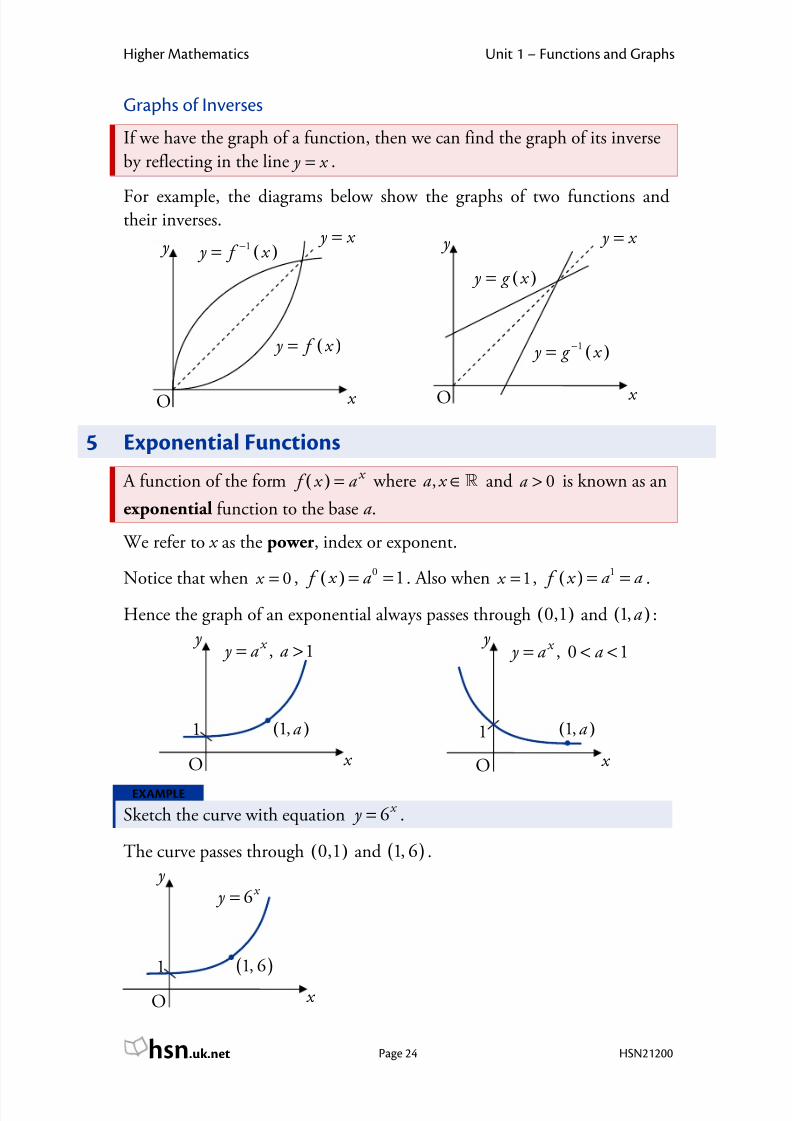
Graphs of Inverses
If we have the graph of a function, then we can find the graph of its inverse
by reflecting in the line y x = .
For example, the diagrams below show the graphs of two functions andtheir inverses.
5 Exponential Functions
A function of the form ( ) x f x a = where ,a x ∈ ℝ and 0a > is known as an
exponential function to the base a .
We refer to x as the power, index or exponent.
Notice that when 0 x = , ( )0 1 f x a = = . Also when 1 x = , ( )
1 f x a a = = .
Hence the graph of an exponential always passes through ( )0,1 and ( )1,a :
EXAMPLE
Sketch the curve with equation 6 x y = .
The curve passes through ( )0,1 and ( )1, 6 .
x O
1 ( )1, 6
y 6 x y =
x O
1
, 0 1 x y a a = < <
( )1, a
y
x O
1
, 1 x y a a = >
( )1,a
y
x
y
O
y x =
( ) y g x =
( )1 y g x −=
x
y
O
( ) y f x =
( )1 y f x −=
y x =
7/28/2019 Add Maths Functions
http://slidepdf.com/reader/full/add-maths-functions 9/16
Higher Mathematics Unit 1 – Functions and Graphs
Page 25 HSN21200hsn.uk.net
6 Introduction to Logarithms
Until now, we have only been able to solve problems involving exponentials
when we know the index, and have to find the base. For example, we can
solve6
512 p = by taking sixth roots to get 6 512 p = .
But what if we know the base and have to find the index?
To solve 6 512q
= for q , we need to find the power of 6 which gives 512.
To save writing this each time, we use the notation 6log 512q = , read as
“log to the base 6 of 512”. In general:
log a x is the power of a which gives x .
The properties of logarithms will be covered in Unit 3 Outcome 3.
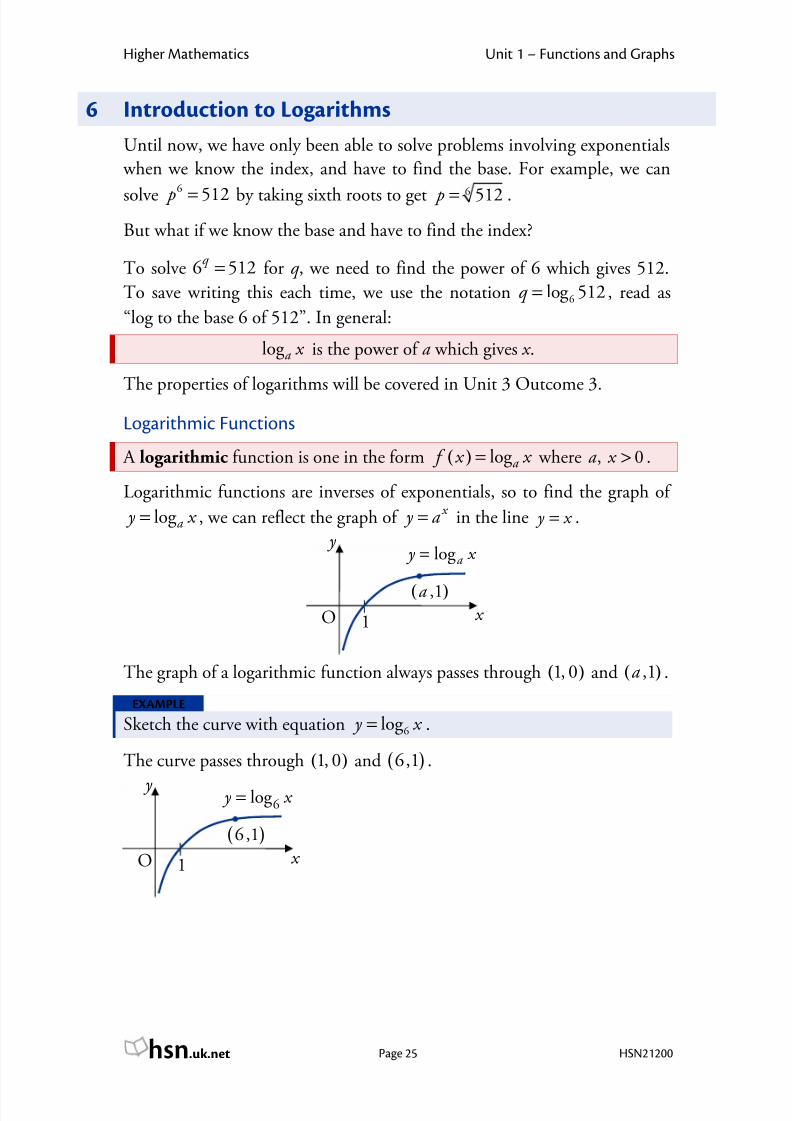
Logarithmic Functions
A logarithmic function is one in the form ( ) log a f x x = where , 0a x > .
Logarithmic functions are inverses of exponentials, so to find the graph of
log a y x = , we can reflect the graph of x y a = in the line y x = .
The graph of a logarithmic function always passes through ( )1, 0 and ( ),1a .
EXAMPLE
Sketch the curve with equation 6log y x = .
The curve passes through ( )1, 0 and ( )6,1 .
x O 1
6log y x =
( )6,1
y
x O 1
log a y x =
( ),1a
y
7/28/2019 Add Maths Functions
http://slidepdf.com/reader/full/add-maths-functions 10/16
Higher Mathematics Unit 1 – Functions and Graphs
Page 26 HSN21200hsn.uk.net
Degrees Radians180π ×
180π
×
7 Radians
Degrees are not the only units used to measure angles. The radian (RAD on
the calculator) is an alternative measurement which is more useful in
mathematics.Degrees and radians bear the relationship:
π radians 180 .= °
The other equivalences that you should become familiar with are:
630 radiansπ ° = 4
45 radiansπ ° = 360 radiansπ ° =
290 radiansπ ° = 34
135 radiansπ ° = 360 2 radians.π ° =
Converting between degrees and radians is straightforward.• To convert from degrees to radians, multiply by π
and divide by 180.
• To convert from radians to degrees, multiply by
180 and divide by π .
For example, 5180 1850 50 radiansπ
π ° = × = .
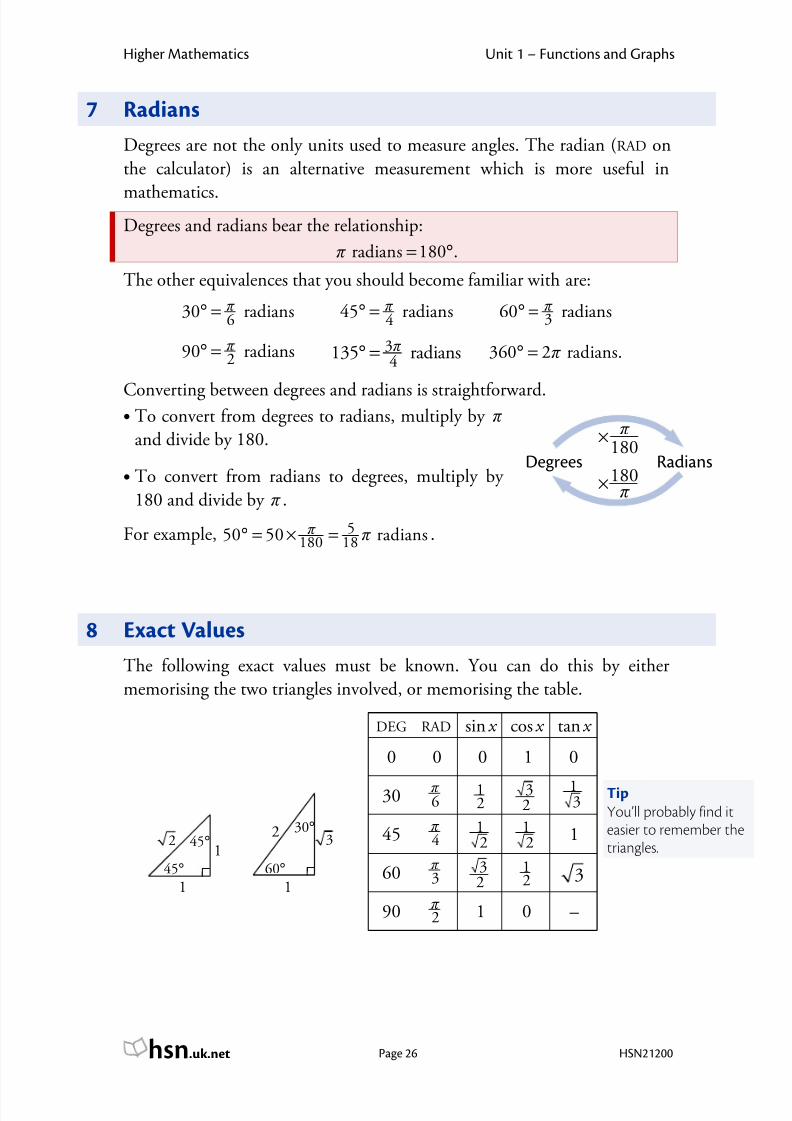
8 Exact Values
The following exact values must be known. You can do this by either
memorising the two triangles involved, or memorising the table.
DEG RAD sin x cos x tan x
0 0 0 1 0
30 6π 1
2 32 1
3
45 4π 1
2 1
2 1
60 3π 3
2 12 3
90 2π 1 0 –
1
23
30°
60°
1
145°2
45°
Tip
You’ll probably find iteasier to remember thetriangles.
7/28/2019 Add Maths Functions
http://slidepdf.com/reader/full/add-maths-functions 11/16
Higher Mathematics Unit 1 – Functions and Graphs
Page 27 HSN21200hsn.uk.net
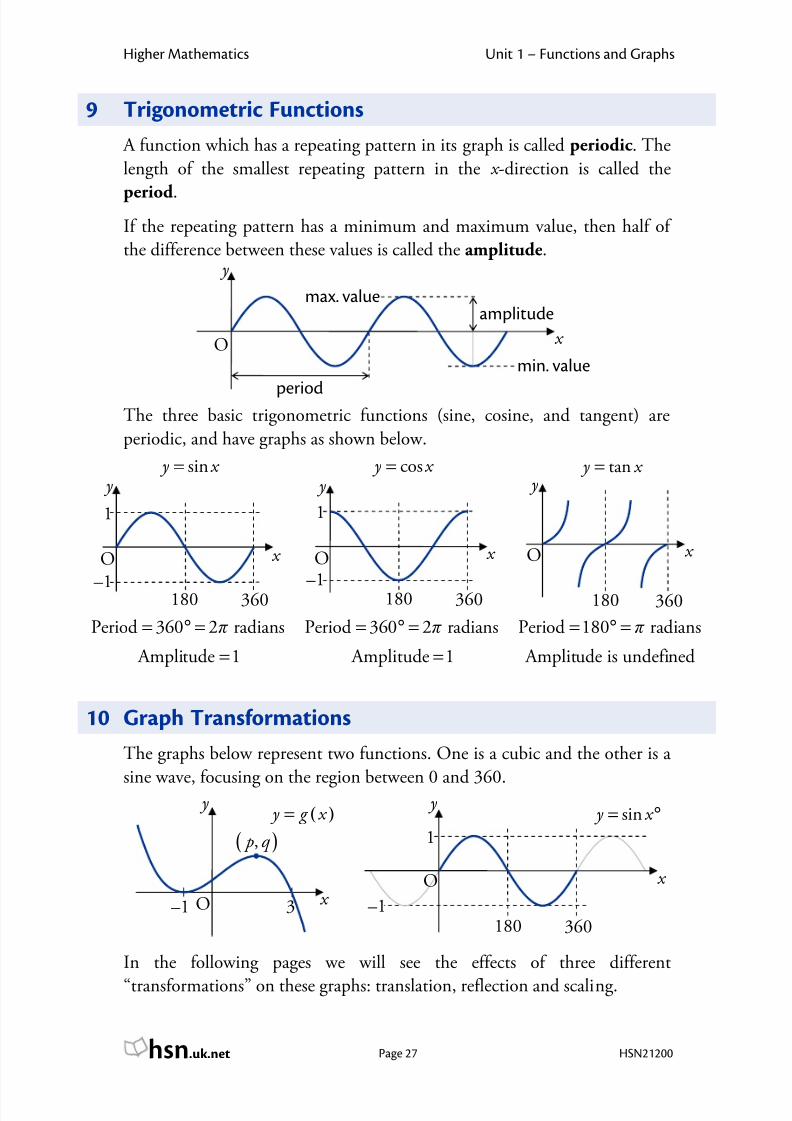
9 Trigonometric Functions
A function which has a repeating pattern in its graph is called periodic. The
length of the smallest repeating pattern in the x -direction is called the
period .If the repeating pattern has a minimum and maximum value, then half of
the difference between these values is called the amplitude.
The three basic trigonometric functions (sine, cosine, and tangent) are
periodic, and have graphs as shown below.
Period 360 2 radians
Amplitude 1
π = ° =
=
Period 360 2 radians
Amplitude 1
π = ° =
=
Period 180 radians
Amplitude is undefined
π = ° =
10 Graph Transformations
The graphs below represent two functions. One is a cubic and the other is a
sine wave, focusing on the region between 0 and 360.
In the following pages we will see the effects of three different
“transformations” on these graphs: translation, reflection and scaling.
sin y x = cos y x = tan y x =
x
y
O
1
–1180 360
sin y x = °
x O
y
3–1
( ) y g x =
( ), p q
x O
180 360
y
x
1
–1
O
180 360
y
x
1
–1
O
180 360
y
x O
period
amplitudemax. value
min. value
y
7/28/2019 Add Maths Functions
http://slidepdf.com/reader/full/add-maths-functions 12/16
Higher Mathematics Unit 1 – Functions and Graphs
Page 28 HSN21200hsn.uk.net
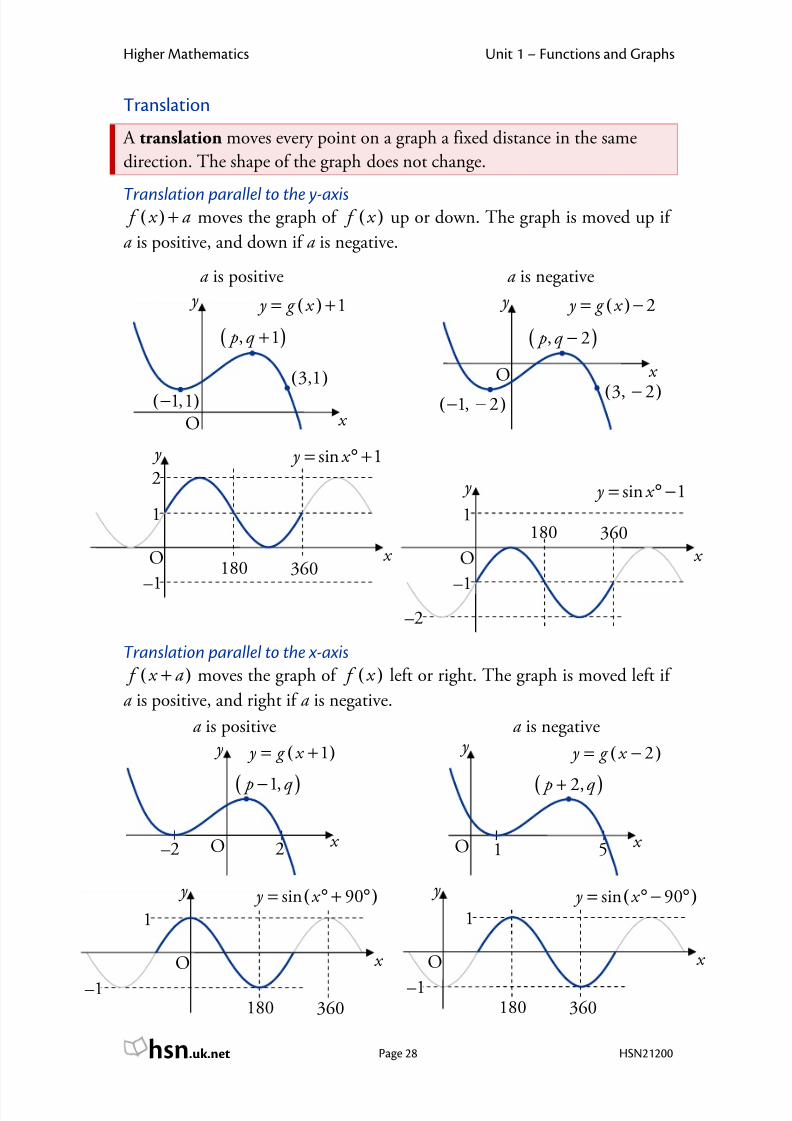
Translation
A translation moves every point on a graph a fixed distance in the same
direction. The shape of the graph does not change.
Translation parallel to the y-axis( ) f x a + moves the graph of ( ) f x up or down. The graph is moved up if
a is positive, and down if a is negative.
a is positive a is negative
Translation parallel to the x-axis
( ) f x a + moves the graph of ( ) f x left or right. The graph is moved left if
a is positive, and right if a is negative.
a is positive a is negative
x O
1
–1
( )sin 90 y x = ° − °
180 360
y
x O
1
–1
( )sin 90 y x = ° + °
180 360
y
x O 51
( )2, p q +
( )2 y g x = − y
x O 2–2
( )1, p q −
( )1 y g x = + y
–2
x O
1
–1
sin 1 y x = ° −
180 360
y
x O
1
2
–1
sin 1 y x = ° +
180 360
y
x O
( ), 2 p q −
( ) 2 y g x = −
( )3, 2−( )1, 2− −
y
x O
( )3,1
( )1,1−
( ), 1 p q +
( ) 1 y g x = + y
7/28/2019 Add Maths Functions
http://slidepdf.com/reader/full/add-maths-functions 13/16
Higher Mathematics Unit 1 – Functions and Graphs
Page 29 HSN21200hsn.uk.net
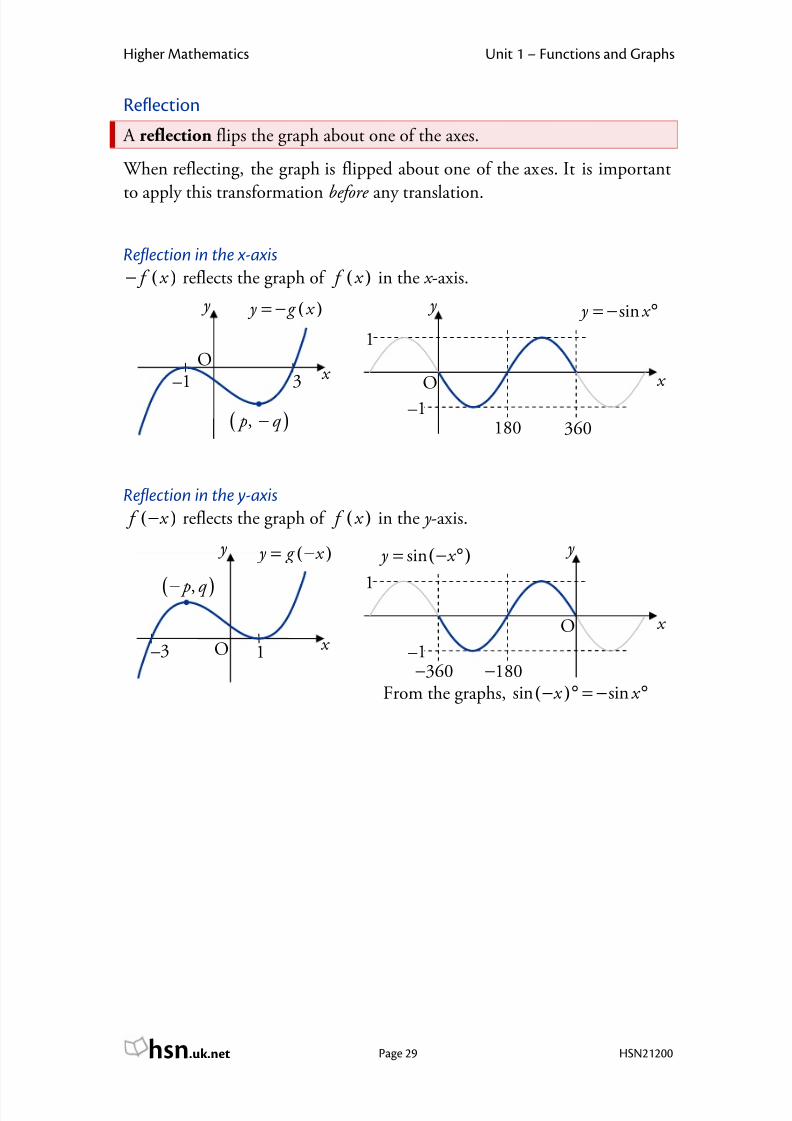
Reflection
A reflection flips the graph about one of the axes.
When reflecting, the graph is flipped about one of the axes. It is important
to apply this transformation before any translation.
Reflection in the x-axis
( ) f x − reflects the graph of ( ) f x in the x -axis.
Reflection in the y-axis
( ) f x − reflects the graph of ( ) f x in the y -axis.
From the graphs, ( )sin sin x x − ° = − °
x
y
O
1
–1
( )sin y x = − °
180−360−
x O
y
–3 1
( ) y g x = −
( ), p q −
x
y
O
1
–1
sin y x = − °
180 360
x O
y
3–1
( ) y g x = −
( ), p q −
7/28/2019 Add Maths Functions
http://slidepdf.com/reader/full/add-maths-functions 14/16
Higher Mathematics Unit 1 – Functions and Graphs
Page 30 HSN21200hsn.uk.net
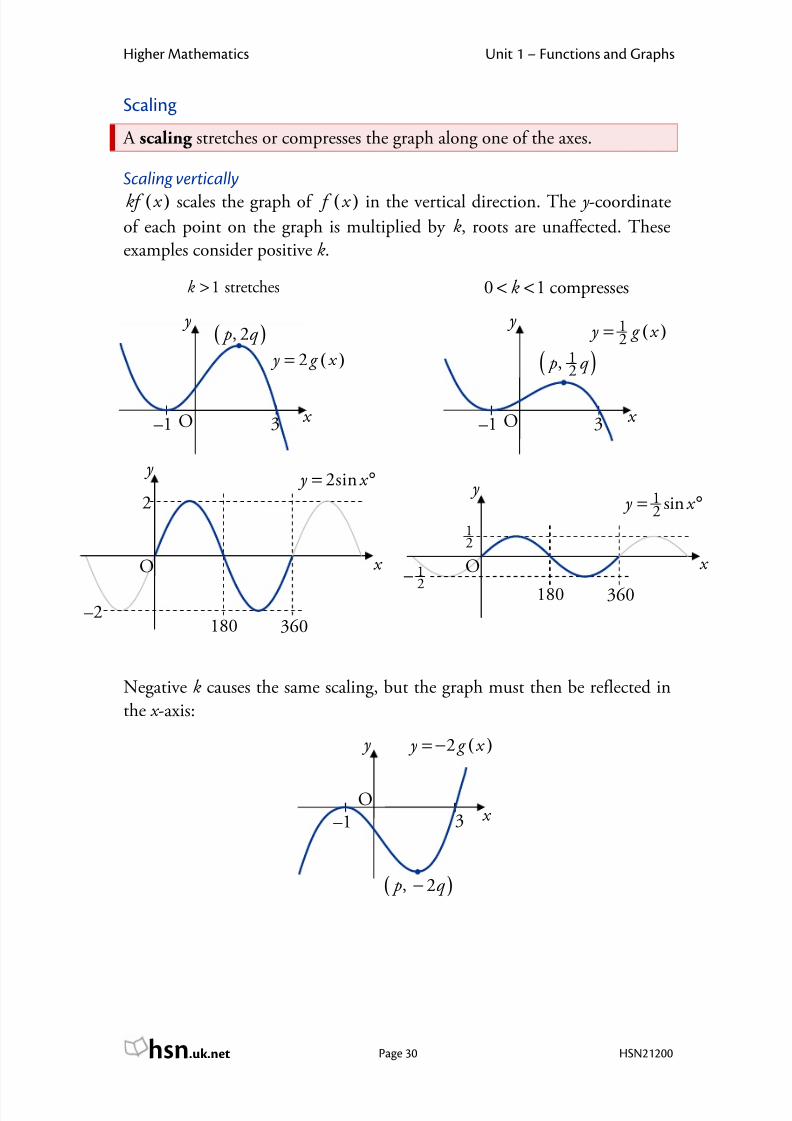
Scaling
A scaling stretches or compresses the graph along one of the axes.
Scaling vertically
( )kf x scales the graph of ( ) f x in the vertical direction. The y -coordinateof each point on the graph is multiplied by k , roots are unaffected. These
examples consider positive k .
1 stretchesk > 0 1 compressesk < <
Negative k causes the same scaling, but the graph must then be reflected in
the x -axis:
x O
y
3–1
( ), 2 p q −
( )2 y g x = −
x
y
O
12 sin y x = °
180 360
12
1
2−
x
y
O
2
–2
2sin y x = °
180 360
x O
y
3–1
( )12, p q
( )12 y g x =
x O
y
3–1
( ), 2 p q
( )2 y g x =
7/28/2019 Add Maths Functions
http://slidepdf.com/reader/full/add-maths-functions 15/16
Higher Mathematics Unit 1 – Functions and Graphs
Page 31 HSN21200hsn.uk.net
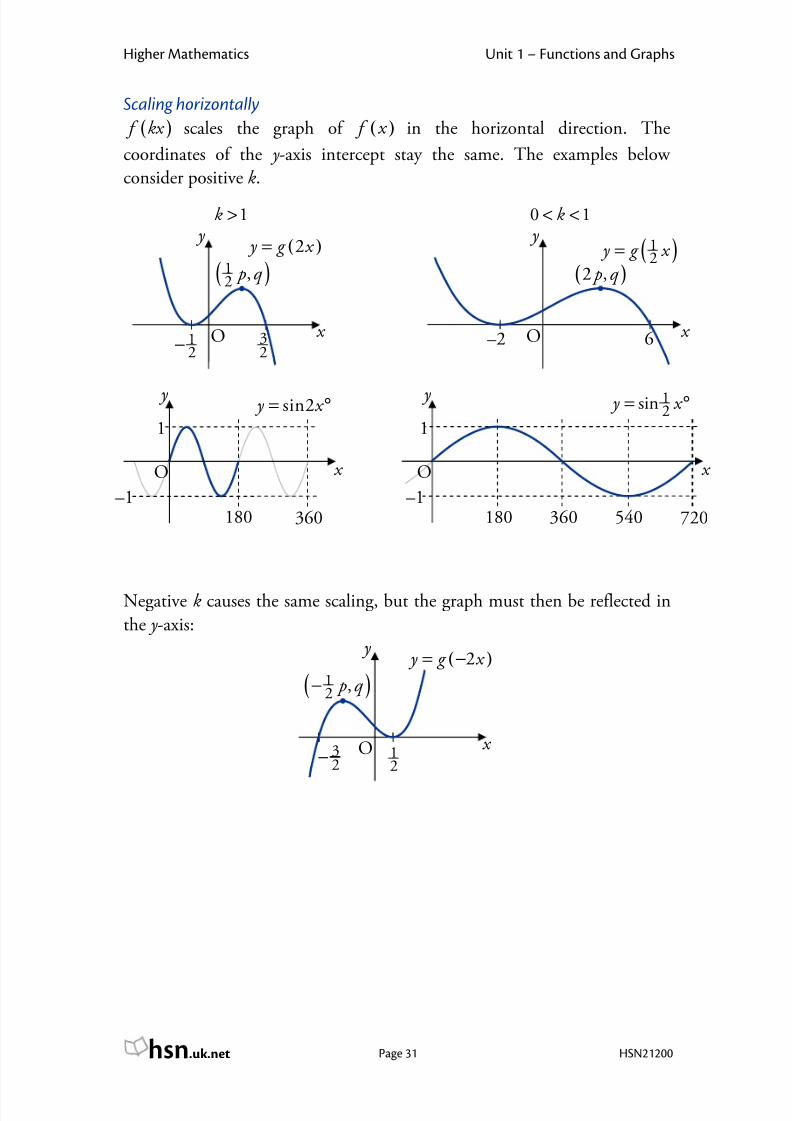
Scaling horizontally
( ) f kx scales the graph of ( ) f x in the horizontal direction. The
coordinates of the y -axis intercept stay the same. The examples below
consider positive k .
1k > 0 1k < <
Negative k causes the same scaling, but the graph must then be reflected in
the y -axis:
x O
y
( )12 , p q −
12
( )2 y g x = −
32−
x
y
1
–1
12sin y x = °
O
180 360 540 720
x
y
1
–1
sin2 y x = °
O
180 360
O
y
6–2
( )12 y g x =
( )2 , p q
x x O
y
( )12 , p q
12− 3
2
( )2 y g x =
7/28/2019 Add Maths Functions
http://slidepdf.com/reader/full/add-maths-functions 16/16
Higher Mathematics Unit 1 – Functions and Graphs
Page 32 HSN21200hsn.uk.net
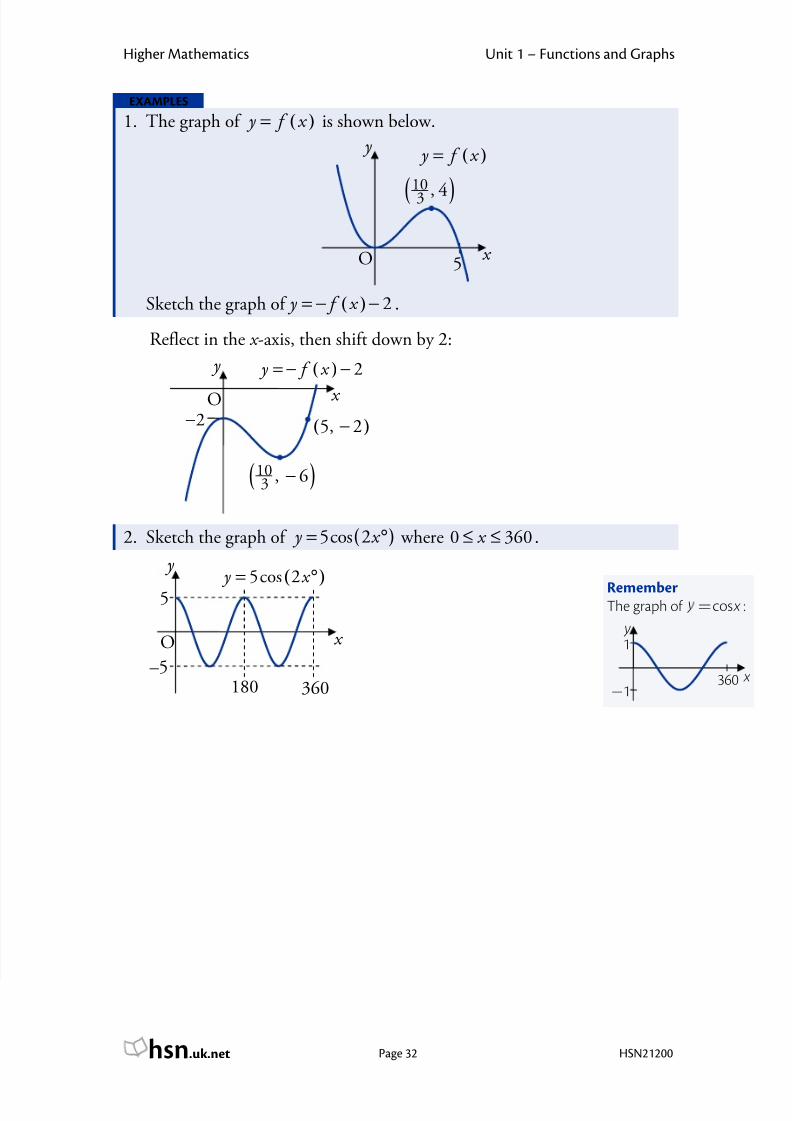
EXAMPLES
1. The graph of ( ) y f x = is shown below.
Sketch the graph of ( ) 2 y f x = − − .
Reflect in the x -axis, then shift down by 2:
2. Sketch the graph of ( )5cos 2 y x = ° where 0 360 x ≤ ≤ .
x
y
O
5
–5180 360
( )5cos 2 y x = °
x O
y
( )103 , 6−
( )5, 2−2−
( ) 2 y f x = − −
x O
y
( )103 , 4
( ) y f x =
5
RememberThe graph of cos x= :
360 x
y
1
1−


![Add Maths Project [Complete]](https://img.dokumen.tips/doc/110x75/544cabb3b1af9f7f538b4908/add-maths-project-complete.jpg)