Embed Size (px)
DESCRIPTION
Acucar Guarani Q2 09/10 earnings presentation
Citation preview
Q2 09/10 ResultsNovember 17th, 2009
This presentation contains forward-looking statements related to the prospects of our business andestimates for operating and financial results. Those related to growth prospects of Açúcar GuaraniS.A. are merely projections and, as such, based exclusively on the expectations of the managementconcerning the future of the business. Such forward-looking statements depend substantially onchanges in market conditions, government regulations, competitive pressures, the performance of theBrazilian and international economies and the industry and are therefore subject to change withoutprior notice.
Disclaimer
600
700
800
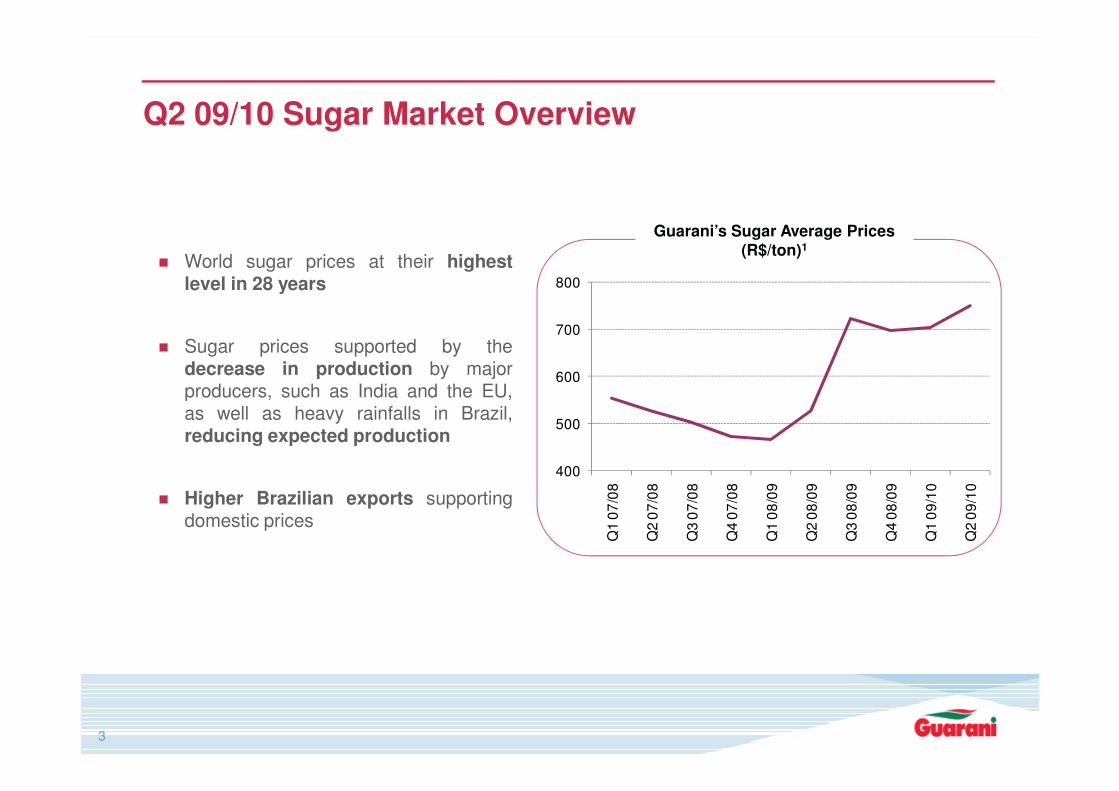
� World sugar prices at their highestlevel in 28 years
� Sugar prices supported by thedecrease in production by majorproducers, such as India and the EU,
Q2 09/10 Sugar Market Overview
Guarani’s Sugar Average Prices (R$/ton)1
400
500
Q1
07
/08
Q2
07
/08
Q3
07
/08
Q4
07
/08
Q1
08
/09
Q2
08
/09
Q3
08
/09
Q4
08
/09
Q1
09
/10
Q2
09
/10
producers, such as India and the EU,as well as heavy rainfalls in Brazil,reducing expected production
� Higher Brazilian exports supportingdomestic prices
3
650
700
750
800
Q2 09/10 Ethanol Market Overview
Guarani’s Ethanol Average Prices (R$/m³)
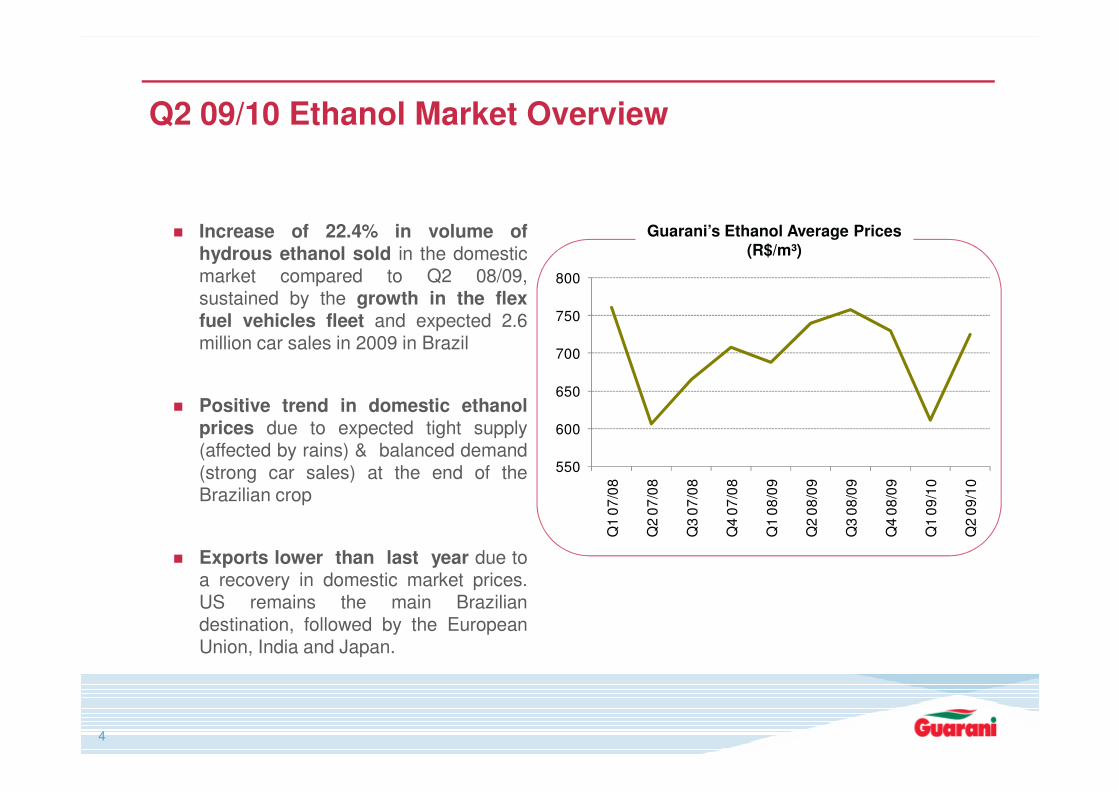
� Increase of 22.4% in volume ofhydrous ethanol sold in the domesticmarket compared to Q2 08/09,sustained by the growth in the flexfuel vehicles fleet and expected 2.6million car sales in 2009 in Brazil
Positive trend in domestic ethanol
550
600
650
Q1
07
/08
Q2
07
/08
Q3
07
/08
Q4
07
/08
Q1
08
/09
Q2
08
/09
Q3
08
/09
Q4
08
/09
Q1
09
/10
Q2
09
/10
4
� Positive trend in domestic ethanolprices due to expected tight supply(affected by rains) & balanced demand(strong car sales) at the end of theBrazilian crop
� Exports lower than last year due toa recovery in domestic market prices.US remains the main Braziliandestination, followed by the EuropeanUnion, India and Japan.
1.2 1.1
4.84.4
5.46.0
2.6 2.9
7.6 7.1
10.010.2
Decrease of Sugarcane Crushed in Q2 09/10
Sugarcane Crushed (MM t) Q2 09/10
Sugarcane Crushed (MM t) H1 09/10
1.2 1.1
Q2 08/09 Q2 09/10
Own 3rd Party
2.6 2.9
H1 08/09 H1 09/10
Own 3rd Party
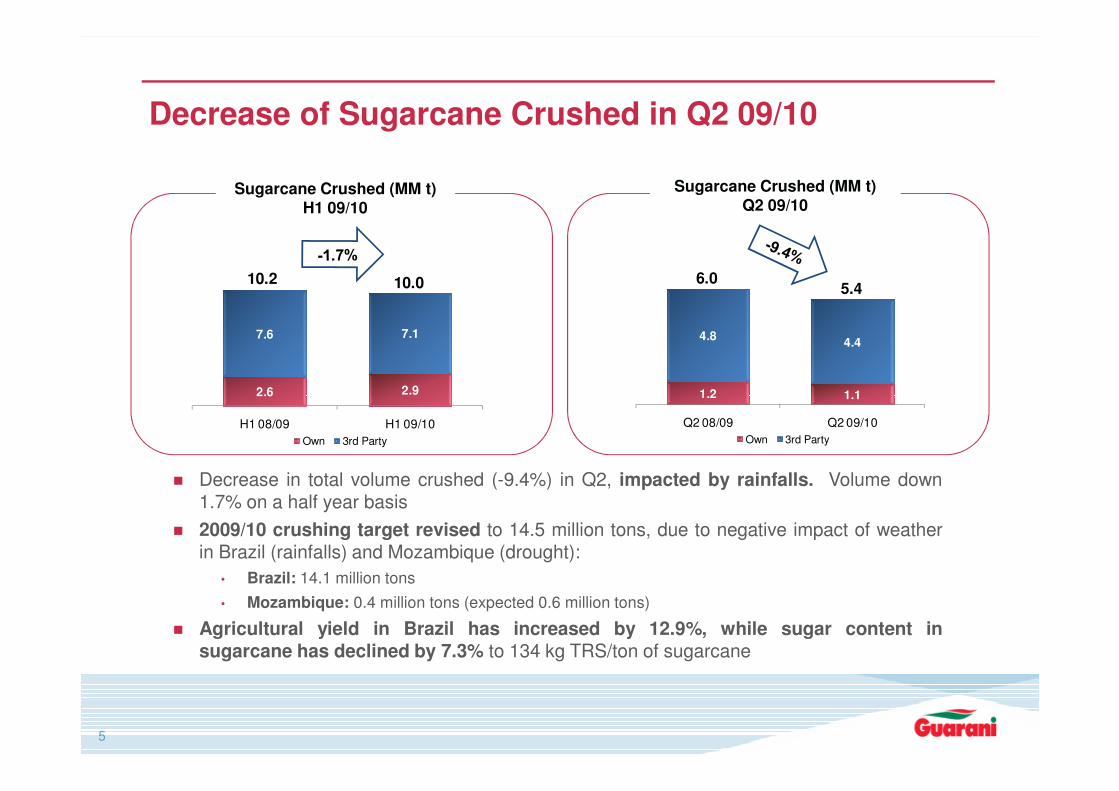
� Decrease in total volume crushed (-9.4%) in Q2, impacted by rainfalls. Volume down1.7% on a half year basis
� 2009/10 crushing target revised to 14.5 million tons, due to negative impact of weatherin Brazil (rainfalls) and Mozambique (drought):
• Brazil: 14.1 million tons
• Mozambique: 0.4 million tons (expected 0.6 million tons)
� Agricultural yield in Brazil has increased by 12.9%, while sugar content insugarcane has declined by 7.3% to 134 kg TRS/ton of sugarcane
5
57 82
282 250
332339
276 326
459 334
8346
818706
H1 09/10: Increased Refined Sugar Production and Slight Decrease in Ethanol Production
Ethanol Production (’000 m³) H1 09/10
Sugar Production (’000 t) H1 09/10
57 82
H1 08/09 H1 09/10Anhydrous Hydrous
H1 08/09 H1 09/10
Refined Crystal VHP
6
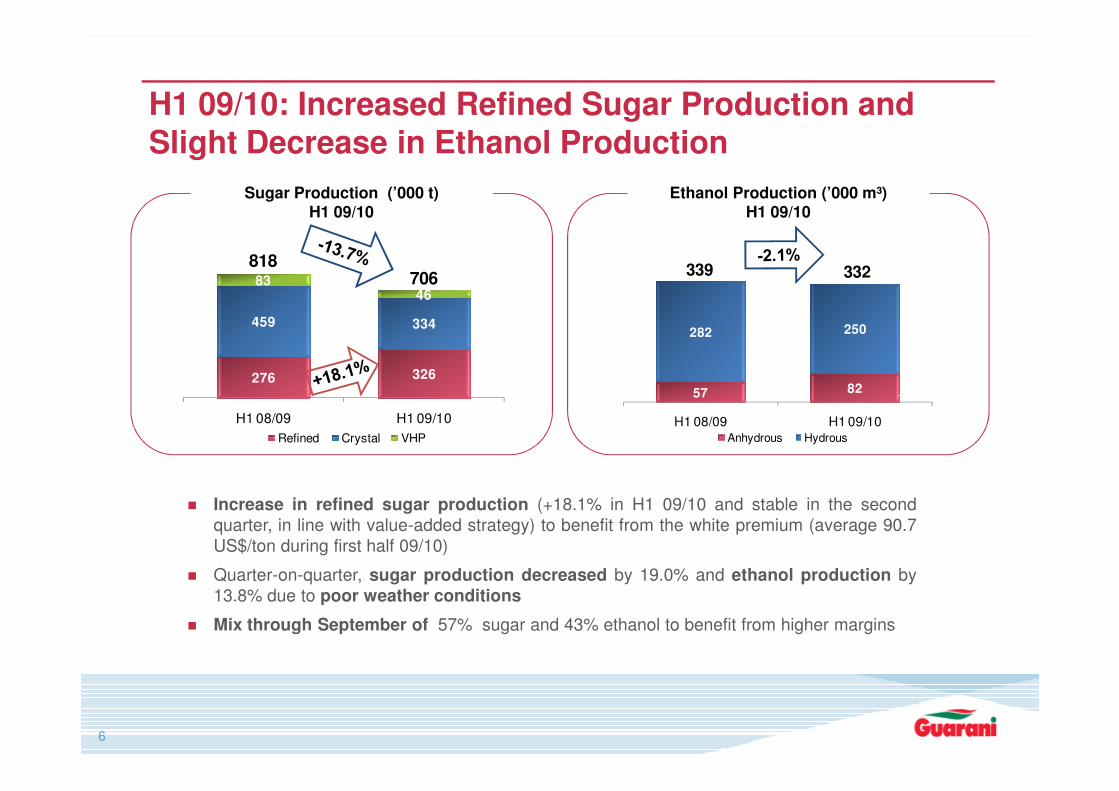
� Increase in refined sugar production (+18.1% in H1 09/10 and stable in the secondquarter, in line with value-added strategy) to benefit from the white premium (average 90.7US$/ton during first half 09/10)
� Quarter-on-quarter, sugar production decreased by 19.0% and ethanol production by13.8% due to poor weather conditions
� Mix through September of 57% sugar and 43% ethanol to benefit from higher margins
161242
99
9632
36292
373
260392
179
16251
53490
607
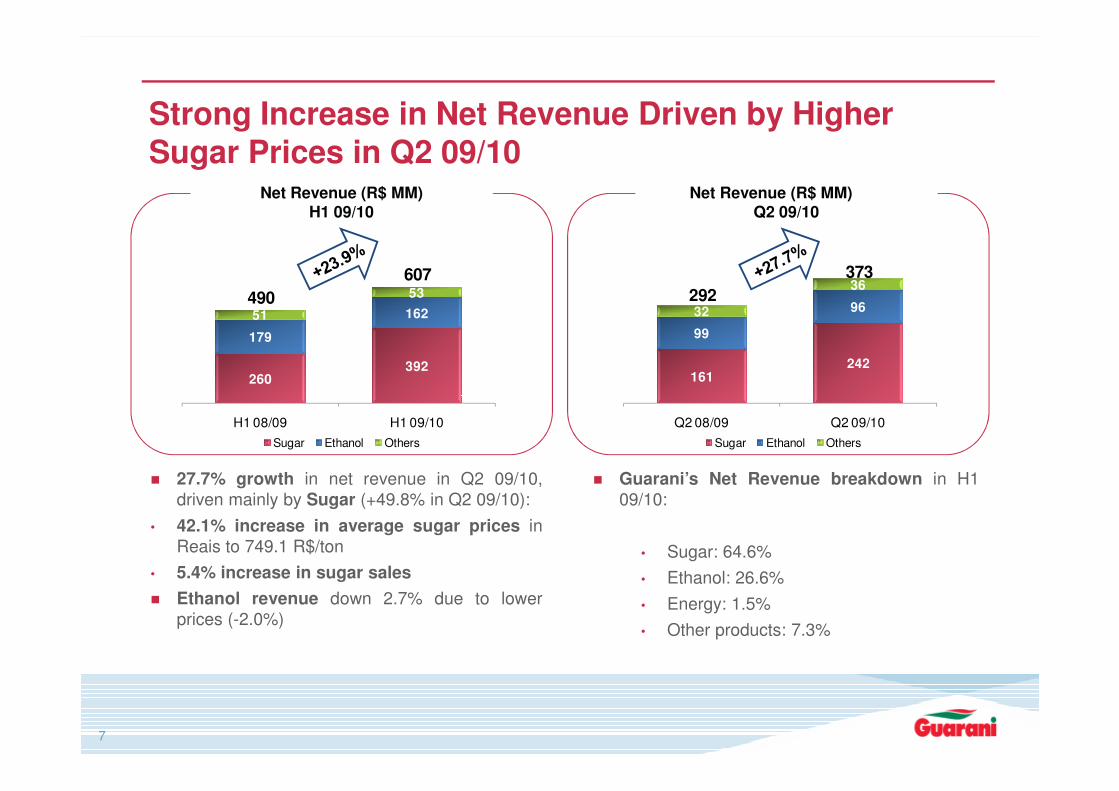
Strong Increase in Net Revenue Driven by Higher Sugar Prices in Q2 09/10
Net Revenue (R$ MM) Q2 09/10
Net Revenue (R$ MM) H1 09/10
Q2 08/09 Q2 09/10
Sugar Ethanol Others
H1 08/09 H1 09/10
Sugar Ethanol Others
� 27.7% growth in net revenue in Q2 09/10,driven mainly by Sugar (+49.8% in Q2 09/10):
• 42.1% increase in average sugar prices inReais to 749.1 R$/ton
• 5.4% increase in sugar sales
� Ethanol revenue down 2.7% due to lowerprices (-2.0%)
7
� Guarani’s Net Revenue breakdown in H109/10:
• Sugar: 64.6%
• Ethanol: 26.6%
• Energy: 1.5%
• Other products: 7.3%
76.6114.8
15.6%
18.9%
5,0%
7,0%
9,0%
11,0%
13,0%
15,0%
17,0%
19,0%
21,0%
0
20
40
60
80
100
120
140
160
59.1 64.9
20.2%
17.4%
1,0%3,0%5,0%7,0%9,0%11,0%13,0%15,0%17,0%19,0%21,0%23,0%25,0%
0
20
40
60
80
100
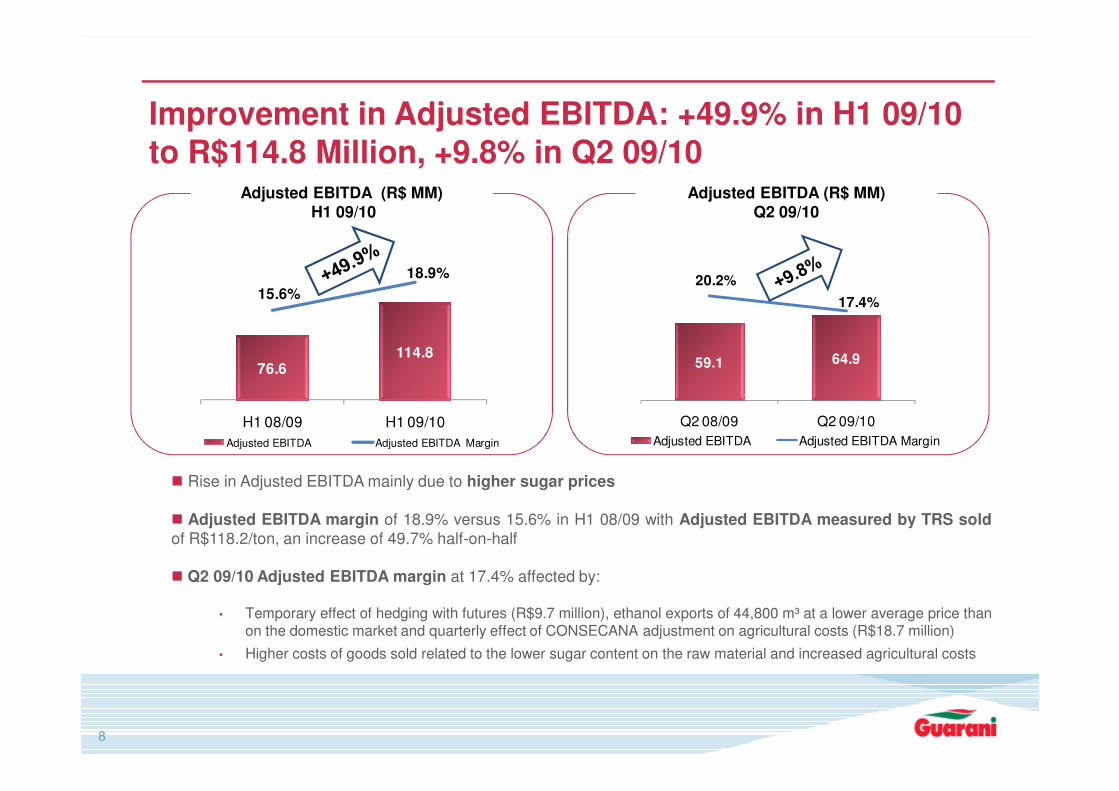
Improvement in Adjusted EBITDA: +49.9% in H1 09/10 to R$114.8 Million, +9.8% in Q2 09/10
Adjusted EBITDA (R$ MM) Q2 09/10
Adjusted EBITDA (R$ MM) H1 09/10
5,0%0
H1 08/09 H1 09/10
Adjusted EBITDA Adjusted EBITDA Margin
1,0%0
Q2 08/09 Q2 09/10
Adjusted EBITDA Adjusted EBITDA Margin
� Rise in Adjusted EBITDA mainly due to higher sugar prices
� Adjusted EBITDA margin of 18.9% versus 15.6% in H1 08/09 with Adjusted EBITDA measured by TRS soldof R$118.2/ton, an increase of 49.7% half-on-half
� Q2 09/10 Adjusted EBITDA margin at 17.4% affected by:
• Temporary effect of hedging with futures (R$9.7 million), ethanol exports of 44,800 m³ at a lower average price thanon the domestic market and quarterly effect of CONSECANA adjustment on agricultural costs (R$18.7 million)
• Higher costs of goods sold related to the lower sugar content on the raw material and increased agricultural costs
8
(101.8)
(0.5)
(128.4)
13.8
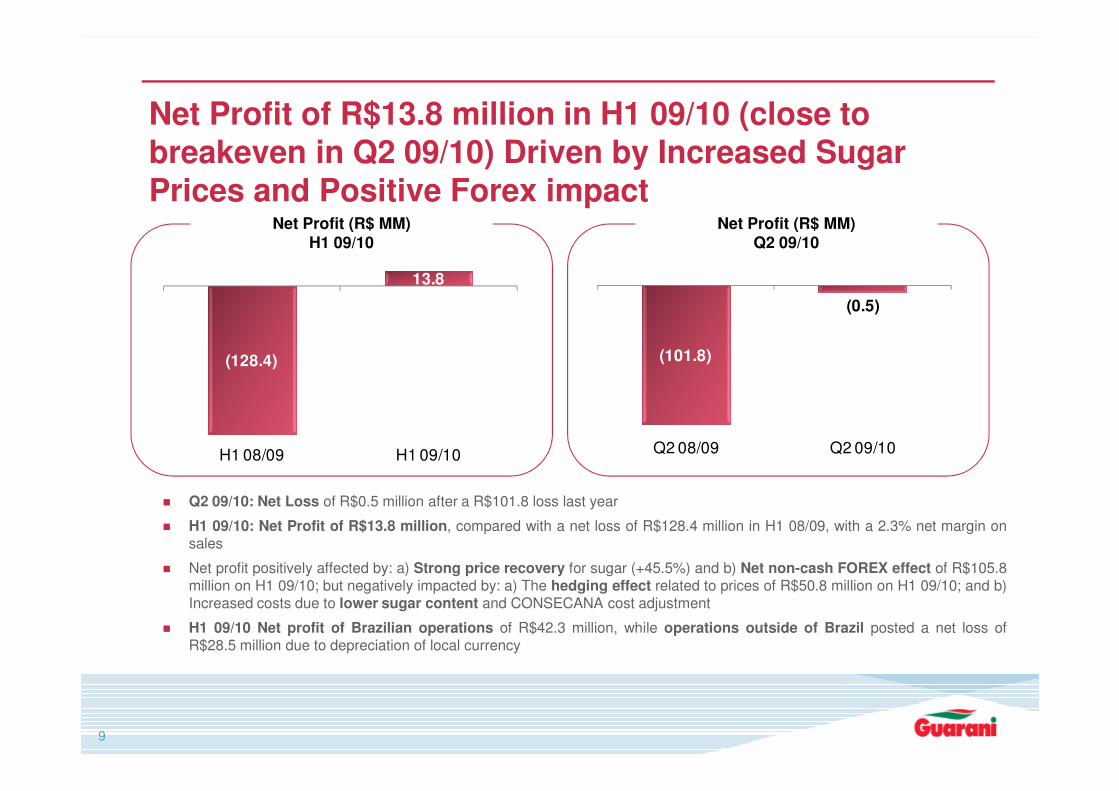
Net Profit of R$13.8 million in H1 09/10 (close to breakeven in Q2 09/10) Driven by Increased Sugar Prices and Positive Forex impact
Net Profit (R$ MM) Q2 09/10
Net Profit (R$ MM) H1 09/10
Q2 08/09 Q2 09/10H1 08/09 H1 09/10
� Q2 09/10: Net Loss of R$0.5 million after a R$101.8 loss last year
� H1 09/10: Net Profit of R$13.8 million, compared with a net loss of R$128.4 million in H1 08/09, with a 2.3% net margin onsales
� Net profit positively affected by: a) Strong price recovery for sugar (+45.5%) and b) Net non-cash FOREX effect of R$105.8million on H1 09/10; but negatively impacted by: a) The hedging effect related to prices of R$50.8 million on H1 09/10; and b)Increased costs due to lower sugar content and CONSECANA cost adjustment
� H1 09/10 Net profit of Brazilian operations of R$42.3 million, while operations outside of Brazil posted a net loss ofR$28.5 million due to depreciation of local currency
9
Foreign Currency
70%
BRL30%
Current50%
Non-Current
50%
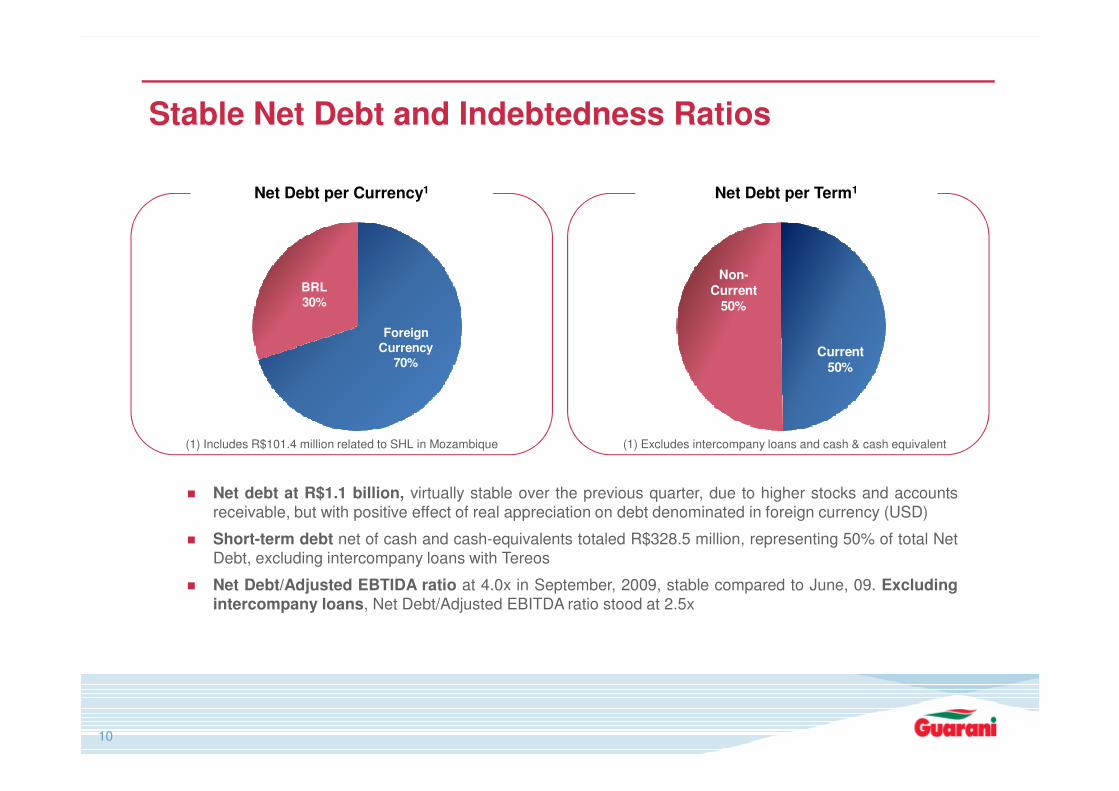
Stable Net Debt and Indebtedness Ratios
Net Debt per Term1Net Debt per Currency1
� Net debt at R$1.1 billion, virtually stable over the previous quarter, due to higher stocks and accountsreceivable, but with positive effect of real appreciation on debt denominated in foreign currency (USD)
� Short-term debt net of cash and cash-equivalents totaled R$328.5 million, representing 50% of total NetDebt, excluding intercompany loans with Tereos
� Net Debt/Adjusted EBTIDA ratio at 4.0x in September, 2009, stable compared to June, 09. Excludingintercompany loans, Net Debt/Adjusted EBITDA ratio stood at 2.5x
10
(1) Includes R$101.4 million related to SHL in Mozambique (1) Excludes intercompany loans and cash & cash equivalent
� Selective industrial and agricultural CAPEX to:
� Eliminate bottlenecks and further develop marginal capacity to lower fixed costs at SãoJosé and Tanabi plants
� Increase sugarcane crushing capacity at São José plant (from 2.6 to 3.2 million tons) andlaunch a sugar factory at Tanabi plant (110,000 ton/year)
CAPEX: Focus on Sugar Production Increase, Cost Reduction and Efficiency Programs
� Sugarcane planting to produce the necessary raw material in coming crops to benefit fromhigh sugar prices
11
100
120
140
160
180
30
40
50
60
Pro
du
cti
on
/Co
ns
um
pti
on
(M
M t
on
)
Inv
en
tori
es
(M
M t
on
)
Inventories Production Consumption
15
20
25
30
35
40
45
50
8
12
16
20
24
28
08
08
08 09
09
09
09
ce
nts
R$
/lb
ce
nts
US
$/lb
cents US$/lb cents R$/lb
Q209 Q110Q109 Q309 Q409 Q210
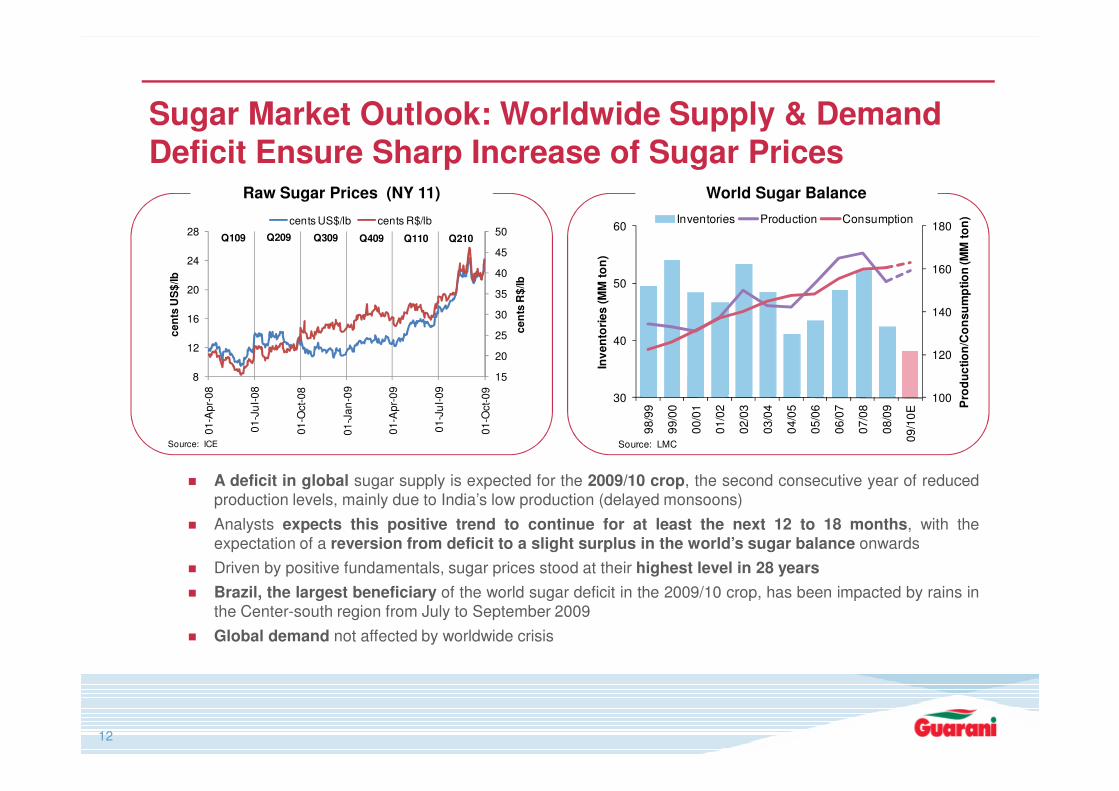
Sugar Market Outlook: Worldwide Supply & Demand Deficit Ensure Sharp Increase of Sugar Prices
World Sugar BalanceRaw Sugar Prices (NY 11)
10030
98
/99
99
/00
00
/01
01
/02
02
/03
03
/04
04
/05
05
/06
06
/07
07
/08
08
/09
09
/10
E Pro
du
cti
on
/Co
ns
um
pti
on
(M
M t
on
)
Source: LMC
01
-Ap
r-0
8
01
-Ju
l-0
8
01
-Oct-
08
01
-Ja
n-0
9
01
-Ap
r-0
9
01
-Ju
l-0
9
01
-Oct-
09
Source: ICE
12
� A deficit in global sugar supply is expected for the 2009/10 crop, the second consecutive year of reducedproduction levels, mainly due to India’s low production (delayed monsoons)
� Analysts expects this positive trend to continue for at least the next 12 to 18 months, with theexpectation of a reversion from deficit to a slight surplus in the world’s sugar balance onwards
� Driven by positive fundamentals, sugar prices stood at their highest level in 28 years
� Brazil, the largest beneficiary of the world sugar deficit in the 2009/10 crop, has been impacted by rains inthe Center-south region from July to September 2009
� Global demand not affected by worldwide crisis
200
250
300
'00
0 u
nit
s
Ethanol + Flex-Fuel Gas + Diesel
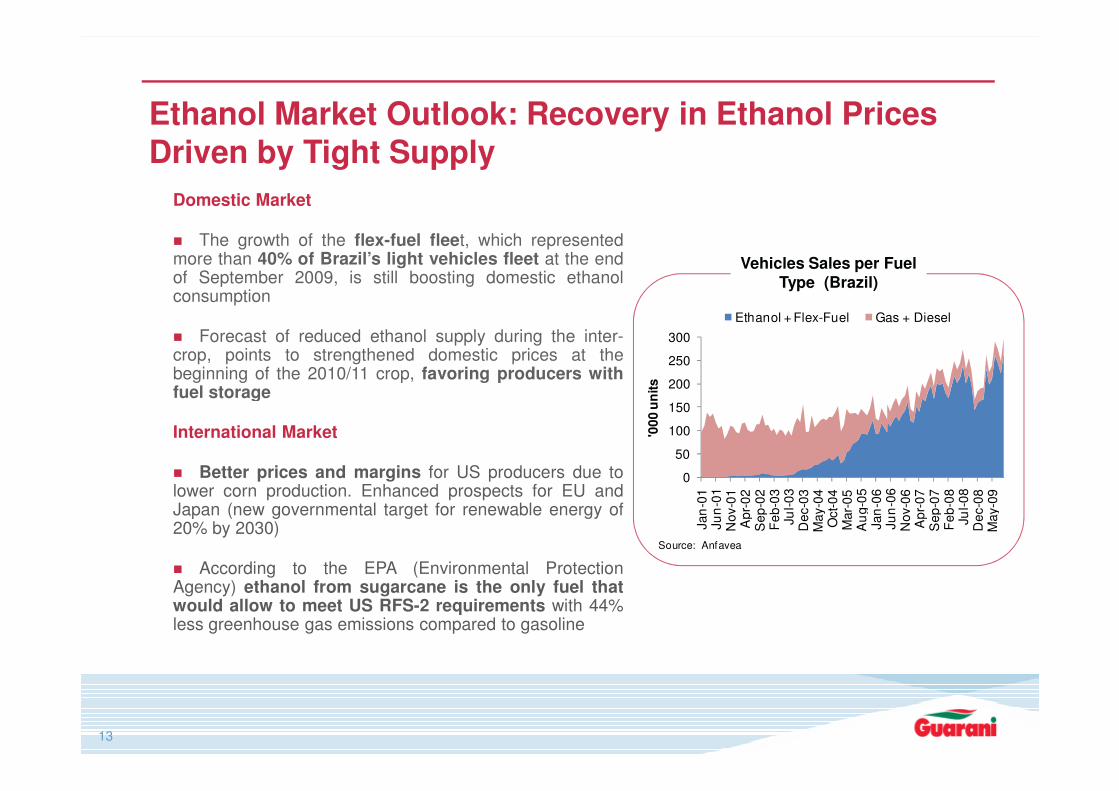
Ethanol Market Outlook: Recovery in Ethanol Prices Driven by Tight Supply
Vehicles Sales per Fuel Type (Brazil)
Domestic Market
� The growth of the flex-fuel fleet, which representedmore than 40% of Brazil’s light vehicles fleet at the endof September 2009, is still boosting domestic ethanolconsumption
� Forecast of reduced ethanol supply during the inter-crop, points to strengthened domestic prices at thebeginning of the 2010/11 crop, favoring producers withfuel storage
0
50
100
150
Jan
-01
Ju
n-0
1N
ov-0
1A
pr-
02
Se
p-0
2F
eb
-03
Jul-
03
De
c-0
3M
ay-0
4O
ct-
04
Mar-
05
Au
g-0
5Jan
-06
Ju
n-0
6N
ov-0
6A
pr-
07
Se
p-0
7F
eb
-08
Jul-
08
De
c-0
8M
ay-0
9
'00
0 u
nit
s
Source: Anfavea
13
fuel storage
International Market
� Better prices and margins for US producers due tolower corn production. Enhanced prospects for EU andJapan (new governmental target for renewable energy of20% by 2030)
� According to the EPA (Environmental ProtectionAgency) ethanol from sugarcane is the only fuel thatwould allow to meet US RFS-2 requirements with 44%less greenhouse gas emissions compared to gasoline
Outlook: Guarani Solidly Positioned to Seize Opportunities and Benefit from the Positive Market Outlook
� Rains in Brazil and drought in Asia enhancing positive outlook for sugar prices for the second
half of 2009/10
� Positive prices outlook for ethanol as of second half of 09/10 due to strong demand
� Continued focus on balance sheet strengthening
14
� Pipeline of attractive expansion projects: Sugar in the short term and Ethanol and
Cogeneration in the Mid/Long term
� Strong commitment and support from Tereos, Guarani’s controlling shareholder, to seize
opportunities: Guarani is a strategic asset for Tereos

Thank You
� Jacyr S. Costa Filho
� phone: +55 (11) 3544-4900
� e-mail: [email protected]
� website: www.acucarguarani.com.br/ir
CEO
� Reynaldo F. BenitezCFO and Investor Relations Officer
� Alexandre L. MenezioInvestor Relations Manager
� Felipe F. MendesInvestor Relations Analyst
� Renato N. Zanetti NetoInvestor Relations Analyst