Embed Size (px)
Citation preview
The Stars Student activities 11-20
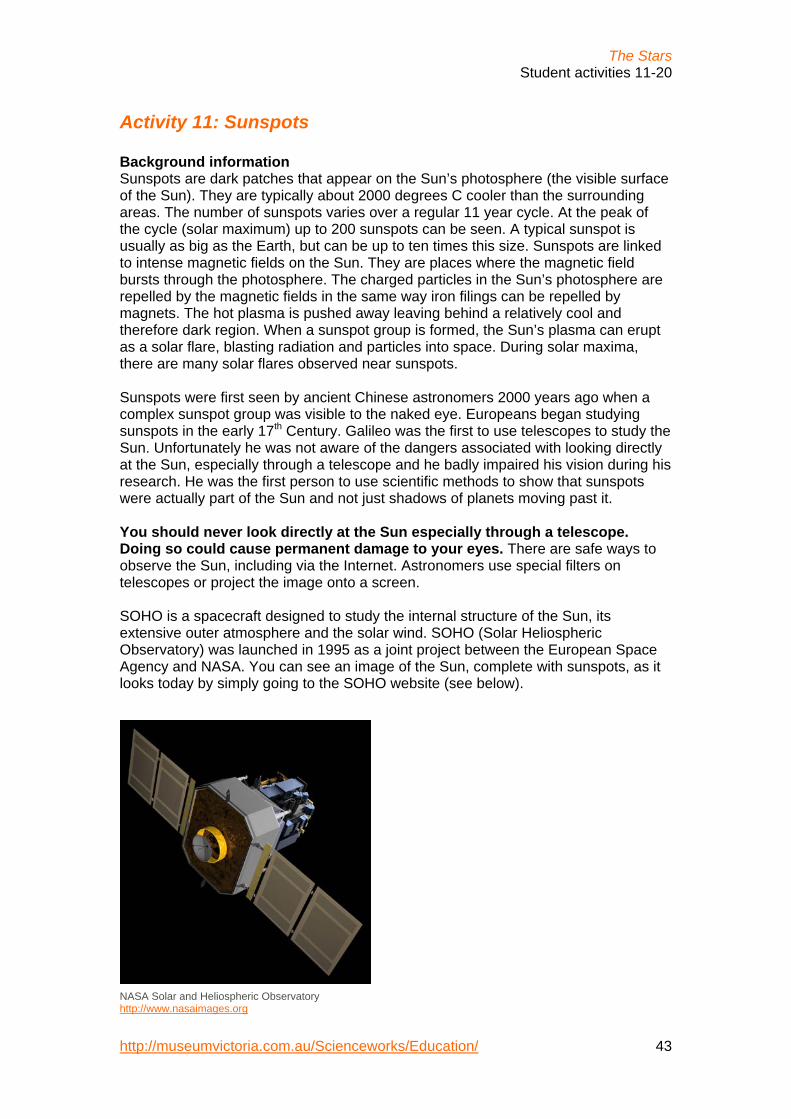
Activity 11: Sunspots Background information Sunspots are dark patches that appear on the Sun’s photosphere (the visible surface of the Sun). They are typically about 2000 degrees C cooler than the surrounding areas. The number of sunspots varies over a regular 11 year cycle. At the peak of the cycle (solar maximum) up to 200 sunspots can be seen. A typical sunspot is usually as big as the Earth, but can be up to ten times this size. Sunspots are linked to intense magnetic fields on the Sun. They are places where the magnetic field bursts through the photosphere. The charged particles in the Sun’s photosphere are repelled by the magnetic fields in the same way iron filings can be repelled by magnets. The hot plasma is pushed away leaving behind a relatively cool and therefore dark region. When a sunspot group is formed, the Sun’s plasma can erupt as a solar flare, blasting radiation and particles into space. During solar maxima, there are many solar flares observed near sunspots. Sunspots were first seen by ancient Chinese astronomers 2000 years ago when a complex sunspot group was visible to the naked eye. Europeans began studying sunspots in the early 17th Century. Galileo was the first to use telescopes to study the Sun. Unfortunately he was not aware of the dangers associated with looking directly at the Sun, especially through a telescope and he badly impaired his vision during his research. He was the first person to use scientific methods to show that sunspots were actually part of the Sun and not just shadows of planets moving past it. You should never look directly at the Sun especially through a telescope. Doing so could cause permanent damage to your eyes. There are safe ways to observe the Sun, including via the Internet. Astronomers use special filters on telescopes or project the image onto a screen. SOHO is a spacecraft designed to study the internal structure of the Sun, its extensive outer atmosphere and the solar wind. SOHO (Solar Heliospheric Observatory) was launched in 1995 as a joint project between the European Space Agency and NASA. You can see an image of the Sun, complete with sunspots, as it looks today by simply going to the SOHO website (see below).
NASA Solar and Heliospheric Observatory http://www.nasaimages.org
http://museumvictoria.com.au/Scienceworks/Education/
43
The Stars Student activities 11-20
What you need • access to the Internet • graph paper
What to do On graph paper draw horizontal and vertical axes. The vertical axis will represent the number of sunspots and the horizontal axis will represent the day (for at least four weeks).
1. Each day: • Visit the SOHO web site at: http://sohowww.nascom.nasa.gov/ • Click on the image below the word Sunspots in the right hand column.
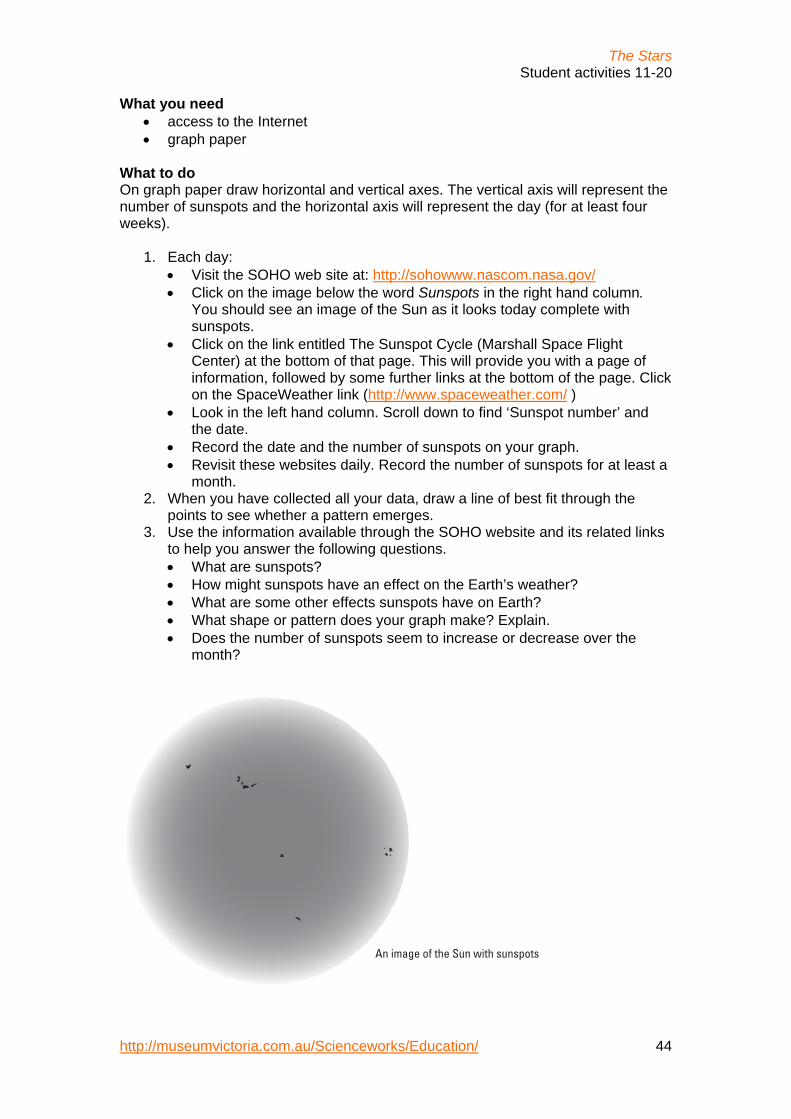
You should see an image of the Sun as it looks today complete with sunspots.
• Click on the link entitled The Sunspot Cycle (Marshall Space Flight Center) at the bottom of that page. This will provide you with a page of information, followed by some further links at the bottom of the page. Click on the SpaceWeather link (http://www.spaceweather.com/ )
• Look in the left hand column. Scroll down to find ‘Sunspot number’ and the date.
• Record the date and the number of sunspots on your graph. • Revisit these websites daily. Record the number of sunspots for at least a
month. 2. When you have collected all your data, draw a line of best fit through the
points to see whether a pattern emerges. 3. Use the information available through the SOHO website and its related links
to help you answer the following questions. • What are sunspots? • How might sunspots have an effect on the Earth’s weather? • What are some other effects sunspots have on Earth? • What shape or pattern does your graph make? Explain. • Does the number of sunspots seem to increase or decrease over the
month?
http://museumvictoria.com.au/Scienceworks/Education/
44

The Stars Student activities 11-20
Extension The following data showing the average numbers of sunspots per year from 1970 to 2000 was obtained from the SIDC, RWC Brussels World Data Centre: http://sidc.oma.be/sunspot-data/ (Click on ‘Yearly Sunspot Number’. You may need to download the software). Graph this data using graph paper or the Excel program.
Year Average number of sunspots
Year Average number of sunspots
1970 104.5 1990 142.6
1971 66.6 1991 145.7
1972 68.9 1992 94.3
1973 38 1993 54.6
1974 34.5 1994 29.9
1975 15.5 1995 17.5
1976 12.6 1996 8.6
1977 27.5 1997 21.5
1978 92.5 1998 64.3
1979 155.4 1999 93.3
1980 154.6 2000 119.6
1981 140.5 2001 111.0
1982 115.9 2002 104.0
1983 66.6 2003 63.7
1984 45.9 2004 40.4
1985 17.9 2005 29.8
1986 13.4 2006 15.2
1987 29.2 2007 7.6
1988 100.2
1989 157.6
1. Describe and explain any pattern that you see in this graph. 2. What is the solar maximum and solar minimum? 3. From your graph, predict whether we are heading for a solar maximum or
solar minimum this year. 4. Some people believe that special events occur during solar maximums. 5. Go to the web site http://spaceweather.com/java/sunspot.html and check for
yourself. 6. Enter your birth date on the Sunspot Plotter on this web page to find out
whether you were born during a solar maximum or minimum.
http://museumvictoria.com.au/Scienceworks/Education/
45
The Stars Student activities 11-20
Activity 12: The inner struggle of our Sun Background information
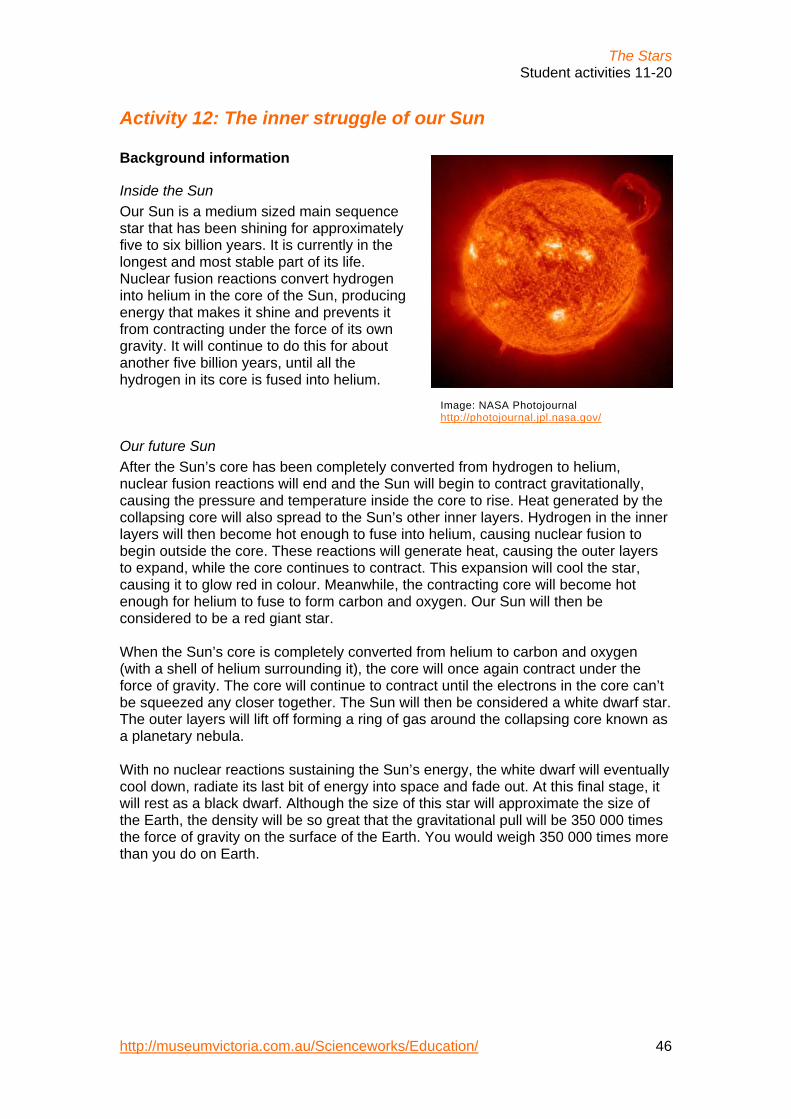
Inside the Sun Our Sun is a medium sized main sequence star that has been shining for approximately five to six billion years. It is currently in the longest and most stable part of its life. Nuclear fusion reactions convert hydrogen into helium in the core of the Sun, producing energy that makes it shine and prevents it from contracting under the force of its own gravity. It will continue to do this for about another five billion years, until all the hydrogen in its core is fused into helium.
Image: NASA Photojournal http://photojournal.jpl.nasa.gov/
Our future Sun After the Sun’s core has been completely converted from hydrogen to helium, nuclear fusion reactions will end and the Sun will begin to contract gravitationally, causing the pressure and temperature inside the core to rise. Heat generated by the collapsing core will also spread to the Sun’s other inner layers. Hydrogen in the inner layers will then become hot enough to fuse into helium, causing nuclear fusion to begin outside the core. These reactions will generate heat, causing the outer layers to expand, while the core continues to contract. This expansion will cool the star, causing it to glow red in colour. Meanwhile, the contracting core will become hot enough for helium to fuse to form carbon and oxygen. Our Sun will then be considered to be a red giant star. When the Sun’s core is completely converted from helium to carbon and oxygen (with a shell of helium surrounding it), the core will once again contract under the force of gravity. The core will continue to contract until the electrons in the core can’t be squeezed any closer together. The Sun will then be considered a white dwarf star. The outer layers will lift off forming a ring of gas around the collapsing core known as a planetary nebula. With no nuclear reactions sustaining the Sun’s energy, the white dwarf will eventually cool down, radiate its last bit of energy into space and fade out. At this final stage, it will rest as a black dwarf. Although the size of this star will approximate the size of the Earth, the density will be so great that the gravitational pull will be 350 000 times the force of gravity on the surface of the Earth. You would weigh 350 000 times more than you do on Earth.
http://museumvictoria.com.au/Scienceworks/Education/
46
The Stars Student activities 11-20
The inner struggle of our Sun In the following activity, students will model the nuclear fusion reaction in our Sun as a main sequence star, and use this as a basis to model the Sun’s future. What you need
• texta
• balloons
• sticky-tape or string
• helium labels
What to do The students form two groups of 16. One group role-plays the reaction and the other group watches. The two groups then swap. In the group performing the role-play: Eight students have two balloons each. Each balloon represents a hydrogen atom in the Sun’s core, and should be labelled with the letter H. These students are the hydrogen helpers. Their aim is to prevent the balloons from touching the floor using only one hand, while their other hand is behind their back. Once both their balloons have fallen to the ground, the students leave the group quietly. The other eight students are the helium helpers. They try to take the balloons from the hydrogen helpers and place them on the ground so that others in their group can stick or tie four balloons together and label the new atom He (helium). This atom is heavier and remains on the floor. Questions
1 Find out what will happen to the Sun when all the hydrogen in the core is
fused into helium.
2 What type of star will the Sun become?
3 Is our Sun likely to become a black hole? Explain your answer.
4 Research the different stages our Sun will move through during its life cycle
and think about how you could role play it, complete with props.
5 Get a group together and perform the role-play. Allow other students (the
audience) to judge the accuracy of the researched content. You may need a
narrator to facilitate your role-play.
6 Illustrate on poster paper the different stages the Sun will go through during
its life cycle. Use symbols and diagrams, and as few words as possible.
http://museumvictoria.com.au/Scienceworks/Education/
47
The Stars Student activities 11-20
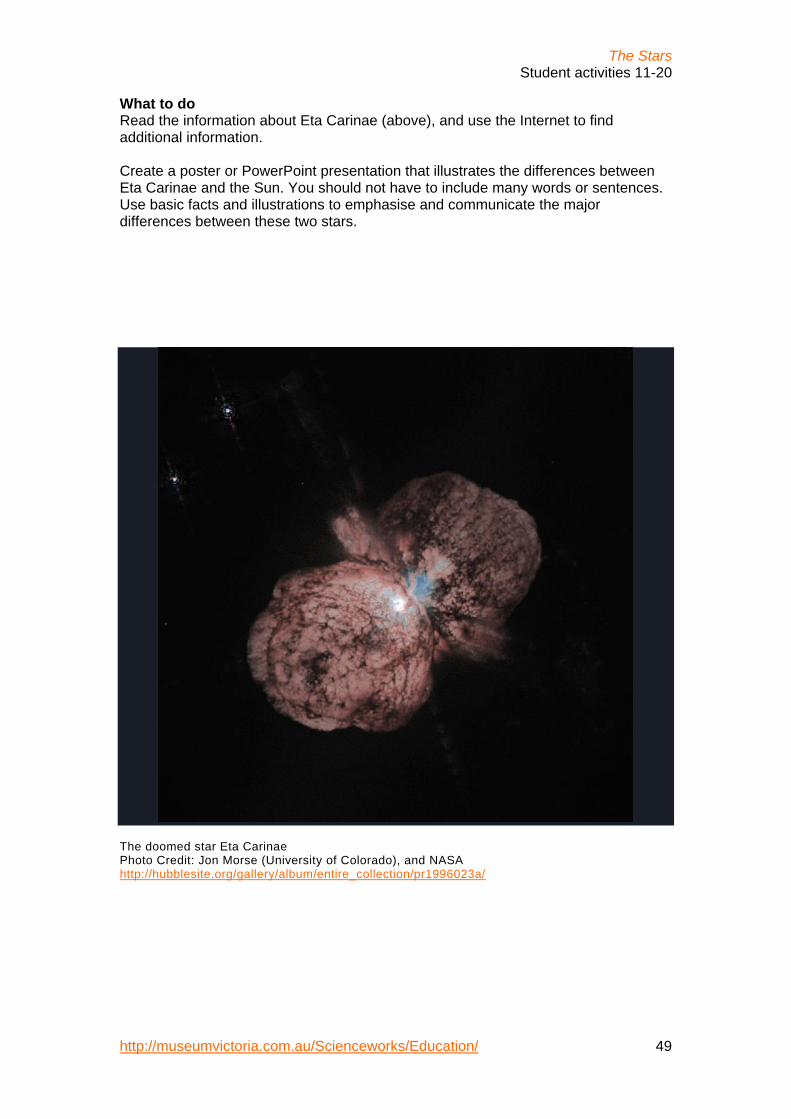
Activity 13: What’s so special about Eta Carinae? Introduction Lying between the Southern Cross and the False Cross is the most luminous and massive star in our Milky Way Galaxy – Eta Carinae. It radiates five million times more brightly than the Sun and is about 120 times more massive. It sheds about two Earth masses each day in its stellar wind. If the Sun gave off this much mass it would be gone in a mere 300 years. The star lies within a hot cloud of glowing pink hydrogen gas called the Eta Carina Nebula. (Visit the web site http://allthesky.com/constellations/crux/main.html for a photograph of the Eta Carina Nebula, labelled NGC 3372, close to the Southern Cross). Eta Carinae is 7 500 light years away and at present can only be seen by using binoculars. However, back in 1843 it was almost as bright as the star Sirius, the brightest star in our night sky. The reason for Eta Carinae’s rapid brightening was a 20 year eruption which threw off enough material to create three Suns. Using the Hubble Space Telescope, which sits above the Earth's atmosphere, astronomers have been able to obtain images of the star. They have found two bubbles of expanding gas that were thrown out from the star’s poles during the 1843 eruption. This material is travelling at 2.4 million km/hr (fast enough for a spaceship to travel to the Moon and back in 20 minutes). You can see the Hubble image of this eruption by visiting the web site: http://apod.nasa.gov/apod/ap060326.html Eta Carinae is a good candidate for the next supernova in our galaxy. On average, a supernova goes off in a galaxy every 50 years. The last supernova in our own Milky Way Galaxy occurred in 1604, just six years before the telescope was invented. That supernova explosion would have given off more energy than the entire Milky Way Galaxy, and the star would have been visible during the daytime. We are long overdue for a supernova and now have a large number of telescopes searching the sky to record images of these violent deaths of massive stars.
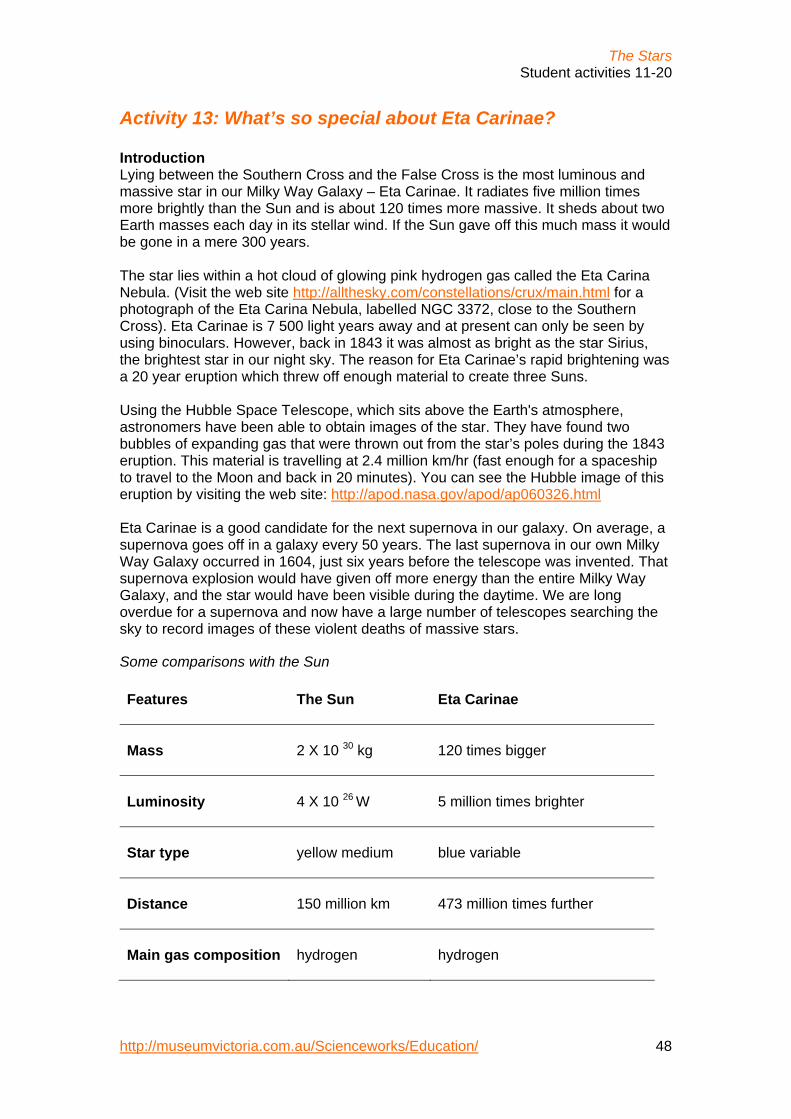
Some comparisons with the Sun Features
The Sun Eta Carinae
Mass
2 X 10 30 kg
120 times bigger
Luminosity
4 X 10 26 W
5 million times brighter
Star type
yellow medium
blue variable
Distance
150 million km
473 million times further
Main gas composition
hydrogen
hydrogen
http://museumvictoria.com.au/Scienceworks/Education/
48
The Stars Student activities 11-20
What to do Read the information about Eta Carinae (above), and use the Internet to find additional information. Create a poster or PowerPoint presentation that illustrates the differences between Eta Carinae and the Sun. You should not have to include many words or sentences. Use basic facts and illustrations to emphasise and communicate the major differences between these two stars.
The doomed star Eta Carinae Photo Credit: Jon Morse (University of Colorado), and NASA http://hubblesite.org/gallery/album/entire_collection/pr1996023a/
http://museumvictoria.com.au/Scienceworks/Education/
49
The Stars Student activities 11-20
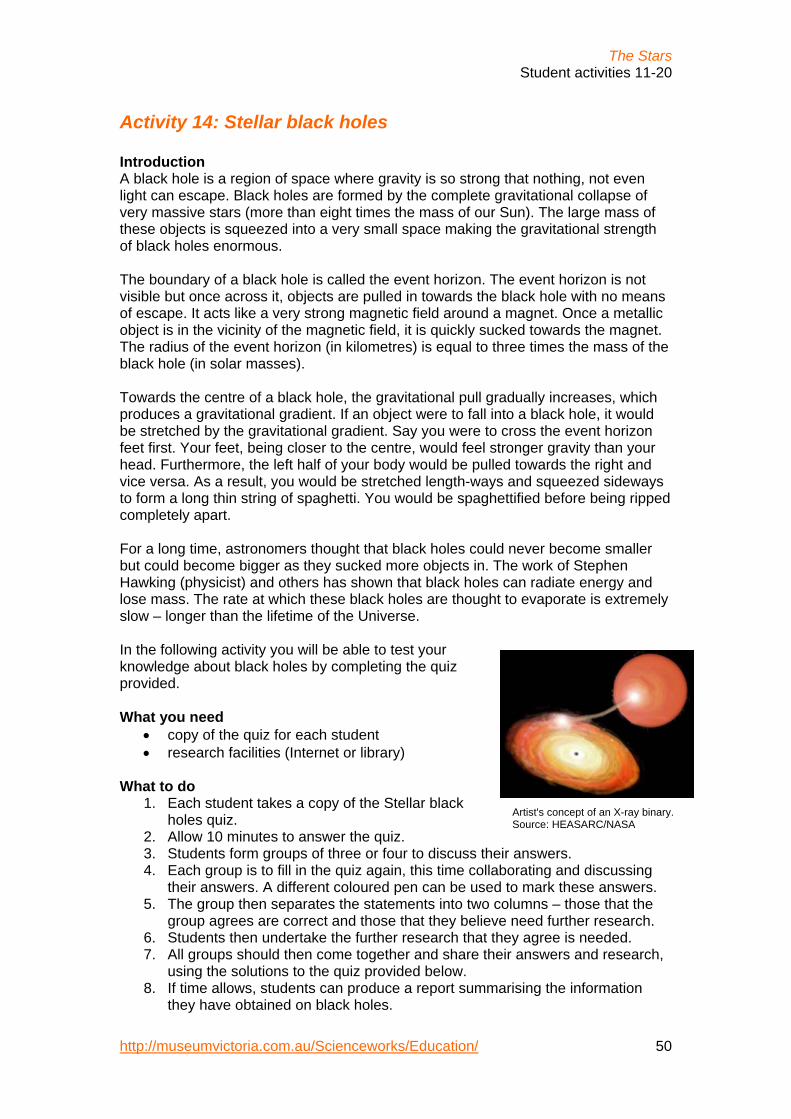
Activity 14: Stellar black holes Introduction A black hole is a region of space where gravity is so strong that nothing, not even light can escape. Black holes are formed by the complete gravitational collapse of very massive stars (more than eight times the mass of our Sun). The large mass of these objects is squeezed into a very small space making the gravitational strength of black holes enormous. The boundary of a black hole is called the event horizon. The event horizon is not visible but once across it, objects are pulled in towards the black hole with no means of escape. It acts like a very strong magnetic field around a magnet. Once a metallic object is in the vicinity of the magnetic field, it is quickly sucked towards the magnet. The radius of the event horizon (in kilometres) is equal to three times the mass of the black hole (in solar masses). Towards the centre of a black hole, the gravitational pull gradually increases, which produces a gravitational gradient. If an object were to fall into a black hole, it would be stretched by the gravitational gradient. Say you were to cross the event horizon feet first. Your feet, being closer to the centre, would feel stronger gravity than your head. Furthermore, the left half of your body would be pulled towards the right and vice versa. As a result, you would be stretched length-ways and squeezed sideways to form a long thin string of spaghetti. You would be spaghettified before being ripped completely apart. For a long time, astronomers thought that black holes could never become smaller but could become bigger as they sucked more objects in. The work of Stephen Hawking (physicist) and others has shown that black holes can radiate energy and lose mass. The rate at which these black holes are thought to evaporate is extremely slow – longer than the lifetime of the Universe. In the following activity you will be able to test your knowledge about black holes by completing the quiz provided.
Artist's concept of an X-ray binary. Source: HEASARC/NASA
What you need
• copy of the quiz for each student • research facilities (Internet or library)
What to do
1. Each student takes a copy of the Stellar black holes quiz.
2. Allow 10 minutes to answer the quiz. 3. Students form groups of three or four to discuss their answers. 4. Each group is to fill in the quiz again, this time collaborating and discussing
their answers. A different coloured pen can be used to mark these answers. 5. The group then separates the statements into two columns – those that the
group agrees are correct and those that they believe need further research. 6. Students then undertake the further research that they agree is needed. 7. All groups should then come together and share their answers and research,
using the solutions to the quiz provided below. 8. If time allows, students can produce a report summarising the information
they have obtained on black holes.
http://museumvictoria.com.au/Scienceworks/Education/
50
The Stars Student activities 11-20
Stellar black holes quiz Circle true (T) or false (F) for the following statements. 1. A black hole is black because we can’t see it. T / F
2. Black holes roam around the universe devouring everything in their path. T / F
3. The gravity of a black hole is so strong that not even light can escape it. T / F
4. Our Earth will become a black hole victim in the next 10 billion years. T / F
5. Black holes are formed by the complete gravitational collapse of massive stars
about the size of our Sun. T / F
6. Red supergiants can progress to become black holes according to the life cycle
of massive stars. T / F
7. An object can survive a weak black hole beyond the event horizon (the area
surrounding the black hole), but nothing can survive all the way to the centre. T/F
8. If you were able to compress an object the size of the Earth into the size of a
marble, you could (theoretically) produce a black hole. T / F
9. Black holes can’t suck in other black holes because of their mass. T / F
10. Our Sun will become a black hole in the next 10 billion years. T / F
11. Black holes evaporate. T / F
12. Like stars, black holes rotate about themselves. T / F
13. If it were possible for you to get close to a black hole, you would be stretched
length-ways and squeezed sideways to form a long thin string of spaghetti,
before being ripped completely apart. T / F
14. The planet Jupiter has the right ingredients to form a star and is massive enough
to eventually form a black hole. T / F
15. The star Sirius will eventually become a black hole. T / F
16. Black holes can be detected with x-ray telescopes. T / F
17. If we could somehow survive the journey through a black hole, we would reach a
place where time and space would go backwards. T / F
18. The reason why black holes have such strong gravity is because so much mass
is squeezed into such a small amount of space. T / F
19. Eta Carinae is a massive star in the southern sky that will eventually become a
black hole. T / F
20. There are two types of black holes: stellar black holes, which form from the death
of stars, and super massive black holes, which are found in the centre of
galaxies. T / F
http://museumvictoria.com.au/Scienceworks/Education/
51
The Stars Student activities 11-20
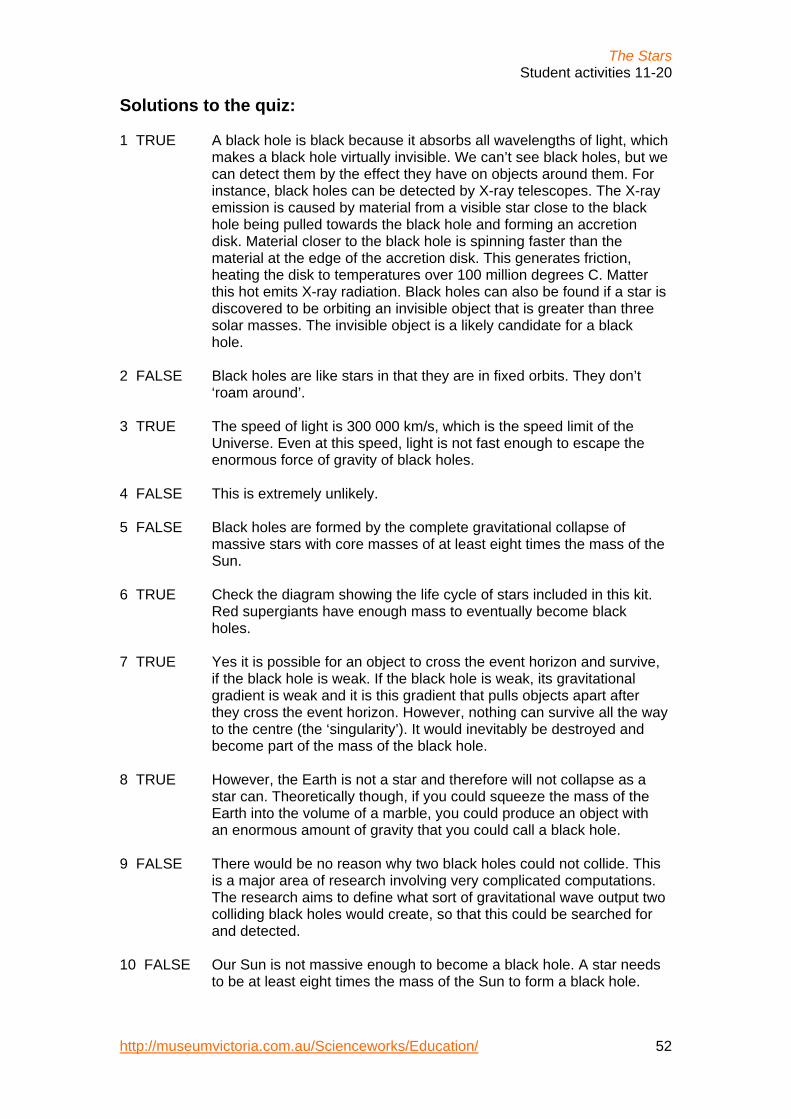
Solutions to the quiz: 1 TRUE A black hole is black because it absorbs all wavelengths of light, which
makes a black hole virtually invisible. We can’t see black holes, but we can detect them by the effect they have on objects around them. For instance, black holes can be detected by X-ray telescopes. The X-ray emission is caused by material from a visible star close to the black hole being pulled towards the black hole and forming an accretion disk. Material closer to the black hole is spinning faster than the material at the edge of the accretion disk. This generates friction, heating the disk to temperatures over 100 million degrees C. Matter this hot emits X-ray radiation. Black holes can also be found if a star is discovered to be orbiting an invisible object that is greater than three solar masses. The invisible object is a likely candidate for a black hole.
2 FALSE Black holes are like stars in that they are in fixed orbits. They don’t ‘roam around’.
3 TRUE The speed of light is 300 000 km/s, which is the speed limit of the Universe. Even at this speed, light is not fast enough to escape the enormous force of gravity of black holes.
4 FALSE This is extremely unlikely.
5 FALSE Black holes are formed by the complete gravitational collapse of massive stars with core masses of at least eight times the mass of the Sun.
6 TRUE Check the diagram showing the life cycle of stars included in this kit. Red supergiants have enough mass to eventually become black holes.
7 TRUE Yes it is possible for an object to cross the event horizon and survive, if the black hole is weak. If the black hole is weak, its gravitational gradient is weak and it is this gradient that pulls objects apart after they cross the event horizon. However, nothing can survive all the way to the centre (the ‘singularity’). It would inevitably be destroyed and become part of the mass of the black hole.
8 TRUE However, the Earth is not a star and therefore will not collapse as a star can. Theoretically though, if you could squeeze the mass of the Earth into the volume of a marble, you could produce an object with an enormous amount of gravity that you could call a black hole.
9 FALSE There would be no reason why two black holes could not collide. This is a major area of research involving very complicated computations. The research aims to define what sort of gravitational wave output two colliding black holes would create, so that this could be searched for and detected.
10 FALSE Our Sun is not massive enough to become a black hole. A star needs to be at least eight times the mass of the Sun to form a black hole.
http://museumvictoria.com.au/Scienceworks/Education/
52

The Stars Student activities 11-20
11 TRUE For a long time astronomers thought that black holes could only grow,
as they swallow up matter in their path. The work of Stephen Hawking and others has shown, however, that black holes can radiate energy and lose mass (by quantum processes). It would, however, take longer than the lifetime of the universe for a stellar black hole to evaporate.
12 TRUE There is no direct evidence that black holes rotate. However, the stars from which they form rotate and there is no reason to believe that they don’t (due to the conservation of angular momentum).
13 TRUE If you were to fall into a black hole feet first, you would be stretched by the strong gravitational gradient. Your feet, being closer to the centre of the black hole, would feel stronger gravity than your head, while the left part of your body would be pulled towards the right and vice versa. The result is that you would be stretched lengthways and squeezed sideways to form a long thin string of spaghetti before your very atoms were ripped completely apart.
14 FALSE The planet Jupiter does have the right ingredients to form a star but is not heavy enough or massive enough to induce the necessary reactions for a star to form. If the gaseous planet Jupiter had been about 60 times more massive than it actually is, it would have become a small star. Since it is not massive enough to form a star, it certainly isn’t massive enough to eventually form a black hole.
15 FALSE Sirius is not massive enough to form a black hole.
16 FALSE The existence of black holes is inferred by the effect on their environment. The accretion disk circling the event horizon can be detected at all wavelengths. See the solution to question one (above).
17 FALSE It is highly unlikely. The equations of Einstein’s Theory of General Relativity indicate that it is virtually impossible, but who knows?
18 TRUE The strength of an object’s gravity depends on its mass and radius. The larger its mass and the smaller its radius, the stronger its gravity.
19 TRUE Eta Carinae is the most luminous star in our galaxy, radiating 5 million times more brightly than our Sun. It is probably the most massive star in our galaxy, being 120 solar masses. Eta Carinae may become the next supernova (explosion in the life cycle of very massive stars) in our galaxy. It is definitely massive enough to eventually be a black hole.
20 TRUE There is increasing evidence to suggest that super massive black holes are found in the centres of galaxies (even our own Milky Way Galaxy). Unlike stellar black holes, these black holes have masses around 100 million solar masses. Their origins are still unknown.
http://museumvictoria.com.au/Scienceworks/Education/
53

The Stars Student activities 11-20
Activity 15: Far away stars Introduction Astronomers use a principle called ‘trigonometric parallax’ to measure the distance of stars.
Nearby stars can be seen to shift against background stars that are much further away. If we look at a nearby star when the Earth is on one side of the Sun and again six months later when the Earth is on the opposite side of its orbit, the nearby star appears to shift against the more distant background stars. What to do To demonstrate this effect hold a finger out close to you and close your left eye, then open it and close your right eye. The image of your finger seems to move against the background. Now move your finger further away from you. You should notice that your finger does not move by as much as when it is close to you. Closing and opening each eye is like having the Earth move in its orbit around the Sun. When comparing the trigonometric parallax of two stars, the one that seems to move the most will be closest to Earth. Astronomers can calculate the distance (d) a star is from Earth (and the Sun) by using simple trigonometric rules.
http://museumvictoria.com.au/Scienceworks/Education/
54
The Stars Student activities 11-20
Activity 16: Apparent and absolute magnitude Introduction
Apparent magnitude Apparent magnitude is a measure of an object’s brightness as seen from Earth. Hipparchus, a Greek astronomer and mathematician, classifed observable stars so that he would have some indication of their relative brightness. He decided to divide the observable stars he catalogued into 6 groups or magnitudes. The brightest stars were classified as apparent magnitude 1 and the faintest or those at the limit of visibility were classified as apparent magnitude 6. This is why a smaller numerical value of apparent magnitude corresponds to a brighter looking star or object.
Later, when the brightness of stars was measured with a photometer, it was found that the first magnitude was roughly 100 times the sixth magnitude. Mathematically, the difference in brightness between each step is the fifth root of 100 = 2.512. The apparent magnitude is calibrated logarithmically because our eyes identify differences in brightness in a logarithmic way.
Using this scale for other celestial objects, negative numbers were required to describe brighter objects like the Sun. The Sun has an apparent magnitude of -26, a full Moon has an apparent magnitude of -13 and the planet Venus -4. The brightest star in the night sky (Sirius) has an apparent magnitude of -1.5.
Absolute magnitude Absolute magnitude gives a measure of the true brightness of a star by giving an indication of brightness if the stars were at a fixed distance of 10 parsecs or about 33 light years. Keeping the distance of the star fixed, the brightness or luminosity of stars can be compared. (Most stars are much further away than 10 parsecs).
Example The Sun appears to us with apparent magnitude of -26 (150 million km away). Alpha Centauri appears with apparent magnitude of 0.02 (4 light years away). If we were to put them both at the fixed distance of 33 light years away, both Alpha Centauri and the Sun would have an absolute magnitude of 4.5 (the same brightness). What you need Access to the Internet What to do
1. Explain the difference between apparent magnitude and absolute magnitude. 2. Compare the apparent and absolute magnitude of stars like Sirius,
Alpha Centauri, the Sun, Antares, Rigel. 3. Go to the website: http://antwrp.gsfc.nasa.gov/apod/ap060501.html
This is a photograph of the Open Cluster NGC 290 or the Stellar Jewel Box. a) What might make some of these stars appear brighter than others? b) Why are some of these stars different colours? c) Now go to: http://antwrp.gsfc.nasa.gov/apod/ap060419.html Mars appears much bigger and brighter than the stars. Why?
4. With the use of a number of torches with different brightness and a darkened room, design an experiment for young children aged 10-12 years old to explain the difference between apparent magnitude and absolute magnitude of stars. Include two or three questions that they would need to answer to reinforce their learning.
http://museumvictoria.com.au/Scienceworks/Education/
55
The Stars Student activities 11-20
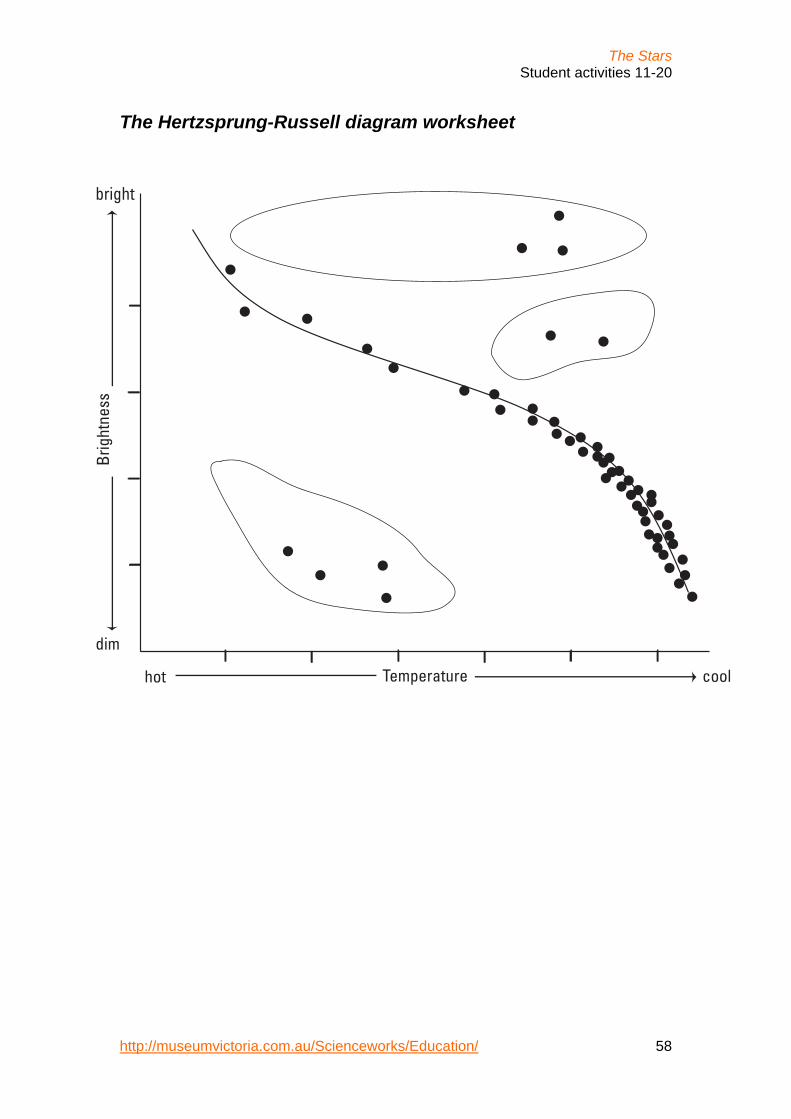
Activity 17: The Hertzsprung-Russell diagram Introduction In about 1910, Ejnar Hertzsprung and Henry Norris Russell independently developed a diagram that was able to summarise the differences between stars by comparing their luminosity, colour and surface temperature. The diagram is called the Hertzsprung-Russell diagram or the H-R diagram. After plotting luminosity and surface temperature of known stars on this diagram, the two astronomers noticed that stars fell into certain groups. White dwarfs formed a group on the bottom left hand side of the diagram. The red supergiants formed a group on the top right hand side of the graph and the red giants covered a region underneath them. Most of the stars were spread along a rough diagonal line from the top left corner to the bottom right corner. These stars were given the name ‘main sequence’ because of their position on the graph. The Sun is a member of the main sequence group and lies close to the middle of the sequence. The H-R diagram showed a clear life cycle for stars. The relatively small number of blue and red supergiants and white dwarfs reflects the relatively short time that stars remain in these phases compared to the main sequence phase. Note that the colour of a star indicates its surface temperature. When an object (black body) is heated, the colour of the light it emits changes from red to orange to yellow to white. (You can observe this using a dimmer switch and incandescent globe). The following activity will help you become familiar with the H-R diagram. It demonstrates how the diagram can be used to provide information about the life cycle of stars and the characteristics of particular stars. What you need
• Copy of H-R diagram worksheet • Glue • Coloured pencils • Scissors • Pen
What to do
1. Study the notes and Hertzsprung-Russell diagram overleaf. 2. Colour-code the different groups of stars shown on your H-R diagram
worksheet. 3. Draw a colour-code key at the bottom of the worksheet to indicate the type of
stars that each colour represents. 4. What types of stars are Antares, Betelgeuse, Capella, Sirius,
Proxima Centauri, Rigel, the Sun, Formalhaut and Spica? On your worksheet, indicate the location of these stars (with their names) in the correct groups.
5. Cut out the diagram and the colour-code key and glue them into your books. 6. Copy and answer the following questions in your book.
http://museumvictoria.com.au/Scienceworks/Education/
56

The Stars Student activities 11-20
Questions 1. What does the H-R diagram tell you about the differences between:
a) supergiants (like the stars Deneb and Betelgeuse) and white dwarfs (like the star Sirius B)? b) red giants (like Betelgeuse and Antares) and our Sun? c) blue supergiants (like Rigel and Deneb) and red giants (like Aldebaran and Mira)? d) red dwarfs (like Proxima Cen) and white dwarfs (like Sirius B)?
2. Why did astronomers conclude that the H-R diagram showed a relationship between the brightness and surface temperature of stars?
3. Why do 90 percent of stars fall into the main sequence group? 4. On your H-R diagram, draw arrows to show the path the Sun would take in its
life cycle from where it is now to the end of its life. You may need to do some research to answer this question.
http://museumvictoria.com.au/Scienceworks/Education/
57
The Stars Student activities 11-20
The Hertzsprung-Russell diagram worksheet
http://museumvictoria.com.au/Scienceworks/Education/
58
The Stars Student activities 11-20
Background information for Activities 18, 19 and 20 The Big Bang theory was developed in the early 1900s. It states that about 15 billion years ago an explosion caused the expansion of matter and radiation into space. The explosion was the beginning of space and time as we know it. Seconds after the explosion, energy was converted into particles and anti-particles (i.e. electrons and positrons). Within minutes, traces of hydrogen and helium nuclei were created. Millions of years later, stars and galaxies began to form. The chemical reactions in stars created all the other elements found in the Universe today. Technology now exists to look at the sky by focussing on forms of radiation other than light. As a result we have gained a different perspective and have increased our knowledge of the Universe. Since the sky was first viewed using microwaves in 1965, it has been found that the Universe is filled with microwave radiation. This is now known to be traces of radiation coming from the remnants of the Big Bang. The energy of the Big Bang has been red shifted into microwaves because the Universe is expanding. This light is seen today as the Cosmic Microwave Background Radiation (CMBR) - the ‘afterglow’ of the Big Bang. The Big Bang theory is based on the General Theory of Relativity, the theory of gravity developed by Albert Einstein. The major observations that support the Big Bang theory are the expansion of the Universe (first seen by Edwin Hubble in the 1920s), the abundance of the different chemical elements seen in the Universe and the detection of the CMBR. The name ‘Big Bang’ is a little misleading as it suggests that there was a huge explosion in space. Instead, it is better to think of the Big Bang as an expansion. The name ‘Big Bang’ was invented by astronomer Fred Hoyle who was trying to ridicule the theory, but it was so catchy that it stuck.
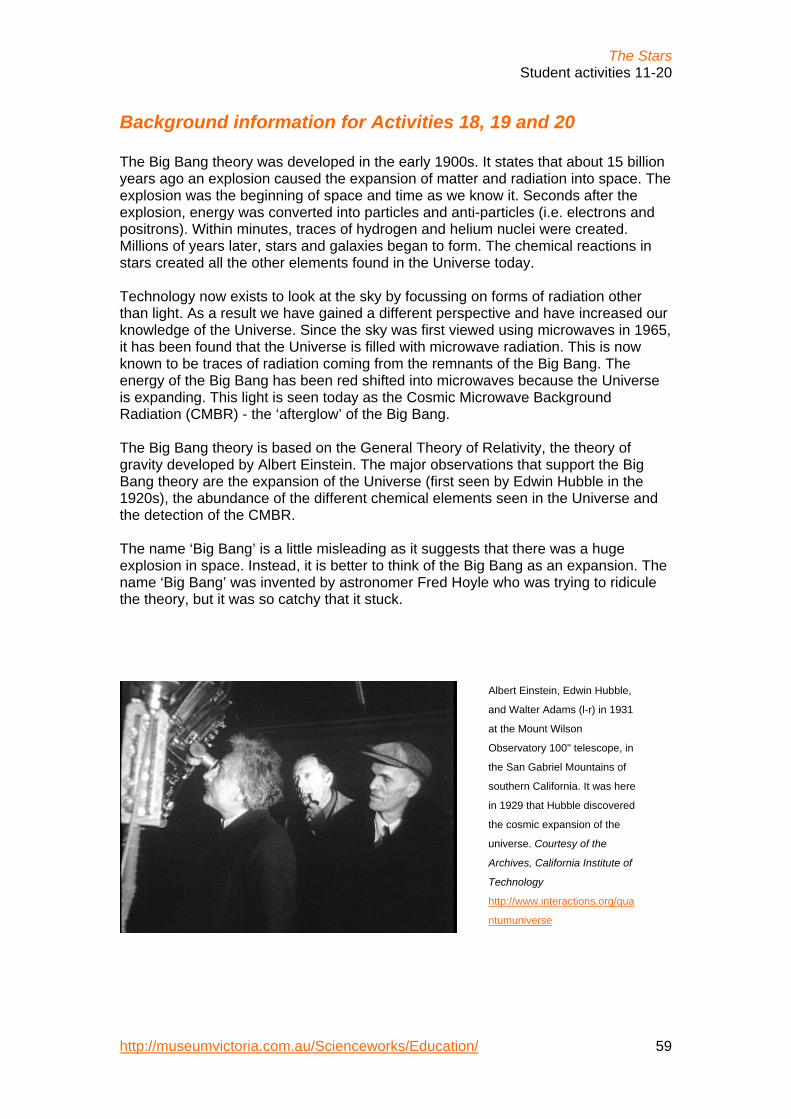
Albert Einstein, Edwin Hubble,
and Walter Adams (l-r) in 1931
at the Mount Wilson
Observatory 100" telescope, in
the San Gabriel Mountains of
southern California. It was here
in 1929 that Hubble discovered
the cosmic expansion of the
universe. Courtesy of the
Archives, California Institute of
Technology
http://www.interactions.org/qua
ntumuniverse
http://museumvictoria.com.au/Scienceworks/Education/
59
The Stars Student activities 11-20
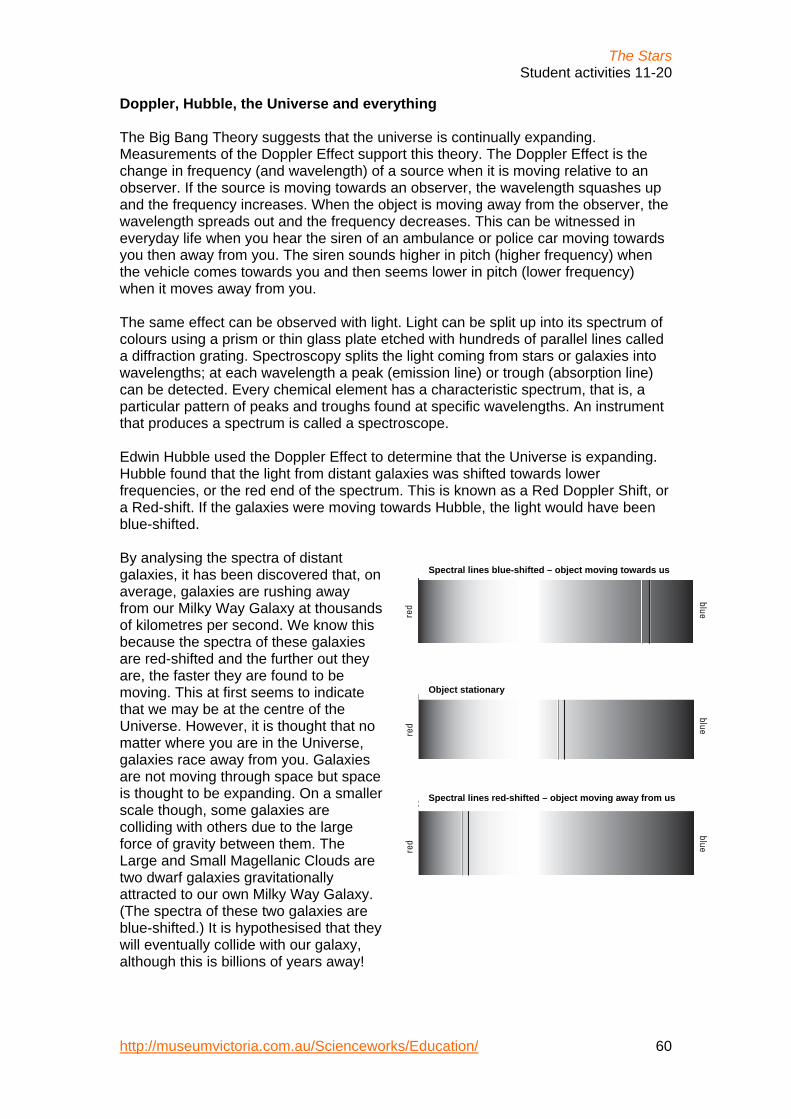
Doppler, Hubble, the Universe and everything The Big Bang Theory suggests that the universe is continually expanding. Measurements of the Doppler Effect support this theory. The Doppler Effect is the change in frequency (and wavelength) of a source when it is moving relative to an observer. If the source is moving towards an observer, the wavelength squashes up and the frequency increases. When the object is moving away from the observer, the wavelength spreads out and the frequency decreases. This can be witnessed in everyday life when you hear the siren of an ambulance or police car moving towards you then away from you. The siren sounds higher in pitch (higher frequency) when the vehicle comes towards you and then seems lower in pitch (lower frequency) when it moves away from you. The same effect can be observed with light. Light can be split up into its spectrum of colours using a prism or thin glass plate etched with hundreds of parallel lines called a diffraction grating. Spectroscopy splits the light coming from stars or galaxies into wavelengths; at each wavelength a peak (emission line) or trough (absorption line) can be detected. Every chemical element has a characteristic spectrum, that is, a particular pattern of peaks and troughs found at specific wavelengths. An instrument that produces a spectrum is called a spectroscope. Edwin Hubble used the Doppler Effect to determine that the Universe is expanding. Hubble found that the light from distant galaxies was shifted towards lower frequencies, or the red end of the spectrum. This is known as a Red Doppler Shift, or a Red-shift. If the galaxies were moving towards Hubble, the light would have been blue-shifted. By analysing the spectra of distant galaxies, it has been discovered that, on average, galaxies are rushing away from our Milky Way Galaxy at thousands of kilometres per second. We know this because the spectra of these galaxies are red-shifted and the further out they are, the faster they are found to be moving. This at first seems to indicate that we may be at the centre of the Universe. However, it is thought that no matter where you are in the Universe, galaxies race away from you. Galaxies are not moving through space but space is thought to be expanding. On a smaller scale though, some galaxies are colliding with others due to the large force of gravity between them. The Large and Small Magellanic Clouds are two dwarf galaxies gravitationally attracted to our own Milky Way Galaxy. (The spectra of these two galaxies are blue-shifted.) It is hypothesised that they will eventually collide with our galaxy, although this is billions of years away!
Spectral lines blue-shifted – object moving towards us
Object stationary
Spectral lines red-shifted – object moving away from us
http://museumvictoria.com.au/Scienceworks/Education/
60

The Stars Student activities 11-20
Activity 18: The Universe after the Big Bang Introduction A common analogy used to model the Universe is the balloon model. Stickers stuck on the surface of a balloon represent galaxies in our Universe and the balloon itself represents space. When the balloon is blown up, it simulates how space between the galaxies is thought to be expanding. (Note that the galaxies are not all on the outside of the Universe as the balloon analogy suggests.) What you need
• Black or white balloon • White or coloured circular stickers • Black felt pen • String • Ruler
What to do
1 Draw and label galaxies of different shapes and sizes on separate stickers. 2 Blow up the balloon to a diameter of about 22cm, and stick the galaxy stickers
all over the balloon. 3 Shrink the balloon to about 10cm. 4 Use the string and ruler to measure the distances between the labelled
galaxies. 5 Blow the balloon up fully to demonstrate how space is thought to be
expanding. Measure the new distances between the galaxies. Tabulate your results for easy comparison.
http://museumvictoria.com.au/Scienceworks/Education/
61
The Stars Student activities 11-20
Activity 19: Simulating the Big Bang using ICT Introduction The previous activity used a very simplistic model to illustrate the Big Bang theory. Today’s technology allows us to use far more sophisticated models simply by accessing the Internet. What you need Access to the Internet What to do Use a suitable search engine to find a Big Bang simulation. Keep in mind that a simulation should make the concept easier for you to understand. Share your results with the class and decide which of the simulations is most appropriate for your level of understanding.
Some sites to get you started:
http://users.telenet.be/nicvroom/progrm18.htm
http://faculty.washington.edu/jcramer/BBSound.html
http://www.meta-library.net/media/bbang-body.html
http://news.bbc.co.uk/1/hi/sci/tech/4600981.stm
http://www.allaboutscience.org/big-bang-theory-video.htm
http://hubblesite.org/education_and_museums/
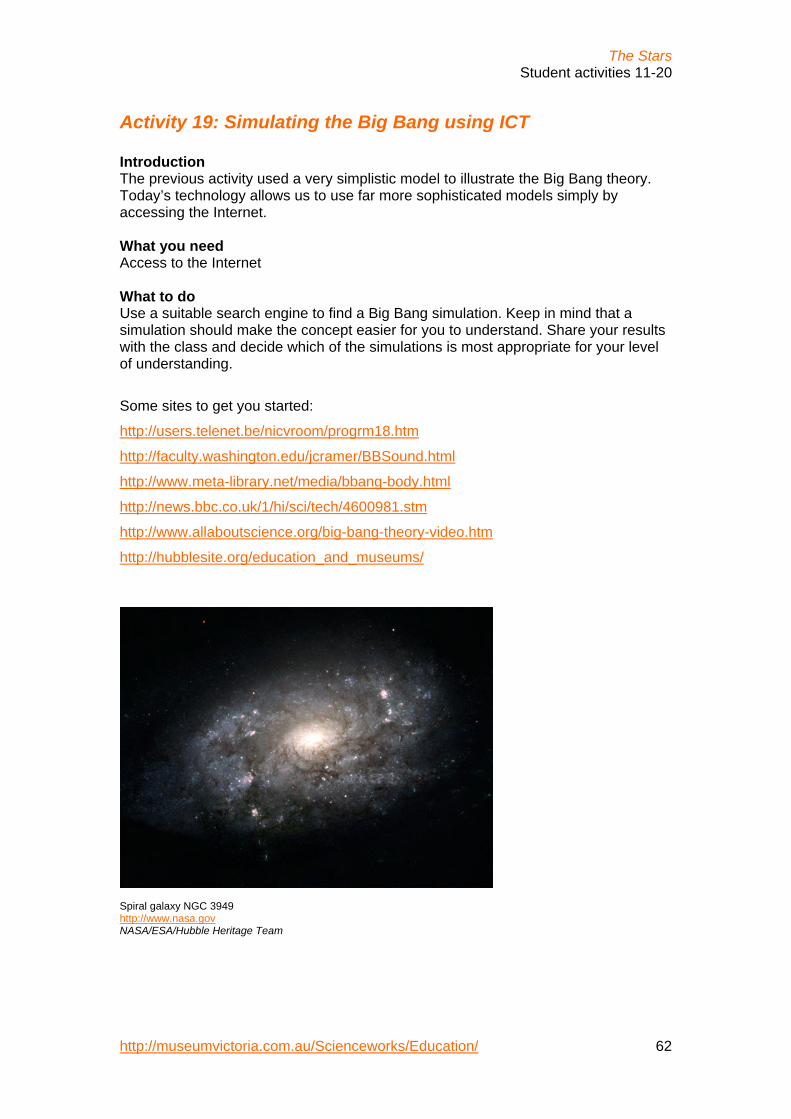
Spiral galaxy NGC 3949 http://www.nasa.gov NASA/ESA/Hubble Heritage Team
http://museumvictoria.com.au/Scienceworks/Education/
62
The Stars Student activities 11-20
Activity 20: Big Bang or ...? Introduction The following activity allows students to investigate and compare different theories about the beginning of the Universe. What you need
• Research facilities and resources (Internet of library) • Recording materials
What to do
1. Form groups of four or five students. 2. Each group chooses and researches information about one of the theories
that describe the beginning of the Universe. Each group should have a different theory.
3. As a group, research the evidence that supports your theory. 4. Present the case for the validity of your theory to the class. This could be
done in character to reflect your theory. 5. The class should then vote on which theory was best supported and best
presented. You might like to agree on the assessment criteria you could use to judge each group.
Some websites to get you started (search ‘Cosmology’):
• American Institute of Physics: http://www.aip.org/
• British Institute of Physics:
http://www.iop.org/ • AllAboutScience.org:
http://www.big-bang-theory.com/ • CALResCo:
http://www.calresco.org/cosmic.htm
Some theories to examine: • Steady State
• Big Bang
• Quasi-Steady State
• Cosmic Inflation
• Religious Cosmology
• Metaphysical Cosmology
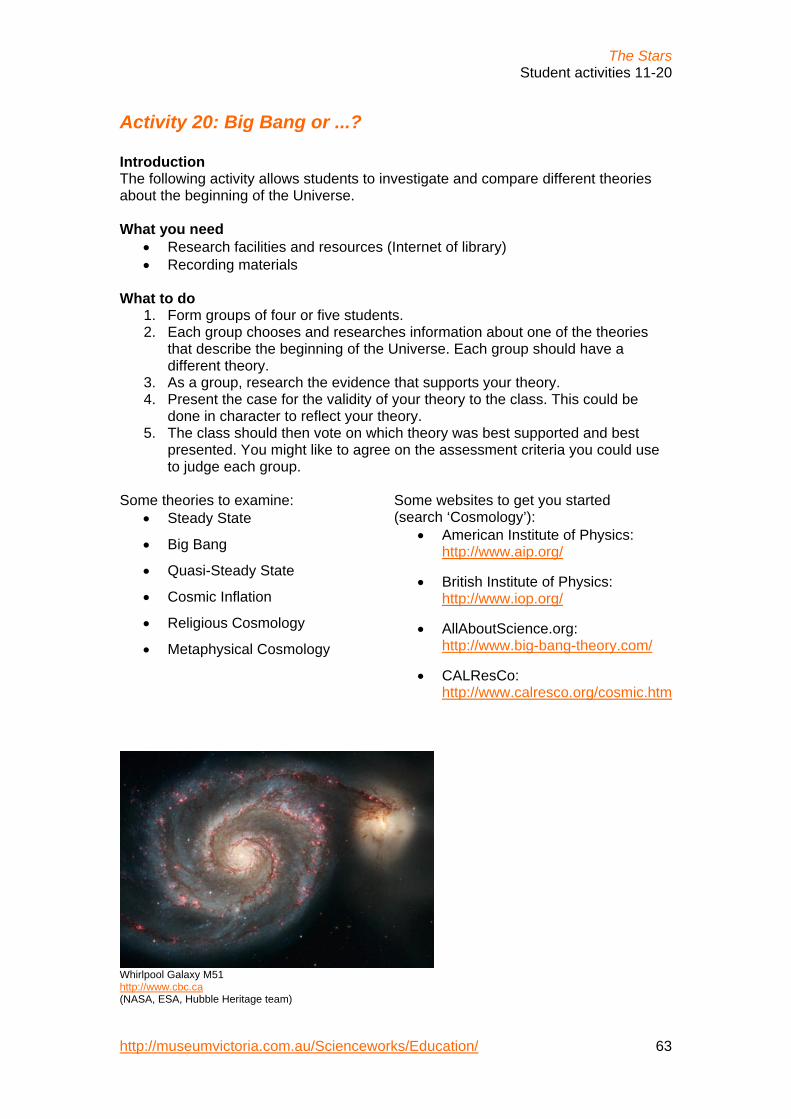
Whirlpool Galaxy M51 http://www.cbc.ca (NASA, ESA, Hubble Heritage team)
http://museumvictoria.com.au/Scienceworks/Education/
63