Embed Size (px)
Citation preview

Matt Schroeder and Todd Graham
Metropolitan Council (Twin Cities)
ACS Data Users Group
ACS Data in Population
Estimates and Forecasts:
Practical Considerations and
Extensions
May 12, 2017

2
Estimates overviewHow many
housing units?
How many
households?
How many
people?
Housing units
in 2010
Occupancy
rate
Average
household
size
(Persons per
household
[PPH] )
Changes to
housing stock
since 2010

3
ACS 2011-2015
ACS 2015
2016 estimate
Challenge #1: ACS five-year estimates may not reflect current housing
market conditions
Solution: Apply region-wide adjustments to approximate
current housing market conditions
Estimating occupancy rates
4
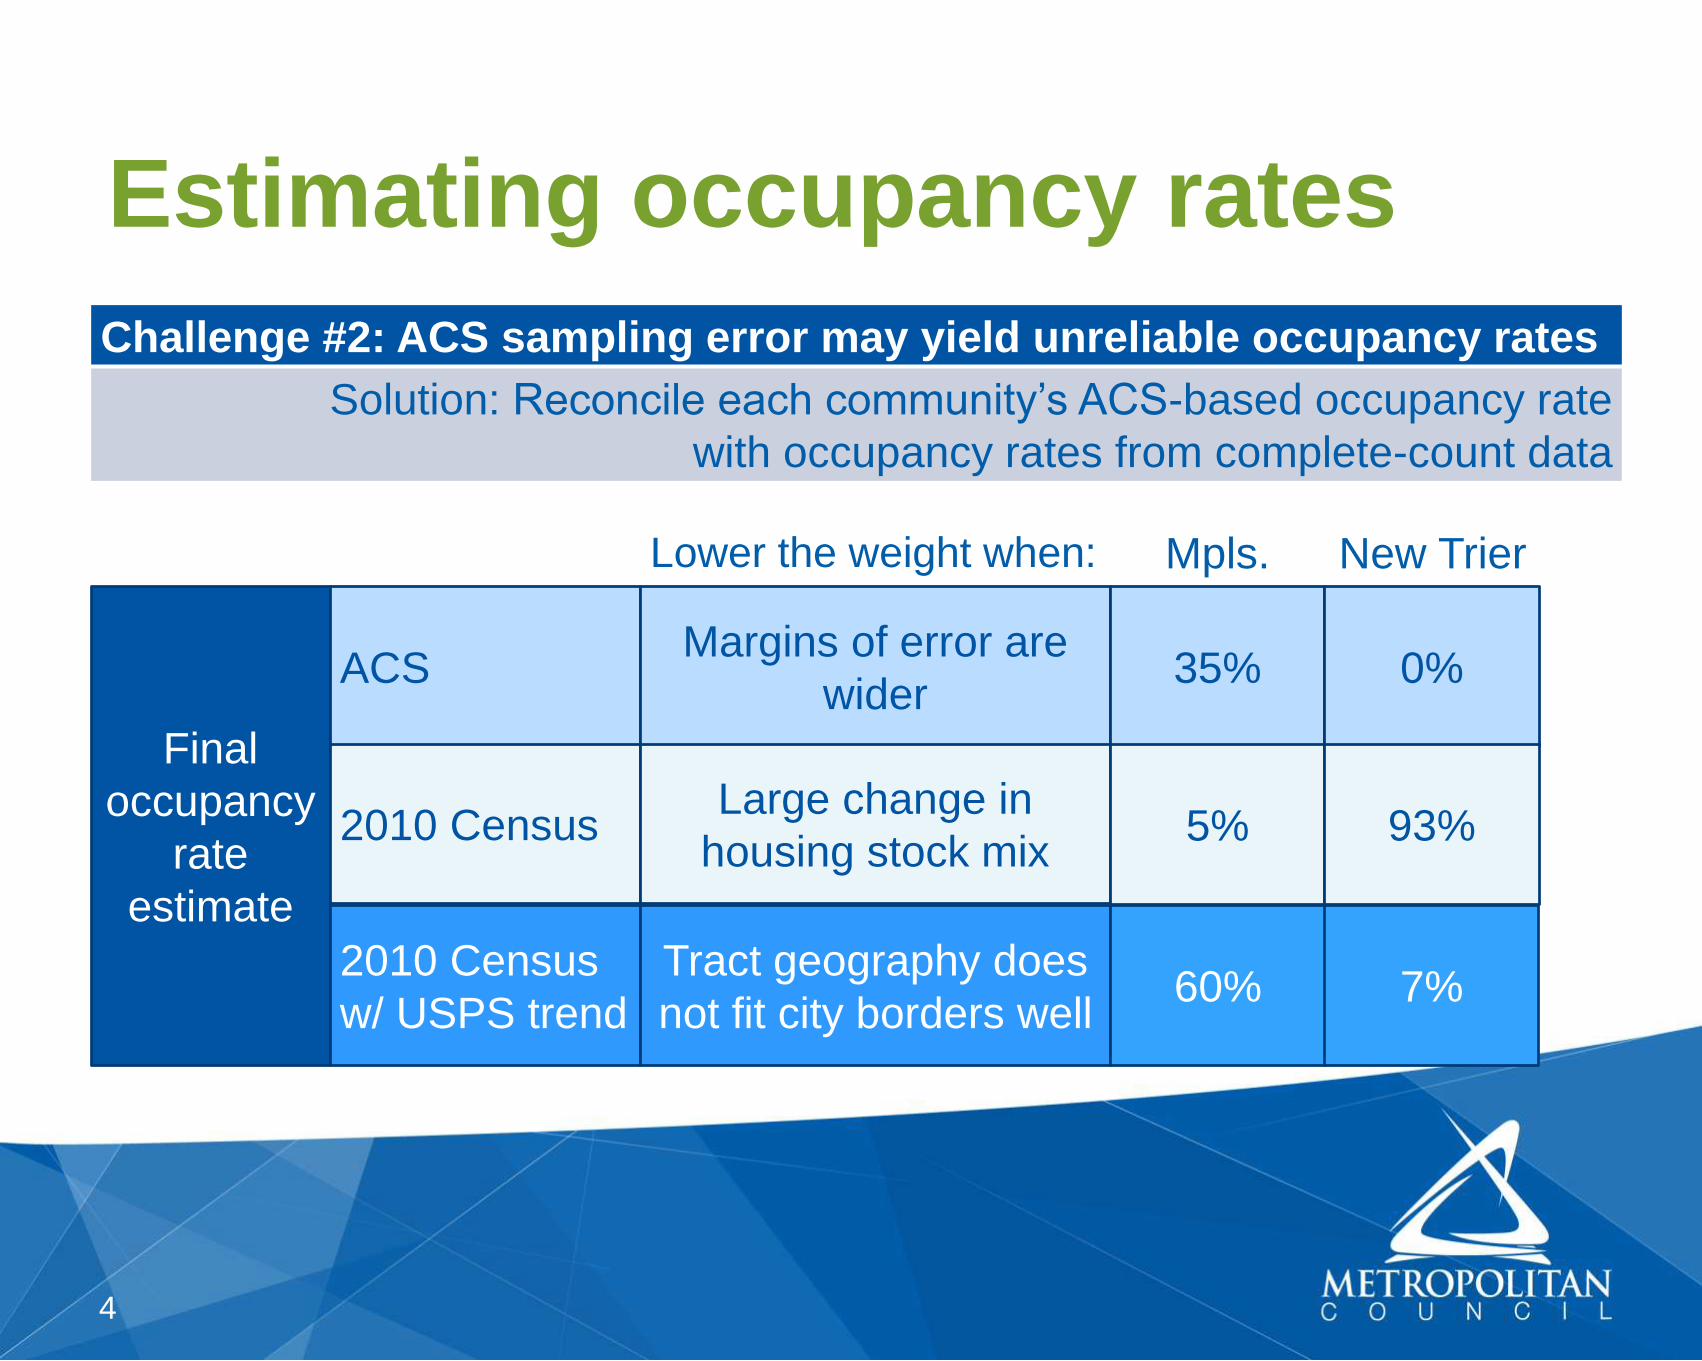
Challenge #2: ACS sampling error may yield unreliable occupancy rates
Solution: Reconcile each community’s ACS-based occupancy rate
with occupancy rates from complete-count data
Estimating occupancy rates
Final
occupancy
rate
estimate
ACS
2010 Census
2010 Census
w/ USPS trend
Margins of error are
wider
Large change in
housing stock mix
Tract geography does
not fit city borders well
Lower the weight when:
35%
Mpls. New Trier
0%
5% 93%
60% 7%
5
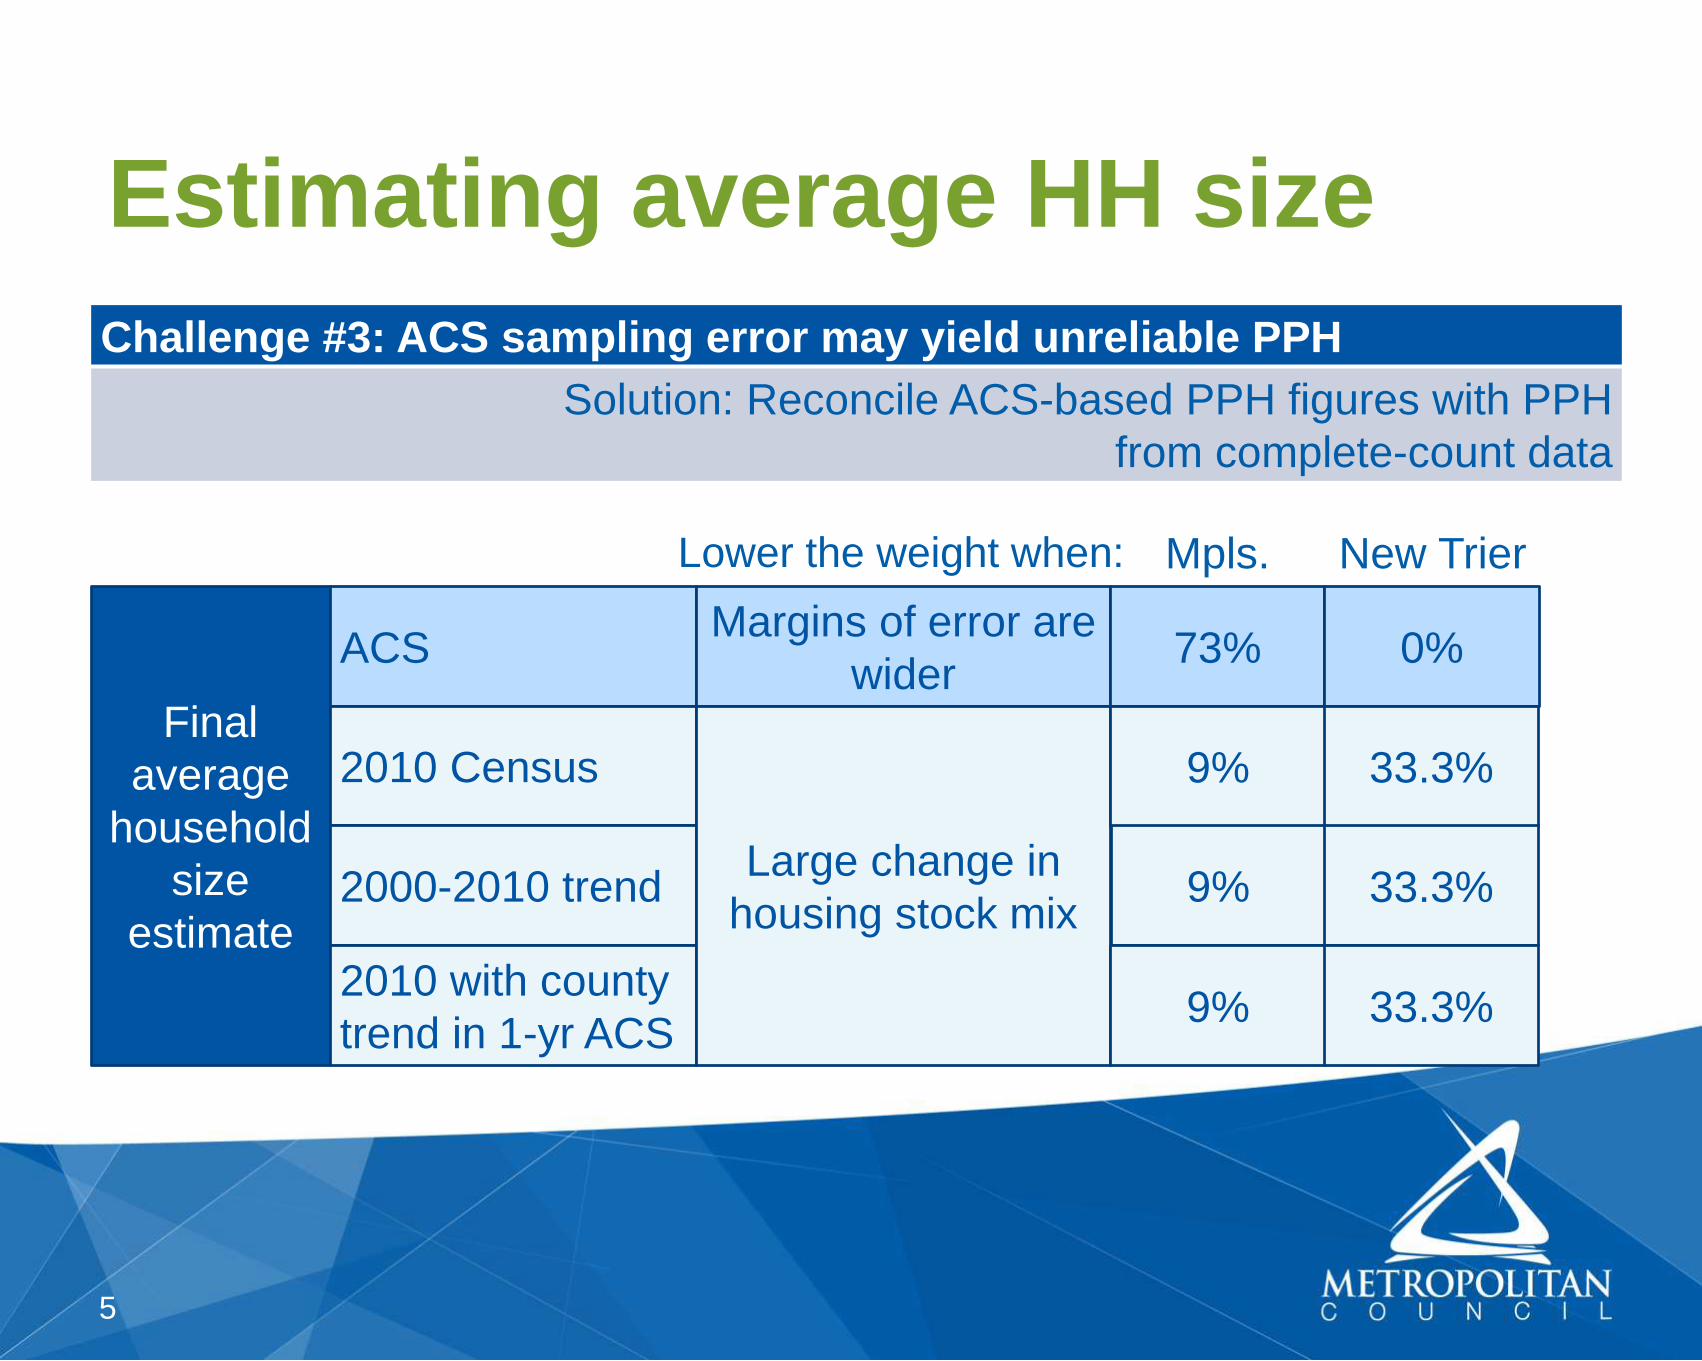
Challenge #3: ACS sampling error may yield unreliable PPH
Solution: Reconcile ACS-based PPH figures with PPH
from complete-count data
Estimating average HH size
Final
average
household
size
estimate
ACS
2010 Census
2000-2010 trend
2010 with county
trend in 1-yr ACS
Margins of error are
wider
Large change in
housing stock mix
Lower the weight when:
73%
Mpls. New Trier
0%
9% 33.3%
9% 33.3%
9% 33.3%
6
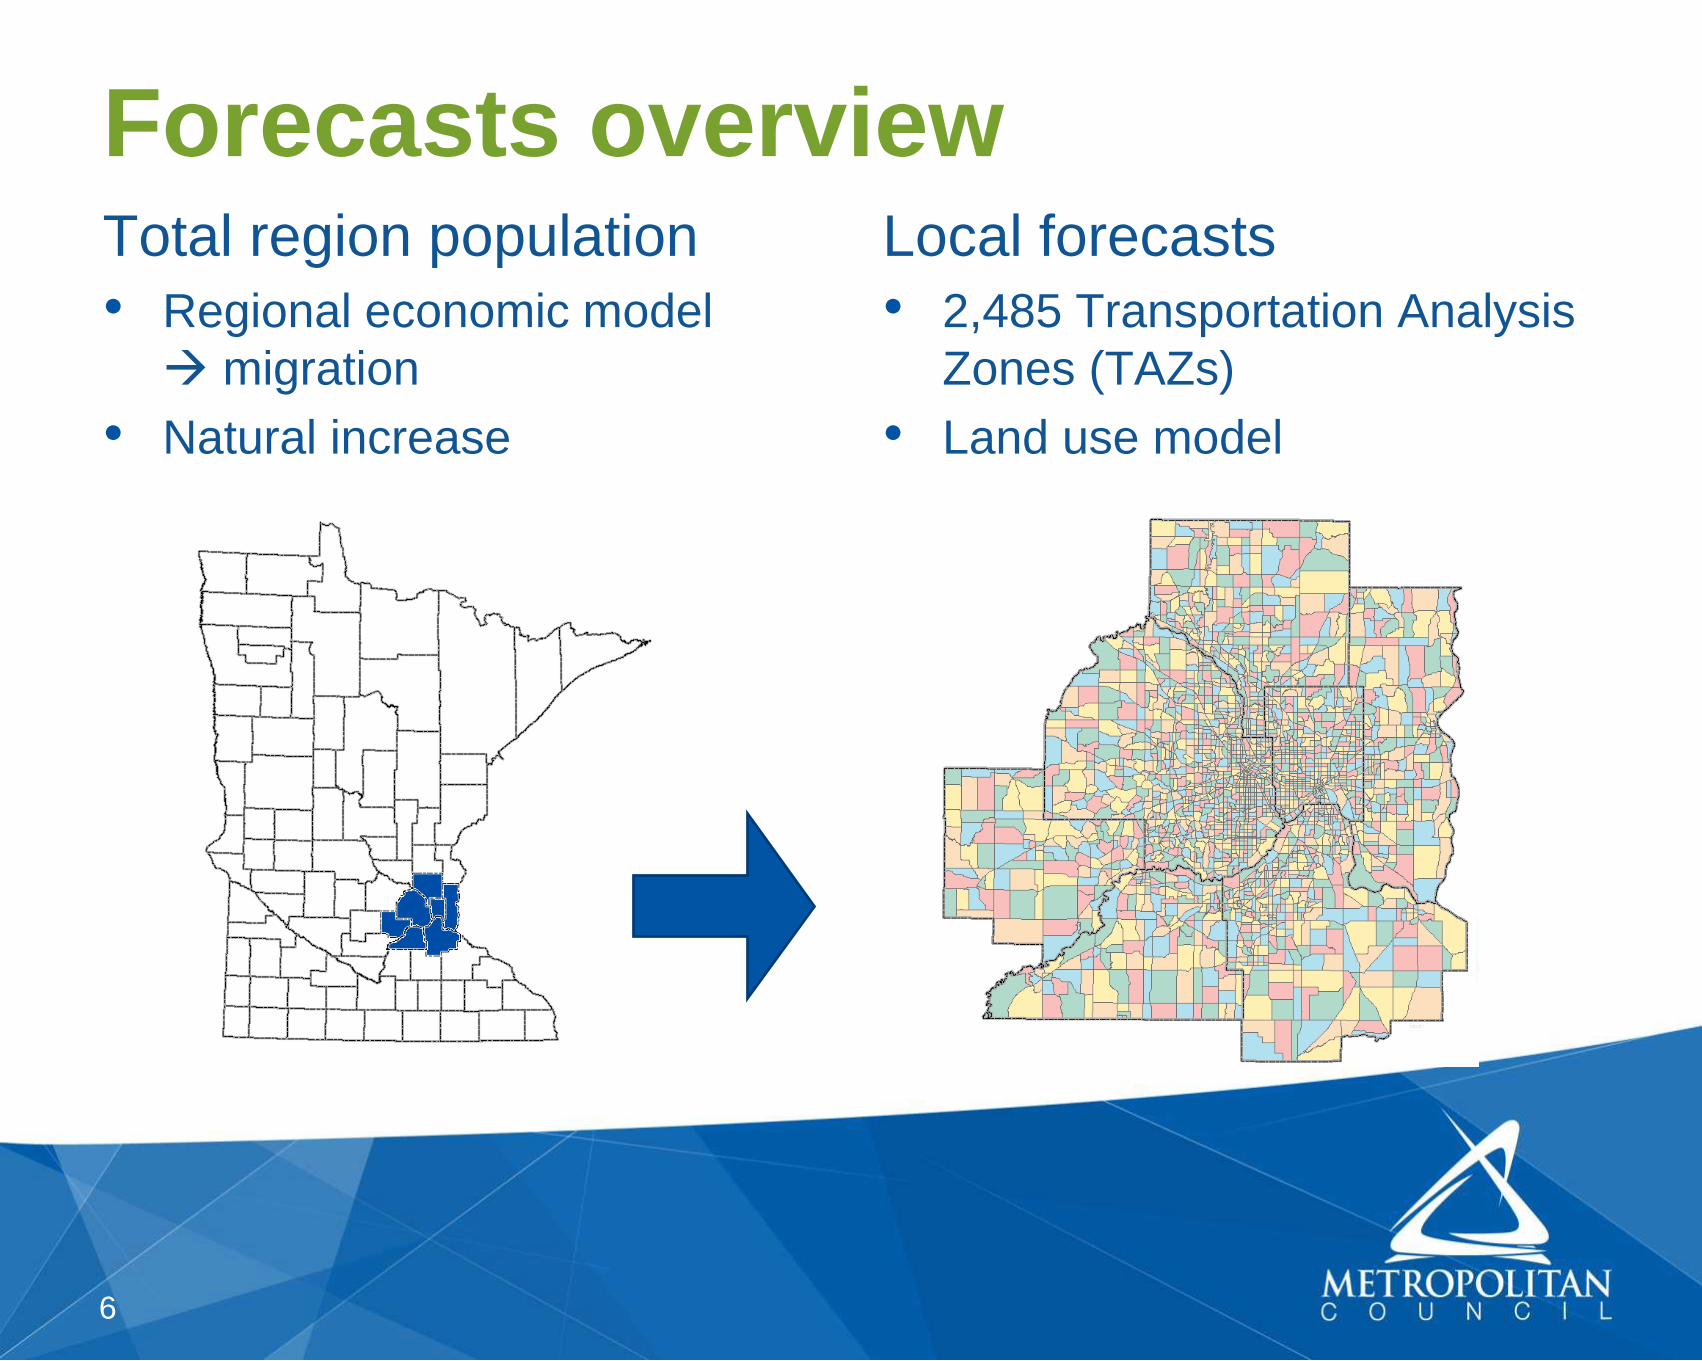
Forecasts overviewTotal region population
• Regional economic model
migration
• Natural increase
Local forecasts
• 2,485 Transportation Analysis
Zones (TAZs)
• Land use model
7
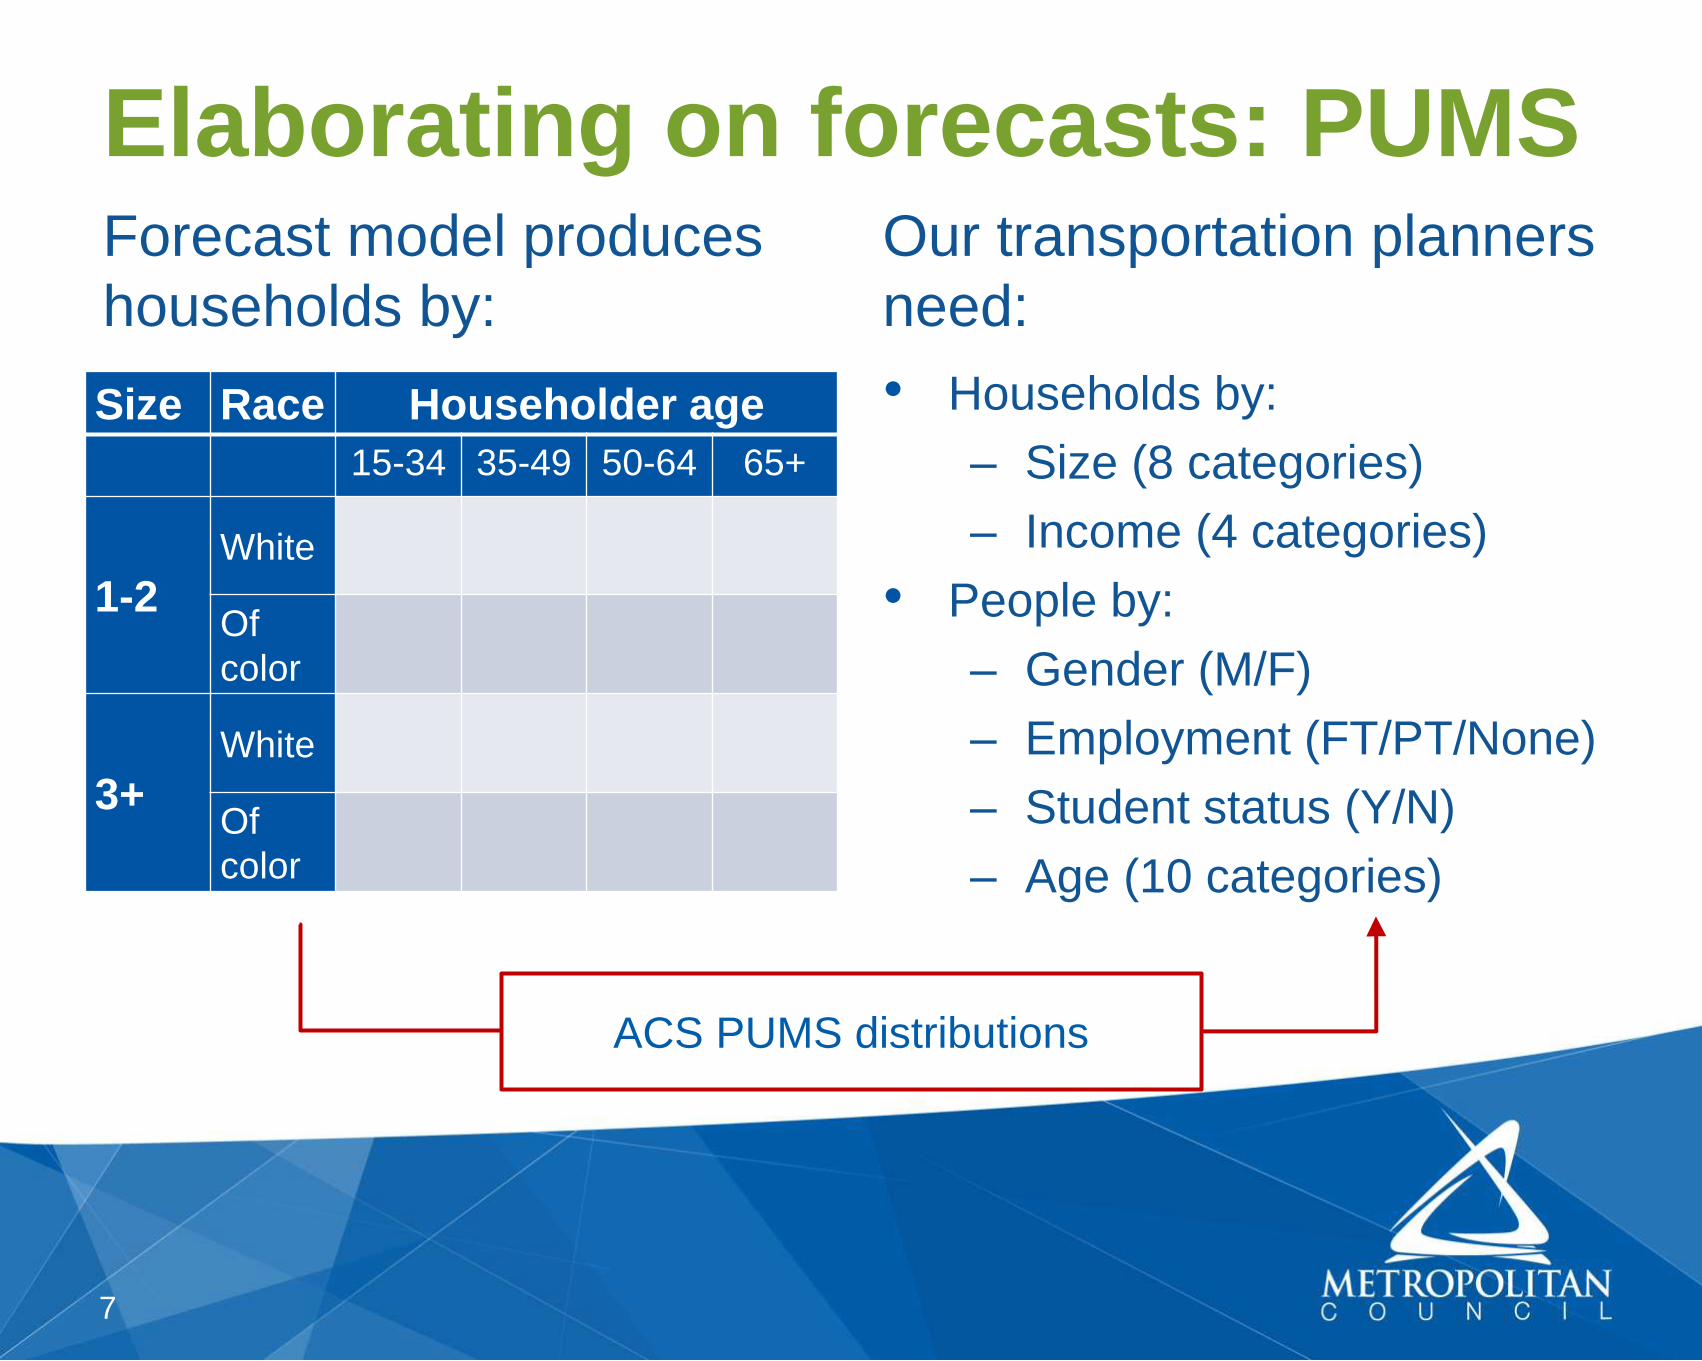
Elaborating on forecasts: PUMSForecast model produces
households by:
Size Race Householder age
15-34 35-49 50-64 65+
1-2
White
Of
color
3+
White
Of
color
Our transportation planners
need:
• Households by:
– Size (8 categories)
– Income (4 categories)
• People by:
– Gender (M/F)
– Employment (FT/PT/None)
– Student status (Y/N)
– Age (10 categories)
ACS PUMS distributions
8
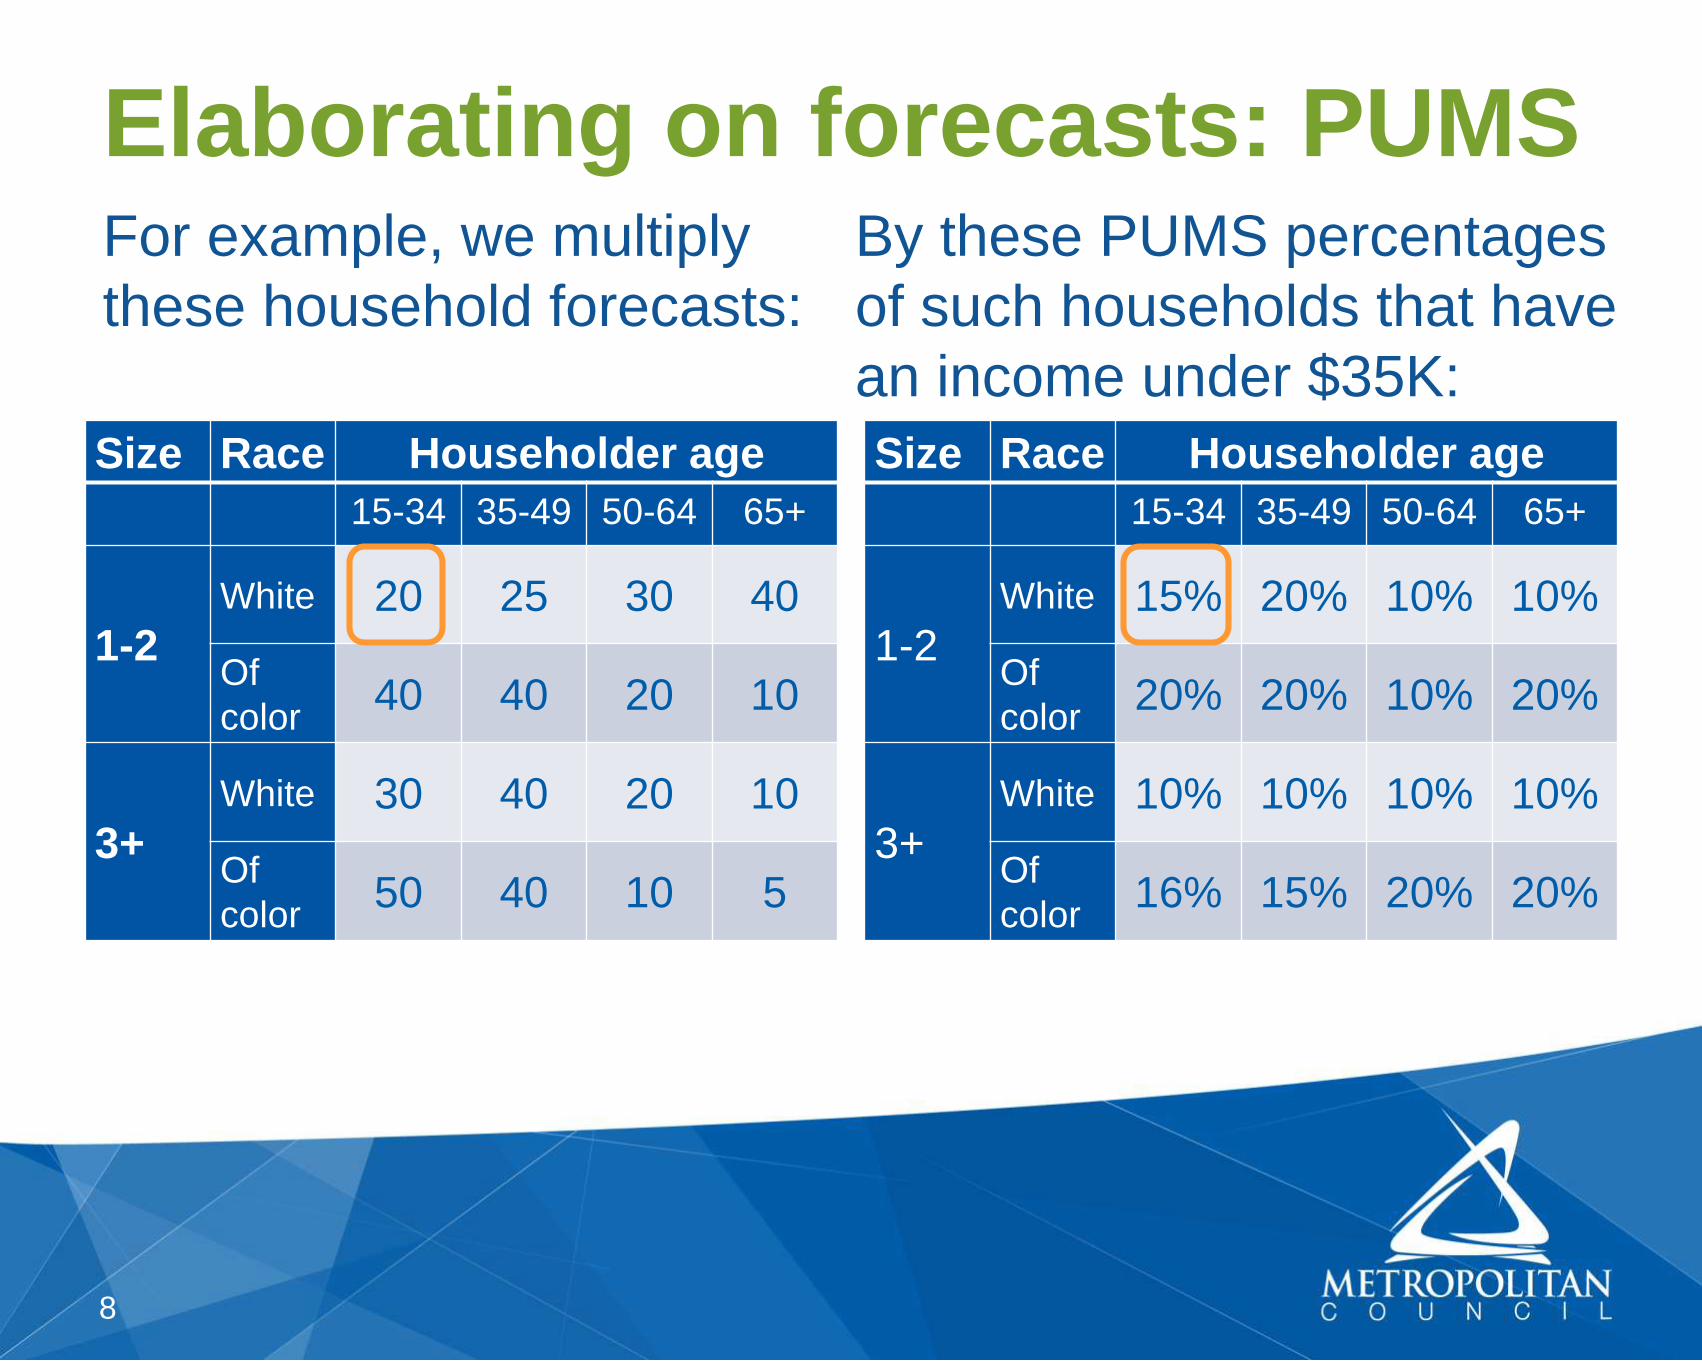
Elaborating on forecasts: PUMSFor example, we multiply
these household forecasts:
Size Race Householder age
15-34 35-49 50-64 65+
1-2
White 20 25 30 40
Of
color40 40 20 10
3+
White 30 40 20 10
Of
color50 40 10 5
By these PUMS percentages
of such households that have
an income under $35K:
Size Race Householder age
15-34 35-49 50-64 65+
1-2
White 15% 20% 10% 10%
Of
color20% 20% 10% 20%
3+
White 10% 10% 10% 10%
Of
color16% 15% 20% 20%

9
Elaborating on forecasts: PUMSAnd get these numbers of
households with income
under $35K:
Size Race Householder age
15-34 35-49 50-64 65+
1-2
White 3 5 3 4
Of
color8 8 2 2
3+
White 3 4 2 1
Of
color8 6 2 1
• 62 total households with
income under $35K in
this TAZ
• Repeat for other income
categories, then all other
characteristics
10
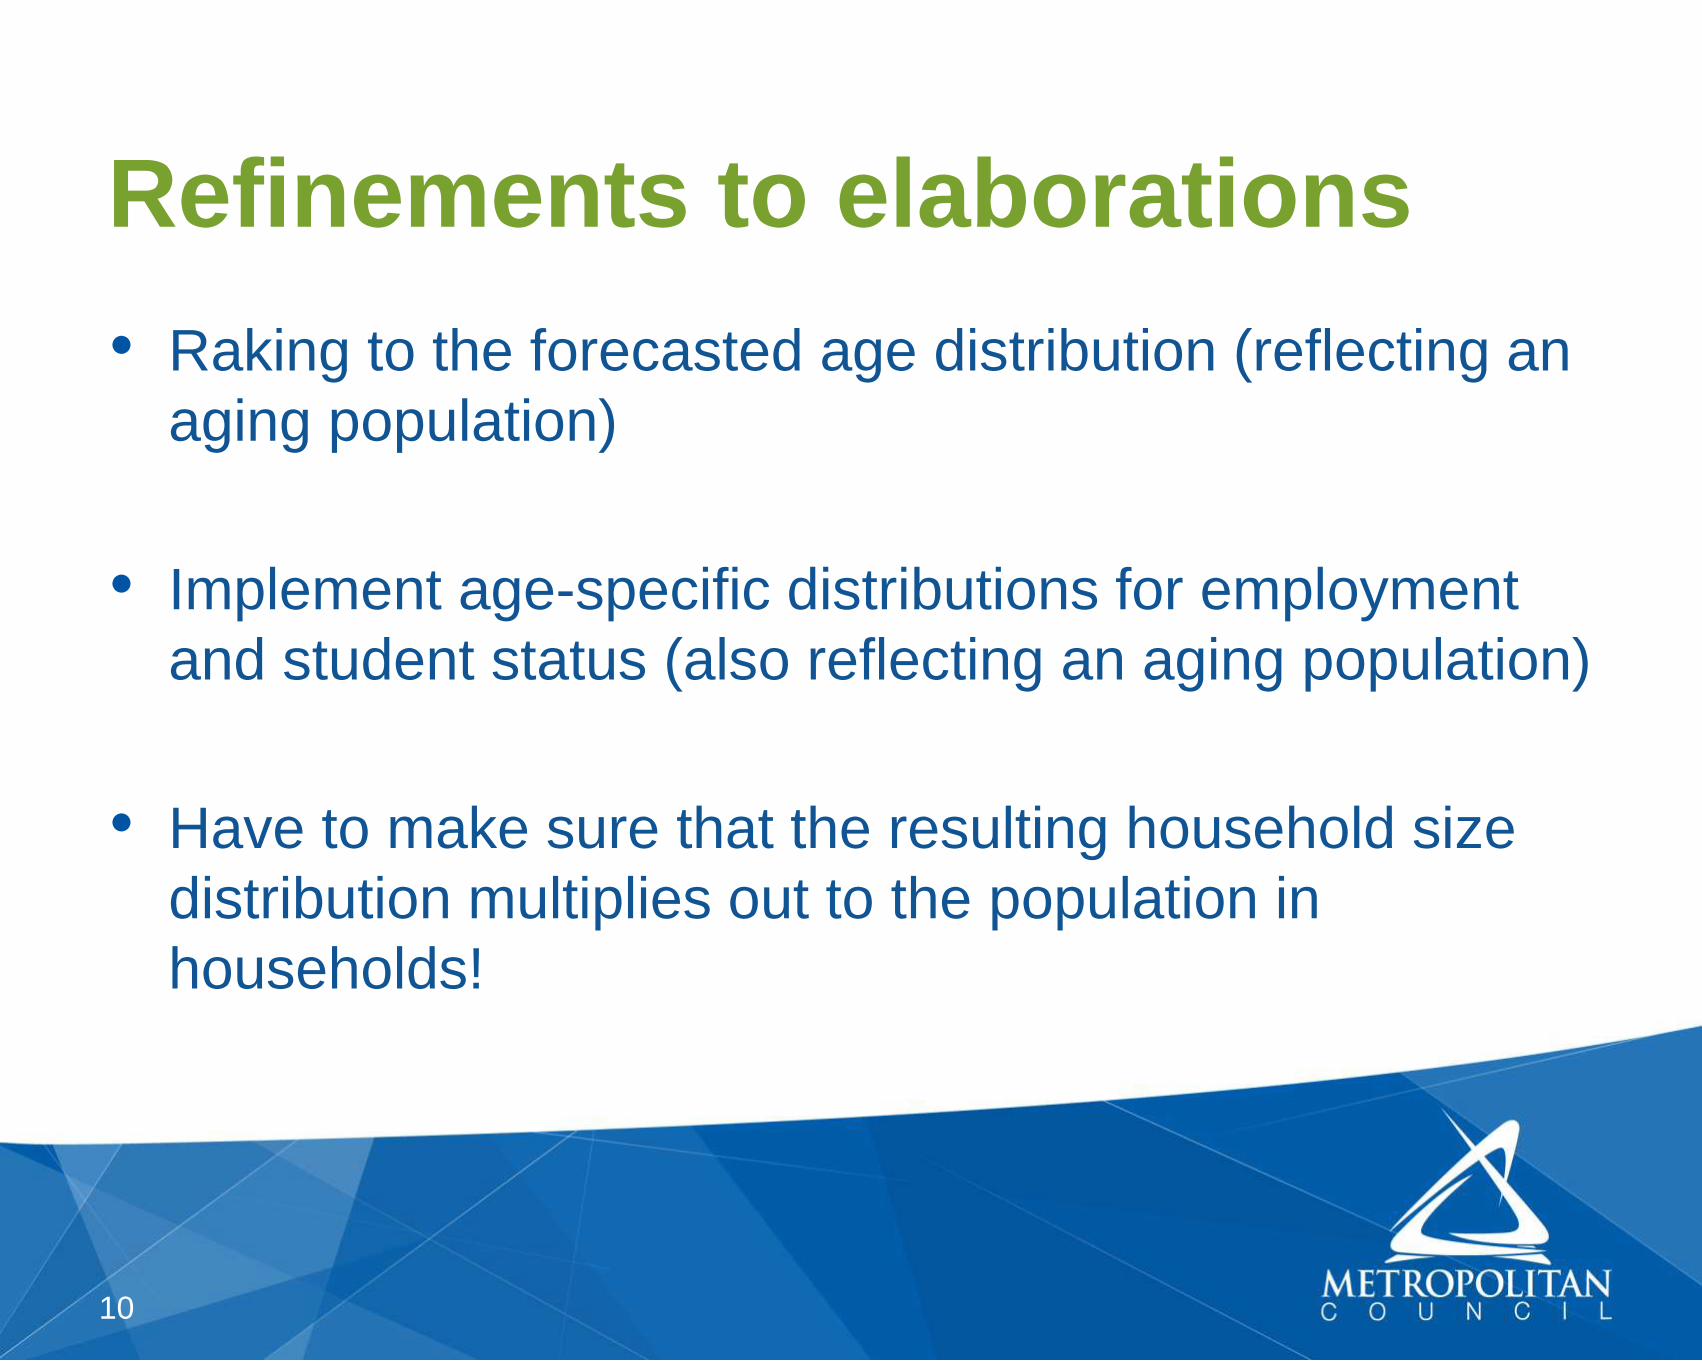
• Raking to the forecasted age distribution (reflecting an
aging population)
• Implement age-specific distributions for employment
and student status (also reflecting an aging population)
• Have to make sure that the resulting household size
distribution multiplies out to the population in
households!
Refinements to elaborations
11
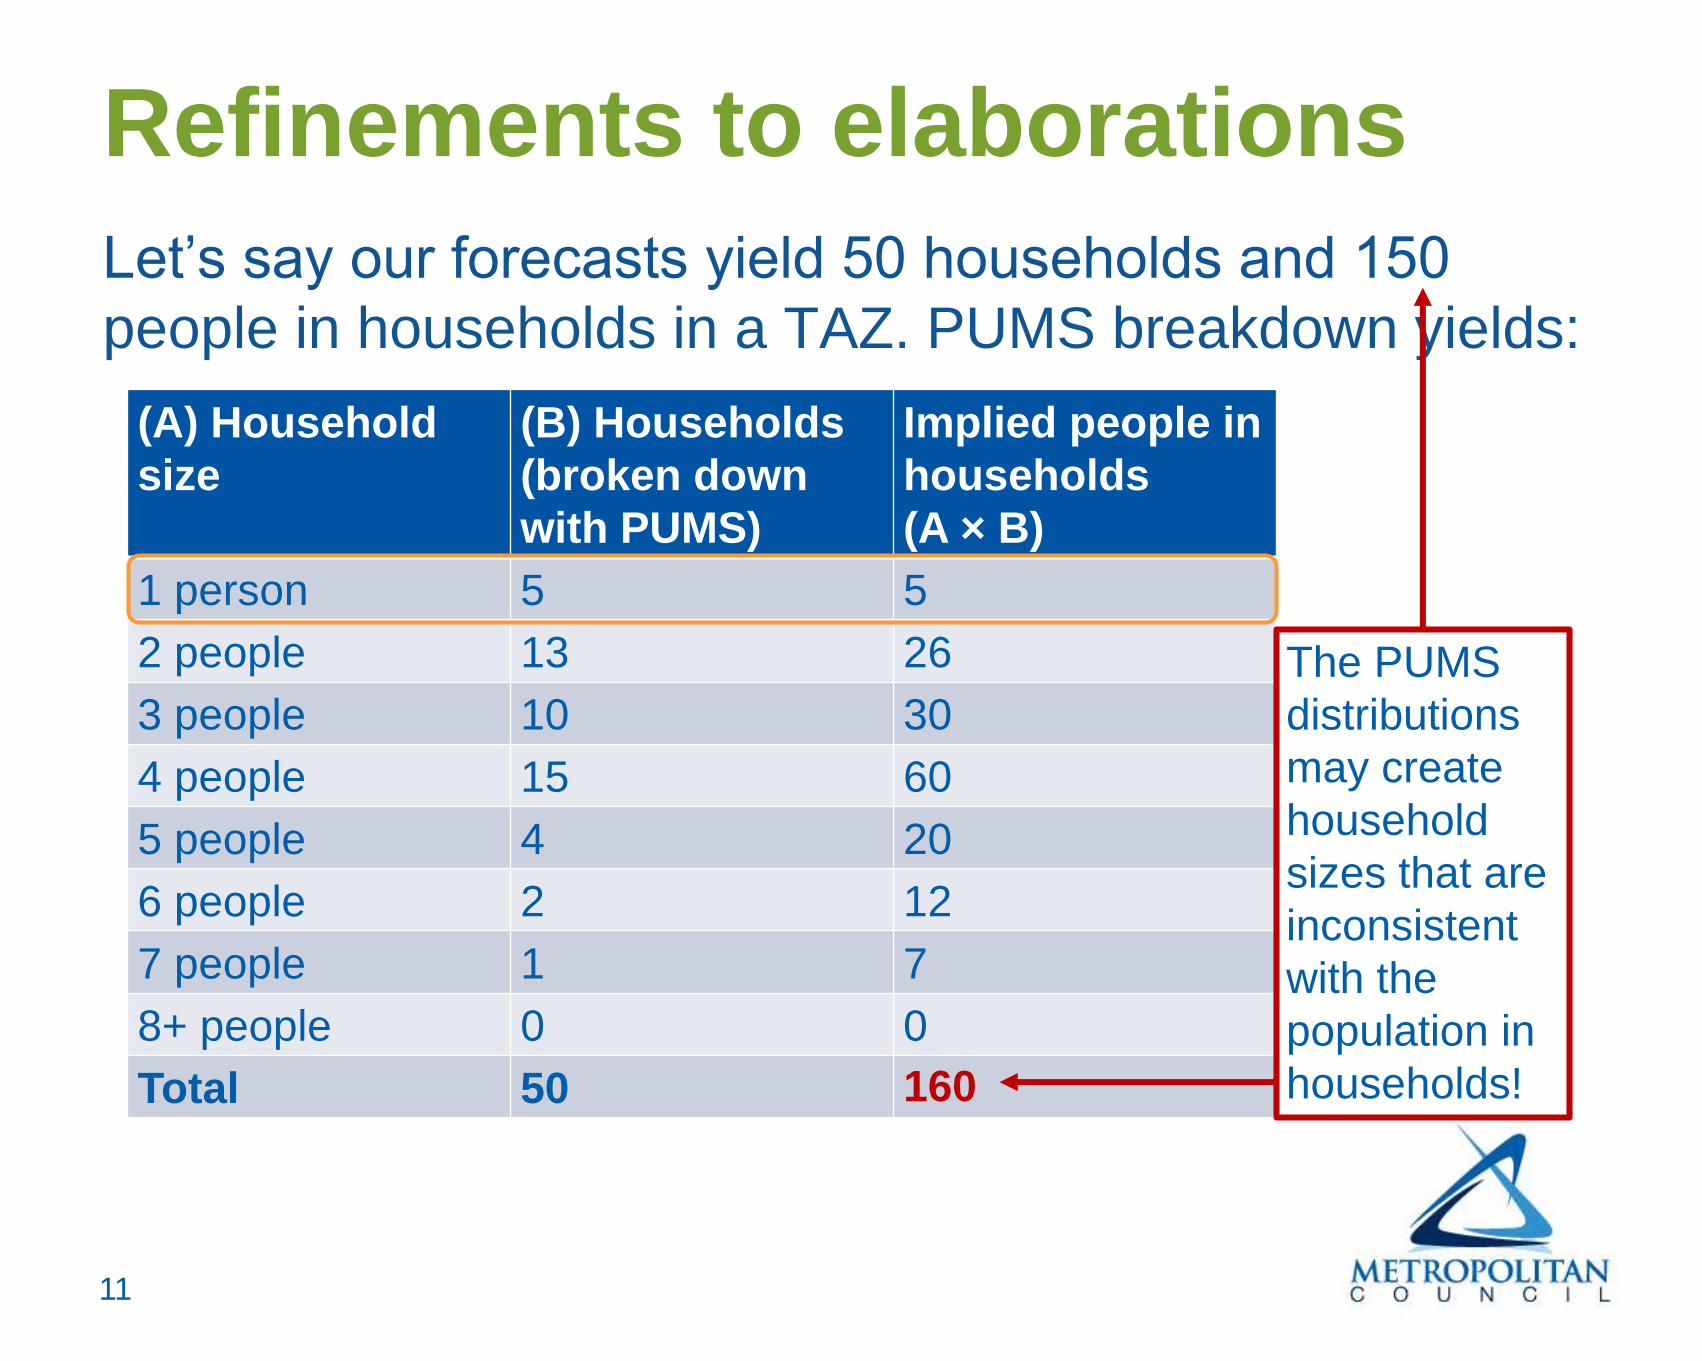
Refinements to elaborations
Let’s say our forecasts yield 50 households and 150
people in households in a TAZ. PUMS breakdown yields:
(A) Household
size
(B) Households
(broken down
with PUMS)
Implied people in
households
(A × B)
1 person 5 5
2 people 13 26
3 people 10 30
4 people 15 60
5 people 4 20
6 people 2 12
7 people 1 7
8+ people 0 0
Total 50
The PUMS
distributions
may create
household
sizes that are
inconsistent
with the
population in
households!160
12
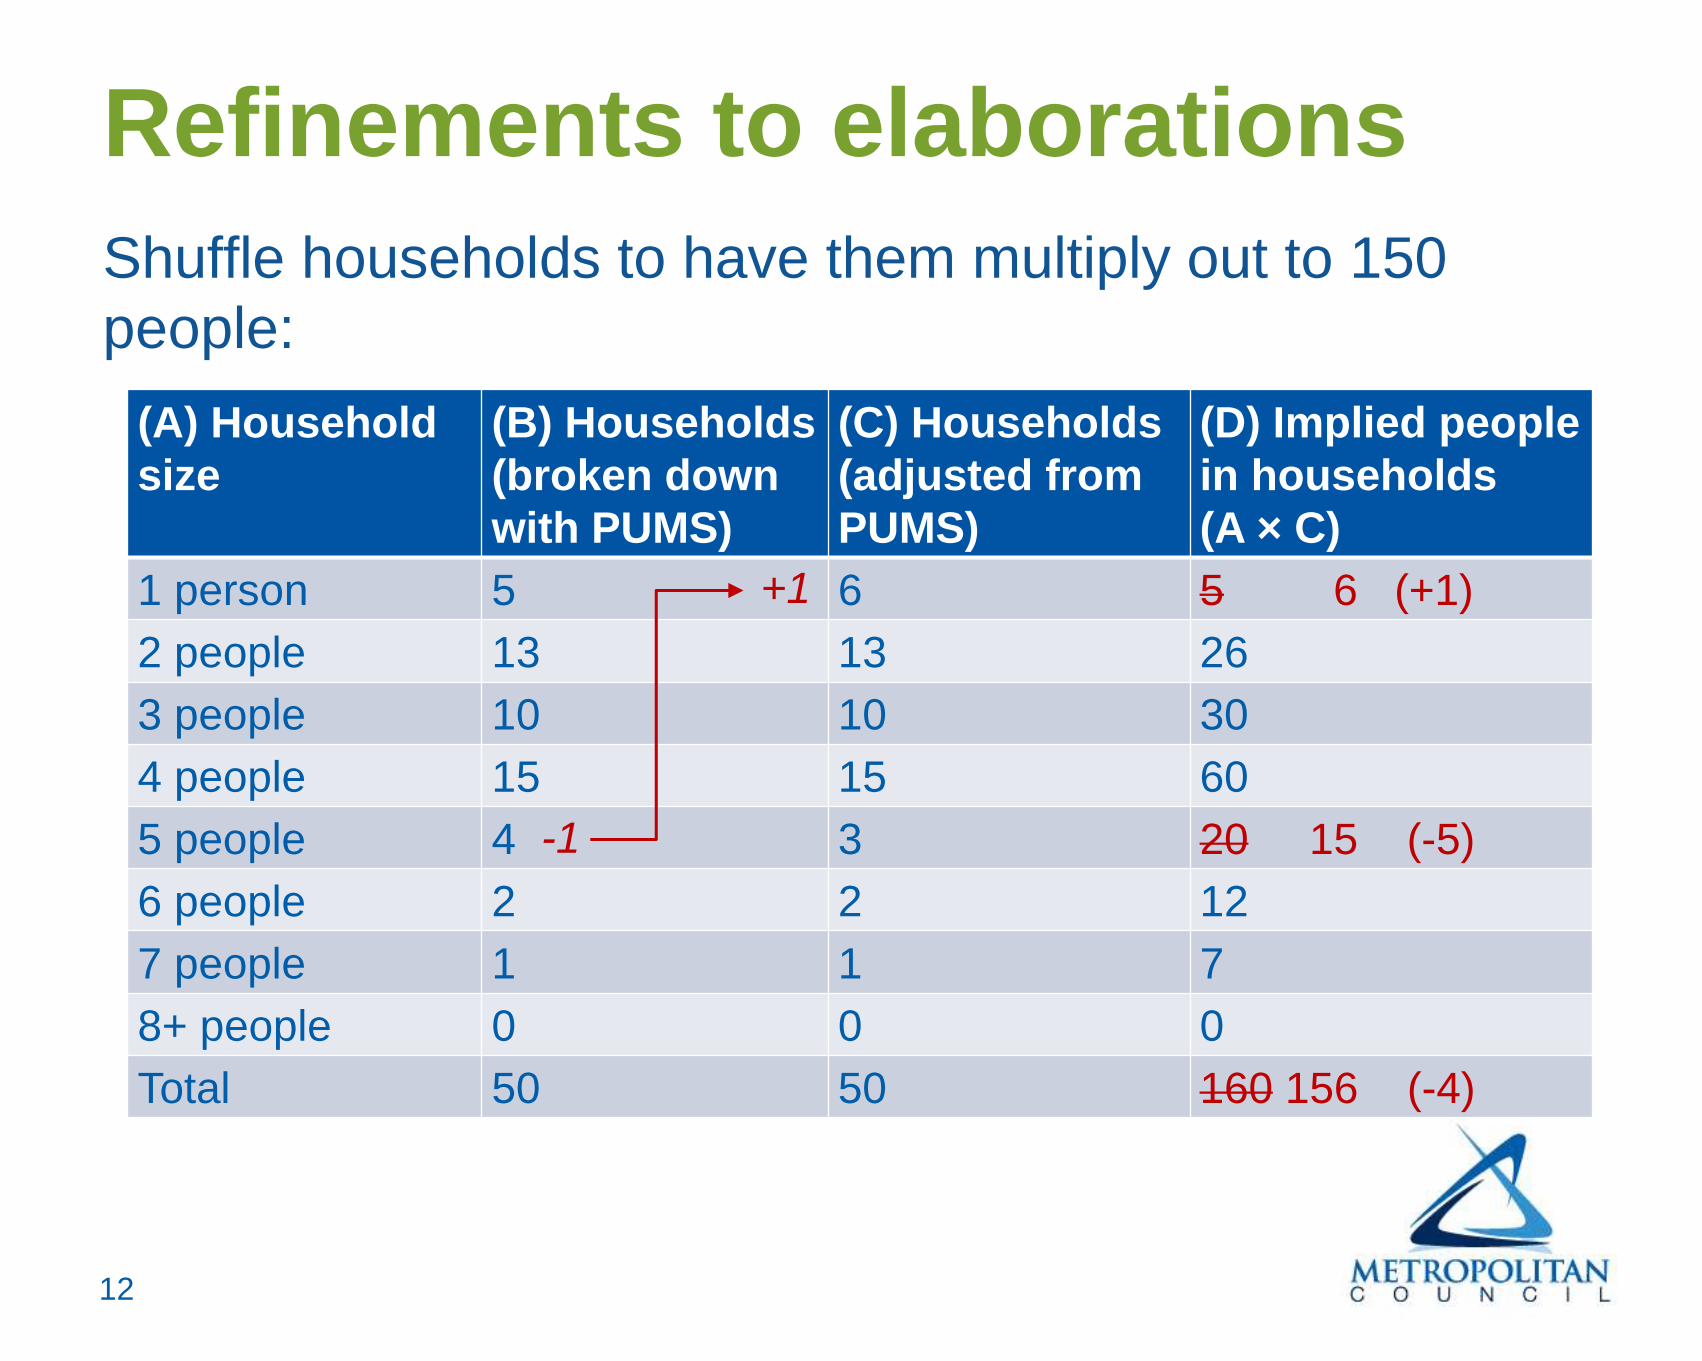
Refinements to elaborations
Shuffle households to have them multiply out to 150
people:
(A) Household
size
(B) Households
(broken down
with PUMS)
(C) Households
(adjusted from
PUMS)
(D) Implied people
in households
(A × C)
1 person 5 6 5 6 (+1)
2 people 13 13 26
3 people 10 10 30
4 people 15 15 60
5 people 4 3 20 15 (-5)
6 people 2 2 12
7 people 1 1 7
8+ people 0 0 0
Total 50 50 160 156 (-4)
-1
+1
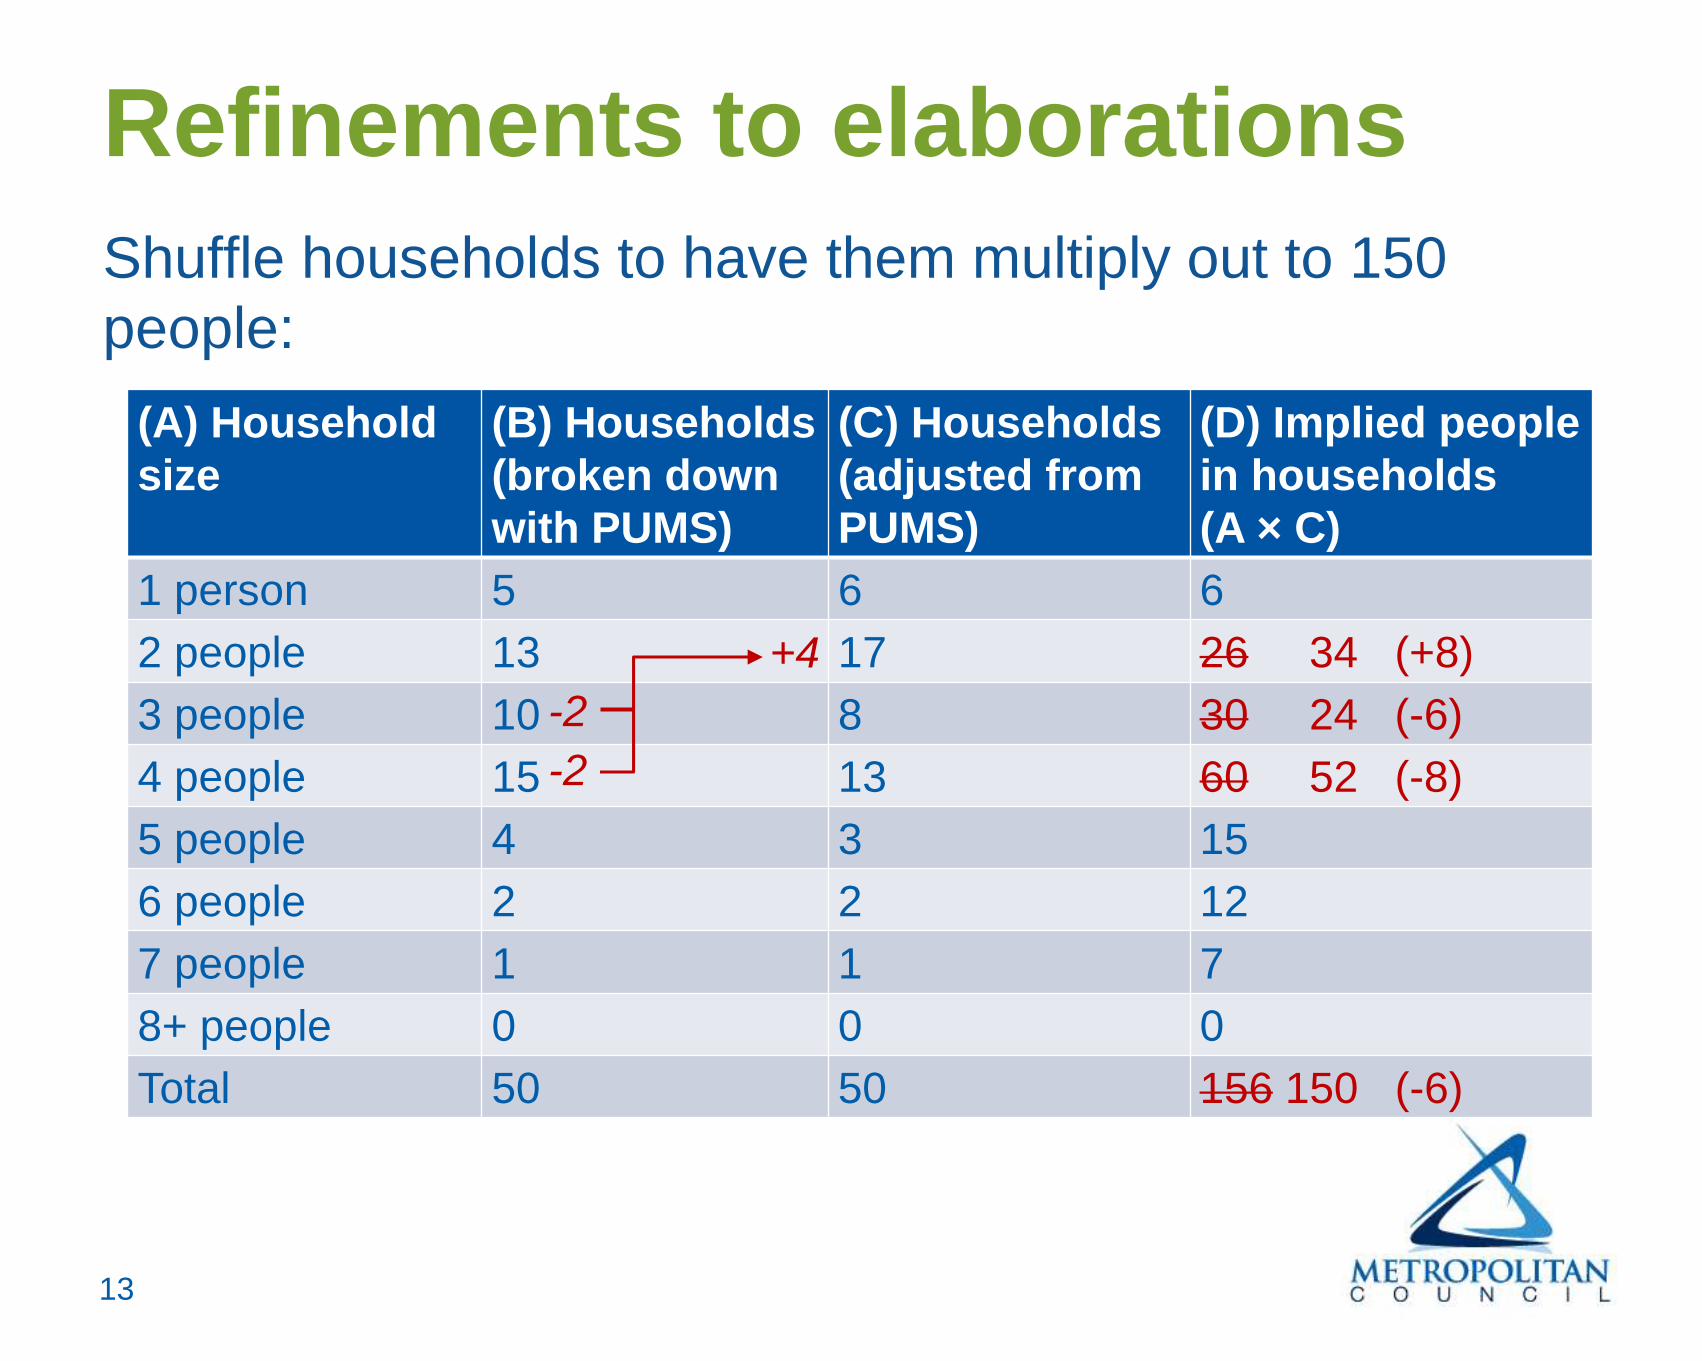
13
(A) Household
size
(B) Households
(broken down
with PUMS)
(C) Households
(adjusted from
PUMS)
(D) Implied people
in households
(A × C)
1 person 5 6 6
2 people 13 17 26 34 (+8)
3 people 10 8 30 24 (-6)
4 people 15 13 60 52 (-8)
5 people 4 3 15
6 people 2 2 12
7 people 1 1 7
8+ people 0 0 0
Total 50 50 156 150 (-6)
-2
Refinements to elaborations
Shuffle households to have them multiply out to 150
people:
-2
+4