Embed Size (px)
DESCRIPTION
Briefly
Citation preview

Acoustic Technologies: Hydrometry & Beyond
Marian MusteIIHR‐Hydroscience & Engineering
The University of Iowa
CHy‐14 SessionGeneva ‐ November 9, 2012
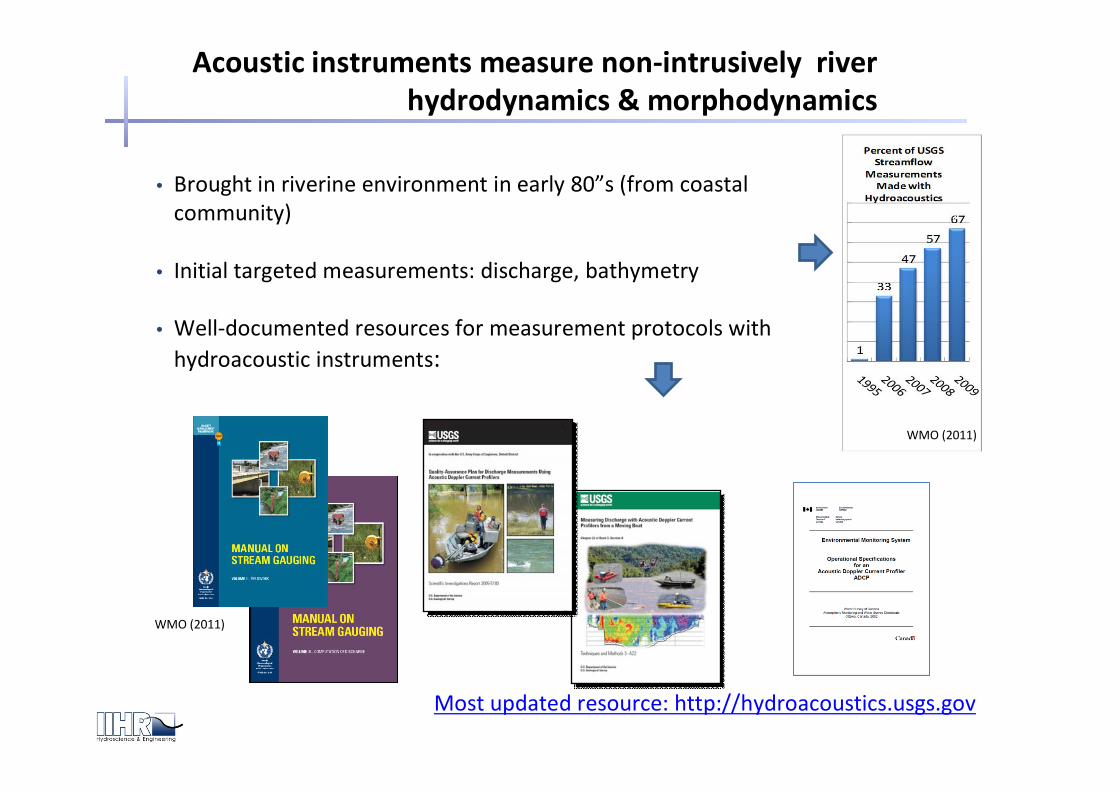
• Brought in riverine environment in early 80”s (from coastal community)
• Initial targeted measurements: discharge, bathymetry
• Well‐documented resources for measurement protocols with hydroacoustic instruments:
WMO (2011)
Most updated resource: http://hydroacoustics.usgs.gov
WMO (2011)
Acoustic instruments measure non‐intrusively river hydrodynamics & morphodynamics

Depth (echo)
Operating principle: non‐intrusive (need contact with water body)
F' = F * V/C
F' ‐ Doppler shifted frequency F ‐ frequency of the sound pulse V ‐ velocity of scatterers in waterC – speed of sound in water column
Velocity (Doppler)
d ≈ 0.5 *C*t
d ‐ water column depthC‐ speed of soundt ‐ time between pulse generation
and echo reception
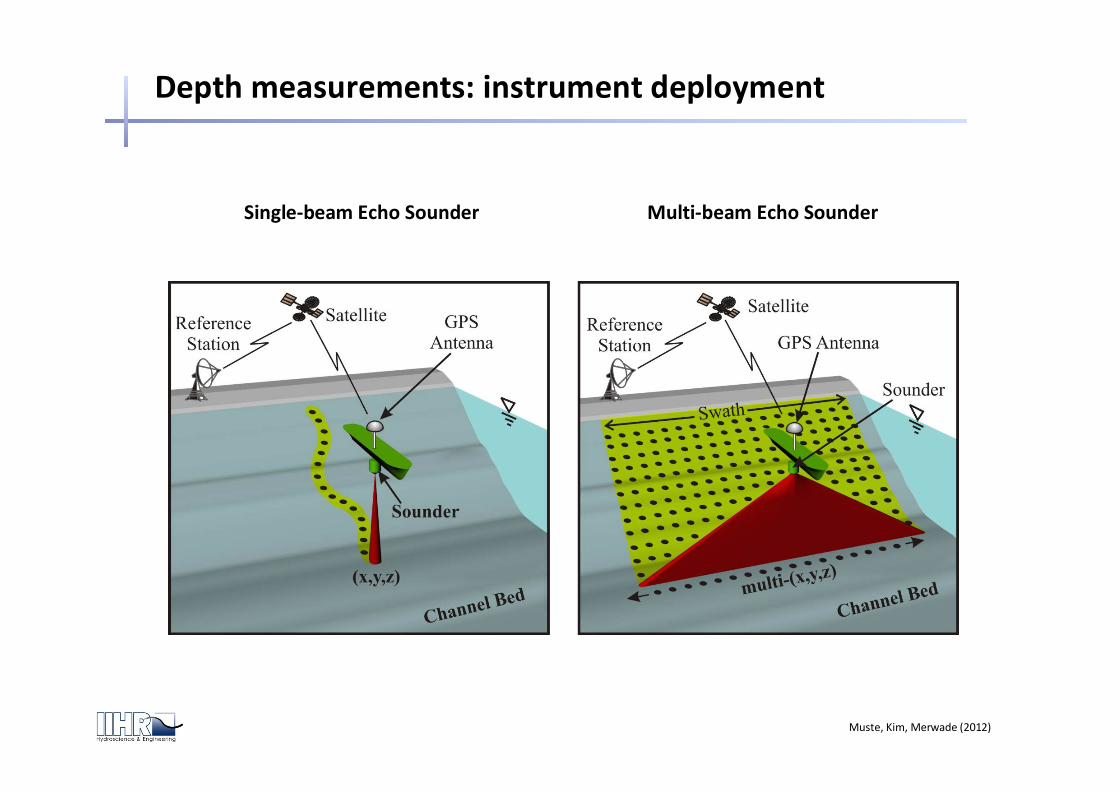
Depth measurements: instrument deployment
Single‐beam Echo Sounder Multi‐beam Echo Sounder
Muste, Kim, Merwade (2012)

Depth measurements: instrument capabilities
Multi‐beam Echo Sounder (local and reach‐scale measurements)
Local: Cross sections & thalweg line
Reach: pool, riffles, islands
Muste et al. (2012)
-10
-8
-6
-4
-2
0
0 20 40 60 80 100Distance along cross-se ction
Elev
atio
n (m
)
A B C D
Reach: bathymetry & texture
Muste, Kim, Merwade (2012)

Velocity measurements: instrument deployment
ADCP FixedADV Wading ADCP Moving boats
WMO (2011)Jackson, Johnson, Duncker (2012)WMO (2011)

ADV (point) H‐ADCP (profile) ADCP (cross section)
Velocity measurements: instrument capabilities
Multi‐beam Doppler: point velocity, velocity profiles, instantaneous discharges
Muste, Kim, Merwade (2012)
2D, 3D velocity
Q = V*A

Capabilities•increasingly accurate, robust, efficient, and safe •increasingly multi‐task and smart •observe processes in riverine environment over a range of scales•produce a paradigm shift in hydro‐ and environmental research facilitating the transfer of conventional lab investigations in field conditions
Limitations• measure on scatterers in the water column (too much or too little create problems) • multi‐beam configuration (assumptions about the measured flow needed)• biased or no measurements near transducers and stream boundaries• limited spatio‐temporal resolution (commensurate with instrument characteristics)• some protocols still under development
Acoustic Doppler Current Profilers (ADCP) measurements :capabilities & limitations
Focus:
ADCPs ‐ the most complete tools for hydrometry

Acoustic Doppler Current Profilers measurements for hydrometry: instantaneous discharge measurements
Stream discharge = sum of discharge in small cells Stream discharge = velocity-area method
Moving‐boat measurements Fixed (section‐by‐section) measurements
Measurable Area
Unmeasurable Near-bank Areas
Unmeasurable Top Area
Unmeasurable Bottom Area
etQ
mQ
elQerQ
ebQ

Uncertainty Analysis (UA) Framework:Uncertainty Analysis (UA) Framework:‐‐ CConsiderable efforts have been made to develop and implement UA leading to a large number of standards based on a variety of methods. Currrently, the hydroscience community has not agreed on a particular UA framework‐ Among the existing standards the “Guide to Expression of Uncertainty in Measurement” (GUM, 1993) has emerged as one of the most authoritative in this area
• GUM methodology: rigorous, based on advanced statistical and engineering concepts
• GUM approach: general, scientific, with recognition for further area‐specific adaptations
• GUM circulation: adopted as is by various scientific & research communities, e.g., NIST TN 1297 (1994), NF ENV 13005 (1999), ISO 5168 (2005), UKAS (2007), ISO/TS 25377 (2007) = HUG, ISO 748 (2007), ISO 10 1088 (2007), (AIAA, 1995), (ASME, 1998)
• GUM outcomes: uncertainty estimation with specified confidence level and indication of the relative contributions of the elemental uncertainty sources to the final result
WMO’s CHy recommends adoption of GUM (1993) for hydrometry
Acoustic Doppler Current Profilers measurements for hydrometry: instantaneous discharge measurement accuracy

Uncertainty Analysis: GUM (1993) FrameworkUncertainty Analysis: GUM (1993) Framework
Muste (2010)
Acoustic Doppler Current Profilers measurements for hydrometry: instantaneous discharge measurement accuracy

• Section‐by Section StreamPro measurements using GUM framework:total uncertainty (95%) confidence level: 5.79% for a small (typical) stream in Iowa
Acoustic Doppler Current Profilers measurements for hydrometry: instantaneous discharge measurement accuracy
Source
Notation Probability distribution
Relative contribution to
total uncertainty (%)
1 Edge discharge model )( egQu normal 71.07%
2 Instrument calibration )( cavu rectangular 14.76%
3 Instrument calibration )( cadu rectangular 6.62%
4 Vertical velocity model )( vdvu normal 3.40%
5 Operational conditions )( opbu rectangular 1.85%
6 Operational conditions )( opvu t-distribution 1.25%
7 Discharge model )( moQu normal 0.77%
8 Instrument accuracy )( acvu normal 0.12%
9 Operational conditions )( opdu normal 0.07%
10 Instrument accuracy )( acdu rectangular 0.05%
11 Sampling time )( stvu normal 0.03%
12 Instrument accuracy )( acbu rectangular 0.00%
13 Number of verticals )( nvQu - 0
14 Flow unsteadiness )( usQu - 0
15 Operational conditions )( opQu - 0
16 Combined Uncertainty )( mQu normal 2.89%
17 Expanded Uncertainty )( mQU normal(k=2) 5.79%
(Muste et al., 2012)

• Moving boat GUM‐based UA (Muste et., 2007): protocols and information in progress
Acoustic Doppler Current Profilers measurements for hydrometry: instantaneous discharge measurement accuracy
Source Depends upon Can be estimated from
1 Spatial resolution ADCP, mode, settings, boat speed End-to-end calibration 2
2 Doppler noise ADCP characteristics Instrument comparison
3 Velocity ambiguity Mode, settings End-to-end calibration 4 Side-lobe interference Beam angle, settings, bathymetry End-to-end calibration 5 Temporal resolution Settings End-to-end calibration 6 Sound speed Water properties UA of Celerity(Salinity, Temperature) 7 Beam angle ADCP Manufacturer’s specifications8 Boat speed Site, flow, boat operation End-to-end calibration
9 Sampling time Flow temporal large scales Instrument comparison
10 Near-transducer ADCP and flow characteristics Customized experiments
11 Reference boat velocity Sediment concentration, flow 4 Manufacturer’s Specifications
12 Depth ADCP and bed characteristics Instrument comparison
13 Cell positioning ADCP, setting, water properties √
14 Rotation ADCP, setup, site Manufacturer’s Specifications
15 Timing ADCP, speed of sound, gating time Manufacturer’s Specifications
16 Edge Discharge model and measurements Manufacturer’s Specifications
17 Vertical profile model Distribution model, turbulence Field and Laboratory Experiments
18 Discharge model Discharge model Highly resolved data 19 Finite summation ADCP settings, boat velocity √ 20 Site conditions & operation Site, boat operation Concurrently measured data
fA

• Moving boat instrument comparison (Pobantz et al., 2011): concurrent measurements at 2 sites (GE and PY) with 26 ADCPs (6 models, 2 manufacturers); reference = outflow power plant
Acoustic Doppler Current Profilers measurements for hydrometry: instantaneous discharge measurement accuracy

Rating Curves (RC)
Acoustic Doppler Current Profilers measurements for hydrometry: continuous discharge measurements
Option 1: stage‐discharge (most often)
• One rating curve• Requires continuous stage measurement (pressure sensors, radar, ultrasonic, etc)
Option 2: index‐velocity (emerging with the advent of acoustic and image‐based instruments)
• One to three rating curves (Kennedy, 1984)• Requires continuous stage & velocity measurements
Option 3: slope‐area (mostly used for extrapolation, currently explored for RC purposes)• No rating curves needed• Requires cross‐section and free‐surface slope measurements (least expensive method)
Comments: • Underlying assumption for Options 1, 2, and 3: STEADY FLOW STATIC RCs
Flow can be randomly (not event based) sampled over the whole range of variation
WMO (2011)

1. Direct discharge measurements over a wide range of flows 2. Build the RC3. Convert measured stages in discharges using RC
Option 1: Stage ‐ discharge Rating Curves
h
Underlying assumption: Steady Flow
USGS 05454200 Coralville, Iowa, 7 years of records
• RC‐derived measurements (125,865)
• direct measurements (237)
Step 1 Step 2
Step 3

1. Direct measurements for Vindex, Q, h, and A2. Build stage‐area RC 3. Build velocity‐index RC 4. Compute instantaneous discharges as Q = V*A
Step 2: Stage-Area Rating (h A)
-0.40-0.200.000.200.400.600.801.001.20
-0.50 0.00 0.50 1.00 1.50Vm
ean
V(index)
Step 3: Index Velocity Rating (Vindex V)
WMO (2011)
Step 4: Q = V*A
Step 1
Option 2: Index ‐ velocity Rating Curves

Option 3: Slope – area Rating Curves
Step 2
Step 3
1. Survey cross section 2. Survey free‐surface slope (HGL) 3. Compute instantaneous discharges using Manning eqn.
Step 1
1 2 3⁄ 1 2⁄ SI units

Uncertainties in Stage‐discharge Rating Curves
Adapted from Herschy (1995)
Source Details Measurement
(active in stable and steady flows)
• Stage• Discharge• Site and flow characteristics• Regression• Extrapolation
Control shift
(between event and seasons)
• Cross section change• Bed forms• Vegetation growth• Ice/debris build-up
Variable energy slope
(high , unsteady flows)
• Backwater• Overbank flows• Unsteady flows
On‐going CHy project for UA of RCs using GUM (1993)

Supporting measurements:1. Flow (velocity profiles) ‐ ADCP2. Concentration profiles for suspended sediment ‐ ADCP 3. Bed load ‐ ADCP4. Channel geometry – ADCP, MBES 5. Sediment characteristics ‐MBES
New targets for hydroacoustic instruments:• more information on river hydrodynamics • more information on morphodynamics, and• Information (surrogate) on total sediment transport (suspended & bed
sediment fluxes)
Hydroacoustic measurements: beyond hydrometry

Acoustic instruments are reshaping the experimental views of the river transport processes
lab investigations lab investigations
Hydroacoustic measurements: beyond hydrometry
A B
increasingly field investigations

Point & vertical hydrodynamics:• Time‐averaged velocities of raw data and comparison with conventional velocity distributions (log law, power laws)
• Distribution of turbulent intensities, Reynolds stress and TKE
Kim, Muste, Weber (2005)
Acoustic Doppler Current Profilers (ADCP) measurements:beyond hydrometry
Focus: ADCP ‐ originally developed to estimate discharges‐ capable for multi‐task monitoring & investigations (users’ extensions)

Cross section hydrodynamics•Streamwise/spanwise vertical velocity profiles (spatial averaging)•Transverse distribution of the streamwise velocity•Depth‐averaged velocity profiles•Velocity allocation to cross‐sections
Kim, Muste, Weber (2005)
Acoustic Doppler Current Profilers (ADCP) measurements:beyond hydrometry

0.0 5 m /s
D is ta n c e f ro m th e le f t b a n k (m )
Dept
h(m
)
0 5 1 0 1 5 2 0 2 5 3 0 3 5 4
0
1
2
3
4
5
Muste. Kim, Merwade (2012)
Cross‐section hydrodynamics
•ADCP raw data •2‐D spatial averaging for visualization of mean flow characteristics
Acoustic Doppler Current Profilers (ADCP) measurements:beyond hydrometry

Cross‐section hydrodynamics•Bed shear stress•Bed‐load velocity estimate •Longitudinal dispersion coefficient
Kim, Muste, Weber (2005)
Acoustic Doppler Current Profilers (ADCP) measurements:beyond hydrometry

Reach‐scale hydrodynamics•Velocity (raw, spatially/temporally averaged)•Bed shear stress mapping•Raw & processed data ingestion in geodatabases
Kim, Muste, Weber (2005)
Acoustic Doppler Current Profilers (ADCP) measurements:beyond hydrometry

Cross‐section hydrodynamics: estimation of suspended sediment transport
Section ADCP (GssT=Gssm+Gsss)
GssT (traditional methods)
Diference
kg/s kg/s %Colastiné 68 80 -15Colastiné 43 56 -23
R3 378 320 18R6 465 507 -8R7 1082 1070 1
• U – direct ADCP data• Css – from calibration
Szupiany (2012)
Acoustic Doppler Current Profilers (ADCP) measurements:beyond hydrometry

Cross‐section hydrodynamics: estimation of bedload
( ) dd UHP−= 1migration dune from transportload Bed β
Szupiany (2012)
Acoustic Doppler Current Profilers (ADCP) measurements:beyond hydrometry

Muste, Merwade, Kim, Maidment, Whiteaker (2010)
Data models: The current amount of data challenges our current approaches to data handling, processing, and extraction of information and knowledge
Acoustic Doppler Current Profilers (ADCP) measurements:beyond hydrometry

Kim, Muste (2008)
),,( zms VVV
Current geo‐temporal data models handle 1D and 2.5D representations of streams as Hydronetworks or Channel Bathymetry (Arc Hydro, Maidment 2002)
TimeTimeTime
Hydro Network (1D)
Channel Systems (2.5D)River Reach (3D)
Acoustic Doppler Current Profilers (ADCP) measurements:beyond hydrometry

Kim, Muste (2008)
(a) (b)
(c) (d)
Gridded features and raster in the Arc River; a) GridPoint and GridArea in the vertical plane; b) GridArea (horizontal plane); c) GridVolume; d) a stack of raster dataset
• scalars and vectors incoming in various formats• curvilinear river‐attached coordinate system• geographic feature (point, line, polygon, and volume)• ingest gridded data generated by numerical simulation• representation in Eulerian or Lagrangian frameworks
Example: ADCP measurements
Data model: Arc River (built on top of ArcGIS)
3D representation enabling powerful river morpho‐hydrodynamics features
Acoustic Doppler Current Profilers (ADCP) measurements:beyond hydrometry

Kim, Muste (2008)
Bed forms time series (acoustic measurements)
Process representation using measurements as raw information (Eulerian or Lagrangian frameworks)
Data model: Arc River (built on top of ArcGIS)
3D representation enabling visualization of riverine processes
Pollutant dispersion (ADCP measurements)
Acoustic Doppler Current Profilers (ADCP) measurements:beyond hydrometry
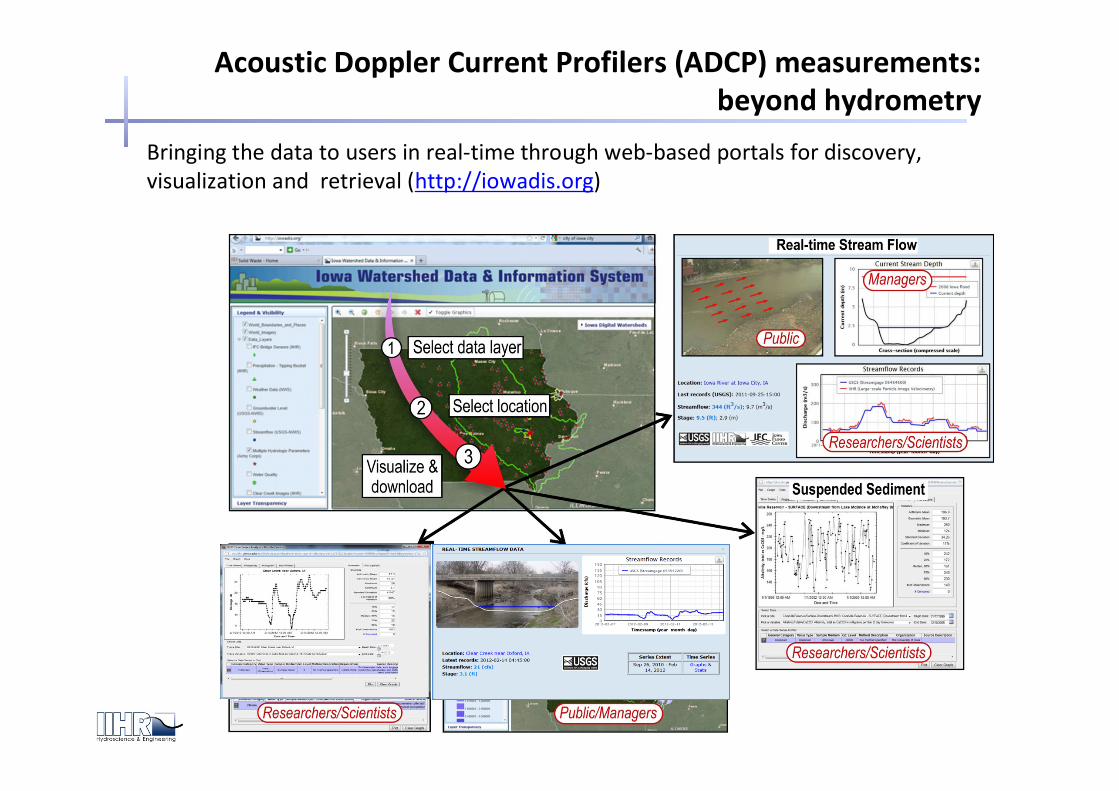
Bringing the data to users in real‐time through web‐based portals for discovery, visualization and retrieval (http://iowadis.org)
Acoustic Doppler Current Profilers (ADCP) measurements:beyond hydrometry

• Graf, W.H. and Qu, Z. (2004). “Flood Hydrographs in Open Channels,” Proceedings of the Institute of Civil Engineers Water Management (157), pp. 45‐52.
• Gonzalez‐Castro, J. and Muste, M. (2007). “Framework for Estimating Uncertainty of ADCP Measurements from a Moving Boat Using Standardized Uncertainty Analysis,” Special Issue on Acoustic Velocimetry for Riverine Environments, J. Hydr. Engrg., 133(12), pp. 1390‐1411.
• http://hydroacoustics.usgs.gov
• Jackson, P.R., Johnson, K.K., and Duncker, J.J., 2012, Comparison of index velocity measurements made with a horizontal acoustic Doppler current profiler and a three‐path acoustic velocity meter for computation of discharge in the Chicago Sanitary and Ship Canal near Lemont, Illinois: U.S. Geological Survey Scientific Investigations Report 2011–5205, 42 p.
• Maidment, D. (2002). “ArcHydro – GIS for Water Resources,” ESRI prES, Redlands, CA.
• Muste, M., Yu, K., and Spasojevic, M. (2004). “Practical Aspects of ADCP Data Use for Quantification of Mean River Flow Characteristics: Part I: Moving‐Vessel Measurements” Flow Measurement and Instrumentation, 15(1), pp. 1‐16.
• Muste, M., Yu, K., Pratt, T., and Abraham, D. (2004). “Practical Aspects of ADCP Data Use for Quantification of Mean River Flow Characteristics: Part II: Fixed‐Vessel Measurements” Flow Measurement and Instrumentation, 15(1), pp.17‐28.
• Kennedy, E.J., 1984, Discharge ratings at gaging stations: U.S. Geological Survey Techniques of Water‐Resources Investigations, book 3, chap. A10, 59 p. (http://pubs.usgs.gov/twri/twri3‐a10/.)
• Kim, D., Muste, M. and Weber, L. (2007). “Inc rporation of Three‐dimensional River Characteristics in Relational Geodatabases,” EWRI‐IAHR Hydraulics Measurement & Experimental Methods Conference, Lake Placid, NY
References
• Kim, D., Muste, M. and Weber, L. (2007). “Software for Assessment of Longitudinal Dispersion Coefficients Using ADCP Measurements,” Proceedings 32nd IAHR Congress, Venice, Italy
• Kim, D., Muste, M., and Weber, L. (2005). “Development of New ADCP Post‐Processing and Visualization Capabilities,”Proceedings XXXI IAHR Congress, Seoul, Korea.
• Kim, D., Muste, M., Gonzalez‐Castro, J.A., and Ansar, M. (2005). “Graphical User Interface for ADCP Uncertainty Analysis,”Proceeding ASCE World Water & Environmental Resources Congress, Anchorage, AK.

References
• Muste, M., Kim, D., and Gonzalez‐Castro, J.A. (2010). “Near‐Transducer Errors in ADCP Measurements: Experimental Findings,” J. Hydr. Engrg.136(5), pp. 275‐289
• McGeary, D., Plummer, C.C., Carlson, D.H. (2001). Physical Geology: Earth Revealed, 4th edition, McGraw‐Hill Comp., New York, NY.
• Muste, M., Yu, K., Gonzalez‐Castro, J., and Starzmann E. (2004). “Methodology for Estimating ADCP Measurement Uncertainty in Open‐Channel Flows,” ProceedingsWorld Water & Environmental Resources Congress 2004 (EWRI), Salt Lake City, UT
• Muste, M., Yu, K., Pratt, T.C., Abraham, D. (2002). “ADCP Measurements at Fixed River Locations,” Hydraulic Measurements & Experimental Methods, ASCE‐IAHR Joint Conference, Estes Park, CO (CD‐ROM)
• Pobantz, K., Le Coz, J., Pierrefeu, G. (2011). “Intercomparison of ADCPs on the Rhône downstream of Génissiat dam (2010/10/12‐15), Group Doppler Report (personal communications)
• Szupiany, R.N. (2012) “Sediment Transport: Traditional and Acoustic Technology,” International Workshop on Hydrometry, Manaus, Brazil, May 7‐11, 2012
• Tu, H., Tamai, N. and Kan, K. (1995). “Velocity Measurements in Unsteady Compound Open‐channel Flows”. Proceedings 26th IAHR Congress, (1), pp. 385–390. WMO (2011). “Manual on Stream Gaging,” World Meteorological Organization, WMO‐No. 1044, Vol. I and II. Training Material