Embed Size (px)
Citation preview

Achieving Community Resilience through Microgrids
NARUC-NASEO Microgrids State Working Group Webinar
JAN. 13, 2021| 3:00 – 4:00 PM ET
MEMBERS-ONLY DISCUSSION 4:00 – 4:30 PM ET
2
User Objectives and Design Approaches for Microgrids: Options for Delivering Reliability and Resilience, Clean Energy, Energy Savings, and Other Priorities
Private, State, and Federal Funding and Financing Options to Enable Resilient, Affordable, and Clean Microgrids
View press releases:
https://www.naseo.org/news-article?NewsID=3562
https://www.naruc.org/about-naruc/press-releases/new-naruc-naseo-reports-on-microgrid-financing-and-use-cases/
NARUC-NASEO BRIEFING PAPERS RELEASED

3
Speakers:
• Mike Gravely, Research Program Manager, California Energy Commission
• Jana Ganion, Sustainability and Government Affairs Director, Blue Lake Rancheria, California
• Craig Lewis, Executive Director, Clean Coalition

EPIC Program | Enabling a 100% Clean Energy Future
California Energy Commission

Accelerating Clean Energy Innovation
5
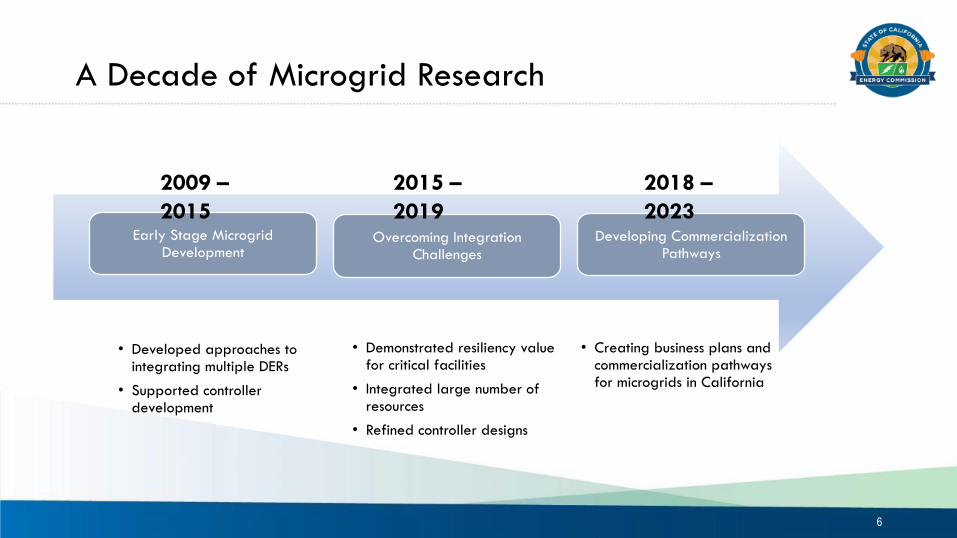
A Decade of Microgrid Research
Early Stage Microgrid Development
Overcoming Integration Challenges
Developing Commercialization Pathways
• Developed approaches to integrating multiple DERs
• Supported controller development
• Demonstrated resiliency value for critical facilities
• Integrated large number of resources
• Refined controller designs
• Creating business plans and commercialization pathways for microgrids in California
2009 –
2015
2015 –
2019
2018 –
2023
6

Providing Critical Functions
7
34 microgrid projects - $91M invested - $75M match

A Diverse Portfolio
8
*Total inverter size
Microgrid Sizes*

A Diverse Portfolio
Shelter
Distribution Center
Fire Stations
Medical Center
CommunitiesCritical Facilities
City Hall, Police HQ, and
Community Centers
Airport Digester
Ports
Industrial
Military
Waste Water Treatment Plant
9

Community Microgrid at Blue Lake Rancheria
10
Microgrid Design
Solar: 420 kW AC PV ground-mounted array
Energy Storage: 500 kW / 950 kWh lithium-ion battery storage
Software & Controls: Siemens Spectrum Power 7 Microgrid Management System and Schweitzer Engineering Laboratories Protection Relays
Other Infrastructure: Purchased distribution system infrastructure to create a new point ofcommon coupling with the grid, integrating six buildings into the microgrid behind one electricmeter
Technology Integration: The Schatz Energy Research Center at Humboldt State University
UNIQUE PROJECT ASPECTS
✓ American Red Cross shelter
✓ Successfully islanded during several unplanned utility outages due to weather and nearbywildfires
✓ Can deploy five levels of load shedding depending on the outage and system conditions
✓ Achieving cost savings: 58% overall energy

Emergency Microgrids for Fire Stations
11
Microgrid Design
Solar: 38 kW solar PV at Fire Station 11, 43 kW each at Fire Stations 6 and 7
Energy Storage: 110 kWh li-ion battery storage at each
Software & Controls: Gridscape Solutions’ cloud-based predictive distributed energy resource management software (DERMS) and energy management system – EnergyScope
Technology Integration: Gridscape Solutions
UNIQUE PROJECT ASPECTS
✓ Displaces diesel generation and extends fuel reserves in emergency, keeping the fire station online longer as a viable first responder
✓ System design refined over deployments.
✓ Demonstrated more than 10 hours of islanding capability
✓ Gridscape expanding to other communities

Redwood Coast Airport Microgrid
12
• Collaborative design and operation
• RCEA – 2.2MW PV & 2.2MW/8.8 MWh storage (CAISO participation) & 320 KW PV (reduces airport electricity bill)
• PG&E – FTM microgrid
• Community-scale system – multiple customers, including USCG Air Station
• Create experimental tariffs/agreements for fair allocation of costs & compensation of third party generator
• Participate in CAISO wholesale market
• Create a replicable business model
Humboldt State Univeristy
CEC: $5M Match:
$6.3M

Lancaster Advanced Energy Community
13
• Developing a virtual power plant of connected DERs
• 5 MW PV & 10 MWh storage
• 2 ZNE affordable housing developments
• 70 unit – 780 KWh Li-ion
• 164 unit – 500 KWh flywheel
• 3 school microgrids
• Partner with Lancaster Green District to deploy more BTM storage
Zero Net Energy (ZNE) Alliance
CEC: $5.0M Match: $5.7M
14
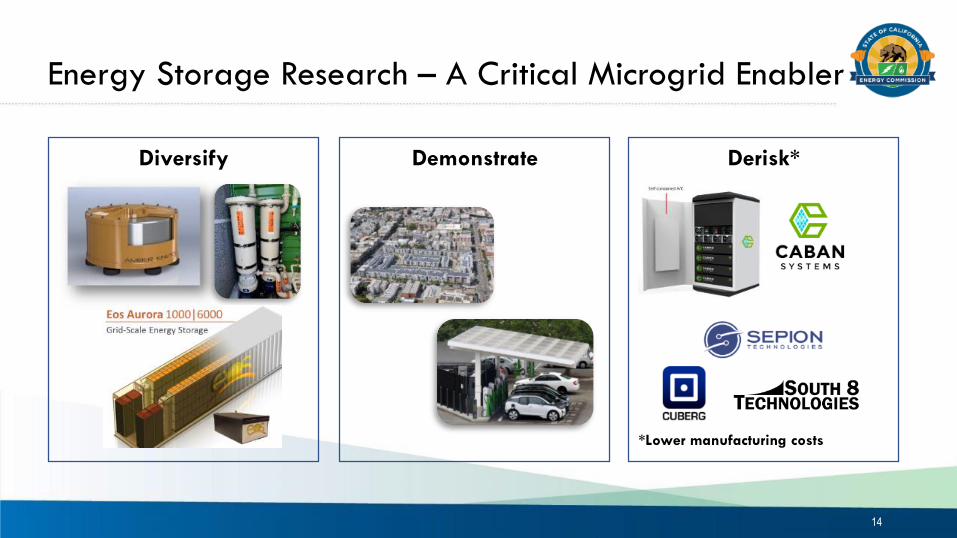
Energy Storage Research – A Critical Microgrid Enabler
Diversify Demonstrate Derisk*
*Lower manufacturing costs
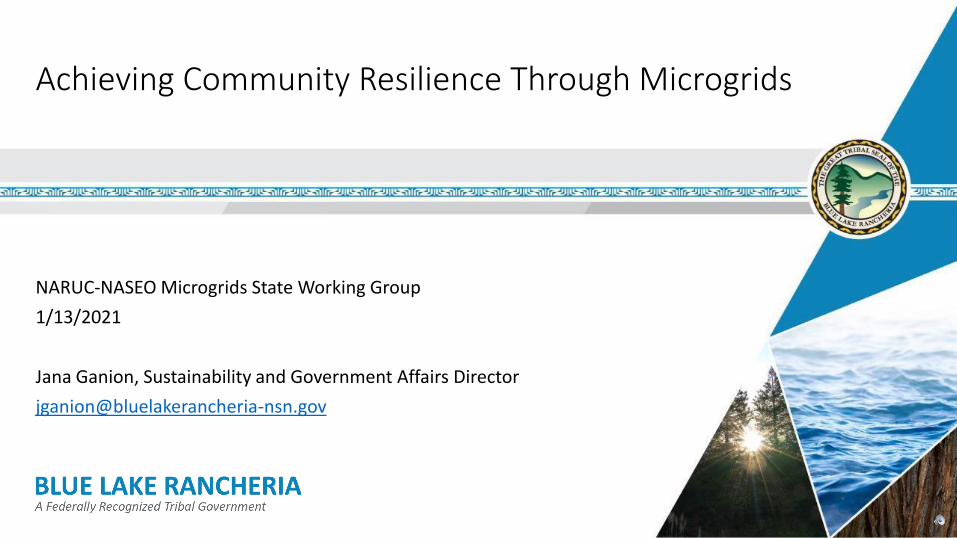
Achieving Community Resilience Through Microgrids
NARUC-NASEO Microgrids State Working Group
1/13/2021
Jana Ganion, Sustainability and Government Affairs Director

Blue Lake Rancheria Overview
Tribal government; nation; community
Federally recognized 1908
Terminated 1958; Restored 1983
Governed by elected, five-member
Tribal Business Council
~100 acres of trust landSpans the Mad River
Tribal Utility Authority (2013)
Top 10 employers in rural Humboldt
County~400 employees
17

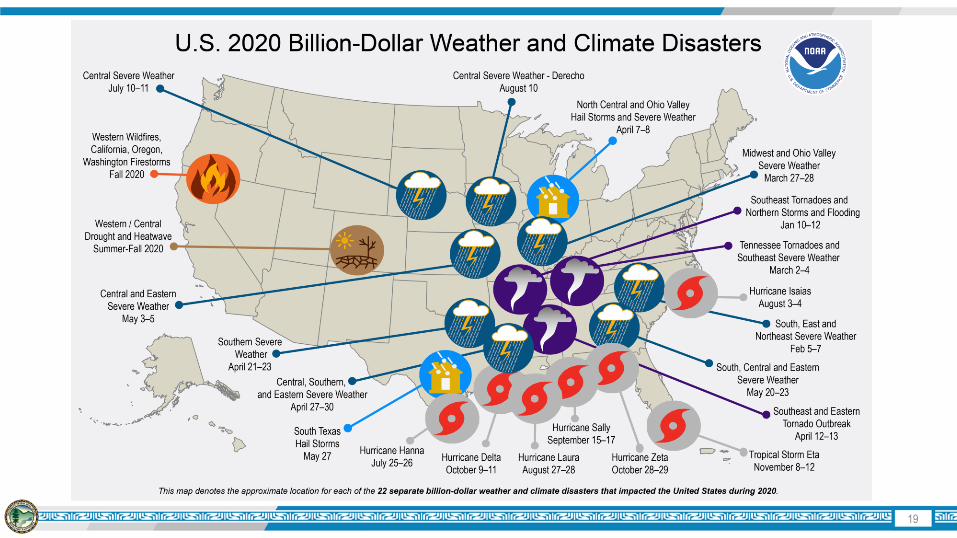
Resilience Rationale – Global / National2020: highest number of billion-dollar disasters in U.S. ever
2019: highest ocean temperatures ever recorded (NOAA)
2010-2019: warmest decade ever recorded (NOAA)
Antarctic & Greenland ice sheets: contain ~220 feet of sea level rise; melt is earlier than predicted, and accelerating (NASA)
CO2 concentrations are at highest levels in human history, >415 ppm, and increase is accelerating (NOAA)
Larger storms/wildfires; persistent drought; extreme heat; air pollution
Increasing GHG emissions; need more data
Unknown large methane emissions
https://www.nytimes.com/interactive/2019/12/12/climate/texas-methane-super-emitters.html
Species die-offs (e.g., pollinators, Australia wildfires)
Feedback loops are accelerating – e.g., Arctic permafrost melt; methane hydrates
18
Ph
oto
Cred
it: H. P
atton
, Flickr Creative C
om
mo
ns
19
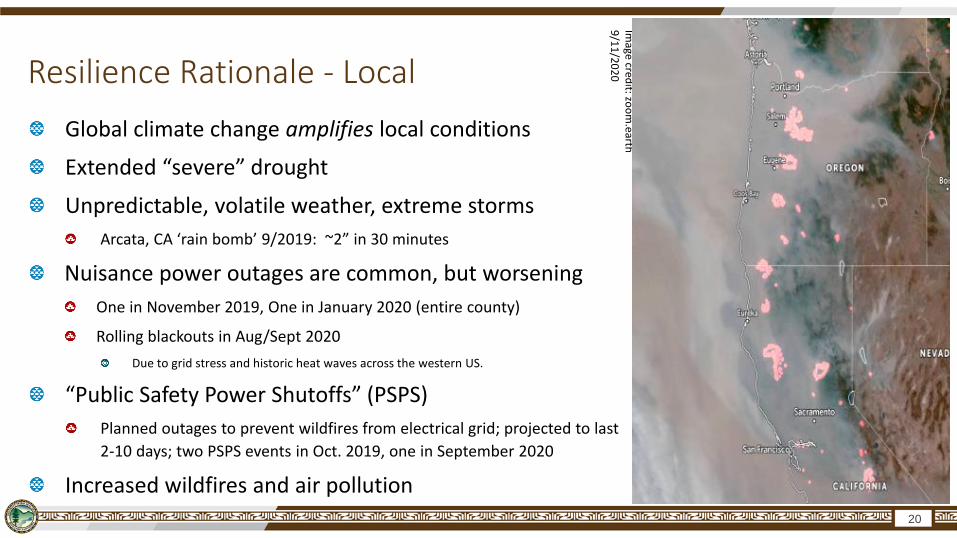
Resilience Rationale - Local
Global climate change amplifies local conditions
Extended “severe” drought
Unpredictable, volatile weather, extreme storms
Arcata, CA ‘rain bomb’ 9/2019: ~2” in 30 minutes
Nuisance power outages are common, but worsening
One in November 2019, One in January 2020 (entire county)
Rolling blackouts in Aug/Sept 2020
Due to grid stress and historic heat waves across the western US.
“Public Safety Power Shutoffs” (PSPS)
Planned outages to prevent wildfires from electrical grid; projected to last
2-10 days; two PSPS events in Oct. 2019, one in September 2020
Increased wildfires and air pollution
20
Image cred
it: zoo
m.earth
9
/11
/20
20
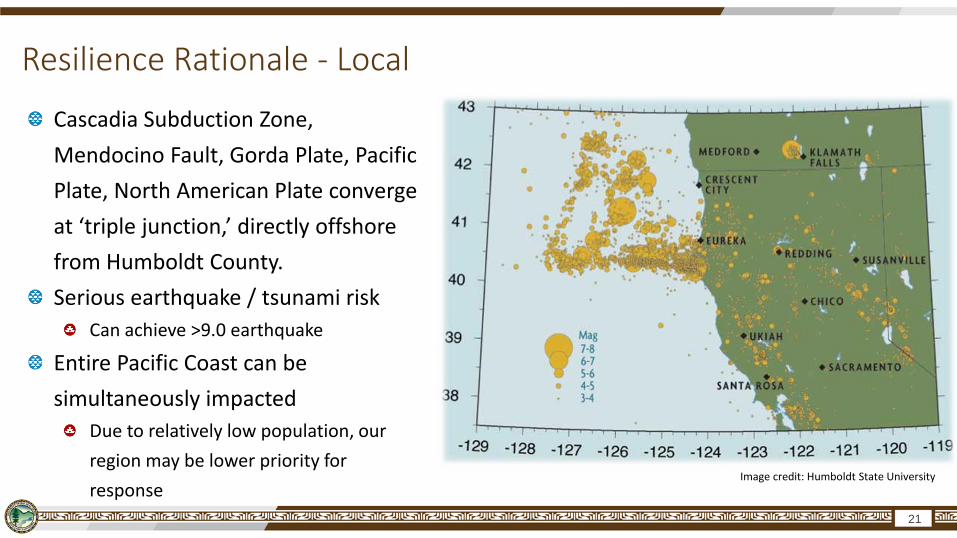
Resilience Rationale - Local
Cascadia Subduction Zone,
Mendocino Fault, Gorda Plate, Pacific
Plate, North American Plate converge
at ‘triple junction,’ directly offshore
from Humboldt County.
Serious earthquake / tsunami risk
Can achieve >9.0 earthquake
Entire Pacific Coast can be
simultaneously impacted
Due to relatively low population, our
region may be lower priority for
response
21
Image credit: Humboldt State University

Resilience Rationale - Local“Behind the Redwood Curtain”
Tenuous connection to natural gas, electrical, and digital
communications grids
Increasing risk of damage / disruption
Landslides | Floods
Disruption of local supply chains
Food
Diesel / gas / propane
Can’t rely on liquid fuels for transport or energy
Sea Level Rise (SLR)
Humboldt County has fastest SLR on the Pacific Coast
Impacts to local anchor power plant and other infrastructure
Threatens local nuclear waste repository
22
Simultaneous landslides across two (of three) main highways to the region. Photo credit: CalTrans

Climate-smart Resilience StrategyTransition to ‘climate-smart’ infrastructure ASAP
Improve continuity of operations (COOP), community
health, resilience
Economy-enabling investmentsmore jobs; lower, predictable costs
increased local capacity (key in rural regions)
“Lifeline Sector” PrioritiesEnergy, Water, Food, Transportation, Communications
If these are done well, social, economic, and
environmental benefits result
Zero-carbon Solutions Pairing climate mitigation + adaptation
Solving current climate impacts with lowest carbon solutions
Avoid making underlying causes worse
Achieve zero net greenhouse gas emissions by 2030
23

Low-carbon Microgrids at Blue Lake Rancheria
Community scale – in operation since 2017
Facility scale – in operation since early 2020
Campus scale – in design, full operation by 2022
Three clustered microgrids allow for ongoing research in reliability, load management / demand response and grid benefits
24
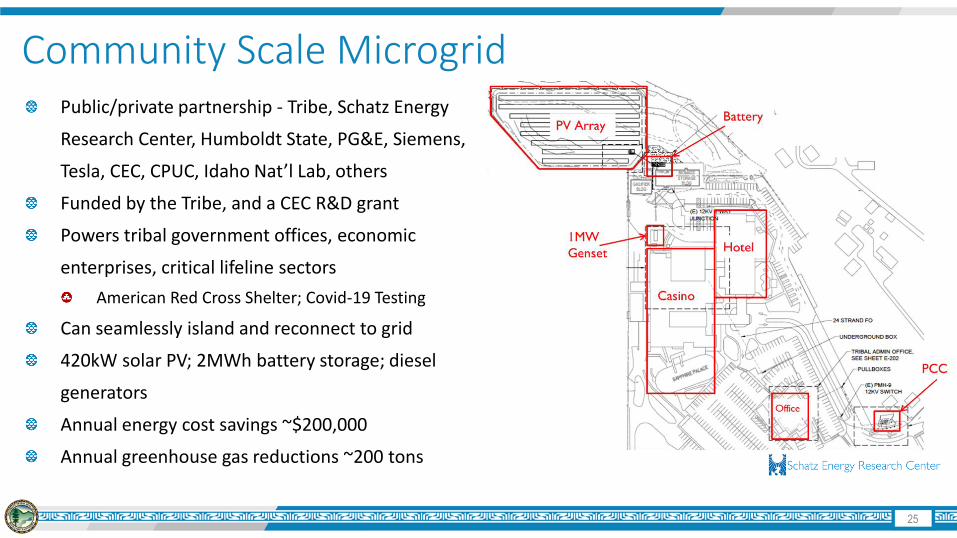
Community Scale MicrogridPublic/private partnership - Tribe, Schatz Energy
Research Center, Humboldt State, PG&E, Siemens,
Tesla, CEC, CPUC, Idaho Nat’l Lab, others
Funded by the Tribe, and a CEC R&D grant
Powers tribal government offices, economic
enterprises, critical lifeline sectors
American Red Cross Shelter; Covid-19 Testing
Can seamlessly island and reconnect to grid
420kW solar PV; 2MWh battery storage; diesel
generators
Annual energy cost savings ~$200,000
Annual greenhouse gas reductions ~200 tons
25
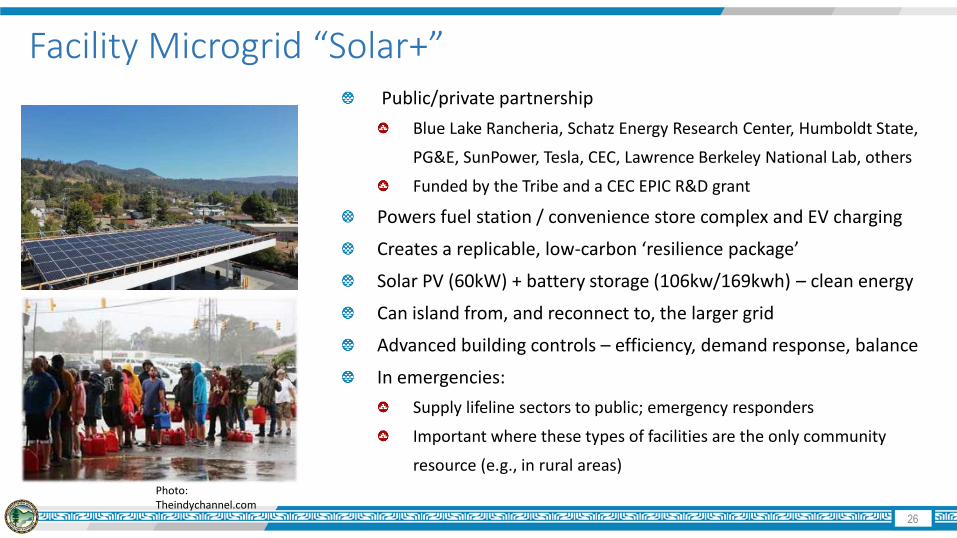
Public/private partnership
Blue Lake Rancheria, Schatz Energy Research Center, Humboldt State,
PG&E, SunPower, Tesla, CEC, Lawrence Berkeley National Lab, others
Funded by the Tribe and a CEC EPIC R&D grant
Powers fuel station / convenience store complex and EV charging
Creates a replicable, low-carbon ‘resilience package’
Solar PV (60kW) + battery storage (106kw/169kwh) – clean energy
Can island from, and reconnect to, the larger grid
Advanced building controls – efficiency, demand response, balance
In emergencies:
Supply lifeline sectors to public; emergency responders
Important where these types of facilities are the only community
resource (e.g., in rural areas)
Facility Microgrid “Solar+”
26
Photo: Theindychannel.com
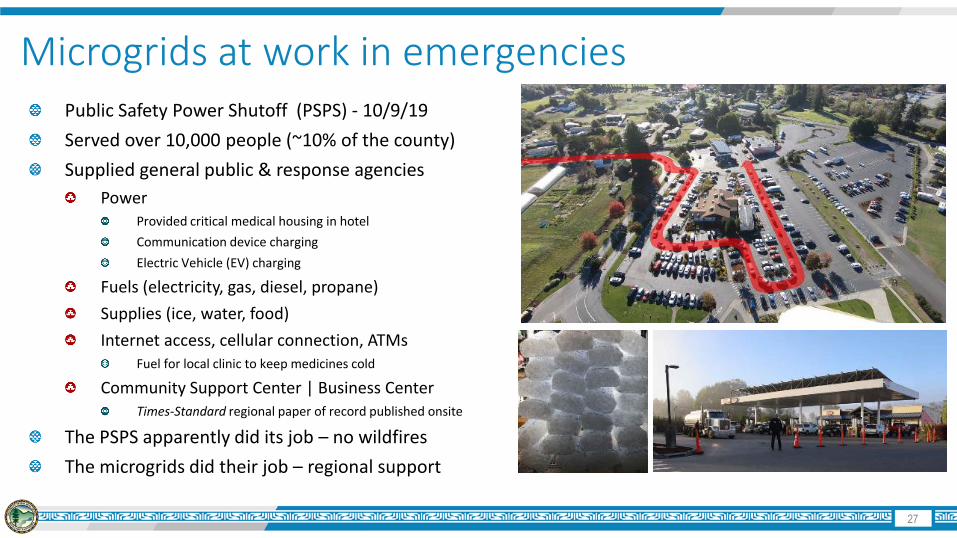
Microgrids at work in emergenciesPublic Safety Power Shutoff (PSPS) - 10/9/19
Served over 10,000 people (~10% of the county)
Supplied general public & response agencies
PowerProvided critical medical housing in hotel
Communication device charging
Electric Vehicle (EV) charging
Fuels (electricity, gas, diesel, propane)
Supplies (ice, water, food)
Internet access, cellular connection, ATMsFuel for local clinic to keep medicines cold
Community Support Center | Business CenterTimes-Standard regional paper of record published onsite
The PSPS apparently did its job – no wildfires
The microgrids did their job – regional support
27
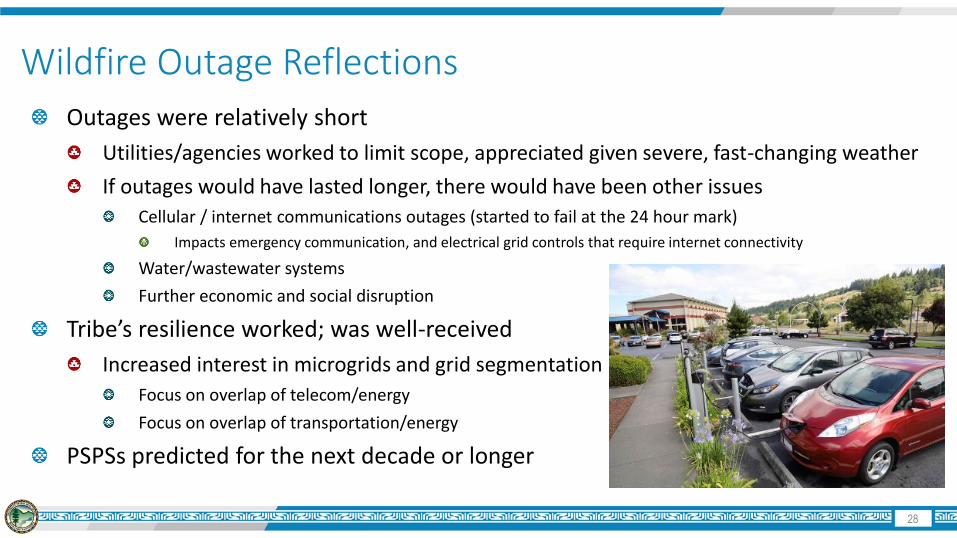
Wildfire Outage Reflections
Outages were relatively short
Utilities/agencies worked to limit scope, appreciated given severe, fast-changing weather
If outages would have lasted longer, there would have been other issues
Cellular / internet communications outages (started to fail at the 24 hour mark)
Impacts emergency communication, and electrical grid controls that require internet connectivity
Water/wastewater systems
Further economic and social disruption
Tribe’s resilience worked; was well-received
Increased interest in microgrids and grid segmentation
Focus on overlap of telecom/energy
Focus on overlap of transportation/energy
PSPSs predicted for the next decade or longer
28

Microgrids as SolutionsLow- or zero-emission microgrids’ stacked benefits
Resilience, jobs, capacity, GHG and pollution reduction
How are microgrids valued; how do we fund them?
In business as usual and emergencies; local and regional benefit
Value of lower emission energy and transportation
Value of resilience and resource adequacy
Microgrid knowledge transfer
Avoid inappropriate technology, increase standardization, lower capital and O&M costs (slower if overly proprietary)
How to best manage microgrids?
Increase regional expertise/capacity | ensure safety and broad grid ecosystem benefits
24/7 emergency response and O&M (electricians, IT)
Inter-jurisdictional issues, interconnection policy lag
Regional utility owned and operated?
Microgrids - vs. - segmenting the grid to enable larger, more cost-effective generation/storage projects and ensure all
systems are coordinated for grid-easing benefit
29

Final Thoughts
30
Select Resilience Recognition
2019 “Green Power Leadership Award (Direct Project Engagement)” U.S. EPA
2019 “Microgrids for Greater Good Award (Grid-Connected)” Microgrid Knowledge
2018 “Project of the Year (DER Integration)” POWERGRID International, DistribuTECH
2017 “Whole Community Preparedness Award” FEMA
2015-2016 “Climate Action Champion” White House and U.S. Department of Energy
Tribes are increasing jurisdictional
and operational control of utilities that serve their nations and communities.Tribes will be increasingly assuming a utility commission role and
portfolio – rate setting, policies, programsTribes will be building more community-scale and utility-scale
clean DERs.Recommend creating forums to collaborate at the regulatory level

Further Reading Washington Post article on microgrid and resilience: https://www.washingtonpost.com/climate-solutions/2020/01/01/amid-shut-off-woes-
beacon-energy/?arc404=true
Technical reports on microgrids: https://ww2.energy.ca.gov/2019publications/CEC-500-2019-011/CEC-500-2019-011.pdf and
https://ww2.energy.ca.gov/2018publications/CEC-500-2018-022/CEC-500-2018-022.pdf
T&D World article on microgrid: https://www.tdworld.com/grid-innovations/smart-grid/article/20971186/microgrid-serves-multiple-purposes
Reasons to be Cheerful article on Blue Lake Rancheria resilience: https://reasonstobecheerful.world/power-struggle/
NOAA Climate Website: https://www.noaa.gov/climate
National Security Implications of a Changing Climate:
https://obamawhitehouse.archives.gov/sites/default/files/docs/National_Security_Implications_of_Changing_Climate_Final_051915.pdf
Intergovernmental Panel on Climate Change Special Report: https://www.ipcc.ch/sr15/
United Nations Environment Programme Emissions Gap Report (2019):
https://wedocs.unep.org/bitstream/handle/20.500.11822/30798/EGR19ESEN.pdf?sequence=13
Rhodium Group Climate Risk Data: https://rhg.com/impact/climate-risk/
31

Making Clean Local Energy Accessible Now
Craig LewisExecutive Director
Clean Coalition
650-796-2353 mobile
13 January 2021
Value-of-resilience from Solar Microgrids
VOR123 Methodology

Making Clean Local Energy Accessible Now 33
Clean Coalition (nonprofit)
Mission
To accelerate the transition to renewable
energy and a modern grid through
technical, policy, and project
development expertise.
100% renewable energy end-game
• 25% local, interconnected within the
distribution grid and facilitating
resilience without dependence on
the transmission grid.
• 75% remote, dependent on the
transmission grid for serving loads.

Making Clean Local Energy Accessible Now 34
VOR123 methodology yields a 25% typical adder
There are different VOR multipliers for each of the three load tiers. The following valuation ranges are typical for most sites:
• Tier 1: 100% resilience is worth 3 times the average price paid for electricity. In other words, indefinite energy resilience for critical loads is worth 3 times the average price paid for electricity. Given that the typical facility has a Tier 1 load that is about 10% of the total load, applying the 3x VOR Tier 1 multiplier warrants a 20% adder to the electricity bill.
• Tier 2: 80% resilience is worth 1.5 times the normal price paid for electricity. In other words, energy resilience that is provisioned at least 80% of the time for priority loads is worth 1.5 times the average price paid for electricity. Given that the typical facility has a Tier 2 load that is about 15% of the total load, applying the 1.5x VOR Tier 2 multiplier warrants a 7.5% adder to the electricity bill.
• Tier 3: Although a standard-size Solar Microgrid can provide backup power to Tier 3 loads a substantial percentage of the time, Tier 3 loads are by definition discretionary, and therefore, a Tier 3 VOR multiplier is negligible and assumed to be zero.
Taken together, the Tier 1 and Tier 2 premiums for a standard load tiering situation yields an effective VOR of between 25% and 30%. Hence, the Clean Coalition uses 25% as the typical VOR123 adder that a site should be willing to pay, including for indefinite renewables-driven backup power to critical loads — along with renewables-driven backup for the rest of the loads for significant percentages of time.

Making Clean Local Energy Accessible Now 35
0
10
20
30
40
50
60
70
80
90
100
0 10 20 30 40 50 60 70 80 90 100
Tier 1 = Critical load, ~10% of
total loadP
erc
en
tag
e o
f to
tal lo
ad
Percentage of time
Tier 3 = Discretionary load, ~75% of total
load
Tier 1 = Critical, life-sustaining load, ~10% of total load
Tier 2 = Priority load, ~15% of total
load
Percentage of time online for Tier 1, 2, and 3 loads for a Solar Microgrid
designed for the University of California Santa Barbara (UCSB) with enough
solar to achieve net zero and 200 kWh of energy storage per 100 kW solar.
Typical load tier resilience from a Solar Microgrid
Making Clean Local Energy Accessible Now 36
0
10
20
30
40
50
60
70
80
90
100
0 10 20 30 40 50 60 70 80 90 100
Tier 1 = Critical load, ~10% of
total loadP
erc
en
tag
e o
f to
tal lo
ad
Percentage of time
Tier 3 = Discretionary load, ~75% of total
load
Tier 1 = Critical, life-sustaining load, ~10% of total load
Tier 2 = Priority load, ~15% of total
load
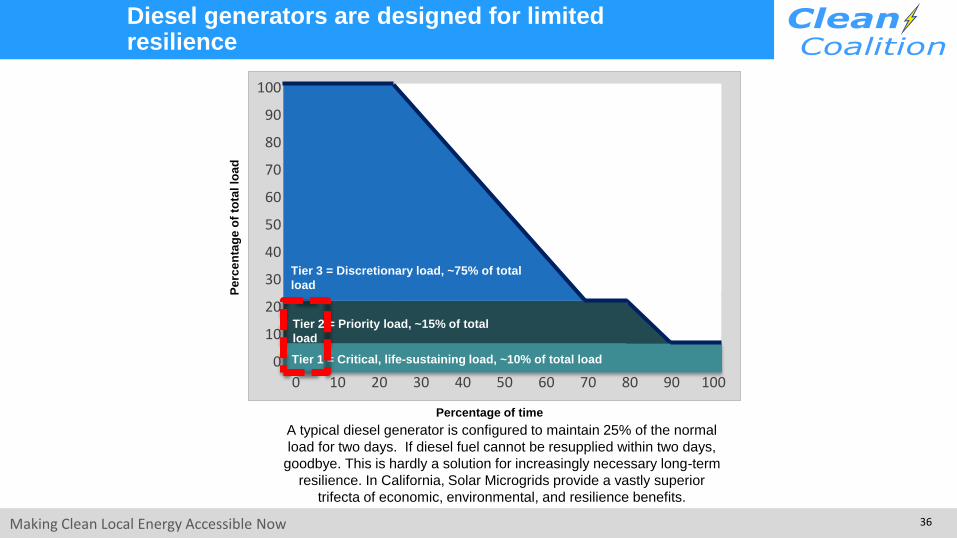
A typical diesel generator is configured to maintain 25% of the normal
load for two days. If diesel fuel cannot be resupplied within two days,
goodbye. This is hardly a solution for increasingly necessary long-term
resilience. In California, Solar Microgrids provide a vastly superior
trifecta of economic, environmental, and resilience benefits.
Diesel generators are designed for limited resilience

Making Clean Local Energy Accessible Now 37
Natural gas infrastructure is not resilient
• Assertion: Gas-driven generation is
often claimed to be resilient.
• Reality: Gas infrastructure is not resilient
and takes much longer to restore than
electricity infrastructure.
• Threats: Gas infrastructure can be flat-
out dangerous and is highly vulnerable to
earthquakes, fires, landslides, and terrorism.
0 0 0 0 2.5 510
30
65
100
5
25
60
95 97 98.5 100 100 100 100
Service Restoration Timeframes (M7.9
Earthquake)
Gas Electricity
60%
electric
60% gas
restoration
takes 30 times
Source: The City and County of San Francisco Lifelines Study
2010 San Bruno Pipeline Explosion

Making Clean Local Energy Accessible Now 38
Validating VOR123 – four confirming approaches
Prototypical Average Tier 1 Tier 1 kWh/year missed
DOE-derived
VOR Total 2019 DOE-derived VOR
School Load (kW) (72 hours/year) ($117/kWh) electricity spend % of 2019 spend
Franklin ES 4.7 336 $39,256 $70,000 56%
La Cumbre JHS 2.8 202 $23,587 $78,000 30%
San Marcos HS 4.4 314 $36,729 $188,000 20%
Totals 11.8 851 $99,572 $336,000 30%
DOE Multiplier results for SBUSD prototype schools
Importantly, the Clean Coalition has resolved on the general 25% premium figure after conducting numerous analytical approaches, including the following three primary methodologies:
1. Cost-of-service (COS): This is the cost that suppliers will charge in order to offer the Solar Microgrid VOR across the Tier 1, 2, and 3 loads (VOR123). As evidenced by a case study of the Santa Barbara Unified School District (SBUSD), a COS that reflects a 25% resilience adder is sufficient to attract economically viable Solar Microgrids at the larger school sites.
2. Department of Energy (DOE) Multiplier: The DOE researched VOR and determined that the overall value of critical load that is missed due to grid outages over an annual period is $117/kWh. While the Clean Coalition stages Solar Microgrids to provide indefinite solar-driven backup power to critical loads, and considers 30 consecutive days to be a proxy for indefinite, the Clean Coalition assumed a conservative annual cumulative outage time of 3 days for the DOE Multiplier VOR analysis. The SBUSD case study yielded an overall 30% VOR adder to the 2019 electricity spend, as indicated in the table below.

Making Clean Local Energy Accessible Now 39
3. Market-Based: This is essentially the market price, where supply meets demand, and the Direct Relief Solar Microgrid provides a local case study. Direct Relief has deployed a 320 kW PV and 676 kWh BESS Solar Microgrid, and while the PV is purchased via a roughly breakeven PPA, the BESS is leased at an annual cost of $37,500. While the size of the Direct Relief BESS (676 kWh) is a bit smaller than the size of the San Marcos Solar Microgrid BESS (710 kWh), Direct Relief is paying a bit more ($37,500/year) than the DOE Multiplier would value the San Marcos BESS ($36,729/year, as shown in Table 2-2).
320 kW PV
676 kWh BESS
Direct Relief Solar Microgrid
Validating VOR123 – four confirming approaches

Making Clean Local Energy Accessible Now 40
Validating VOR123 – four confirming approaches
4. Avoided Diesel Generator Cost: This approach is analogous to the previous cost-of-service (COS) approach, except it calculates the adder needed for a diesel generator to fulfill the VOR123 level of resilience. For this calculation, we equate “indefinite backup” to 30 days, and assume such a grid outage occurs once per year, during which the loads need to be maintained according to the standard VOR123 profile. The result, for a diesel backup system sized for a 1 million kWh/year site in Santa Barbara, is a 21 % adder to the electricity bill.
Site Load InputsTotal Site Annual Load (kWh) 1,000,000
Outage Duration (days) 30Number of outages/year 1Average cost of utility-purchased electricity ($/kWh) $0.18
Average Site Power (kW) 114
Yearly cost of utility-purchased electricity $180,000
VOR123 Parameters
Tier 1 % of time 100%
Tier 2 % of time 80%
Tier 3 % of time 30%
Tier 1 % of load 10%
Tier 2 % of load 15%
Tier 3 % of load 75%
TCLR (kWh) 36,575
Diesel Genset Size Check
Diesel genset size (kW) 200
Peak load (kW) 171
Diesel Tank Capacity CheckDiesel genset tank capacity (gallons) 3,000
Diesel used for TCLR (gallons) 3,040
FinancialsDiesel Genset Depreciation Life (years) 15
Diesel Genset Capex $350,000
Diesel Genset Opex ($/year) $14,694 Diesel Genset Depreciated Capex ($/year) $23,333 Diesel Genset Total Yearly Cost $38,027
Cost of Diesel Genset backup energy ($/kWh) $1.04 % adder of Diesel backup cost on top of utility-purchased electricity 21%

Making Clean Local Energy Accessible Now 41
GLP Community Microgrid case study
Goleta Load Pocket (GLP)
Community Microgrid
case study

Making Clean Local Energy Accessible Now 42
Goleta Load Pocket (GLP) and attaining resilience
The GLP is the perfect opportunity for a comprehensive Community Microgrid
• GLP spans 70 miles of California coastline, from Point Conception to Lake Casitas,
encompassing the cities of Goleta, Santa Barbara (including Montecito), and Carpinteria.
• GLP is highly transmission-vulnerable and disaster-prone (fire, landslide, earthquake).
• 200 megawatts (MW) of solar and 400 megawatt-hours (MWh) of energy storage will
provide 100% protection to GLP against a complete transmission outage (“N-2 event”).
• 200 MW of solar is equivalent to about 5 times the amount of solar currently deployed in the GLP and
represents about 25% of the energy mix.
• Multi-GWs of solar siting opportunity exists on commercial-scale built environments like parking lots,
parking structures, and rooftops; and 200 MW represents about 7% of the technical siting potential.
• Other resources like energy efficiency, demand response, and offshore wind can significantly reduce
solar+storage requirements.
Making Clean Local Energy Accessible Now 43
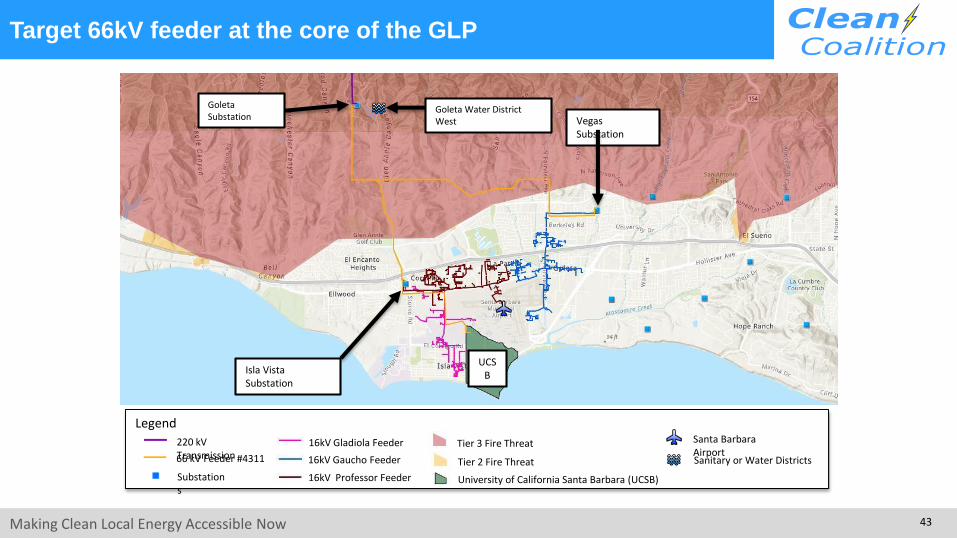
Target 66kV feeder at the core of the GLP
Legend
16kV Gladiola Feeder
Substations
16kV Gaucho Feeder
16kV Professor Feeder University of California Santa Barbara (UCSB)
Santa Barbara Airport
Tier 3 Fire Threat
Tier 2 Fire Threat
220 kV Transmission66 kV Feeder #4311 Sanitary or Water Districts
Goleta Substation
Goleta Water District West
Isla Vista Substation
Vegas Substation
UCSB

Making Clean Local Energy Accessible Now 44
Target 66kV feeder grid area block diagram
Isla Vista
Substation
(66-to-16kV)
Fire Station
#17
66kV underground
interconnection
Vegas
Substation (66-to-16kV)
UCSB
+ Solar
SBA (runway
lights & ATC)
Direct Relief
+ Solar
Microgrid
SBA (Main
Terminal)
Goleta
Sanitary
District
Goleta
Substation (220-to-66kV)
Diagram Elements
66 kV Distribution Feeder #4311
16 kV Gladiola Feeder
16 kV Gaucho Feeder
16 kV Professor Feeder
Planned 160-240 MWh Battery
Grid isolation switch (open, closed)
Smart meter switch (open, closed)
Fire Station
#8
66kV distribution feeder #4311 with multiple branches
Deckers
+ Solar
Microgrid
Tier 2 & 3
facilities
Tier 2 & 3
facilities
Tier 2 & 3
facilities
160+ MWh battery
Goleta Substation
has eight feeders,
all 66kV, that
serve the entire
GLP
Tier 2 & 3
facilities
Making Clean Local Energy Accessible Now 45
SBUSD case study
Santa Barbara Unified School District (SBUSD)
case study

Making Clean Local Energy Accessible Now 46
Santa Barbara Unified School District (SBUSD)
• The entire Santa Barbara region is surrounded by extreme fire risk (earthquake & landslide risk too) and is extremely vulnerable to electricity grid outages.
• The SBUSD is a major school district that increasingly recognizes the value-of-resilience (VOR) and has embraced the Clean Coalition’s vision to implement Solar Microgrids at a number of its key schools and other critical facilities.
• SMHS is in the middle of the extensive SBUSD service area.

Making Clean Local Energy Accessible Now 47
Six SBUSD Solar Microgrid sites

Making Clean Local Energy Accessible Now 48
Guaranteed SBUSD bill savings and free VOR
Making Clean Local Energy Accessible Now 49
VGES Community Microgrid opportunity
Valencia Gardens Energy Storage (VGES)
Community Microgrid opportunity
Making Clean Local Energy Accessible Now 50
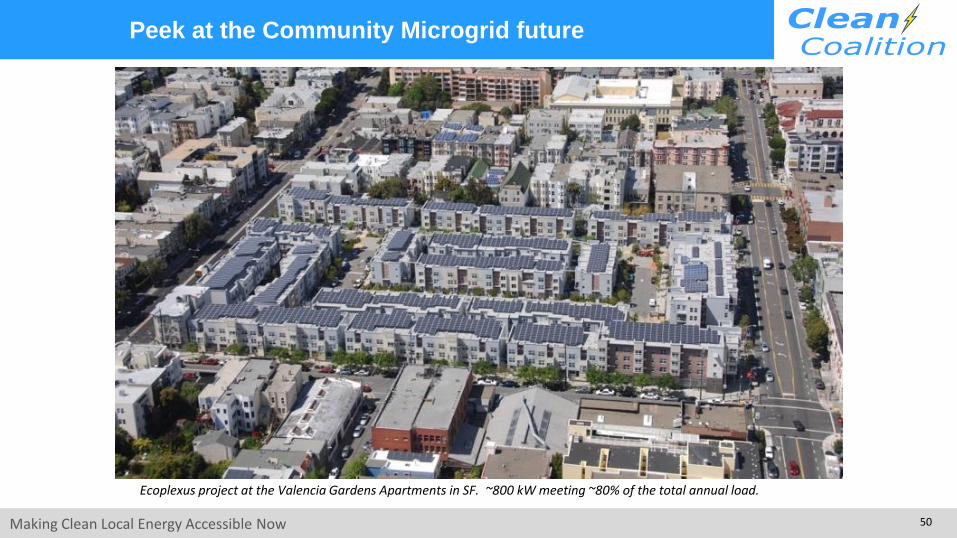
Ecoplexus project at the Valencia Gardens Apartments in SF. ~800 kW meeting ~80% of the total annual load.
Peek at the Community Microgrid future

Making Clean Local Energy Accessible Now 51
VGES pathway to Community Microgrid
VGES can be upgraded to a full Community Microgrid
via a single Grid Isolation Switch

QUESTIONS
Submit questions two ways:
1. Raise your hand and the moderator will call on you to unmute your lineEnter your PIN – click Audio to see it
2. Type a question into the question box
2
1
This concludes the webinar.
NARUC-NASEO Microgrids State Working Group members are invited to remain for a brief members-only discussion.
53
THANK YOU