Embed Size (px)
Citation preview
The 2013 Update
Country profiles featuring core indicators selected by the Commission on Information and Accountability for Women’s and Children’s Health
Accountability for Maternal, Newborn
& Child Survival
Accountability for maternal, newborn and child survival: The 2013 Update
ISBN: 978-92-806-4690-0
© World Health Organization and UNICEF 2013
All rights reserved. Publications of the World Health Organization are available on the WHO web site (www.who.int) or can be purchased from WHO Press, World Health Organization, 20 Avenue Appia, 1211 Geneva 27, Switzerland (tel.: +41 22 791 3264; fax: +41 22 791 4857; e-mail: [email protected]).
Requests for permission to reproduce or translate WHO publications – whether for sale or for noncommercial distribution – should be addressed to WHO Press through the WHO web site (http://www.who.int/about/licensing/copyright_form/en/index.html).
The designations employed and the presentation of the material in this publication do not imply the expression of any opinion whatsoever on the part of the World Health Organization concerning the legal status of any country, territory, city or area or of its authorities, or concerning the delimitation of its frontiers or boundaries. Dotted lines on maps represent approximate border lines for which there may not yet be full agreement.
The mention of specific companies or of certain manufacturers’ products does not imply that they are endorsed or recommended by the World Health Organization in preference to others of a similar nature that are not mentioned. Errors and omissions excepted, the names of proprietary products are distinguished by initial capital letters.
All reasonable precautions have been taken by the World Health Organization to verify the information contained in this publication. However, the published material is being distributed without warranty of any kind, either expressed or implied. The responsibility for the interpretation and use of the material lies with the reader. In no event shall the World Health Organization be liable for damages arising from its use.
This publication has been prepared to facilitate the exchange of knowledge and to stimulate discussion. The logos that appear on the back cover represent the institutional affiliations of individual participants in report preparation and do not imply institutional endorsement of the contents or recommendations or approval of any specific intervention for which data are included. Implementation of specific intervention is dependent on the legal context in each country. While all reasonable precautions have been taken to verify the information contained in this publication, Countdown partners accept no responsibility for errors.
Cover Photo: UN Photo/John Isaac
www.countdown2015mnch.org
The 2013 Update
Accountability for Maternal, Newborn & Child Survival
ContributorsCountdown to 2015 developed this annual report, in support of the recommendations of the Commission on Information and Accountability for Women’s and Children’s Health and the ongoing work of the independent Expert Review Group (iERG), to help ensure accountability for commitments to the Global Strategy for Women’s and Children’s Health.
Lead writing team: Jennifer Requejo (PMNCH), Jennifer Bryce (JHSPH), Cesar Victora (Federal University of Pelotas), Adam Deixel (Family Care International)
Profile development team: Tessa Wardlaw (UNICEF), Archana Dwivedi (UNICEF), Colleen Murray (UNICEF)
Production team: Adam Deixel (FCI), Virginia Taddoni (FCI), Jennifer Requejo (PMNCH)
Design: Virginia Taddoni and Sandy Zimmerman (FCI)
AcknowledgementsCountdown to 2015 would like to thank the following:
• UNICEF Statistics and Monitoring Section for use of the global databases, preparation of country profiles and review of report text; particular recognition goes to Priscilla Idele and Tyler Andrew Porth for their help with the HIV indicators, Liliana Carvajal for her help with the child and maternal health indicators, Danzhen You for her help with the child mortality data, and Colleen Murray for her help with the databases.
• Elizabeth Hazel and Emily Wilson (JHSPH) for their help with analysis of the coverage data; Aluisio Barros, Giovanny França, Maria Clara Restrepo and Andrea Damaso (Federal University of Pelotas) for their work on the equity data and graphs.
• DevInfo for its work on developing the profiles.
• The Countdown Scientific Review Group for its inputs in shaping the report: Cesar Victora (chair, Federal University of Pelotas), Jennifer Bryce (JHSPH), Jennifer Requejo (PMNCH), Joy Lawn (LSHTM), Bernadette Daelmans (WHO), Peter Berman (HSPH), Archana Dwivedi (UNICEF), Andres de Francisco (PMNCH), Monica Fox (JHSPH).
• The Countdown Leadership Sub Group for its oversight of the report development process: Mickey Chopra (UNICEF, co-chair), Zulfiqar Bhutta (Aga Khan University, co-chair), Liz Mason (WHO), Carole Presern (PMNCH), Ann Starrs (FCI), Cesar Victora (Federal University of Pelotas), Archana Dwivedi (UNICEF), Jennifer Requejo (PMNCH).
• Joy Lawn (LSHTM) for her contributions to the newborn report text; Robert E. Black (JHSPH) for his inputs on the nutrition and child mortality report text; Justine Hsu (WHO) for her review of the report text on financial flows to reproductive health; Ties Boerma for his review of the report text.
• The Coverage Technical Working Group for its review of the report text: Jennifer Bryce (co-chair, JHSPH), Holly Newby (co-chair, UNICEF), Tessa Wardlaw (UNICEF), Doris Chou (WHO), Sennen Hounton (UNFPA), Jennifer Requejo (PMNCH), Nancy Terreri (consultant), James Tibenderana (Malaria Consortium), Allisyn Moran (USAID), Steve Hodgins (Saving Newborn Lives), Shams el Arifeen (icddr,b), Archana Dwivedi (UNICEF), Donation Beguy (APHRC), Jocelyn DeJong (AUB), Huda Zurayk (AUB).
• The PMNCH Countdown Secretariat for providing administrative, technical and logistical support, including coordinating and contributing to Countdown activities and promoting the dissemination of Countdown products. Particular recognition goes to Nacer Tarif and Nick Green for providing administrative support.
• The Bill & Melinda Gates Foundation, The World Bank, and the Governments of Australia, Canada, Norway, Sweden, and the United Kingdom for their support for Countdown to 2015.
AccountAbility for MAternAl, newborn & child SurvivAl: The 2013 UpdaTe ACCoUNTAbiliTy for MATerNAl, NewborN & Child SUrvivAl: The 2013 UpdaTe
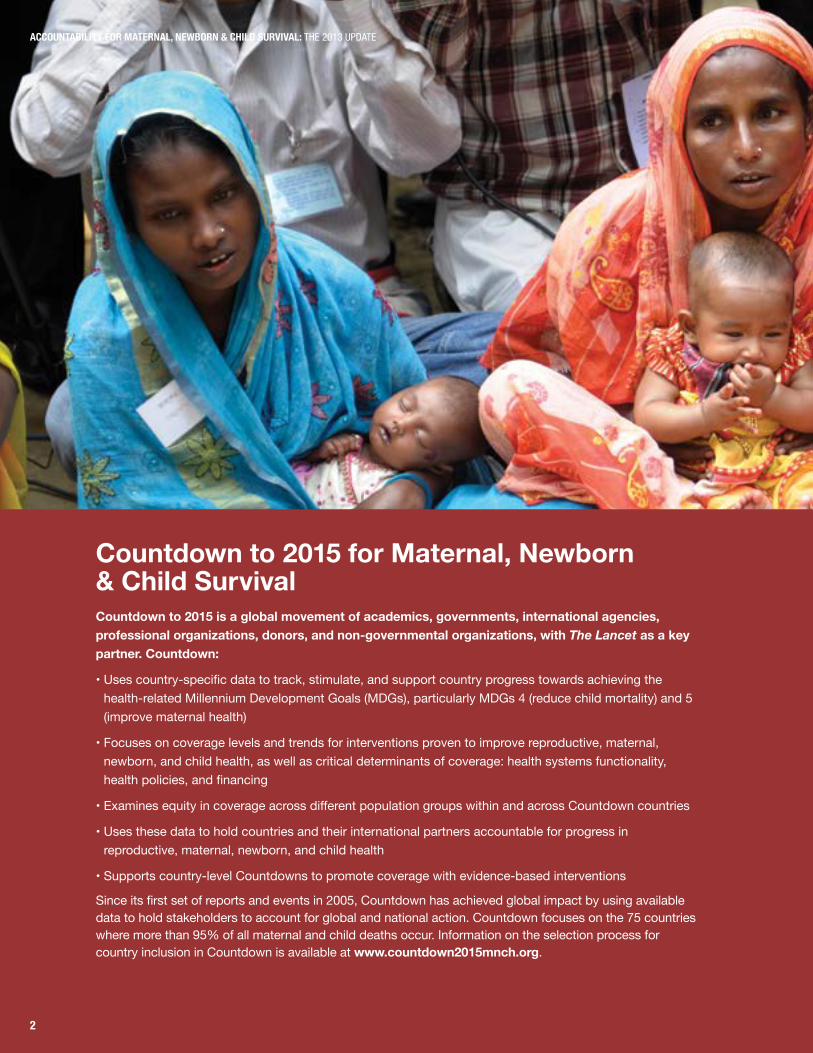
Countdown to 2015 for Maternal, Newborn & Child SurvivalCountdown to 2015 is a global movement of academics, governments, international agencies, professional organizations, donors, and non-governmental organizations, with The Lancet as a key partner. Countdown:
• Uses country-specific data to track, stimulate, and support country progress towards achieving the health-related Millennium Development Goals (MDGs), particularly MDGs 4 (reduce child mortality) and 5 (improve maternal health)
• Focuses on coverage levels and trends for interventions proven to improve reproductive, maternal, newborn, and child health, as well as critical determinants of coverage: health systems functionality, health policies, and financing
• Examines equity in coverage across different population groups within and across Countdown countries
• Uses these data to hold countries and their international partners accountable for progress in reproductive, maternal, newborn, and child health
• Supports country-level Countdowns to promote coverage with evidence-based interventions
Since its first set of reports and events in 2005, Countdown has achieved global impact by using available data to hold stakeholders to account for global and national action. Countdown focuses on the 75 countries where more than 95% of all maternal and child deaths occur. Information on the selection process for country inclusion in Countdown is available at www.countdown2015mnch.org.
2
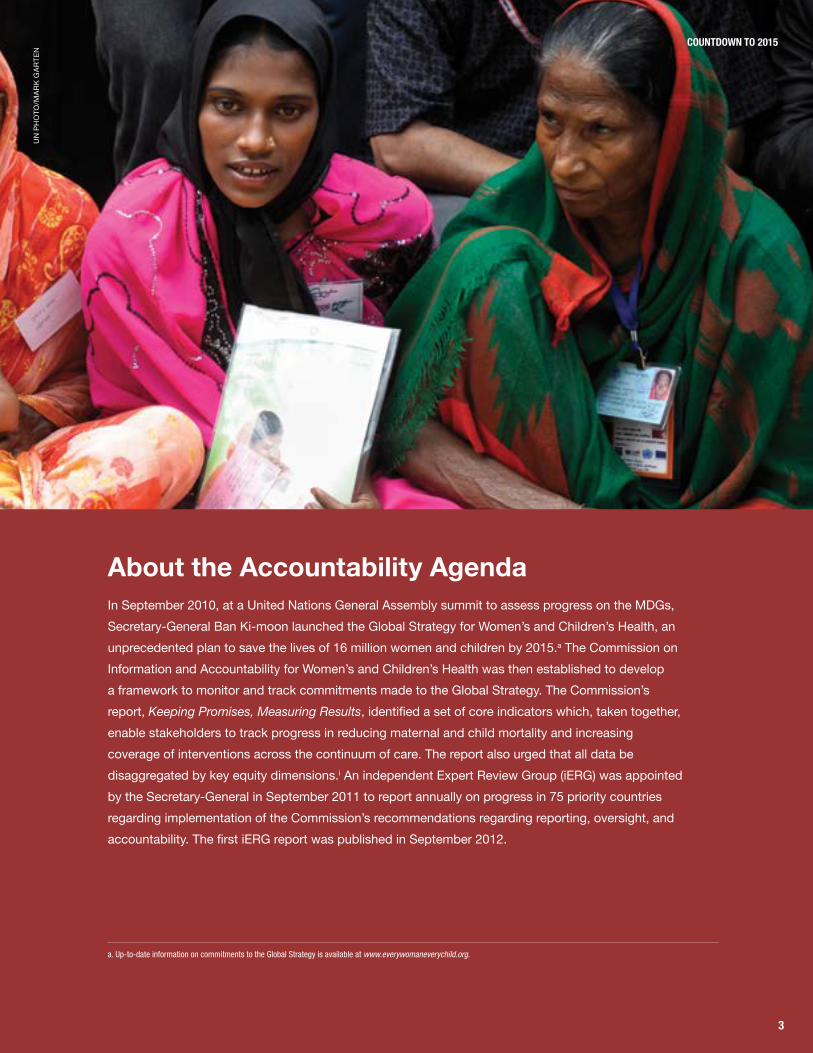
About the Accountability AgendaIn September 2010, at a United Nations General Assembly summit to assess progress on the MDGs, Secretary-General Ban Ki-moon launched the Global Strategy for Women’s and Children’s Health, an unprecedented plan to save the lives of 16 million women and children by 2015.a The Commission on Information and Accountability for Women’s and Children’s Health was then established to develop a framework to monitor and track commitments made to the Global Strategy. The Commission’s report, Keeping Promises, Measuring Results, identified a set of core indicators which, taken together, enable stakeholders to track progress in reducing maternal and child mortality and increasing coverage of interventions across the continuum of care. The report also urged that all data be disaggregated by key equity dimensions.i An independent Expert Review Group (iERG) was appointed by the Secretary-General in September 2011 to report annually on progress in 75 priority countries regarding implementation of the Commission’s recommendations regarding reporting, oversight, and accountability. The first iERG report was published in September 2012.
a. Up-to-date information on commitments to the Global Strategy is available at www.everywomaneverychild.org.
CoUNTdowN To 2015U
N P
HO
TO/M
ARK
GAR
TEN
3
4
ACCoUNTAbiliTy for MATerNAl, NewborN & Child SUrvivAl: The 2013 UpdaTe
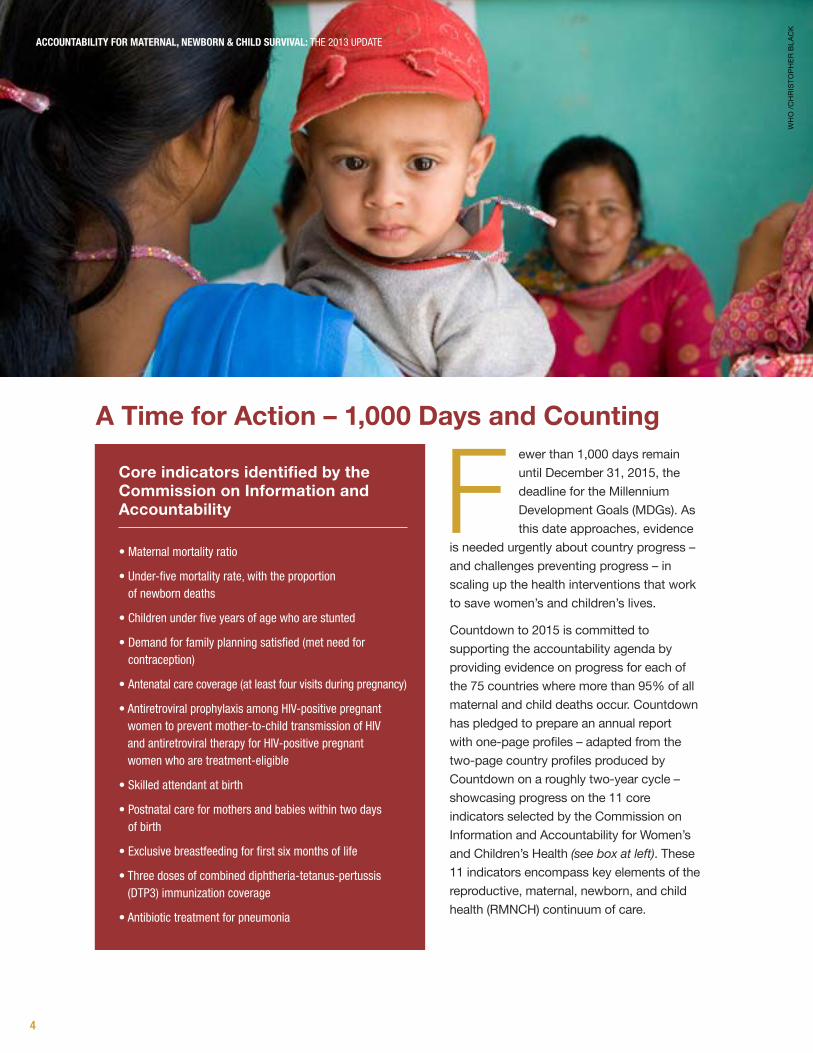
A Time for Action – 1,000 Days and Countingewer than 1,000 days remain until December 31, 2015, the deadline for the Millennium Development Goals (MDGs). As this date approaches, evidence
is needed urgently about country progress – and challenges preventing progress – in scaling up the health interventions that work to save women’s and children’s lives.
Countdown to 2015 is committed to supporting the accountability agenda by providing evidence on progress for each of the 75 countries where more than 95% of all maternal and child deaths occur. Countdown has pledged to prepare an annual report with one-page profiles – adapted from the two-page country profiles produced by Countdown on a roughly two-year cycle – showcasing progress on the 11 core indicators selected by the Commission on Information and Accountability for Women’s and Children’s Health (see box at left). These 11 indicators encompass key elements of the reproductive, maternal, newborn, and child health (RMNCH) continuum of care.
FCore indicators identified by the Commission on Information and Accountability
• Maternal mortality ratio
• Under-five mortality rate, with the proportion of newborn deaths
• Children under five years of age who are stunted
• demand for family planning satisfied (met need for contraception)
• antenatal care coverage (at least four visits during pregnancy)
• antiretroviral prophylaxis among hIV-positive pregnant women to prevent mother-to-child transmission of hIV and antiretroviral therapy for hIV-positive pregnant women who are treatment-eligible
• Skilled attendant at birth
• postnatal care for mothers and babies within two days of birth
• exclusive breastfeeding for first six months of life
• Three doses of combined diphtheria-tetanus-pertussis (dTp3) immunization coverage
• antibiotic treatment for pneumonia
WH
O /C
HR
ISTO
PHER
BLA
CK

5
Countdown to 2015
The results in this report highlight country achievements in increasing coverage of key interventions, and identify remaining challenges many countries face in reaching all women and children with life-saving services. The key findings include:• Across most of the Countdown countries, levels
of maternal and child mortality have both been dropping over the past two decades. But in some countries, particularly in sub-Saharan Africa where fertility levels typically remain high, progress has been slower. These countries must be prioritized for collective global, regional, and national action.
• Child deaths are increasingly concentrated in the first month of life. Newborn deaths now account for 40% or more of all child deaths in 35 of the Countdown countries. Improving newborn survival, including reducing stillbirths, must be a major focus of policies and programs.
• Undernutrition, in a synergistic relationship with infectious diseases, contributes to almost half of all child deaths. Levels of stunting, a form of growth failure resulting from chronic undernutrition, remain unacceptably high in virtually all 75 countries. Nutrition must continue to be emphasized as an essential ingredient of maternal, newborn, and child survival programs.
• Wide variations in coverage for interventions addressed by the Commission indicators, both across and within Countdown countries, show the importance of equity as a core component of all health strategies. Global and national efforts must focus on reaching the poorest and other vulnerable sub-groups of the population.
• High levels of fertility and unmet need for family planning in many Countdown countries highlight the need to broaden access to contraception. The global community has woken up to this need, and the growing political momentum must be translated into substantially increased resources.
Significant challenges remain before us. High population growth remains a looming obstacle to progress in countries where health systems are least equipped to respond to escalations in demand, and pervasive inequities must be addressed if we are to fulfill the promise of MDGs 4 and 5 for millions of women and children.
But, ultimately, this report is about hope. The country profiles contain many success stories which show that commitment, investment, and coordinated action can result in concrete achievements that will save countless lives.
Now is the time to learn from these success stories, and to act based on the evidence. Generations of women and children are counting on us.
ACCoUNTAbiliTy for MATerNAl, NewborN & Child SUrvivAl: The 2013 UpdaTe
UN
PH
OTO
/MAR
K G
ARTE
N
7
Countdown to 2015
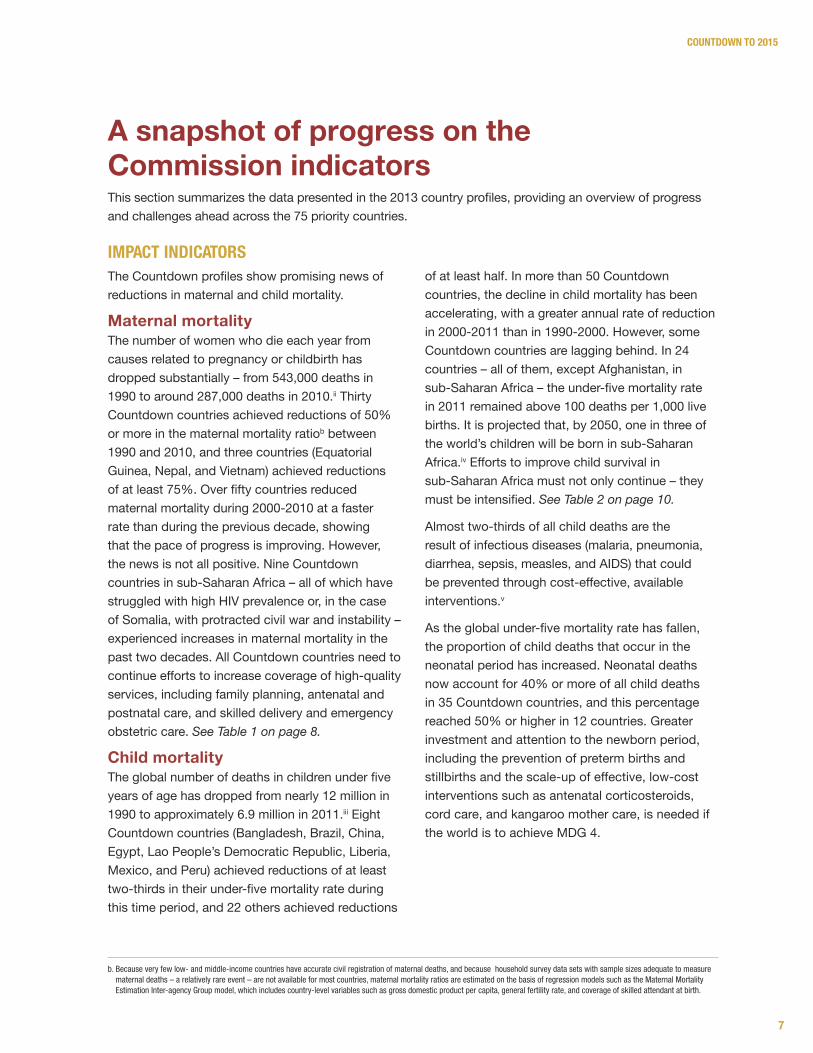
A snapshot of progress on the Commission indicators
iMpACT iNdiCATorS The Countdown profiles show promising news of reductions in maternal and child mortality.
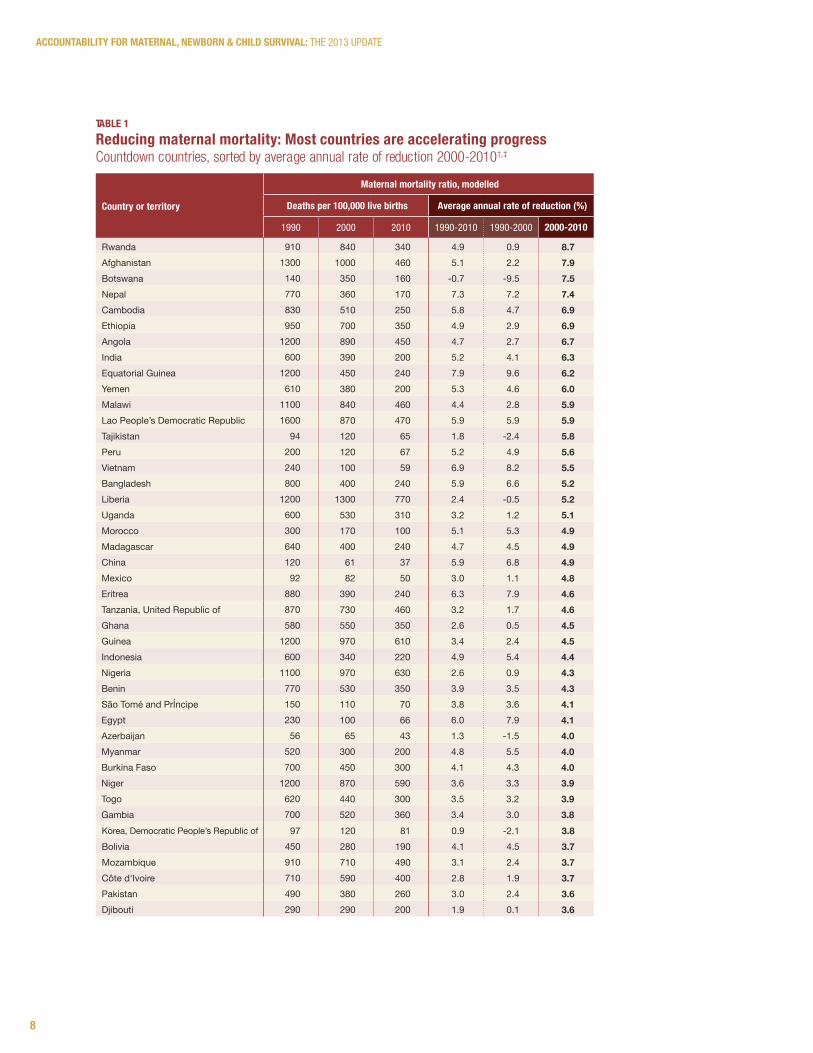
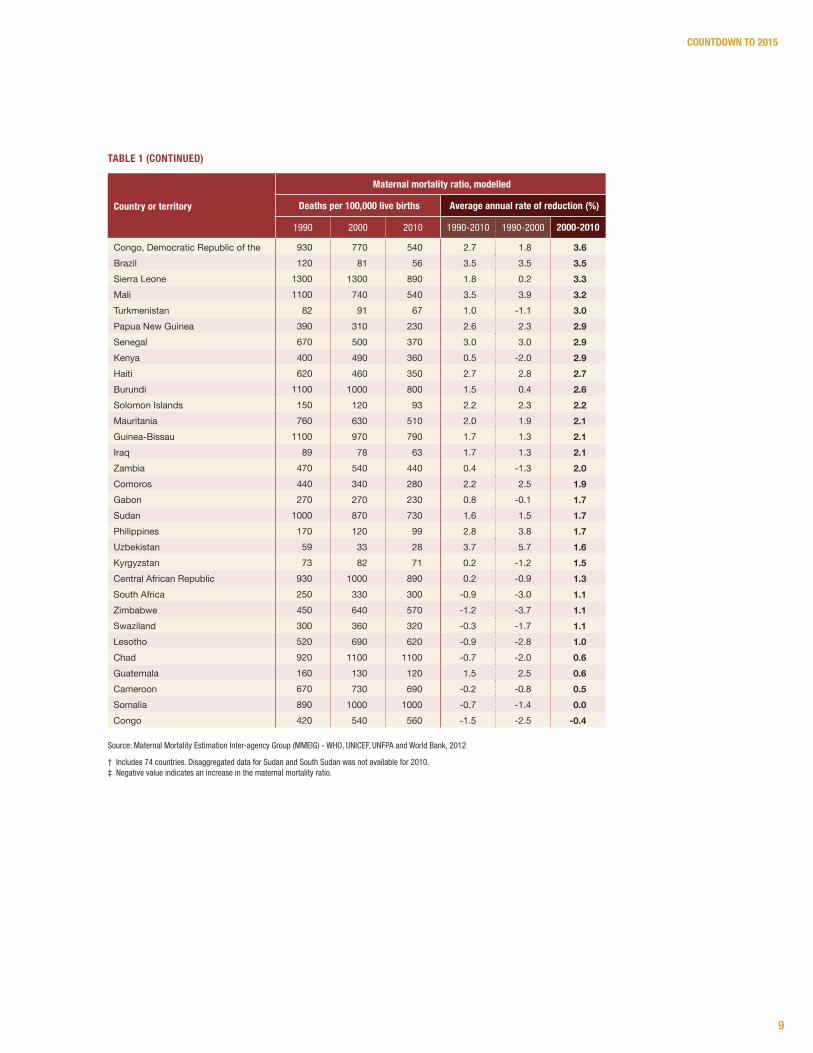
Maternal mortalityThe number of women who die each year from causes related to pregnancy or childbirth has dropped substantially – from 543,000 deaths in 1990 to around 287,000 deaths in 2010.ii Thirty Countdown countries achieved reductions of 50% or more in the maternal mortality ratiob between 1990 and 2010, and three countries (Equatorial Guinea, Nepal, and Vietnam) achieved reductions of at least 75%. Over fifty countries reduced maternal mortality during 2000-2010 at a faster rate than during the previous decade, showing that the pace of progress is improving. However, the news is not all positive. Nine Countdown countries in sub-Saharan Africa – all of which have struggled with high HIV prevalence or, in the case of Somalia, with protracted civil war and instability – experienced increases in maternal mortality in the past two decades. All Countdown countries need to continue efforts to increase coverage of high-quality services, including family planning, antenatal and postnatal care, and skilled delivery and emergency obstetric care. See Table 1 on page 8.
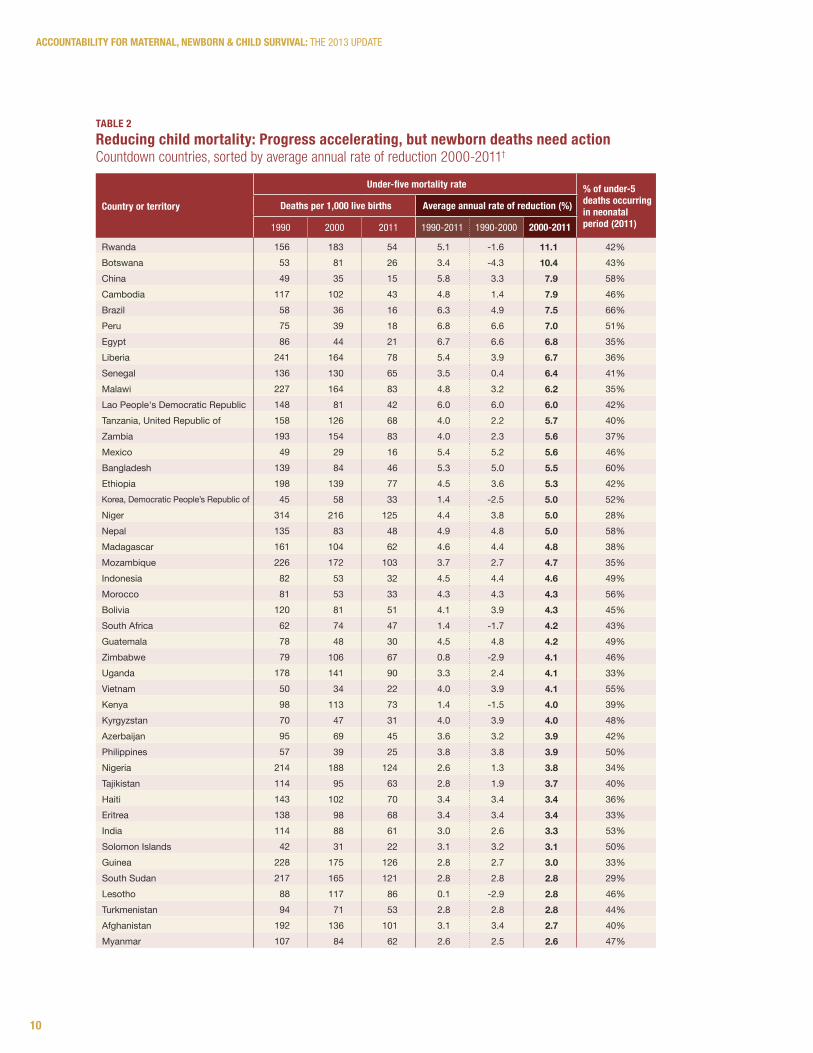
Child mortalityThe global number of deaths in children under five years of age has dropped from nearly 12 million in 1990 to approximately 6.9 million in 2011.iii Eight Countdown countries (Bangladesh, Brazil, China, Egypt, Lao People’s Democratic Republic, Liberia, Mexico, and Peru) achieved reductions of at least two-thirds in their under-five mortality rate during this time period, and 22 others achieved reductions
of at least half. In more than 50 Countdown countries, the decline in child mortality has been accelerating, with a greater annual rate of reduction in 2000-2011 than in 1990-2000. However, some Countdown countries are lagging behind. In 24 countries – all of them, except Afghanistan, in sub-Saharan Africa – the under-five mortality rate in 2011 remained above 100 deaths per 1,000 live births. It is projected that, by 2050, one in three of the world’s children will be born in sub-Saharan Africa.iv Efforts to improve child survival in sub-Saharan Africa must not only continue – they must be intensified. See Table 2 on page 10.
Almost two-thirds of all child deaths are the result of infectious diseases (malaria, pneumonia, diarrhea, sepsis, measles, and AIDS) that could be prevented through cost-effective, available interventions.v
As the global under-five mortality rate has fallen, the proportion of child deaths that occur in the neonatal period has increased. Neonatal deaths now account for 40% or more of all child deaths in 35 Countdown countries, and this percentage reached 50% or higher in 12 countries. Greater investment and attention to the newborn period, including the prevention of preterm births and stillbirths and the scale-up of effective, low-cost interventions such as antenatal corticosteroids, cord care, and kangaroo mother care, is needed if the world is to achieve MDG 4.
b. Because very few low- and middle-income countries have accurate civil registration of maternal deaths, and because household survey data sets with sample sizes adequate to measure maternal deaths – a relatively rare event – are not available for most countries, maternal mortality ratios are estimated on the basis of regression models such as the Maternal Mortality estimation Inter-agency Group model, which includes country-level variables such as gross domestic product per capita, general fertility rate, and coverage of skilled attendant at birth.
This section summarizes the data presented in the 2013 country profiles, providing an overview of progress and challenges ahead across the 75 priority countries.
8
AccountAbility for MAternAl, newborn & child SurvivAl: The 2013 UpdaTe
TAble 1reducing maternal mortality: Most countries are accelerating progressCountdown countries, sorted by average annual rate of reduction 2000-2010†,‡
Country or territory
Maternal mortality ratio, modelled
deaths per 100,000 live births Average annual rate of reduction (%)
1990 2000 2010 1990-2010 1990-2000 2000-2010
Rwanda 910 840 340 4.9 0.9 8.7Afghanistan 1300 1000 460 5.1 2.2 7.9Botswana 140 350 160 -0.7 -9.5 7.5Nepal 770 360 170 7.3 7.2 7.4Cambodia 830 510 250 5.8 4.7 6.9Ethiopia 950 700 350 4.9 2.9 6.9Angola 1200 890 450 4.7 2.7 6.7India 600 390 200 5.2 4.1 6.3Equatorial Guinea 1200 450 240 7.9 9.6 6.2Yemen 610 380 200 5.3 4.6 6.0Malawi 1100 840 460 4.4 2.8 5.9Lao People’s Democratic Republic 1600 870 470 5.9 5.9 5.9Tajikistan 94 120 65 1.8 -2.4 5.8Peru 200 120 67 5.2 4.9 5.6Vietnam 240 100 59 6.9 8.2 5.5Bangladesh 800 400 240 5.9 6.6 5.2Liberia 1200 1300 770 2.4 -0.5 5.2Uganda 600 530 310 3.2 1.2 5.1Morocco 300 170 100 5.1 5.3 4.9Madagascar 640 400 240 4.7 4.5 4.9China 120 61 37 5.9 6.8 4.9Mexico 92 82 50 3.0 1.1 4.8Eritrea 880 390 240 6.3 7.9 4.6Tanzania, United Republic of 870 730 460 3.2 1.7 4.6Ghana 580 550 350 2.6 0.5 4.5Guinea 1200 970 610 3.4 2.4 4.5Indonesia 600 340 220 4.9 5.4 4.4Nigeria 1100 970 630 2.6 0.9 4.3Benin 770 530 350 3.9 3.5 4.3São Tomé and PrÍncipe 150 110 70 3.8 3.6 4.1Egypt 230 100 66 6.0 7.9 4.1Azerbaijan 56 65 43 1.3 -1.5 4.0Myanmar 520 300 200 4.8 5.5 4.0Burkina Faso 700 450 300 4.1 4.3 4.0Niger 1200 870 590 3.6 3.3 3.9Togo 620 440 300 3.5 3.2 3.9Gambia 700 520 360 3.4 3.0 3.8Korea, Democratic People’s Republic of 97 120 81 0.9 -2.1 3.8Bolivia 450 280 190 4.1 4.5 3.7Mozambique 910 710 490 3.1 2.4 3.7Côte d'Ivoire 710 590 400 2.8 1.9 3.7Pakistan 490 380 260 3.0 2.4 3.6Djibouti 290 290 200 1.9 0.1 3.6
9
Countdown to 2015
Congo, Democratic Republic of the 930 770 540 2.7 1.8 3.6Brazil 120 81 56 3.5 3.5 3.5Sierra Leone 1300 1300 890 1.8 0.2 3.3Mali 1100 740 540 3.5 3.9 3.2Turkmenistan 82 91 67 1.0 -1.1 3.0Papua New Guinea 390 310 230 2.6 2.3 2.9Senegal 670 500 370 3.0 3.0 2.9Kenya 400 490 360 0.5 -2.0 2.9Haiti 620 460 350 2.7 2.8 2.7Burundi 1100 1000 800 1.5 0.4 2.6Solomon Islands 150 120 93 2.2 2.3 2.2Mauritania 760 630 510 2.0 1.9 2.1Guinea-Bissau 1100 970 790 1.7 1.3 2.1Iraq 89 78 63 1.7 1.3 2.1Zambia 470 540 440 0.4 -1.3 2.0Comoros 440 340 280 2.2 2.5 1.9Gabon 270 270 230 0.8 -0.1 1.7Sudan 1000 870 730 1.6 1.5 1.7Philippines 170 120 99 2.8 3.8 1.7Uzbekistan 59 33 28 3.7 5.7 1.6Kyrgyzstan 73 82 71 0.2 -1.2 1.5Central African Republic 930 1000 890 0.2 -0.9 1.3South Africa 250 330 300 -0.9 -3.0 1.1Zimbabwe 450 640 570 -1.2 -3.7 1.1Swaziland 300 360 320 -0.3 -1.7 1.1Lesotho 520 690 620 -0.9 -2.8 1.0Chad 920 1100 1100 -0.7 -2.0 0.6Guatemala 160 130 120 1.5 2.5 0.6Cameroon 670 730 690 -0.2 -0.8 0.5Somalia 890 1000 1000 -0.7 -1.4 0.0Congo 420 540 560 -1.5 -2.5 -0.4
TAble 1 (CoNTiNUed)
Source: Maternal Mortality estimation Inter-agency Group (MMeIG) - WhO, UNICeF, UNFpa and World Bank, 2012
† Includes 74 countries. disaggregated data for Sudan and South Sudan was not available for 2010.‡ Negative value indicates an increase in the maternal mortality ratio.
Country or territory
Maternal mortality ratio, modelled
deaths per 100,000 live births Average annual rate of reduction (%)
1990 2000 2010 1990-2010 1990-2000 2000-2010
10
AccountAbility for MAternAl, newborn & child SurvivAl: The 2013 UpdaTe
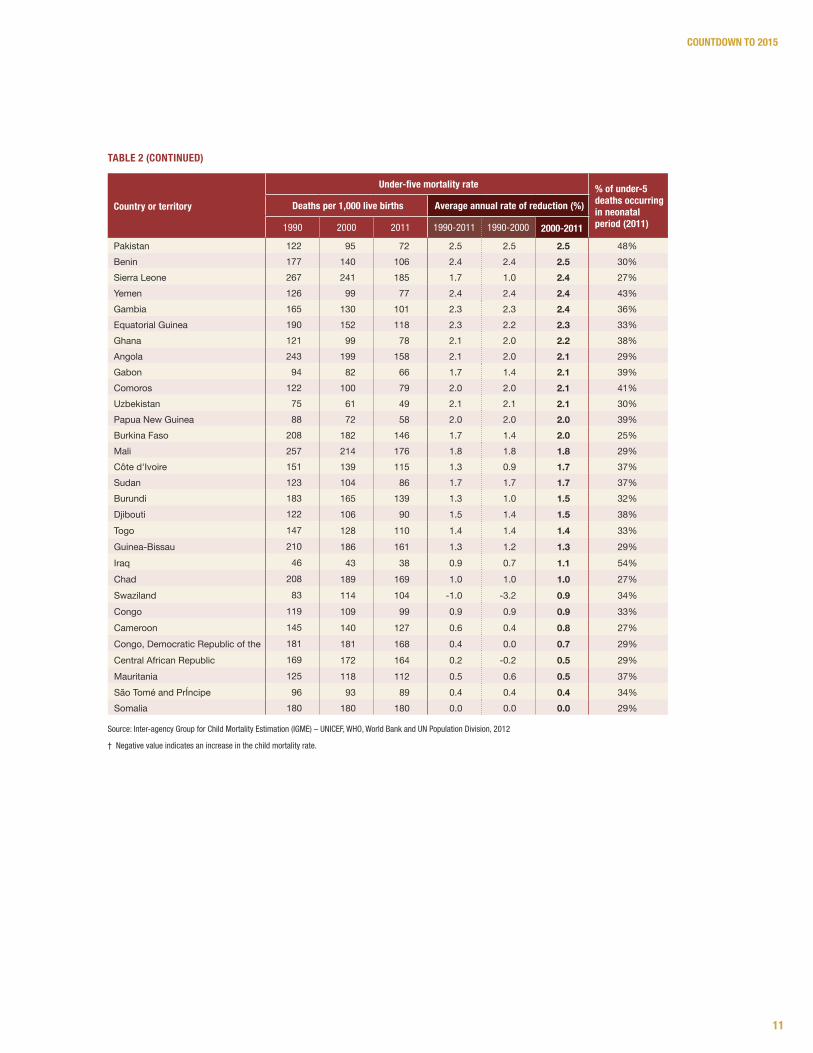
TAble 2reducing child mortality: progress accelerating, but newborn deaths need actionCountdown countries, sorted by average annual rate of reduction 2000-2011†
Country or territory
Under-five mortality rate % of under-5 deaths occurring in neonatal period (2011)
deaths per 1,000 live births Average annual rate of reduction (%)
1990 2000 2011 1990-2011 1990-2000 2000-2011
Rwanda 156 183 54 5.1 -1.6 11.1 42%Botswana 53 81 26 3.4 -4.3 10.4 43%China 49 35 15 5.8 3.3 7.9 58%Cambodia 117 102 43 4.8 1.4 7.9 46%Brazil 58 36 16 6.3 4.9 7.5 66%Peru 75 39 18 6.8 6.6 7.0 51%Egypt 86 44 21 6.7 6.6 6.8 35%Liberia 241 164 78 5.4 3.9 6.7 36%Senegal 136 130 65 3.5 0.4 6.4 41%Malawi 227 164 83 4.8 3.2 6.2 35%Lao People's Democratic Republic 148 81 42 6.0 6.0 6.0 42%Tanzania, United Republic of 158 126 68 4.0 2.2 5.7 40%Zambia 193 154 83 4.0 2.3 5.6 37%Mexico 49 29 16 5.4 5.2 5.6 46%Bangladesh 139 84 46 5.3 5.0 5.5 60%Ethiopia 198 139 77 4.5 3.6 5.3 42%Korea, Democratic People’s Republic of 45 58 33 1.4 -2.5 5.0 52%Niger 314 216 125 4.4 3.8 5.0 28%Nepal 135 83 48 4.9 4.8 5.0 58%Madagascar 161 104 62 4.6 4.4 4.8 38%Mozambique 226 172 103 3.7 2.7 4.7 35%Indonesia 82 53 32 4.5 4.4 4.6 49%Morocco 81 53 33 4.3 4.3 4.3 56%Bolivia 120 81 51 4.1 3.9 4.3 45%South Africa 62 74 47 1.4 -1.7 4.2 43%Guatemala 78 48 30 4.5 4.8 4.2 49%Zimbabwe 79 106 67 0.8 -2.9 4.1 46%Uganda 178 141 90 3.3 2.4 4.1 33%Vietnam 50 34 22 4.0 3.9 4.1 55%Kenya 98 113 73 1.4 -1.5 4.0 39%Kyrgyzstan 70 47 31 4.0 3.9 4.0 48%Azerbaijan 95 69 45 3.6 3.2 3.9 42%Philippines 57 39 25 3.8 3.8 3.9 50%Nigeria 214 188 124 2.6 1.3 3.8 34%Tajikistan 114 95 63 2.8 1.9 3.7 40%Haiti 143 102 70 3.4 3.4 3.4 36%Eritrea 138 98 68 3.4 3.4 3.4 33%India 114 88 61 3.0 2.6 3.3 53%Solomon Islands 42 31 22 3.1 3.2 3.1 50%Guinea 228 175 126 2.8 2.7 3.0 33%South Sudan 217 165 121 2.8 2.8 2.8 29%Lesotho 88 117 86 0.1 -2.9 2.8 46%Turkmenistan 94 71 53 2.8 2.8 2.8 44%Afghanistan 192 136 101 3.1 3.4 2.7 40%Myanmar 107 84 62 2.6 2.5 2.6 47%
11
Countdown to 2015
Source: Inter-agency Group for Child Mortality estimation (IGMe) – UNICeF, WhO, World Bank and UN population division, 2012
† Negative value indicates an increase in the child mortality rate.
Pakistan 122 95 72 2.5 2.5 2.5 48%Benin 177 140 106 2.4 2.4 2.5 30%Sierra Leone 267 241 185 1.7 1.0 2.4 27%Yemen 126 99 77 2.4 2.4 2.4 43%Gambia 165 130 101 2.3 2.3 2.4 36%Equatorial Guinea 190 152 118 2.3 2.2 2.3 33%Ghana 121 99 78 2.1 2.0 2.2 38%Angola 243 199 158 2.1 2.0 2.1 29%Gabon 94 82 66 1.7 1.4 2.1 39%Comoros 122 100 79 2.0 2.0 2.1 41%Uzbekistan 75 61 49 2.1 2.1 2.1 30%Papua New Guinea 88 72 58 2.0 2.0 2.0 39%Burkina Faso 208 182 146 1.7 1.4 2.0 25%Mali 257 214 176 1.8 1.8 1.8 29%Côte d'Ivoire 151 139 115 1.3 0.9 1.7 37%Sudan 123 104 86 1.7 1.7 1.7 37%Burundi 183 165 139 1.3 1.0 1.5 32%Djibouti 122 106 90 1.5 1.4 1.5 38%Togo 147 128 110 1.4 1.4 1.4 33%Guinea-Bissau 210 186 161 1.3 1.2 1.3 29%Iraq 46 43 38 0.9 0.7 1.1 54%Chad 208 189 169 1.0 1.0 1.0 27%Swaziland 83 114 104 -1.0 -3.2 0.9 34%Congo 119 109 99 0.9 0.9 0.9 33%Cameroon 145 140 127 0.6 0.4 0.8 27%Congo, Democratic Republic of the 181 181 168 0.4 0.0 0.7 29%Central African Republic 169 172 164 0.2 -0.2 0.5 29%Mauritania 125 118 112 0.5 0.6 0.5 37%São Tomé and PrÍncipe 96 93 89 0.4 0.4 0.4 34%Somalia 180 180 180 0.0 0.0 0.0 29%
Country or territory
Under-five mortality rate % of under-5 deaths occurring in neonatal period (2011)
deaths per 1,000 live births Average annual rate of reduction (%)
1990 2000 2011 1990-2011 1990-2000 2000-2011
TAble 2 (CoNTiNUed)
12
AccountAbility for MAternAl, newborn & child SurvivAl: The 2013 UpdaTe
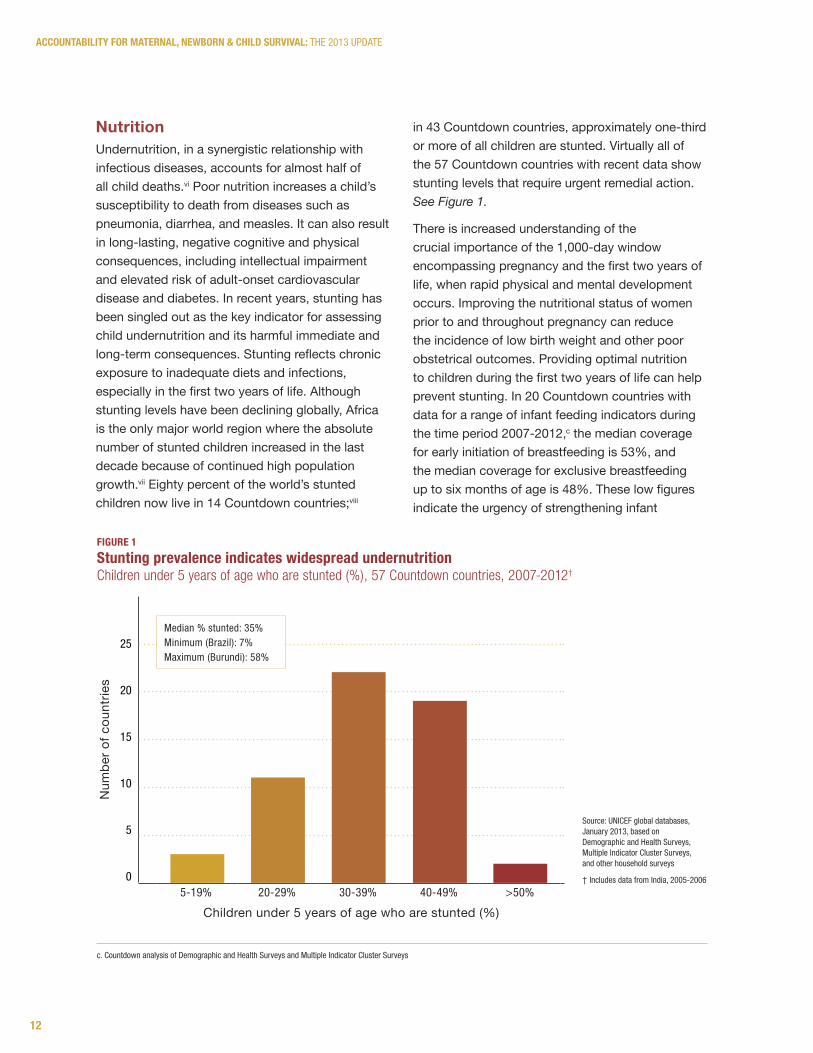
NutritionUndernutrition, in a synergistic relationship with infectious diseases, accounts for almost half of all child deaths.vi Poor nutrition increases a child’s susceptibility to death from diseases such as pneumonia, diarrhea, and measles. It can also result in long-lasting, negative cognitive and physical consequences, including intellectual impairment and elevated risk of adult-onset cardiovascular disease and diabetes. In recent years, stunting has been singled out as the key indicator for assessing child undernutrition and its harmful immediate and long-term consequences. Stunting reflects chronic exposure to inadequate diets and infections, especially in the first two years of life. Although stunting levels have been declining globally, Africa is the only major world region where the absolute number of stunted children increased in the last decade because of continued high population growth.vii Eighty percent of the world’s stunted children now live in 14 Countdown countries;viii
in 43 Countdown countries, approximately one-third or more of all children are stunted. Virtually all of the 57 Countdown countries with recent data show stunting levels that require urgent remedial action. See Figure 1.
There is increased understanding of the crucial importance of the 1,000-day window encompassing pregnancy and the first two years of life, when rapid physical and mental development occurs. Improving the nutritional status of women prior to and throughout pregnancy can reduce the incidence of low birth weight and other poor obstetrical outcomes. Providing optimal nutrition to children during the first two years of life can help prevent stunting. In 20 Countdown countries with data for a range of infant feeding indicators during the time period 2007-2012,c the median coverage for early initiation of breastfeeding is 53%, and the median coverage for exclusive breastfeeding up to six months of age is 48%. These low figures indicate the urgency of strengthening infant
c. Countdown analysis of demographic and health Surveys and Multiple Indicator Cluster Surveys
5-19% 20-29% 30-39% 40-49% >50%
Num
ber o
f cou
ntrie
s
Children under 5 years of age who are stunted (%)
25
20
15
10
5
0
Median % stunted: 35%Minimum (Brazil): 7%Maximum (Burundi): 58%
figUre 1Stunting prevalence indicates widespread undernutritionChildren under 5 years of age who are stunted (%), 57 Countdown countries, 2007-2012†
Source: UNICeF global databases, January 2013, based on demographic and health Surveys, Multiple Indicator Cluster Surveys, and other household surveys
† Includes data from India, 2005-2006
13
Countdown to 2015
and young child feeding programs and other community-based programs in many Countdown countries, to promote optimal breastfeeding and complementary feeding practices and appropriate micro-nutrient supplementation (e.g., vitamin A and zinc) up to and beyond two years of age. Antenatal, delivery, and postnatal care services also offer opportunities to counsel women, including women living with HIV, on breastfeeding and other nutritional practices.
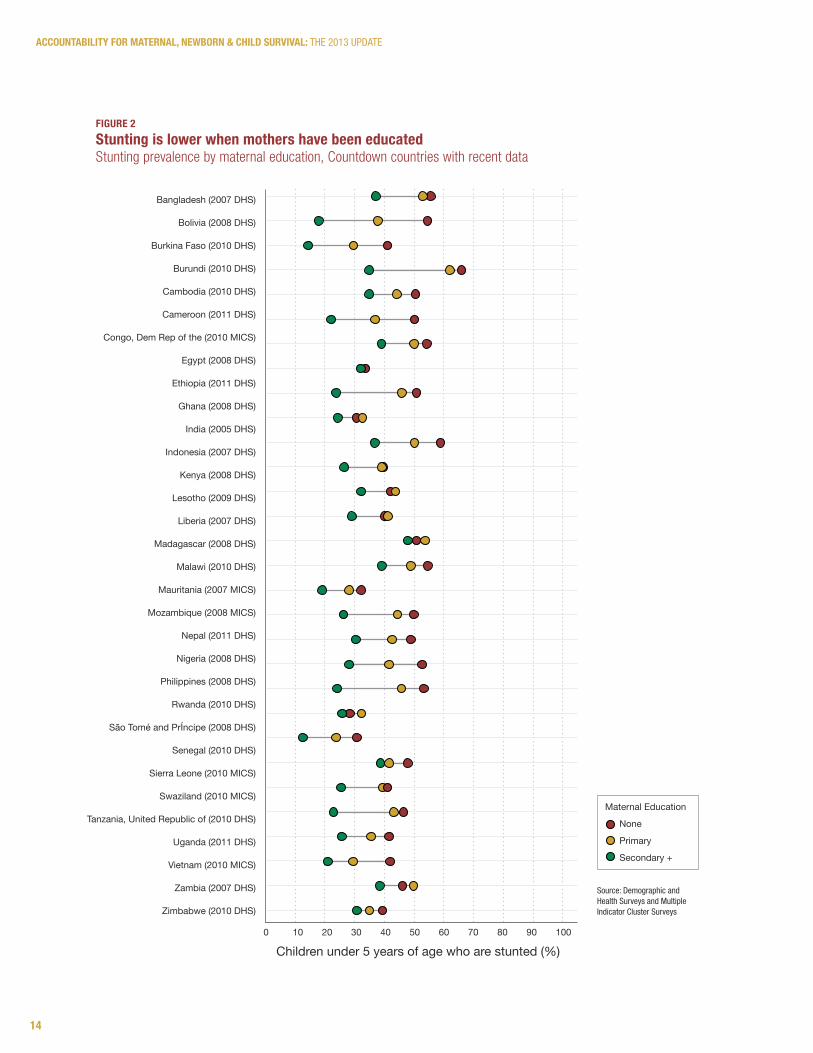
Stunting is a condition often rooted in poverty. It reflects the harsh challenges many women face in accessing income-earning opportunities, education, and health care for themselves and their children. Children of mothers with less education, for example, are at higher risk of stunting (see Figure 2 on page 14).ix In all 32 Countdown countries with available data, stunting prevalence is lowest among
children of mothers with at least some secondary education and highest among children of mothers with no education.
Movements to integrate nutrition initiatives, such as the Road Map for Scaling-Up Nutrition, into national reproductive, maternal, newborn, and child health programs must continue to be prioritized in the Countdown countries. Addressing undernutrition and increasing the impact of nutrition-specific interventions also requires multi-sectoral efforts including social protection and women’s empowerment initiatives, agricultural and food fortification programs, food subsidies for the poor, and water and sanitation programs. In light of rapidly rising food prices and volatile markets in recent years, the global community has a responsibility to help countries meet the growing costs of feeding their populations.
WH
O /C
HR
ISTO
PHER
BLA
CK
14
AccountAbility for MAternAl, newborn & child SurvivAl: The 2013 UpdaTe
figUre 2Stunting is lower when mothers have been educatedStunting prevalence by maternal education, Countdown countries with recent data
Source: demographic and health Surveys and Multiple Indicator Cluster Surveys
Maternal Education
None
Primary
Secondary +
Bangladesh (2007 DHS)
Bolivia (2008 DHS)
Burkina Faso (2010 DHS)
Burundi (2010 DHS)
Cambodia (2010 DHS)
Cameroon (2011 DHS)
Congo, Dem Rep of the (2010 MICS)
Egypt (2008 DHS)
Ethiopia (2011 DHS)
Ghana (2008 DHS)
India (2005 DHS)
Indonesia (2007 DHS)
Kenya (2008 DHS)
Lesotho (2009 DHS)
Liberia (2007 DHS)
Madagascar (2008 DHS)
Malawi (2010 DHS)
Mauritania (2007 MICS)
Mozambique (2008 MICS)
Nepal (2011 DHS)
Nigeria (2008 DHS)
Philippines (2008 DHS)
Rwanda (2010 DHS)
São Tomé and PrÍncipe (2008 DHS)
Senegal (2010 DHS)
Sierra Leone (2010 MICS)
Swaziland (2010 MICS)
Tanzania, United Republic of (2010 DHS)
Uganda (2011 DHS)
Vietnam (2010 MICS)
Zambia (2007 DHS)
Zimbabwe (2010 DHS)
0 10 20 30 40 50 60 70 80 90 100
Children under 5 years of age who are stunted (%)
15
Countdown to 2015
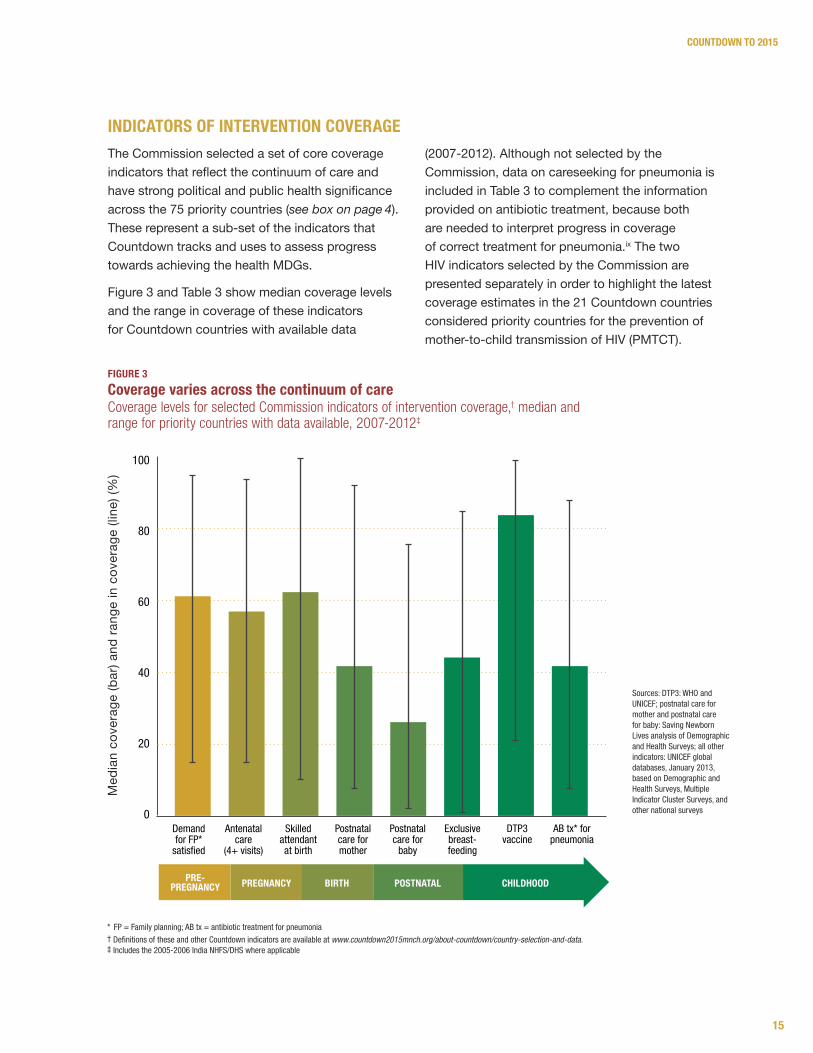
The Commission selected a set of core coverage indicators that reflect the continuum of care and have strong political and public health significance across the 75 priority countries (see box on page 4). These represent a sub-set of the indicators that Countdown tracks and uses to assess progress towards achieving the health MDGs.
Figure 3 and Table 3 show median coverage levels and the range in coverage of these indicators for Countdown countries with available data
(2007-2012). Although not selected by the Commission, data on careseeking for pneumonia is included in Table 3 to complement the information provided on antibiotic treatment, because both are needed to interpret progress in coverage of correct treatment for pneumonia.ix The two HIV indicators selected by the Commission are presented separately in order to highlight the latest coverage estimates in the 21 Countdown countries considered priority countries for the prevention of mother-to-child transmission of HIV (PMTCT).
iNdiCATorS of iNTerveNTioN CoverAge M
edia
n co
vera
ge (b
ar) a
nd ra
nge
in c
over
age
(line
) (%
)
100
80
60
40
20
0demand for Fp*
satisfied
antenatal care
(4+ visits)
Skilled attendant at birth
postnatal care for mother
postnatal care for
baby
exclusive breast-feeding
dTp3 vaccine
aB tx* for pneumonia
pre-pregnancy pregnancy birth postnatal childhood
figUre 3Coverage varies across the continuum of care Coverage levels for selected Commission indicators of intervention coverage,† median and range for priority countries with data available, 2007-2012‡
* Fp = Family planning; aB tx = antibiotic treatment for pneumonia† definitions of these and other Countdown indicators are available at www.countdown2015mnch.org/about-countdown/country-selection-and-data.‡ Includes the 2005-2006 India NhFS/dhS where applicable
Sources: dTp3: WhO and UNICeF; postnatal care for mother and postnatal care for baby: Saving Newborn Lives analysis of demographic and health Surveys; all other indicators: UNICeF global databases, January 2013, based on demographic and health Surveys, Multiple Indicator Cluster Surveys, and other national surveys
16
AccountAbility for MAternAl, newborn & child SurvivAl: The 2013 UpdaTe
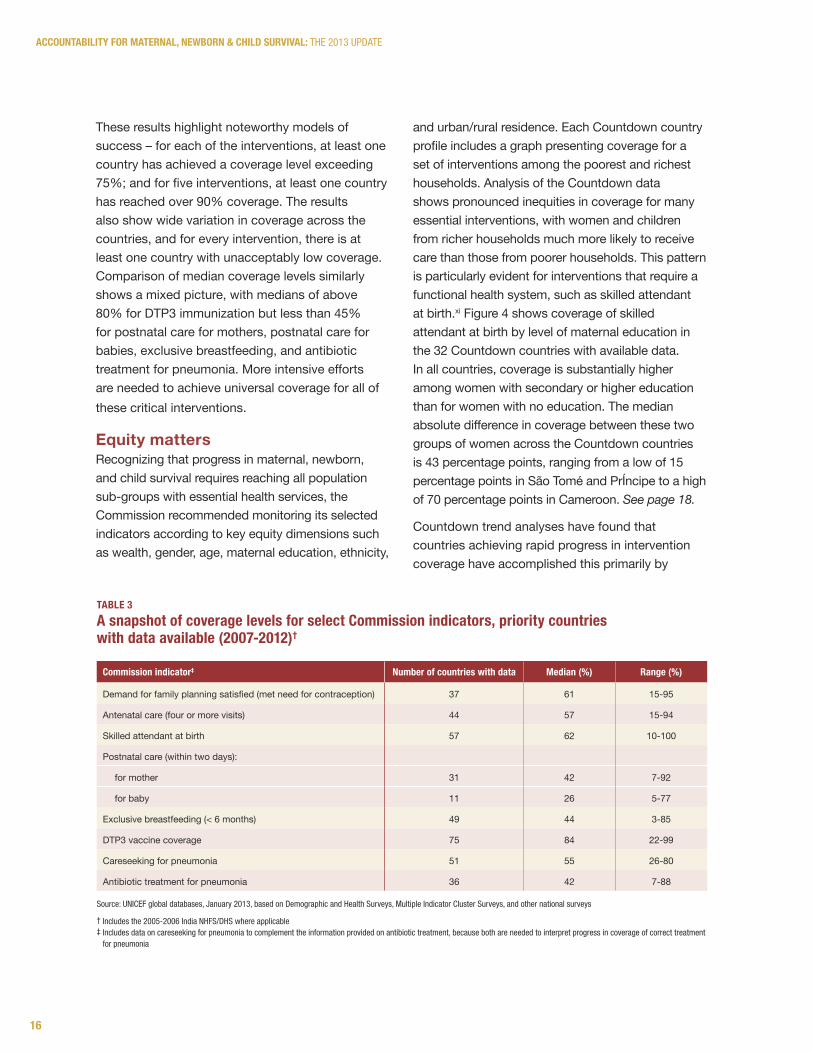
These results highlight noteworthy models of success – for each of the interventions, at least one country has achieved a coverage level exceeding 75%; and for five interventions, at least one country has reached over 90% coverage. The results also show wide variation in coverage across the countries, and for every intervention, there is at least one country with unacceptably low coverage. Comparison of median coverage levels similarly shows a mixed picture, with medians of above 80% for DTP3 immunization but less than 45% for postnatal care for mothers, postnatal care for babies, exclusive breastfeeding, and antibiotic treatment for pneumonia. More intensive efforts are needed to achieve universal coverage for all of these critical interventions.
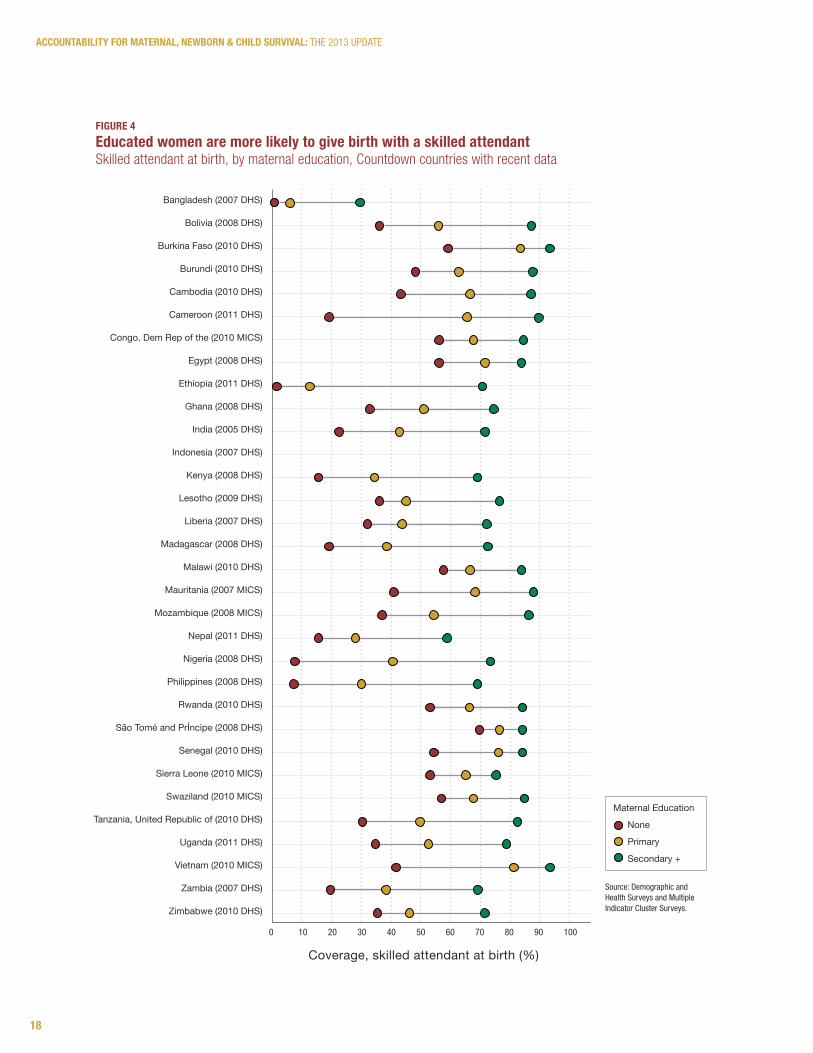
Equity mattersRecognizing that progress in maternal, newborn, and child survival requires reaching all population sub-groups with essential health services, the Commission recommended monitoring its selected indicators according to key equity dimensions such as wealth, gender, age, maternal education, ethnicity,
and urban/rural residence. Each Countdown country profile includes a graph presenting coverage for a set of interventions among the poorest and richest households. Analysis of the Countdown data shows pronounced inequities in coverage for many essential interventions, with women and children from richer households much more likely to receive care than those from poorer households. This pattern is particularly evident for interventions that require a functional health system, such as skilled attendant at birth.xi Figure 4 shows coverage of skilled attendant at birth by level of maternal education in the 32 Countdown countries with available data. In all countries, coverage is substantially higher among women with secondary or higher education than for women with no education. The median absolute difference in coverage between these two groups of women across the Countdown countries is 43 percentage points, ranging from a low of 15 percentage points in São Tomé and PrÍncipe to a high of 70 percentage points in Cameroon. See page 18.
Countdown trend analyses have found that countries achieving rapid progress in intervention coverage have accomplished this primarily by
Source: UNICeF global databases, January 2013, based on demographic and health Surveys, Multiple Indicator Cluster Surveys, and other national surveys
† Includes the 2005-2006 India NhFS/dhS where applicable‡ Includes data on careseeking for pneumonia to complement the information provided on antibiotic treatment, because both are needed to interpret progress in coverage of correct treatment
for pneumonia
TAble 3A snapshot of coverage levels for select Commission indicators, priority countries with data available (2007-2012)†
Commission indicator‡ Number of countries with data Median (%) range (%)
Demand for family planning satisfied (met need for contraception) 37 61 15-95
Antenatal care (four or more visits) 44 57 15-94
Skilled attendant at birth 57 62 10-100
Postnatal care (within two days):
for mother 31 42 7-92
for baby 11 26 5-77
Exclusive breastfeeding (< 6 months) 49 44 3-85
DTP3 vaccine coverage 75 84 22-99
Careseeking for pneumonia 51 55 26-80
Antibiotic treatment for pneumonia 36 42 7-88
17
Countdown to 2015
improving coverage in the poorest wealth quintiles. xii This suggests that countries should consider equity and target vulnerable population sub-groups when they are developing strategies for scaling-up interventions and reaching national health goals. Initiatives aimed at improving the status of women, including girls’ and women’s access to education, should also be emphasized.
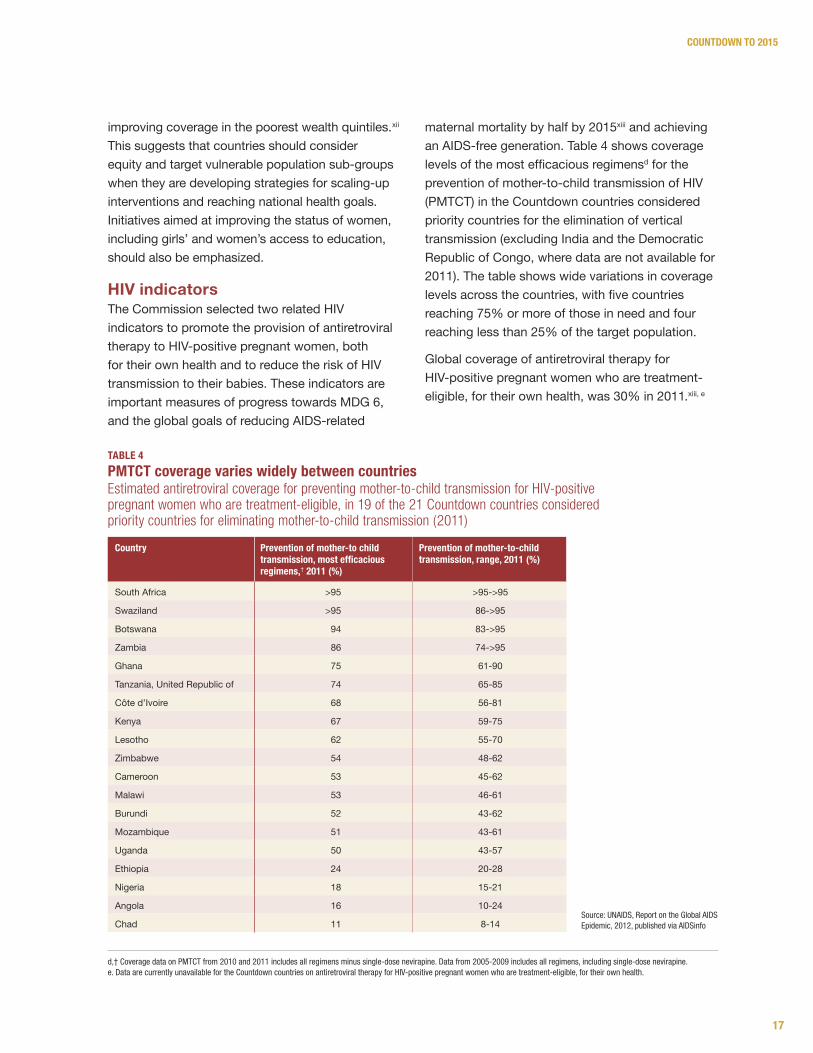
HIV indicatorsThe Commission selected two related HIV indicators to promote the provision of antiretroviral therapy to HIV-positive pregnant women, both for their own health and to reduce the risk of HIV transmission to their babies. These indicators are important measures of progress towards MDG 6, and the global goals of reducing AIDS-related
maternal mortality by half by 2015xiii and achieving an AIDS-free generation. Table 4 shows coverage levels of the most efficacious regimensd for the prevention of mother-to-child transmission of HIV (PMTCT) in the Countdown countries considered priority countries for the elimination of vertical transmission (excluding India and the Democratic Republic of Congo, where data are not available for 2011). The table shows wide variations in coverage levels across the countries, with five countries reaching 75% or more of those in need and four reaching less than 25% of the target population.
Global coverage of antiretroviral therapy for HIV-positive pregnant women who are treatment-eligible, for their own health, was 30% in 2011.xiii, e
TAble 4pMTCT coverage varies widely between countriesEstimated antiretroviral coverage for preventing mother-to-child transmission for HIV-positive pregnant women who are treatment-eligible, in 19 of the 21 Countdown countries considered priority countries for eliminating mother-to-child transmission (2011)
Country prevention of mother-to child transmission, most efficacious regimens,† 2011 (%)
prevention of mother-to-child transmission, range, 2011 (%)
South Africa >95 >95->95
Swaziland >95 86->95
Botswana 94 83->95
Zambia 86 74->95
Ghana 75 61-90
Tanzania, United Republic of 74 65-85
Côte d’Ivoire 68 56-81
Kenya 67 59-75
Lesotho 62 55-70
Zimbabwe 54 48-62
Cameroon 53 45-62
Malawi 53 46-61
Burundi 52 43-62
Mozambique 51 43-61
Uganda 50 43-57
Ethiopia 24 20-28
Nigeria 18 15-21
Angola 16 10-24
Chad 11 8-14Source: UNaIdS, Report on the Global aIdS epidemic, 2012, published via aIdSinfo
d,† Coverage data on pMTCT from 2010 and 2011 includes all regimens minus single-dose nevirapine. data from 2005-2009 includes all regimens, including single-dose nevirapine.e. data are currently unavailable for the Countdown countries on antiretroviral therapy for hIV-positive pregnant women who are treatment-eligible, for their own health.
18
AccountAbility for MAternAl, newborn & child SurvivAl: The 2013 UpdaTe
figUre 4educated women are more likely to give birth with a skilled attendantSkilled attendant at birth, by maternal education, Countdown countries with recent data
Source: demographic and health Surveys and Multiple Indicator Cluster Surveys.
Bangladesh (2007 DHS)
Bolivia (2008 DHS)
Burkina Faso (2010 DHS)
Burundi (2010 DHS)
Cambodia (2010 DHS)
Cameroon (2011 DHS)
Congo, Dem Rep of the (2010 MICS)
Egypt (2008 DHS)
Ethiopia (2011 DHS)
Ghana (2008 DHS)
India (2005 DHS)
Indonesia (2007 DHS)
Kenya (2008 DHS)
Lesotho (2009 DHS)
Liberia (2007 DHS)
Madagascar (2008 DHS)
Malawi (2010 DHS)
Mauritania (2007 MICS)
Mozambique (2008 MICS)
Nepal (2011 DHS)
Nigeria (2008 DHS)
Philippines (2008 DHS)
Rwanda (2010 DHS)
São Tomé and PrÍncipe (2008 DHS)
Senegal (2010 DHS)
Sierra Leone (2010 MICS)
Swaziland (2010 MICS)
Tanzania, United Republic of (2010 DHS)
Uganda (2011 DHS)
Vietnam (2010 MICS)
Zambia (2007 DHS)
Zimbabwe (2010 DHS)
0 10 20 30 40 50 60 70 80 90 100
Coverage, skilled attendant at birth (%)
Maternal Education
None
Primary
Secondary +
Countdown to 2015
19
CoUNTdowN To 2015
CoUNTdowN To 2015W
HO
/CH
RIS
TOPH
ER B
LAC
K
20
AccountAbility for MAternAl, newborn & child SurvivAl: The 2013 UpdaTe
f. The data sources for the two indicators are different. annual estimates for pMTCT are derived from a joint reporting process by the World health Organization, UNICeF, and the Joint United Nations programme on hIV/aIdS. data for careseeking for pneumonia are from UNICeF global databases based on demographic and health Surveys, Multiple Indicator Cluster Surveys, and other national surveys, which for some countries were not performed during the years immediately around 2005 and 2010.
g. The poorest countries are defined as those with a Gross National Income (GNI) of $2,500 per year or less (based on the World Bank 2010 classification using the atlas Method) – a group of 69 countries.
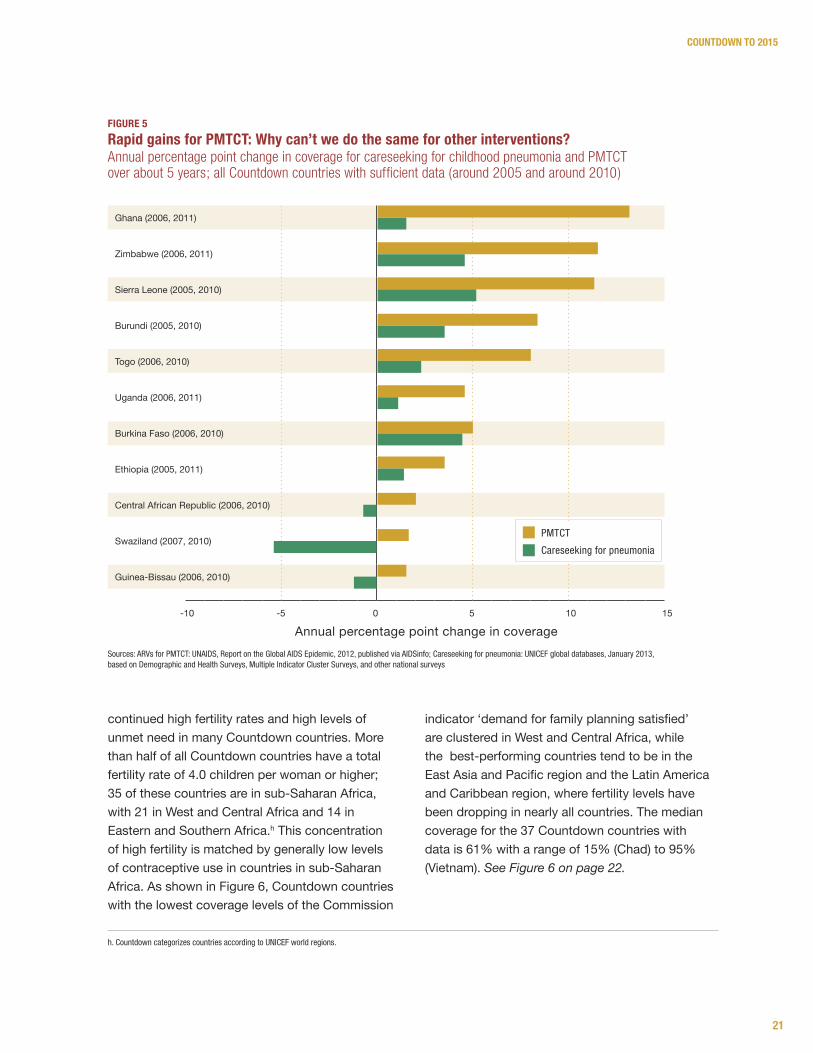
Replicating the success of HIV interventions: Advocacy, commitment, investmentFigure 5 compares the annual percentage-point change in coverage for PMTCT and careseeking for pneumonia from around 2005 to around 2010, for all countries with available data.f Although most countries began this approximately five-year period with low coverage levels for both interventions, gains in coverage for PMTCT were considerably greater in every country than for careseeking for pneumonia, for which some countries even experienced drops in coverage. The message is clear: coordinated advocacy plus political commitment and financial investment can bring rapid increases in coverage. The same level of attention that has been devoted to HIV-related services must be extended to other leading killers of women and children, including pneumonia and diarrhea which together account for 2 million child deaths each year (nearly 15 times the number of child deaths caused by AIDS).xv, xvi The April 2013 launch of the Global Action Plan for Pneumonia and Diarrhea, in the context of the “A Promise Renewed” initiative to end preventable child deaths, is a significant step in this direction,xvii, xviii as are rapidly expanding efforts to provide coordinated services at the community level for mothers and children without access to health facilities.xix
Meeting the demand for family planning: addressing population growth and saving livesReproductive health has gained political visibility in recent years, starting with the adoption of universal access to reproductive health as a second MDG 5 target in 2007 and followed by the launch in 2010 of the Global Strategy for Women’s and Children’s
Health, which included commitments for reproductive health services. In 2012, the Bill & Melinda Gates Foundation and the Government of the United Kingdom co-convened the Family Planning Summit in London, to catalyze political and financial commitment to address the vast unmet need for family planning in the 69 poorest countriesg (of which 62 are also Countdown countries). At the summit, 24 Countdown countries made commitments to improve access to family planning.
Family planning services can improve maternal mortality by reducing unintended and high-risk pregnancies and unsafe abortions. These services can also help improve newborn and child survival by lengthening inter-pregnancy intervals.xx
New Countdown analyses show that the total volume of official development assistance to reproductive health (broadly defined as inclusive of maternal and newborn health services, family planning, sexual health, the treatment and prevention of sexually transmitted diseases, and the treatment and prevention of HIV) was approximately $5579 million in 2009 and $5637 million in 2010, a slight increase of 1%.xxi On average across the two years, more than half of this aid was directed to HIV services, and only around 7% was allocated to family planning.
The Countdown countries received approximately three-quarters of all official development assistance to reproductive health in both 2009 and 2010. Aid to the Countdown countries increased at a rate of 5.3%, from $4066 million in 2009 to $4284 million in 2010.
Significant additional investment in comprehensive family planning services is urgently needed, given
Lessons Learned: Taking Action Today and Tomorrow
21
Countdown to 2015
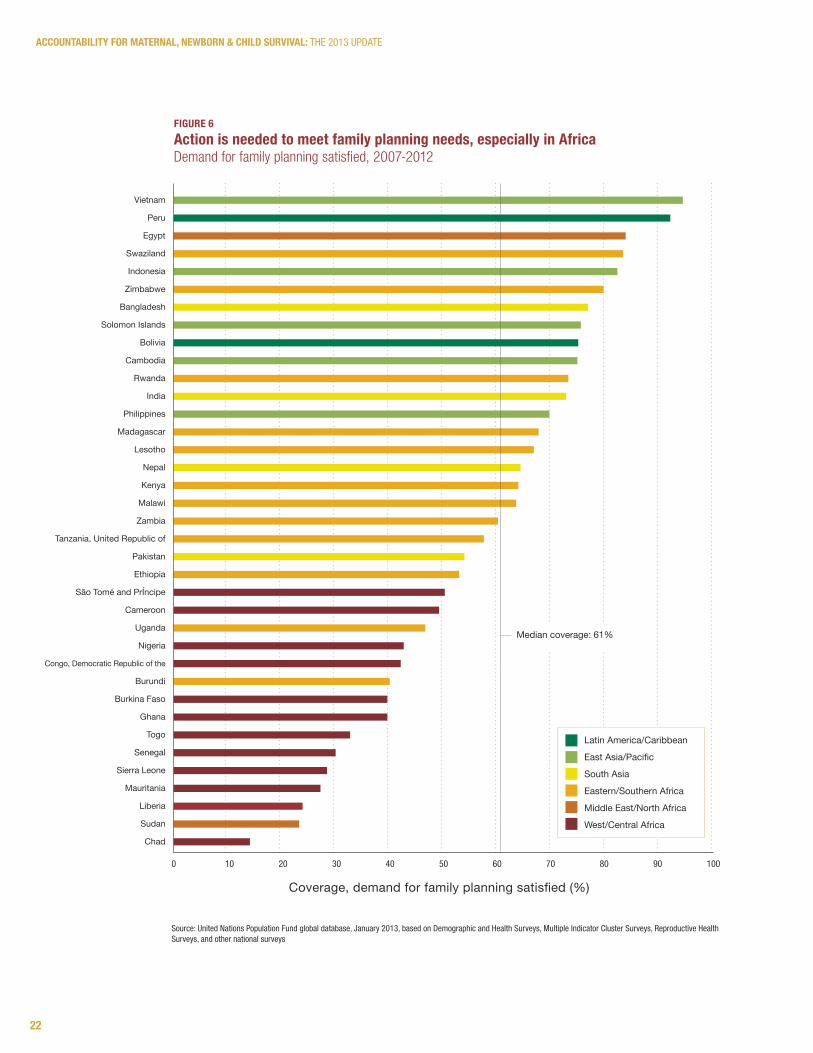
continued high fertility rates and high levels of unmet need in many Countdown countries. More than half of all Countdown countries have a total fertility rate of 4.0 children per woman or higher; 35 of these countries are in sub-Saharan Africa, with 21 in West and Central Africa and 14 in Eastern and Southern Africa.h This concentration of high fertility is matched by generally low levels of contraceptive use in countries in sub-Saharan Africa. As shown in Figure 6, Countdown countries with the lowest coverage levels of the Commission
indicator ‘demand for family planning satisfied’ are clustered in West and Central Africa, while the best-performing countries tend to be in the East Asia and Pacific region and the Latin America and Caribbean region, where fertility levels have been dropping in nearly all countries. The median coverage for the 37 Countdown countries with data is 61% with a range of 15% (Chad) to 95% (Vietnam). See Figure 6 on page 22.
figUre 5rapid gains for pMTCT: why can’t we do the same for other interventions? Annual percentage point change in coverage for careseeking for childhood pneumonia and PMTCT over about 5 years; all Countdown countries with sufficient data (around 2005 and around 2010)
Sources: aRVs for pMTCT: UNaIdS, Report on the Global aIdS epidemic, 2012, published via aIdSinfo; Careseeking for pneumonia: UNICeF global databases, January 2013, based on demographic and health Surveys, Multiple Indicator Cluster Surveys, and other national surveys
h. Countdown categorizes countries according to UNICeF world regions.
Annual percentage point change in coverage-10 -5 0 5 10 15
Ghana (2006, 2011)
Zimbabwe (2006, 2011)
Sierra Leone (2005, 2010)
Burundi (2005, 2010)
Togo (2006, 2010)
Uganda (2006, 2011)
Burkina Faso (2006, 2010)
Ethiopia (2005, 2011)
Central African Republic (2006, 2010)
Swaziland (2007, 2010)
Guinea-Bissau (2006, 2010)
pMTCT
Careseeking for pneumonia
22
AccountAbility for MAternAl, newborn & child SurvivAl: The 2013 UpdaTe
figUre 6Action is needed to meet family planning needs, especially in AfricaDemand for family planning satisfied, 2007-2012
Source: United Nations population Fund global database, January 2013, based on demographic and health Surveys, Multiple Indicator Cluster Surveys, Reproductive health Surveys, and other national surveys
Vietnam
Peru
Egypt
Swaziland
Indonesia
Zimbabwe
Bangladesh
Solomon Islands
Bolivia
Cambodia
Rwanda
India
Philippines
Madagascar
Lesotho
Nepal
Kenya
Malawi
Zambia
Tanzania, United Republic of
Pakistan
Ethiopia
São Tomé and PrÍncipe
Cameroon
Uganda
Nigeria
Congo, Democratic Republic of the
Burundi
Burkina Faso
Ghana
Togo
Senegal
Sierra Leone
Mauritania
Liberia
Sudan
Chad
Coverage, demand for family planning satisfied (%)
0 10 20 30 40 50 60 70 80 90 100
Latin America/Caribbean
East Asia/Pacific
South Asia
Eastern/Southern Africa
Middle East/North Africa
West/Central Africa
Median coverage: 61%
23
Countdown to 2015
Scaling up services to save more mothers and newborns Through several major initiatives and resolutions – such as “A Promise Renewed,” “Every Woman Every Child,” and the UN Commission on the Status of Women’s resolution on eliminating preventable maternal mortality – countries around the world have committed to reducing preventable deaths of mothers and of children under five years of age. The global percentage of child deaths occurring during the newborn period is now 43%,xxii making a focus on saving newborn lives essential to reaching this goal and achieving MDG 4. Proven, cost-effective interventions can reduce newborn deaths by three-quarters without the need for intensive care. Many of these interventions can be delivered through antenatal care, skilled delivery, and postnatal care visits, which represent major opportunities to reach mothers and their babies with lifesaving services that often bring long-lasting health and developmental benefits. Improved care at birth is also the most important strategy for reducing stillbirths.xxiii
Many Countdown countries are experiencing severe shortages of health workers, drugs, and medical supplies, and many families living in remote and disadvantaged areas continue to face barriers to accessing health care facilities. To address these issues and to increase the availability of postnatal care services for mothers and their babies, WHO and UNICEF in 2009 issued a Joint Statementxxiv recommending home visits during pregnancy and in the first week of life as a complementary strategy to facility-based services. Interventions recommended during these home visits include promotion of exclusive breastfeeding and family planning, appropriate cord and thermal care, counseling on danger signs, and treatment and referral when needed.
A recent WHO study found that over half of the 68 African and Asian countries surveyed now have a policy on home visits for newborns, and 30 countries are now implementing community-based
home visit packages for newborn care. xxv Reported national coverage of postnatal care for babies ranged from 6% to 100%, but only four countries surveyed reported coverage levels exceeding 50% for home visits within two days of birth. Improvements in the coverage and quality of postnatal care are clearly needed. This will require greater financial commitment to newborn health, more research on the optimal timing and content of services during the postnatal period, continued integration of newborn care interventions into facility-based maternity care and frontline health worker delivery platforms, strengthening linkages between frontline workers and health facilities, and monitoring of postnatal services.xxvi
The lack of available coverage data on newborn interventions makes it difficult to evaluate scale-up efforts. Only 11 Countdown countries, for example, have recent data on postnatal care for babies. An inter-agency technical working group on newborn indicators, convened by Saving Newborn Lives/Save the Children, is actively advocating for stronger health information systems, including vital registration, to better track newborn mortality, preterm births, and stillbirths. It is also developing metrics for consistent assessment of coverage of proven interventions provided around the time of birth and in the early postnatal period. These key interventions include antenatal corticosteroids, neonatal resuscitation, drying and thermal care for the newborn, cord care, kangaroo mother care, and care-seeking and treatment for newborn sepsis. xxvii Several of these interventions are priorities for the United Nations Commission on Life-Saving Commodities, and collaborative work is underway to identify and address bottlenecks to their scale-up.
24
AccountAbility for MAternAl, newborn & child SurvivAl: The 2013 UpdaTe
Accountability requires each of us to take action. Countdown is committed to making the evidence on progress accessible to decision makers, stimulating action where it is needed by producing regular reports and country profiles. Because success depends upon country ownership and participation, Countdown is now engaging in country-level activities to catalyze change through better information.
Understanding the determinants of success: In-depth country case studiesIn a small number of countries, Countdown is supporting intensive analysis of the determinants of progress in RMNCH and nutrition. Independent scientists, working closely with Ministries of Health, review existing data on financial inputs, policies and systems factors, program implementation, broader contextual factors, intervention coverage, and equity patterns. They examine not only the extent of progress in reducing maternal, newborn, and child mortality, but also why and how this progress was or was not achieved. Niger was the first country to undertake such a case study analysis, focusing on the dramatic reductions in under-five mortality that were documented over the past decade.xxviii Bangladesh is completing a similar effort now, focusing on maternal mortality. These and future case studies will contribute to a more refined understanding of the interplay of factors that lead to progress, identifying potential lessons that can be applied in other contexts and building national capacity for such analyses.
Using evidence to guide decision making: Country CountdownsCountdown is also supporting a country-led process, the Country Countdown, which offers countries a set of methods and tools for making data an effective instrument of change. At the heart of the Country Countdown is the development and dissemination of sub-national profiles through a
consultative process involving all key stakeholders. The Country Countdown helps countries ensure that policy follows evidence, and that investments of health resources support interventions proven to save lives. It empowers decision makers with the information they need to set priorities, and to strengthen evidence-based programs that focus on efficiency, effectiveness, and equity. It aligns with the international and regional frameworks that have been put in place to support and monitor countries’ fulfillment of their RMNCH commitments, and provides a template for objectively and consistently tracking progress and ensuring accountability.
The global Countdown team is committed to supporting and facilitating these country-led activities by developing and disseminating tools, providing technical support as needed, and sharing relevant experiences from both the global and country levels. More information is available at www.countdown2015mnch.org/country-countdown.
Accountability: Now is the time
• Increase public and policy attention to RMNCh, and to achievement of MdGs 4 and 5
• Focus national health strategies, investments, and programming to achieve high and equitable coverage of high-impact interventions, with emphasis on reaching the underserved
• Increase and more efficiently allocate financial resources for RMNCh
• Strengthen capacity to assess and analyze data, and to use data for evidence-based action
• Improve the quantity and quality of data, as national leaders become more aware of its importance and of current data gaps
• Foster accountability, both for committed actions and for outcomes
The aim of all Countdown country-level activities is to:
25
CoUNTdowN To 2015
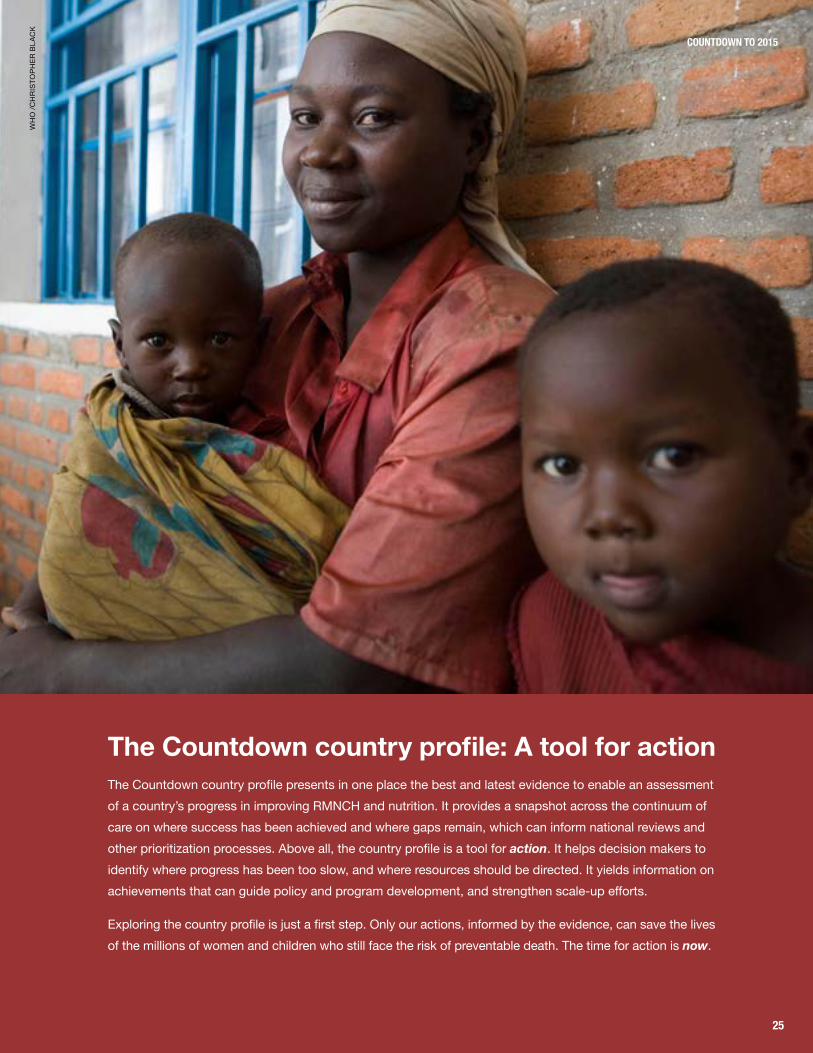
The Countdown country profile: A tool for actionThe Countdown country profile presents in one place the best and latest evidence to enable an assessment of a country’s progress in improving RMNCH and nutrition. It provides a snapshot across the continuum of care on where success has been achieved and where gaps remain, which can inform national reviews and other prioritization processes. Above all, the country profile is a tool for action. It helps decision makers to identify where progress has been too slow, and where resources should be directed. It yields information on achievements that can guide policy and program development, and strengthen scale-up efforts.
Exploring the country profile is just a first step. Only our actions, informed by the evidence, can save the lives of the millions of women and children who still face the risk of preventable death. The time for action is now.
WH
O /C
HR
ISTO
PHER
BLA
CK
26
AccountAbility for MAternAl, newborn & child SurvivAl: The 2013 UpdaTe
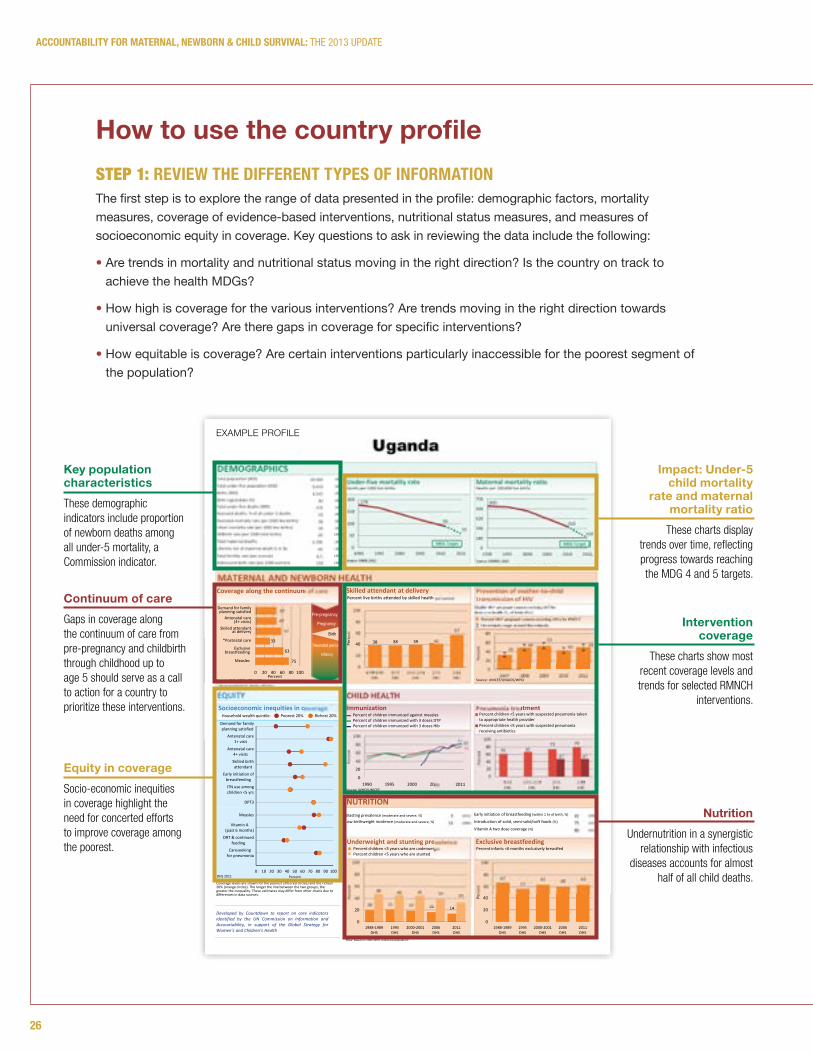
STEP 1: review The differeNT TypeS of iNforMATioN The first step is to explore the range of data presented in the profile: demographic factors, mortality measures, coverage of evidence-based interventions, nutritional status measures, and measures of socioeconomic equity in coverage. Key questions to ask in reviewing the data include the following:
• Are trends in mortality and nutritional status moving in the right direction? Is the country on track to achieve the health MDGs?
• How high is coverage for the various interventions? Are trends moving in the right direction towards universal coverage? Are there gaps in coverage for specific interventions?
• How equitable is coverage? Are certain interventions particularly inaccessible for the poorest segment of the population?
Key population characteristics These demographic indicators include proportion of newborn deaths among all under-5 mortality, a Commission indicator.
Continuum of care Gaps in coverage along the continuum of care from pre-pregnancy and childbirth through childhood up to age 5 should serve as a call to action for a country to prioritize these interventions.
Equity in coverage Socio-economic inequities in coverage highlight the need for concerted efforts to improve coverage among the poorest.
Impact: Under-5 child mortality
rate and maternal mortality ratio
These charts display trends over time, reflecting progress towards reaching the MDG 4 and 5 targets.
Intervention coverage
These charts show most recent coverage levels and trends for selected RMNCH
interventions.
NutritionUndernutrition in a synergistic
relationship with infectious diseases accounts for almost
half of all child deaths.
EQUITY
75
60
* See Annex/website for indicator definition
Note: Based on 2006 WHO reference population
14
CHILD HEALTH
(2011)
(2006)
42
DEMOGRAPHICS
MATERNAL AND NEWBORN HEALTH
NUTRITION(2006)
(2011)
(2011)
5
Socioeconomic inequities in coverage
Total population (000)Total under‐five population (000)Births (000)Birth registration (%)
Neonatal mortality rate (per 1000 live births)
Lifetime risk of maternal death (1 in N)
Total fertility rate (per woman)Adolescent birth rate (per 1000 women)
Stillbirth rate (per 1000 total births)
6.1159
25
(2011)28
(2010)49
(2011)34,509(2011)6,643(2011)1,545(2011)30
(2010)4,700Total maternal deaths
178
90
59
0
50
100
150
200
1990 1995 2000 2005 2010 2015
Under‐five mortality rate
MDG Target
Source: IGME 2012
600
310
150
0
140
280
420
560
700
1990 1995 2000 2005 2010 2015
MDG Target
Maternal mortality ratio
Source: MMEIG 2012
75
63
33
57
47
47
0 20 40 60 80 100Percent
Coverage along the continuum of care
Source: DHS, MICS, Other NS
Skilled attendant
*Postnatal care
breastfeeding
Measles
38 38 39 42
57
0
20
40
60
80
100
1988‐1989DHS
1995DHS
2000‐2001DHS
2006DHS
2011DHS
Percen
t
Skilled attendant at deliveryPercent live births attended by skilled health personnel
3349
5343 50
0
20
40
60
80
2007 2008 2009 2010 2011
Percen
t
61 6773 79
47 47
020406080
100
1995DHS
2000‐2001DHS
2006DHS
2011DHS
Percen
t
Pneumonia treatment
75
82 82
0
20
40
60
80
100
1990 1995 2000 2005 2010
Percen
t
ImmunizationPercent of children immunized against measlesPercent of children immunized with 3 doses DTPPercent of children immunized with 3 doses Hib
20 21 19 16 14
48 46 45 39 33
0
20
40
60
80
100
1988‐1989DHS
1995DHS
2000‐2001DHS
2006DHS
2011DHS
Percen
t
Underweight and stunting prevalencePercent children <5 years who are underweightPercent children <5 years who are stunted
6757
63 60 63
0
20
40
60
80
100
1988‐1989DHS
1995DHS
2000‐2001DHS
2006DHS
2011DHS
Percen
t
Exclusive breastfeedingPercent infants <6 months exclusively breastfed
Source: UNICEF/UNAIDS/WHO
Percent children <5 years with suspected pneumonia taken to appropriate health providerPercent children <5 years with suspected pneumonia receiving antibiotics
Coverage levels are shown for the poorest 20% (red circles) and the richest 20% (orange circles). The longer the line between the two groups, the greater the inequality. These estimates may differ from other charts due to differences in data sources.
Uganda
Household wealth quintile: Poorest 20% Richest 20%
DHS 2011
Demand for family planning satisfied
Antenatal care(4+ visits)
at delivery
Exclusive
Introduction of solid, semi‐solid/soft foods (%)
Early initiation of breastfeeding (within 1 hr of birth, %)
Vitamin A two dose coverage (%)
Wasting prevalence (moderate and severe, %)
Low birthweight incidence (moderate and severe, %)
Source: WHO/UNICEF
Neonatal deaths: % of all under‐5 deaths (2011)33
Infant mortality rate (per 1000 live births) (2011)58
Deaths per 1000 live births Deaths per 100,000 live births
Note:MDG target calculated by Countdown to 2015.
Percent HIV+ pregnant women receiving ARVs for PMTCTUncertainty range around the estimate
Total under‐five deaths (000) (2011)131
(2009)
(2011)
(2003)
Pre-pregnancy
Pregnancy
Birth
Neonatal period
Infancy
Eligible HIV+ pregnant women receiving ART for their own health (%, of total ARVs) ‐
Prevention of mother‐to‐childtransmission of HIV
Developed by Countdown to report on core indicatorsidentified by the UN Commission on Information andAccountability, in support of the Global Strategy forWomen’s and Children’s Health
2011
0 10 20 30 40 50 60 70 80 90 100
Demand for family planning satisfied
Antenatal care1+ visit
Antenatal care4+ visits
Skilled birthattendant
Early initiation ofbreastfeeding
ITN use amongchildren <5 yrs
DPT3
Measles
Vitamin A(past 6 months)
ORT & continuedfeeding
Careseeking for pneumonia
Percent
How to use the country profile
ExamplE proFilE
27
Countdown to 2015
STEP 2: ideNTify opporTUNiTieS To ACCelerATe progreSSThe second step is to compare progress in different areas, focus on specific coverage gaps, and identify opportunities to address these gaps and accelerate progress in improving coverage and health outcomes. Questions to ask include the following:
• Are the coverage data consistent with the epidemiological situation? For example:
– If stunting prevalence is high, are coverage levels low for the nutrition intervention indicators? Would a focus on promoting optimal breastfeeding practices help to drive progress on reducing stunting?
– In priority countries for the elimination of mother-to-child transmission of HIV, are sufficient resources being targeted to preventing mother-to-child transmission?
– If progress on reducing maternal mortality is lagging, and/or if newborn mortality is high, is this a reflection of low coverage of family planning, antenatal care (four or more visits), skilled attendance at birth, and postnatal care?
• Are there patterns in the coverage data that suggest clear action steps? For example, lower coverage for interventions involving treatment of an acute need (e.g., treatment of childhood diseases, childbirth services) than for interventions delivered routinely through outreach or scheduled in advance (e.g., vaccinations) suggests the need for measures to strengthen health systems, such as a greater policy focus on the training and equitable deployment of skilled health workers to increase access to care.
• Are gaps in coverage along the continuum of care suggestive of a call to action to prioritize specific interventions in future planning activities? For example, is access to labor, delivery, and immediate postnatal care being prioritized in countries with gaps in interventions delivered around the time of birth?

May 2013
Country profilesThe information in the country profiles, customized to showcase the core indicators selected by the Commission on Information and Accountability for Women’s and Children’s Health, is intended to help policy makers and their partners assess progress and prioritize actions to save women’s and children’s lives. These country profiles reflect the data that are available for each country. Most of the data for the Commission indicators come from household surveys: mainly the USAID-supported Demographic and Health Surveys and the UNICEF-supported Multiple Indicator Cluster Surveys.xxix More information on the data sources for the Commission indicators is available in the annexes to previous Countdown reports: www.countdown2015mnch.org/reports-and-articles.
New survey data are available for 22 countries since the publication of Countdown’s 2012 Report. Coverage estimates that are missing or that are more than five years old indicate an urgent need for concerted action to increase data collection efforts so that updated evidence is available for policy and program development.
This report contains profiles for 75 countries with high burdens of maternal and/or child mortality, including the 49 lowest-income countries covered by the Global Strategy for Women’s and Children’s Health. Profiles are included for the following countries:
AfghanistanAngolaAzerbaijanBangladeshBeninBoliviaBotswanaBrazilBurkina FasoBurundiCambodiaCameroonCentral African RepublicChadChinaComorosCongoCongo, Democratic Republic of theCôte d’IvoireDjiboutiEgyptEquatorial GuineaEritreaEthiopiaGabon
GambiaGhanaGuatemalaGuineaGuinea-BissauHaitiIndiaIndonesiaIraqKenyaKorea, Democratic People’s Republic ofKyrgyzstanLao People’s Democratic RepublicLesothoLiberiaMadagascarMalawiMaliMauritaniaMexicoMoroccoMozambiqueMyanmarNepalNiger
NigeriaPakistanPapua New GuineaPeruPhilippinesRwandaSão Tomé and PrÍncipe SenegalSierra LeoneSolomon IslandsSomaliaSouth AfricaSouth SudanSudanSwazilandTajikistanTanzania, United Republic ofTogoTurkmenistanUgandaUzbekistanVietnamYemenZambiaZimbabwe
104
AccountAbility for MAternAl, newborn & child SurvivAl: The 2013 UpdaTe
Referencesi Further technical guidance on the Commission indicators is available from Countdown to 2015, Health Metrics
Network, WHO. Monitoring maternal, newborn and child health: understanding key progress indicators. Geneva: WHO Document Production Services, 2011. ISBN 978 92 4 1502818 8.
ii Maternal Mortality Estimation Inter-agency Group (MMEIG) - WHO, UNICEF, UNFPA, the World Bank. Trends in Maternal Mortality: 1990-2010. WHO, UNICEF, UNFPA and The World Bank estimates. WHO 2012.
iii UN-Inter-agency Group for Child Mortality Estimation. Levels and Trends of Child Mortality. The 2012 Report. UNICEF 2012.
iv UN-Inter-agency Group for Child Mortality Estimation. Levels and Trends of Child Mortality. The 2012 Report. UNICEF 2012.
v Liu L, Johnson HL, Cousens S, Perin J, Scott S, et al. Global, regional, and national causes of child mortality: an updated systematic analysis for 2010 with time trends since 2000. Lancet, 2012; 379: 2151–61.
vi Black RE, Victora C, Walker S, Bhutta Z, Christian P, de Onis M, Ezzati M, Granthem-McGregor S, Katz J, Martorell R, Uauy R, and the Maternal and Child Nutrition Study Group. Maternal and Child undernutrition and overweight in low and middle income countries. Lancet, 2013, in press.
vii Black RE, Victora C, Walker S, Bhutta Z, Christian P, de Onis M, Ezzati M, Granthem-McGregor S, Katz J, Martorell R, Uauy R, and the Maternal and Child Nutrition Study Group. Maternal and Child undernutrition and overweight in low and middle income countries. Lancet, 2013, in press.
viii Improving Child Nutrition: The achievable imperative for global progress. UNICEF 2013.ix Save the Children. Nutrition in the first 1,000 days. State of the World’s Mothers. Save the Children 2012.x Campbell H, el Arifeen S, Hazir T, O’Kelly J, Bryce J, Rudan I, Qazi S. Measuring Coverage in MNCH:
Challenges in Monitoring the Proportion of Young Children with Pneumonia Who Receive Antibiotic Treatment. PLoS Med, 2013; 10(5): e1001421. doi:10.1371/journal.pmed.1001421.
xi Barros AJD, Ronsmans C, Axelson H, Loaiza E, Bertoli AD, Franca GV, Bryce J, Boerma T, Victora CG. Equity in maternal, newborn and child health interventions in Countdown to 2015: a retrospective review of survey data from 54 countries. Lancet, 2012. 379(9822), 1225-1233.
xii Victora C, Barros A, et al., How changes in coverage affect equity in maternal and child health interventions in 35 Countdown to 2015 countries: an analysis of national surveys. Lancet, 2012. DOI: 10.1016/S0140-6736(12)61427-5.
xiii UNAIDS strategy 2011-2015. Getting to zero. Joint United Nations Programme on HIV/AIDS (UNAIDS) 2010.xiv UNAIDS, Report on the Global AIDS Epidemic, 2012, published estimates. xv World Health Organization, UNICEF. Ending preventable child deats from pneumonia and diarrhea by 2025:
the integrated Global Action Plan for Pneumonia and Diarrhoea (GAPPD). WHO 2013.xvi Liu L, Johnson HL, Cousens S, Perin J, Scott S, et al. Global, regional, and national causes of child mortality:
an updated systematic analysis for 2010 with time trends since 2000. Lancet, 2012; 379: 2151–61.xvii World Health Organization, UNICEF. Ending preventable child deats from pneumonia and diarrhea by 2025:
the integrated Global Action Plan for Pneumonia and Diarrhoea (GAPPD). WHO 2013.xviii Bhutta Z, Das J, Walker N, Rizvi A, Campbell H, Rudan I, Black R, for The Lancet Diarrehoea and Pneumonia
Interventions Study Group. Interventions to address deaths from childhood pneumonia and diarrhea equitably: what works and at what cost? Lancet, 2013. Published online April 12, 2013. http://dx.doi.org/10.1016/S0140-6736(13)60648-0.
105
Countdown to 2015
xix March D, Davidson H, Pagnoni F, and Peterson S. Introduction to a special supplement: Evidence for the implementation, effects, and impact of the integrated community case management strategy to treat childhood infection. Am J Trop M ed Hyg, 2012 Nov; 87(2-5); doie: 10.4269/ajtmh.2012.12-0504.
xx Cleland J, Conde-Agudelo A, Peterson H, Ross J, Tsui A. Contraception and Health. Lancet, 2012 Jul 14; 380 (9837): 149-56. Doi:10.1016/S0140-6736(12)60609-6.
xxi Hsu, J, Berman P, Mills A. Reproductive health priorities: evidence from disbursements of official development assistance in 2009 and 2010. Lancet, 2013 in press.
xxii UN-Inter-agency Group for Child Mortality Estimation. Levels and Trends of Child Mortality. The 2012 Report. UNICEF 2012.
xxiii Lawn J, Blencowe H, Pattinson R, Cousens S, Kumar R, Ibiebele I, and others. Stillbirths: where? when? why? how to make the data count. Lancet, 2011. 377 (9775): 1448-63.
xxiv WHO and UNICEF. Home visits for the newborn child: A strategy to improve survival. World Health Organization. Geneva, Switzerland 2009.
xxv WHO, Save the Children, and UNICEF. Informal meeting on provision of home-based care to mother and child in the first week after birth: Follow-up to the Joint WHO/UNICEF Statement on home visits for the newborn child. World Health Organization. Geneva, Switzerland 2012.
xxvi Darmstadt G, Oot D, Lawn J. 2012. Newborn survival: changing the trajectory over the next decade. Health Policy and Planning. Volume 27 Supplement 3 July 2012 ISSN 0268-1080 Iii1-6. http://heapol.oxfordjournals.org/content/27/suppl_3.toc.
xxvii Moran A, Kerber K, Sitrin D, Guenther T, Morrissey C, Newby H, Fishel J, Yoder PS, Hill Z, Lawn J. Measuring coverage for MNCH: Indicators for global tracking of newborn care. PLoS Med, 2013, in press.
xxviii Amouzou A, Habi O, Bensaïd K, and the Niger Countdown Case Study Working Group. Reduction in child mortality in Niger: a Countdown to 2015 country case study. Lancet, 2012; 380: 1169-1178.
xxix Hancioglu A, Arnold F. Measuring coverage in MNCH: Tracking progress in health for women and children using DHS and MICS household surveys. PLoS Med, 2013: 10. E1001391. Doc 10.1371/journal.pmed. 1001391.
FAMILY CARE I N T E R N A T I O N A L
pantone
322 C
321 U
pantone
382 C
381 U
CMYK (process)
DS 302-3 C
C 25, Y 95
DS 302-5 U
C 20, Y 65
CMYK (process)
DS 249-3 C
C 95, Y 25, K 35
DS 248-2 U
C 100, Y 30, K 30
www.countdown2015mnch.org