Embed Size (px)
Citation preview
2015-16 School Accountability Report Card for Academies of the Antelope Valley Page 1 of 15
Academies of the Antelope Valley
School Accountability Report Card
Reported Using Data from the 2015-16 School Year
Published During 2016-17
By February 1 of each year, every school in California is required by state law to publish a School Accountability Report Card (SARC). The SARC contains information about the condition and performance of each California public school. Under the Local Control Funding Formula (LCFF) all local educational agencies (LEAs) are required to prepare a Local Control and Accountability Plan (LCAP), which describes how they intend to meet annual school-specific goals for all pupils, with specific activities to address state and local priorities. Additionally, data reported in an LCAP is to be consistent with data reported in the SARC. • For more information about SARC requirements, see the California Department of Education (CDE) SARC Web page at
http://www.cde.ca.gov/ta/ac/sa/. • For more information about the LCFF or LCAP, see the CDE LCFF Web page at http://www.cde.ca.gov/fg/aa/lc/. • For additional information about the school, parents/guardians and community members should contact the school principal or
the district office. DataQuest DataQuest is an online data tool located on the CDE DataQuest Web page at http://dq.cde.ca.gov/dataquest/ that contains additional information about this school and comparisons of the school to the district and the county. Specifically, DataQuest is a dynamic system that provides reports for accountability (e.g., test data, enrollment, high school graduates, dropouts, course enrollments, staffing, and data regarding English learners). Internet Access Internet access is available at public libraries and other locations that are publicly accessible (e.g., the California State Library). Access to the Internet at libraries and public locations is generally provided on a first-come, first-served basis. Other use restrictions may include the hours of operation, the length of time that a workstation may be used (depending on availability), the types of software programs available on a workstation, and the ability to print documents.
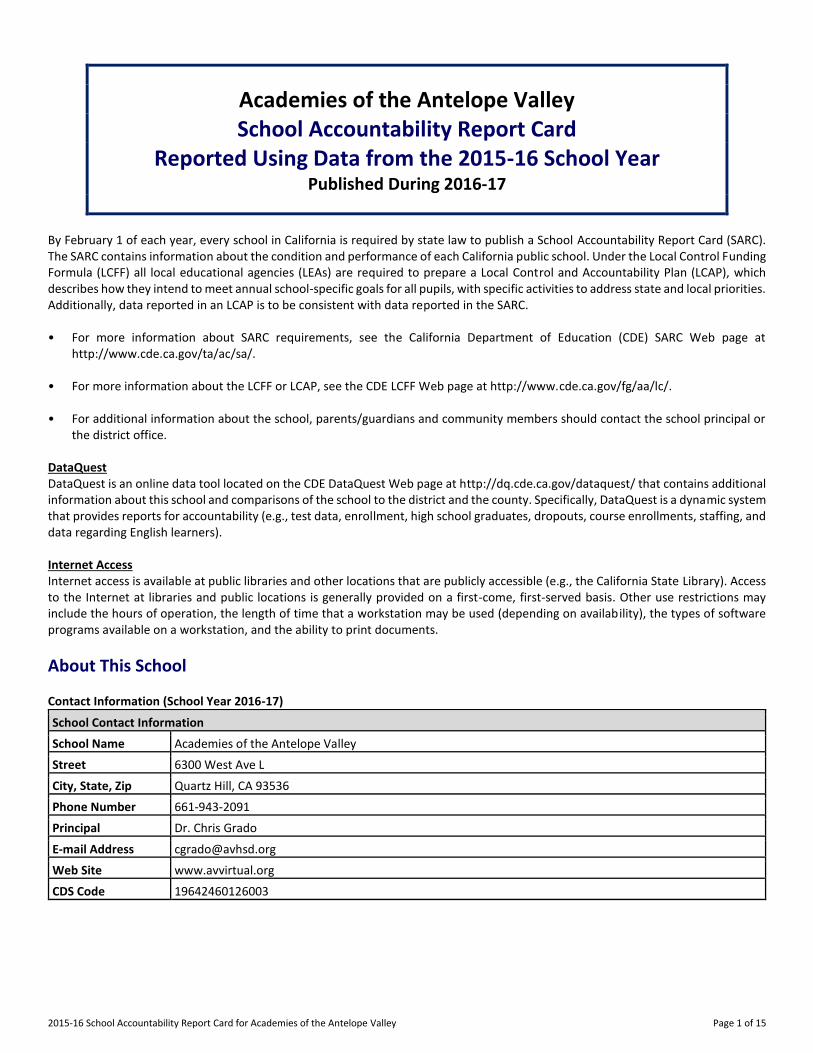
About This School Contact Information (School Year 2016-17)
School Contact Information
School Name------- Academies of the Antelope Valley
Street------- 6300 West Ave L
City, State, Zip------- Quartz Hill, CA 93536
Phone Number------- 661-943-2091
Principal------- Dr. Chris Grado
E-mail Address------- [email protected]
Web Site------- www.avvirtual.org
CDS Code 19642460126003

2015-16 School Accountability Report Card for Academies of the Antelope Valley Page 2 of 15
District Contact Information
District Name------- Antelope Valley Union High School District
Phone Number------- 661-948-7655
Superintendent-------
David Vierra
E-mail Address------- [email protected]
Web Site------- www.avdistrict.org
School Description and Mission Statement (School Year 2016-17)
Academies of the Antelope Valley (AAV) is a dependent charter school that consists of three sites: one virtual/blended site and two brick and mortar sites. There are 65 full time students between grades 7-12, and 455 part time students between grades 9-12 who are enrolled with our online, blended school, Virtual Academy. There are 286 students between grades 7-8 who are enrolled in our brick and mortar middle schools, SOAR Preparatory Academy and Knight Prep Academy. SOAR Prep and Knight Prep have an online component where students utilize web-based textbooks with school issued Chromebooks. CANVAS is the primary Learning Management System (LMS) used by AAV teachers to deliver online instruction followed by Google Classroom . Academies of the Antelope Valley (AAV) is a dependent, public charter school established by the Antelope Valley Union High School District (AVUHSD), designed to offer students alternative educational settings focusing on S.T.E.M. (Science, Technology, Engineering and Mathematics) and online/blended learning. AAV consists of three distinct academies: SOAR Preparatory Academy, Knight Preparatory Academy and Virtual Academy. All Academies are designed to meet the learning needs of the 21st century student. Modeled after SOAR High School, AVUHSD’s innovative and highly successful early college program, SOAR Prep puts proven learning principles into the hands and minds of middle school students. SOAR Prep Academy is a free, public charter school operated by the Antelope Valley Union High School District. This unique college readiness program is designed to help 7th and 8th graders with high potential get ready for the next step in their education. Students who successfully complete the two-year program will have the skills needed to take on elite high school classes including early college and advanced placement programs. Knight Preparatory Academy is a unique educational opportunity for students entering the 7th and 8th grades. Patterned after the highly successful Digital Design and Engineering Program (DD&E) at Knight High School, Knight Prep engages students in a relevant and rewarding exploration of academics by providing students with hands-on, interactive project-based learning. Knight Prep takes concepts taught in the classroom and brings them alive through projects, field trips and experiments in the MakerSpace. This state-of-the-art science and engineering lab is equipped with the hardware, software and tools required to turn the theoretical into reality. Successful Knight Prep students may earn priority placement in Knight High School's Digital Design & Engineering program. Highly qualified and motivated teachers lead students to explore engaging topics as they absorb new knowledge. The program is rigorous and demanding, but very rewarding. Utilizing Advancement Via Individual Determination (AVID) techniques and focusing on areas in science, technology, engineering and mathematics (STEM), SOAR Prep and Knight Prep’s goals are to challenge young minds to achieve more. Virtual Academy offers students in grades 7 through 12 an innovative, blended approach to learning. Here, students leverage their native skills as citizens of a highly connected interactive world. The academy’s rigorous curriculum meets and exceeds those found in classroom environments with advanced placement and honors programs available to those that qualify. The mission of the Academies of the Antelope Valley (AAV) is to prepare every student for 21st century college and career expectations by providing a rigorous curriculum relevant to local and global workforce and economic demands through blended virtual and community-based learning opportunities.
2015-16 School Accountability Report Card for Academies of the Antelope Valley Page 3 of 15
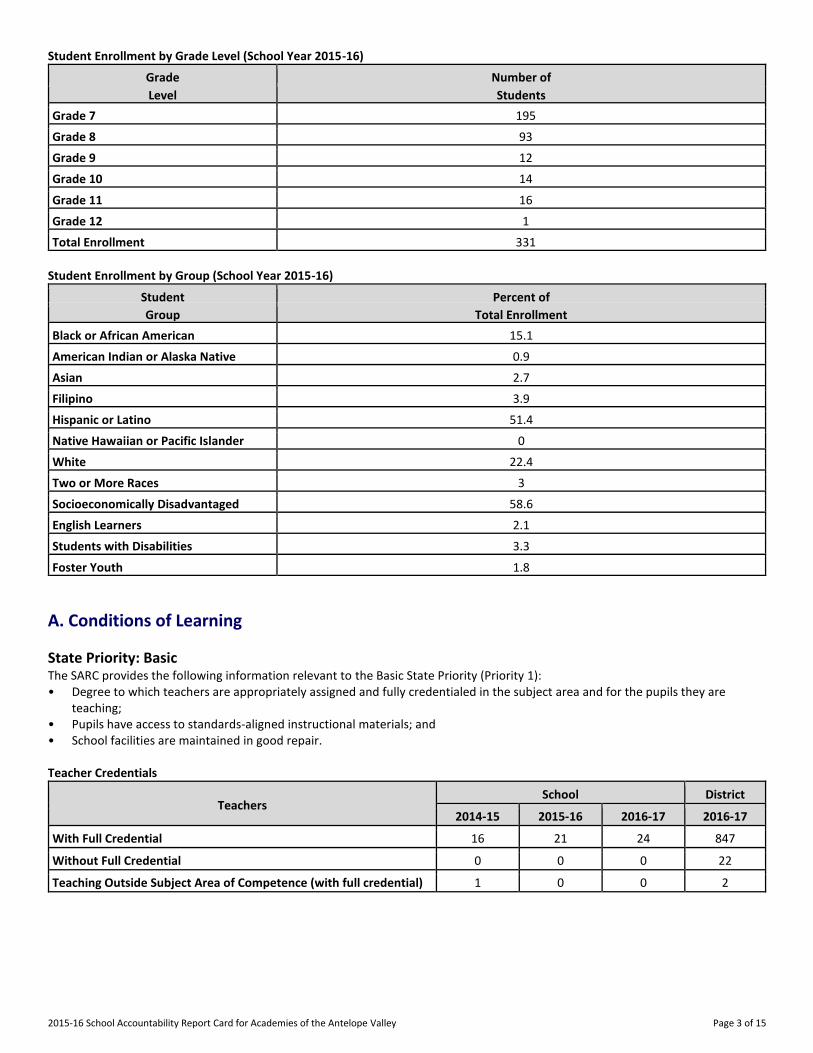
Student Enrollment by Grade Level (School Year 2015-16)
Grade Number of
Level Students
Grade 7 195
Grade 8 93
Grade 9 12
Grade 10 14
Grade 11 16
Grade 12 1
Total Enrollment 331
Student Enrollment by Group (School Year 2015-16)
Student Percent of
Group Total Enrollment
Black or African American 15.1
American Indian or Alaska Native 0.9
Asian 2.7
Filipino 3.9
Hispanic or Latino 51.4
Native Hawaiian or Pacific Islander 0
White 22.4
Two or More Races 3
Socioeconomically Disadvantaged 58.6
English Learners 2.1
Students with Disabilities 3.3
Foster Youth 1.8
A. Conditions of Learning
State Priority: Basic The SARC provides the following information relevant to the Basic State Priority (Priority 1): • Degree to which teachers are appropriately assigned and fully credentialed in the subject area and for the pupils they are
teaching; • Pupils have access to standards-aligned instructional materials; and • School facilities are maintained in good repair. Teacher Credentials
Teachers School District
2014-15 2015-16 2016-17 2016-17
With Full Credential 16 21 24 847
Without Full Credential 0 0 0 22
Teaching Outside Subject Area of Competence (with full credential) 1 0 0 2
2015-16 School Accountability Report Card for Academies of the Antelope Valley Page 4 of 15
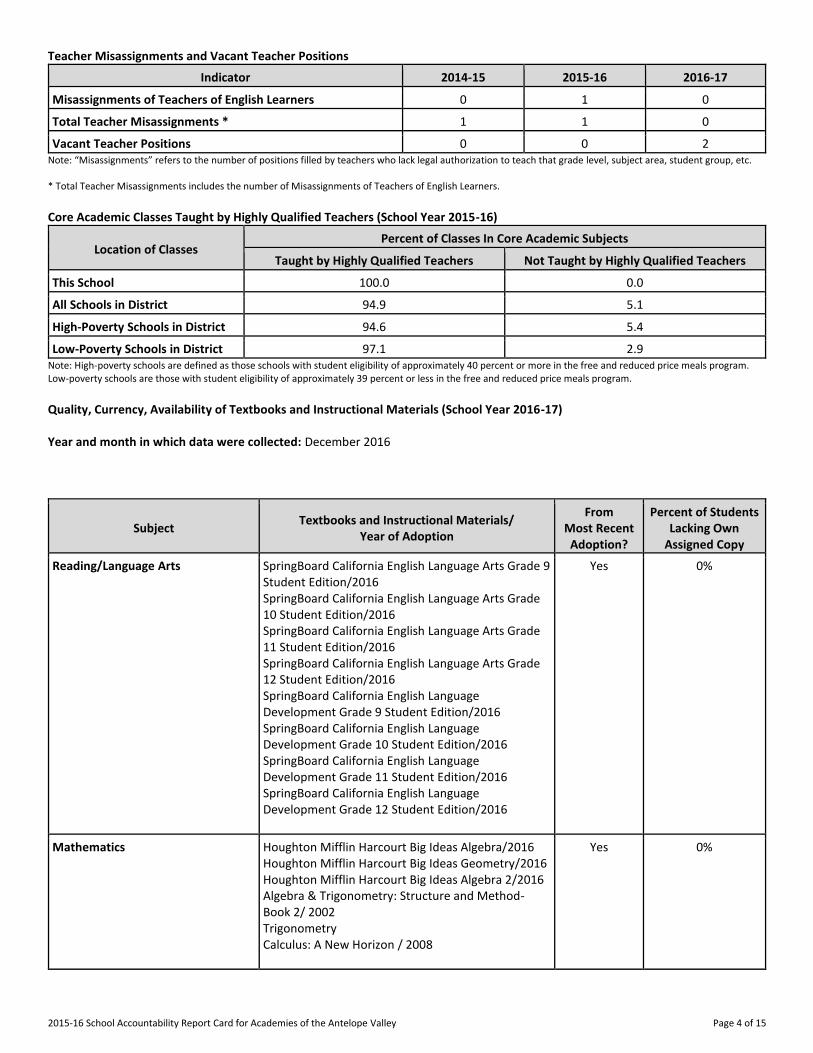
Teacher Misassignments and Vacant Teacher Positions
Indicator 2014-15 2015-16 2016-17
Misassignments of Teachers of English Learners 0 1 0
Total Teacher Misassignments * 1 1 0
Vacant Teacher Positions 0 0 2 Note: “Misassignments” refers to the number of positions filled by teachers who lack legal authorization to teach that grade level, subject area, student group, etc. * Total Teacher Misassignments includes the number of Misassignments of Teachers of English Learners. Core Academic Classes Taught by Highly Qualified Teachers (School Year 2015-16)
Location of Classes Percent of Classes In Core Academic Subjects
Taught by Highly Qualified Teachers Not Taught by Highly Qualified Teachers
This School 100.0 0.0
All Schools in District 94.9 5.1
High-Poverty Schools in District 94.6 5.4
Low-Poverty Schools in District 97.1 2.9 Note: High-poverty schools are defined as those schools with student eligibility of approximately 40 percent or more in the free and reduced price meals program. Low-poverty schools are those with student eligibility of approximately 39 percent or less in the free and reduced price meals program. Quality, Currency, Availability of Textbooks and Instructional Materials (School Year 2016-17) Year and month in which data were collected: December 2016
Subject Textbooks and Instructional Materials/
Year of Adoption
From Most Recent
Adoption?
Percent of Students Lacking Own
Assigned Copy
Reading/Language Arts SpringBoard California English Language Arts Grade 9 Student Edition/2016
SpringBoard California English Language Arts Grade 10 Student Edition/2016
SpringBoard California English Language Arts Grade 11 Student Edition/2016
SpringBoard California English Language Arts Grade 12 Student Edition/2016
SpringBoard California English Language Development Grade 9 Student Edition/2016
SpringBoard California English Language Development Grade 10 Student Edition/2016
SpringBoard California English Language Development Grade 11 Student Edition/2016
SpringBoard California English Language Development Grade 12 Student Edition/2016
Yes 0%
Mathematics Houghton Mifflin Harcourt Big Ideas Algebra/2016
Houghton Mifflin Harcourt Big Ideas Geometry/2016
Houghton Mifflin Harcourt Big Ideas Algebra 2/2016
Algebra & Trigonometry: Structure and Method-Book 2/ 2002
Trigonometry
Calculus: A New Horizon / 2008
Yes 0%
2015-16 School Accountability Report Card for Academies of the Antelope Valley Page 5 of 15
Subject Textbooks and Instructional Materials/
Year of Adoption
From Most Recent
Adoption?
Percent of Students Lacking Own
Assigned Copy
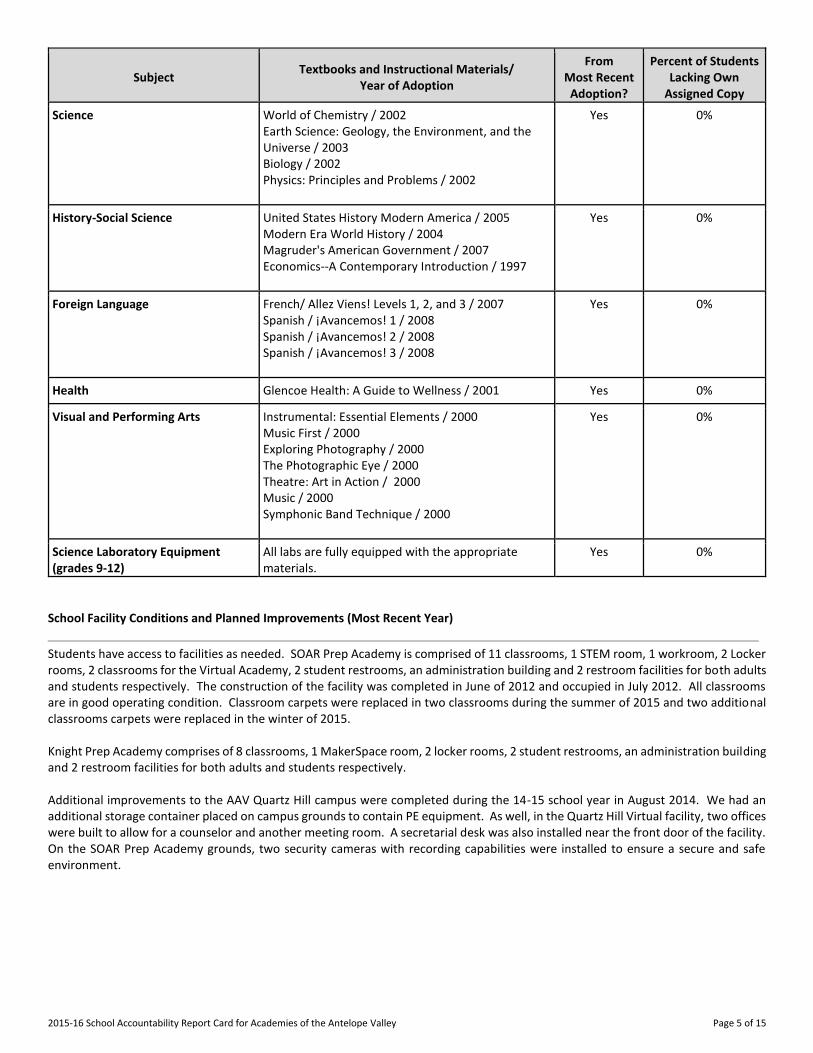
Science World of Chemistry / 2002
Earth Science: Geology, the Environment, and the Universe / 2003
Biology / 2002
Physics: Principles and Problems / 2002
Yes 0%
History-Social Science United States History Modern America / 2005
Modern Era World History / 2004
Magruder's American Government / 2007
Economics--A Contemporary Introduction / 1997
Yes 0%
Foreign Language French/ Allez Viens! Levels 1, 2, and 3 / 2007
Spanish / ¡Avancemos! 1 / 2008
Spanish / ¡Avancemos! 2 / 2008
Spanish / ¡Avancemos! 3 / 2008
Yes 0%
Health Glencoe Health: A Guide to Wellness / 2001 Yes 0%
Visual and Performing Arts Instrumental: Essential Elements / 2000
Music First / 2000
Exploring Photography / 2000
The Photographic Eye / 2000
Theatre: Art in Action / 2000
Music / 2000
Symphonic Band Technique / 2000
Yes 0%
Science Laboratory Equipment (grades 9-12)
All labs are fully equipped with the appropriate materials.
Yes 0%
School Facility Conditions and Planned Improvements (Most Recent Year)
Students have access to facilities as needed. SOAR Prep Academy is comprised of 11 classrooms, 1 STEM room, 1 workroom, 2 Locker rooms, 2 classrooms for the Virtual Academy, 2 student restrooms, an administration building and 2 restroom facilities for both adults and students respectively. The construction of the facility was completed in June of 2012 and occupied in July 2012. All classrooms are in good operating condition. Classroom carpets were replaced in two classrooms during the summer of 2015 and two additional classrooms carpets were replaced in the winter of 2015. Knight Prep Academy comprises of 8 classrooms, 1 MakerSpace room, 2 locker rooms, 2 student restrooms, an administration building and 2 restroom facilities for both adults and students respectively. Additional improvements to the AAV Quartz Hill campus were completed during the 14-15 school year in August 2014. We had an additional storage container placed on campus grounds to contain PE equipment. As well, in the Quartz Hill Virtual facility, two offices were built to allow for a counselor and another meeting room. A secretarial desk was also installed near the front door of the facility. On the SOAR Prep Academy grounds, two security cameras with recording capabilities were installed to ensure a secure and safe environment.
2015-16 School Accountability Report Card for Academies of the Antelope Valley Page 6 of 15
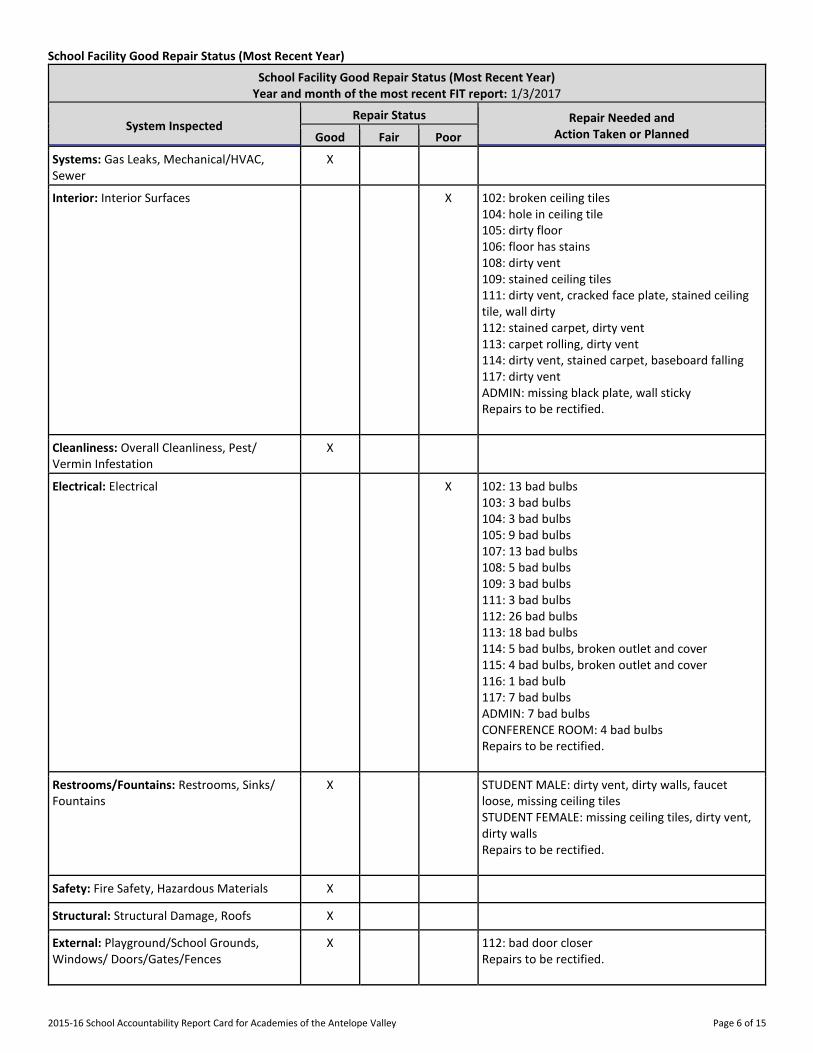
School Facility Good Repair Status (Most Recent Year)
School Facility Good Repair Status (Most Recent Year) Year and month of the most recent FIT report: 1/3/2017
System Inspected Repair Status Repair Needed and
Action Taken or Planned Good Fair Poor
Systems: Gas Leaks, Mechanical/HVAC, Sewer
X
Interior: Interior Surfaces X 102: broken ceiling tiles 104: hole in ceiling tile 105: dirty floor 106: floor has stains 108: dirty vent 109: stained ceiling tiles 111: dirty vent, cracked face plate, stained ceiling tile, wall dirty 112: stained carpet, dirty vent 113: carpet rolling, dirty vent 114: dirty vent, stained carpet, baseboard falling 117: dirty vent ADMIN: missing black plate, wall sticky Repairs to be rectified.
Cleanliness: Overall Cleanliness, Pest/ Vermin Infestation
X
Electrical: Electrical X 102: 13 bad bulbs 103: 3 bad bulbs 104: 3 bad bulbs 105: 9 bad bulbs 107: 13 bad bulbs 108: 5 bad bulbs 109: 3 bad bulbs 111: 3 bad bulbs 112: 26 bad bulbs 113: 18 bad bulbs 114: 5 bad bulbs, broken outlet and cover 115: 4 bad bulbs, broken outlet and cover 116: 1 bad bulb 117: 7 bad bulbs ADMIN: 7 bad bulbs CONFERENCE ROOM: 4 bad bulbs Repairs to be rectified.
Restrooms/Fountains: Restrooms, Sinks/ Fountains
X STUDENT MALE: dirty vent, dirty walls, faucet loose, missing ceiling tiles STUDENT FEMALE: missing ceiling tiles, dirty vent, dirty walls Repairs to be rectified.
Safety: Fire Safety, Hazardous Materials X
Structural: Structural Damage, Roofs X
External: Playground/School Grounds, Windows/ Doors/Gates/Fences
X 112: bad door closer Repairs to be rectified.
2015-16 School Accountability Report Card for Academies of the Antelope Valley Page 7 of 15
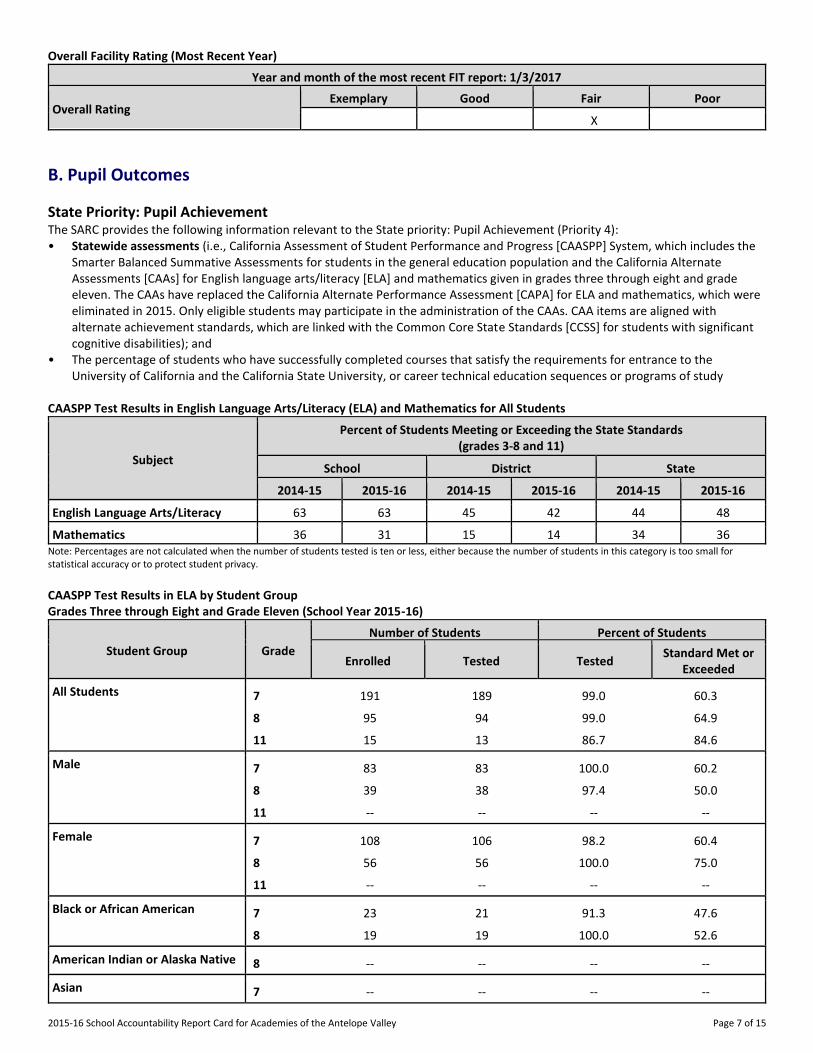
Overall Facility Rating (Most Recent Year)
Year and month of the most recent FIT report: 1/3/2017
Overall Rating Exemplary Good Fair Poor
X
B. Pupil Outcomes
State Priority: Pupil Achievement The SARC provides the following information relevant to the State priority: Pupil Achievement (Priority 4): • Statewide assessments (i.e., California Assessment of Student Performance and Progress [CAASPP] System, which includes the
Smarter Balanced Summative Assessments for students in the general education population and the California Alternate Assessments [CAAs] for English language arts/literacy [ELA] and mathematics given in grades three through eight and grade eleven. The CAAs have replaced the California Alternate Performance Assessment [CAPA] for ELA and mathematics, which were eliminated in 2015. Only eligible students may participate in the administration of the CAAs. CAA items are aligned with alternate achievement standards, which are linked with the Common Core State Standards [CCSS] for students with significant cognitive disabilities); and
• The percentage of students who have successfully completed courses that satisfy the requirements for entrance to the University of California and the California State University, or career technical education sequences or programs of study
CAASPP Test Results in English Language Arts/Literacy (ELA) and Mathematics for All Students
Subject
Percent of Students Meeting or Exceeding the State Standards (grades 3-8 and 11)
School District State
2014-15 2015-16 2014-15 2015-16 2014-15 2015-16
English Language Arts/Literacy 63 63 45 42 44 48
Mathematics 36 31 15 14 34 36 Note: Percentages are not calculated when the number of students tested is ten or less, either because the number of students in this category is too small for statistical accuracy or to protect student privacy.
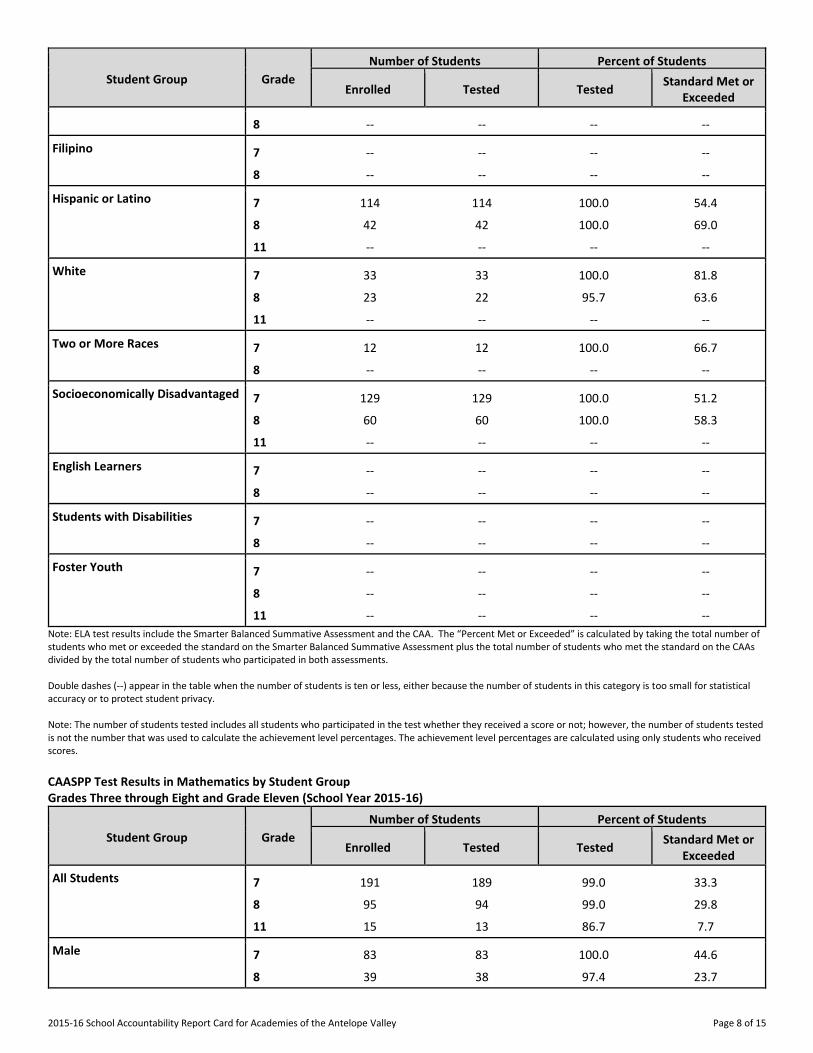
CAASPP Test Results in ELA by Student Group Grades Three through Eight and Grade Eleven (School Year 2015-16)
Student Group Grade
Number of Students Percent of Students
Enrolled Tested Tested Standard Met or
Exceeded
All Students 7 191 189 99.0 60.3
8 95 94 99.0 64.9
11 15 13 86.7 84.6
Male 7 83 83 100.0 60.2
8 39 38 97.4 50.0
11 -- -- -- --
Female 7 108 106 98.2 60.4
8 56 56 100.0 75.0
11 -- -- -- --
Black or African American 7 23 21 91.3 47.6
8 19 19 100.0 52.6
American Indian or Alaska Native 8 -- -- -- --
Asian 7 -- -- -- --
2015-16 School Accountability Report Card for Academies of the Antelope Valley Page 8 of 15
Student Group Grade
Number of Students Percent of Students
Enrolled Tested Tested Standard Met or
Exceeded
8 -- -- -- --
Filipino 7 -- -- -- --
8 -- -- -- --
Hispanic or Latino 7 114 114 100.0 54.4
8 42 42 100.0 69.0
11 -- -- -- --
White 7 33 33 100.0 81.8
8 23 22 95.7 63.6
11 -- -- -- --
Two or More Races 7 12 12 100.0 66.7
8 -- -- -- --
Socioeconomically Disadvantaged 7 129 129 100.0 51.2
8 60 60 100.0 58.3
11 -- -- -- --
English Learners 7 -- -- -- --
8 -- -- -- --
Students with Disabilities 7 -- -- -- --
8 -- -- -- --
Foster Youth 7 -- -- -- --
8 -- -- -- --
11 -- -- -- --
Note: ELA test results include the Smarter Balanced Summative Assessment and the CAA. The “Percent Met or Exceeded” is calculated by taking the total number of students who met or exceeded the standard on the Smarter Balanced Summative Assessment plus the total number of students who met the standard on the CAAs divided by the total number of students who participated in both assessments. Double dashes (--) appear in the table when the number of students is ten or less, either because the number of students in this category is too small for statistical accuracy or to protect student privacy. Note: The number of students tested includes all students who participated in the test whether they received a score or not; however, the number of students tested is not the number that was used to calculate the achievement level percentages. The achievement level percentages are calculated using only students who received scores.
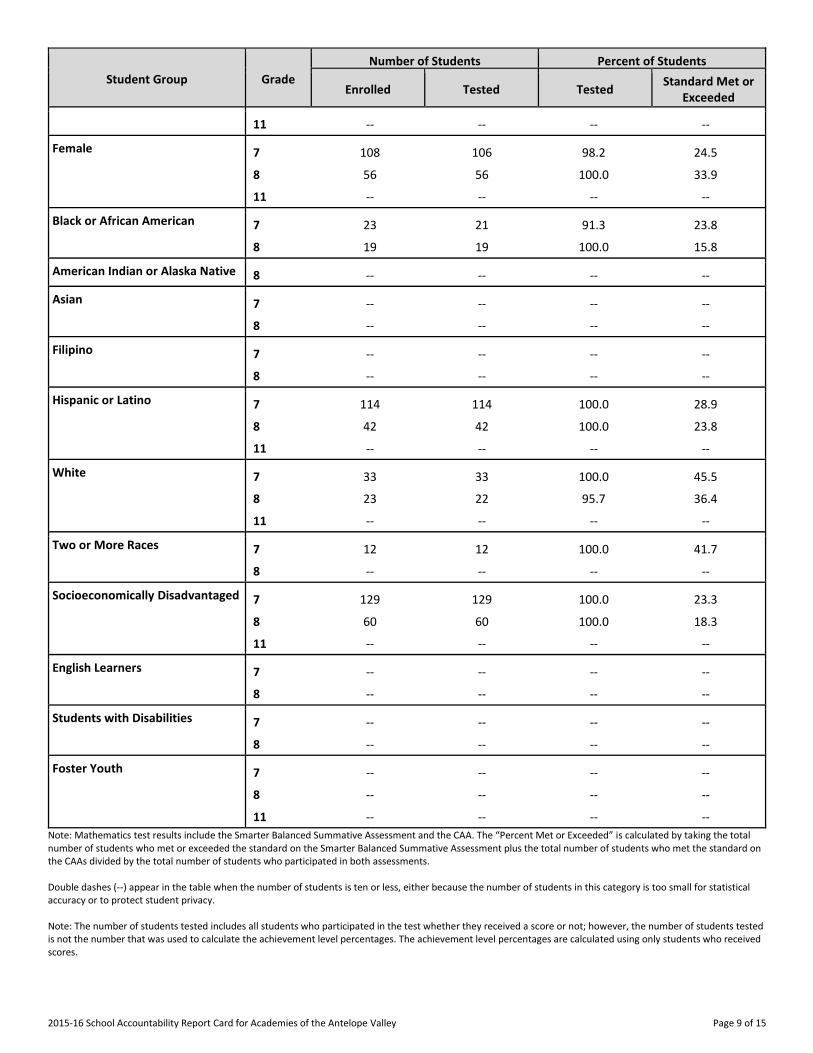
CAASPP Test Results in Mathematics by Student Group Grades Three through Eight and Grade Eleven (School Year 2015-16)
Student Group Grade
Number of Students Percent of Students
Enrolled Tested Tested Standard Met or
Exceeded
All Students 7 191 189 99.0 33.3
8 95 94 99.0 29.8
11 15 13 86.7 7.7
Male 7 83 83 100.0 44.6
8 39 38 97.4 23.7
2015-16 School Accountability Report Card for Academies of the Antelope Valley Page 9 of 15
Student Group Grade
Number of Students Percent of Students
Enrolled Tested Tested Standard Met or
Exceeded
11 -- -- -- --
Female 7 108 106 98.2 24.5
8 56 56 100.0 33.9
11 -- -- -- --
Black or African American 7 23 21 91.3 23.8
8 19 19 100.0 15.8
American Indian or Alaska Native 8 -- -- -- --
Asian 7 -- -- -- --
8 -- -- -- --
Filipino 7 -- -- -- --
8 -- -- -- --
Hispanic or Latino 7 114 114 100.0 28.9
8 42 42 100.0 23.8
11 -- -- -- --
White 7 33 33 100.0 45.5
8 23 22 95.7 36.4
11 -- -- -- --
Two or More Races 7 12 12 100.0 41.7
8 -- -- -- --
Socioeconomically Disadvantaged 7 129 129 100.0 23.3
8 60 60 100.0 18.3
11 -- -- -- --
English Learners 7 -- -- -- --
8 -- -- -- --
Students with Disabilities 7 -- -- -- --
8 -- -- -- --
Foster Youth 7 -- -- -- --
8 -- -- -- --
11 -- -- -- --
Note: Mathematics test results include the Smarter Balanced Summative Assessment and the CAA. The “Percent Met or Exceeded” is calculated by taking the total number of students who met or exceeded the standard on the Smarter Balanced Summative Assessment plus the total number of students who met the standard on the CAAs divided by the total number of students who participated in both assessments. Double dashes (--) appear in the table when the number of students is ten or less, either because the number of students in this category is too small for statistical accuracy or to protect student privacy. Note: The number of students tested includes all students who participated in the test whether they received a score or not; however, the number of students tested is not the number that was used to calculate the achievement level percentages. The achievement level percentages are calculated using only students who received scores.
2015-16 School Accountability Report Card for Academies of the Antelope Valley Page 10 of 15
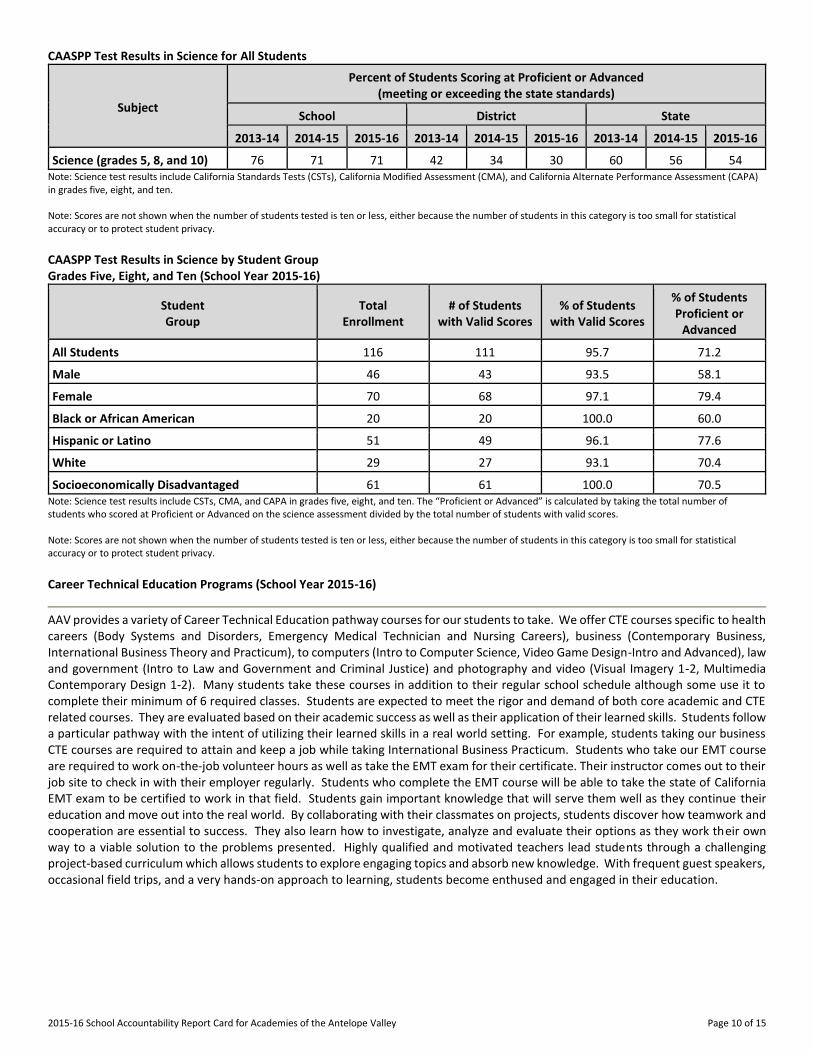
CAASPP Test Results in Science for All Students
Subject
Percent of Students Scoring at Proficient or Advanced (meeting or exceeding the state standards)
School District State
2013-14 2014-15 2015-16 2013-14 2014-15 2015-16 2013-14 2014-15 2015-16
Science (grades 5, 8, and 10) 76 71 71 42 34 30 60 56 54 Note: Science test results include California Standards Tests (CSTs), California Modified Assessment (CMA), and California Alternate Performance Assessment (CAPA) in grades five, eight, and ten. Note: Scores are not shown when the number of students tested is ten or less, either because the number of students in this category is too small for statistical accuracy or to protect student privacy.
CAASPP Test Results in Science by Student Group Grades Five, Eight, and Ten (School Year 2015-16)
Student Group
Total Enrollment
# of Students with Valid Scores
% of Students with Valid Scores
% of Students Proficient or
Advanced
All Students 116 111 95.7 71.2
Male 46 43 93.5 58.1
Female 70 68 97.1 79.4
Black or African American 20 20 100.0 60.0
Hispanic or Latino 51 49 96.1 77.6
White 29 27 93.1 70.4
Socioeconomically Disadvantaged 61 61 100.0 70.5 Note: Science test results include CSTs, CMA, and CAPA in grades five, eight, and ten. The “Proficient or Advanced” is calculated by taking the total number of students who scored at Proficient or Advanced on the science assessment divided by the total number of students with valid scores. Note: Scores are not shown when the number of students tested is ten or less, either because the number of students in this category is too small for statistical accuracy or to protect student privacy.
Career Technical Education Programs (School Year 2015-16)
AAV provides a variety of Career Technical Education pathway courses for our students to take. We offer CTE courses specific to health careers (Body Systems and Disorders, Emergency Medical Technician and Nursing Careers), business (Contemporary Business, International Business Theory and Practicum), to computers (Intro to Computer Science, Video Game Design-Intro and Advanced), law and government (Intro to Law and Government and Criminal Justice) and photography and video (Visual Imagery 1-2, Multimedia Contemporary Design 1-2). Many students take these courses in addition to their regular school schedule although some use it to complete their minimum of 6 required classes. Students are expected to meet the rigor and demand of both core academic and CTE related courses. They are evaluated based on their academic success as well as their application of their learned skills. Students follow a particular pathway with the intent of utilizing their learned skills in a real world setting. For example, students taking our business CTE courses are required to attain and keep a job while taking International Business Practicum. Students who take our EMT course are required to work on-the-job volunteer hours as well as take the EMT exam for their certificate. Their instructor comes out to their job site to check in with their employer regularly. Students who complete the EMT course will be able to take the state of California EMT exam to be certified to work in that field. Students gain important knowledge that will serve them well as they continue their education and move out into the real world. By collaborating with their classmates on projects, students discover how teamwork and cooperation are essential to success. They also learn how to investigate, analyze and evaluate their options as they work their own way to a viable solution to the problems presented. Highly qualified and motivated teachers lead students through a challenging project-based curriculum which allows students to explore engaging topics and absorb new knowledge. With frequent guest speakers, occasional field trips, and a very hands-on approach to learning, students become enthused and engaged in their education.
2015-16 School Accountability Report Card for Academies of the Antelope Valley Page 11 of 15
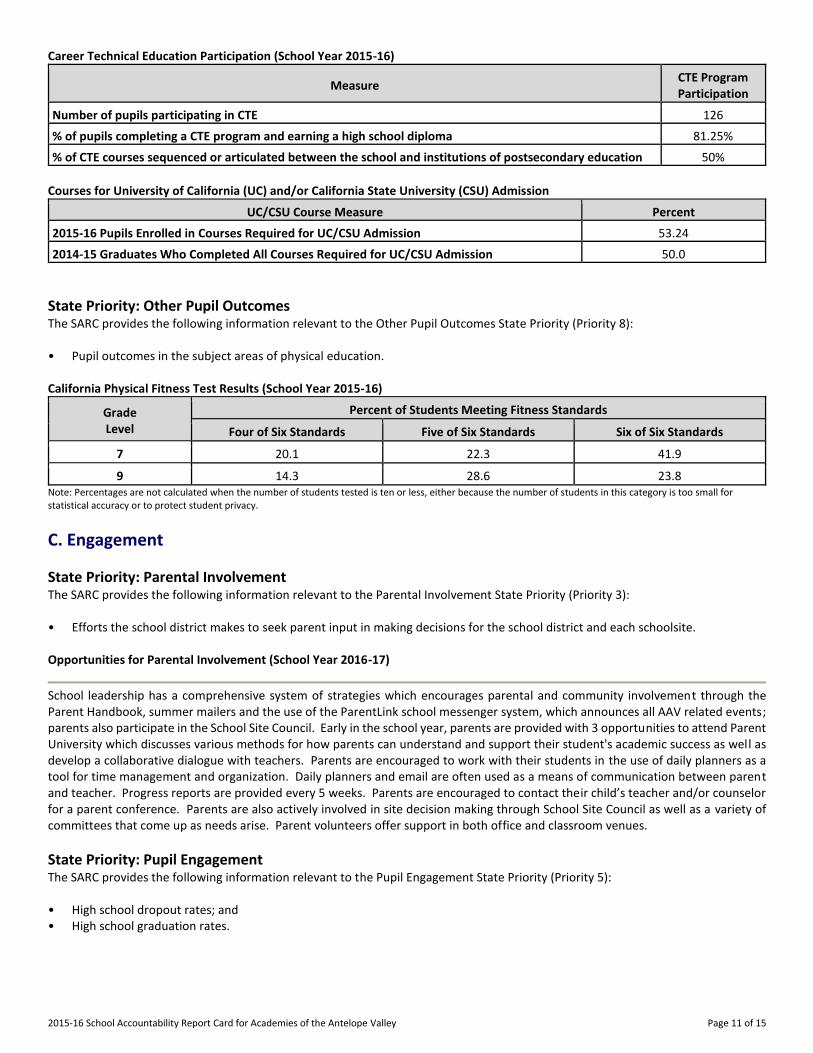
Career Technical Education Participation (School Year 2015-16)
Measure CTE Program Participation
Number of pupils participating in CTE 126
% of pupils completing a CTE program and earning a high school diploma 81.25%
% of CTE courses sequenced or articulated between the school and institutions of postsecondary education 50%
Courses for University of California (UC) and/or California State University (CSU) Admission
UC/CSU Course Measure Percent
2015-16 Pupils Enrolled in Courses Required for UC/CSU Admission 53.24
2014-15 Graduates Who Completed All Courses Required for UC/CSU Admission 50.0
State Priority: Other Pupil Outcomes The SARC provides the following information relevant to the Other Pupil Outcomes State Priority (Priority 8): • Pupil outcomes in the subject areas of physical education. California Physical Fitness Test Results (School Year 2015-16)
Grade Level
Percent of Students Meeting Fitness Standards
Four of Six Standards Five of Six Standards Six of Six Standards
---7--- 20.1 22.3 41.9
---9--- 14.3 28.6 23.8 Note: Percentages are not calculated when the number of students tested is ten or less, either because the number of students in this category is too small for statistical accuracy or to protect student privacy.
C. Engagement
State Priority: Parental Involvement The SARC provides the following information relevant to the Parental Involvement State Priority (Priority 3): • Efforts the school district makes to seek parent input in making decisions for the school district and each schoolsite. Opportunities for Parental Involvement (School Year 2016-17)
School leadership has a comprehensive system of strategies which encourages parental and community involvement through the Parent Handbook, summer mailers and the use of the ParentLink school messenger system, which announces all AAV related events; parents also participate in the School Site Council. Early in the school year, parents are provided with 3 opportunities to attend Parent University which discusses various methods for how parents can understand and support their student's academic success as well as develop a collaborative dialogue with teachers. Parents are encouraged to work with their students in the use of daily planners as a tool for time management and organization. Daily planners and email are often used as a means of communication between parent and teacher. Progress reports are provided every 5 weeks. Parents are encouraged to contact their child’s teacher and/or counselor for a parent conference. Parents are also actively involved in site decision making through School Site Council as well as a variety of committees that come up as needs arise. Parent volunteers offer support in both office and classroom venues.
State Priority: Pupil Engagement The SARC provides the following information relevant to the Pupil Engagement State Priority (Priority 5): • High school dropout rates; and • High school graduation rates.

2015-16 School Accountability Report Card for Academies of the Antelope Valley Page 12 of 15
Dropout Rate and Graduation Rate (Four-Year Cohort Rate)
Indicator School District State
2012-13 2013-14 2014-15 2012-13 2013-14 2014-15 2012-13 2013-14 2014-15
Dropout Rate 18.20 18.20 46.70 10.40 10.10 9.20 11.40 11.50 10.70
Graduation Rate 63.64 81.82 53.33 77.69 79.79 81.19 80.44 80.95 82.27
Completion of High School Graduation Requirements - Graduating Class of 2015 (One-Year Rate)
Group Graduating Class of 2015
School District State
All Students 67 67 86
Black or African American 50 59 78
American Indian or Alaska Native 0 50 78
Asian 0 73 93
Filipino 0 87 93
Hispanic or Latino 100 67 83
Native Hawaiian/Pacific Islander 0 64 85
White 50 73 91
Two or More Races 0 76 89
Socioeconomically Disadvantaged 100 44 66
English Learners 0 38 54
Students with Disabilities 100 67 78
State Priority: School Climate The SARC provides the following information relevant to the School Climate State Priority (Priority 6): • Pupil suspension rates; • Pupil expulsion rates; and • Other local measures on the sense of safety. Suspensions and Expulsions
Rate School District State
2013-14 2014-15 2015-16 2013-14 2014-15 2015-16 2013-14 2014-15 2015-16
Suspensions------- 3.2 2.1 2.5 10.5 8.6 7.8 4.4 3.8 3.7
Expulsions------- 0.0 0.0 0.0 0.6 0.5 0.4 0.1 0.1 0.1
School Safety Plan (School Year 2016-17)
School safety is a top priority at SOAR Prep Academy, Knight Prep Academy and Virtual Academy. The Antelope Valley Union High School District has a full time Director of School Safety to oversee our district’s safety program. SOAR Prep Academy and Knight Prep Academy each have a campus supervisor whose main role is to provide a safe learning environment for students. Additional staff members, including administration and counseling, are proactive in providing a safe learning environment as well. SOAR Prep Academy and Knight Prep Academy have developed and implemented a Safe School Plan in accordance with Senate Bill 187. A complete copy of the School Safety Plans can be obtained in the Administration Office.
2015-16 School Accountability Report Card for Academies of the Antelope Valley Page 13 of 15
D. Other SARC Information
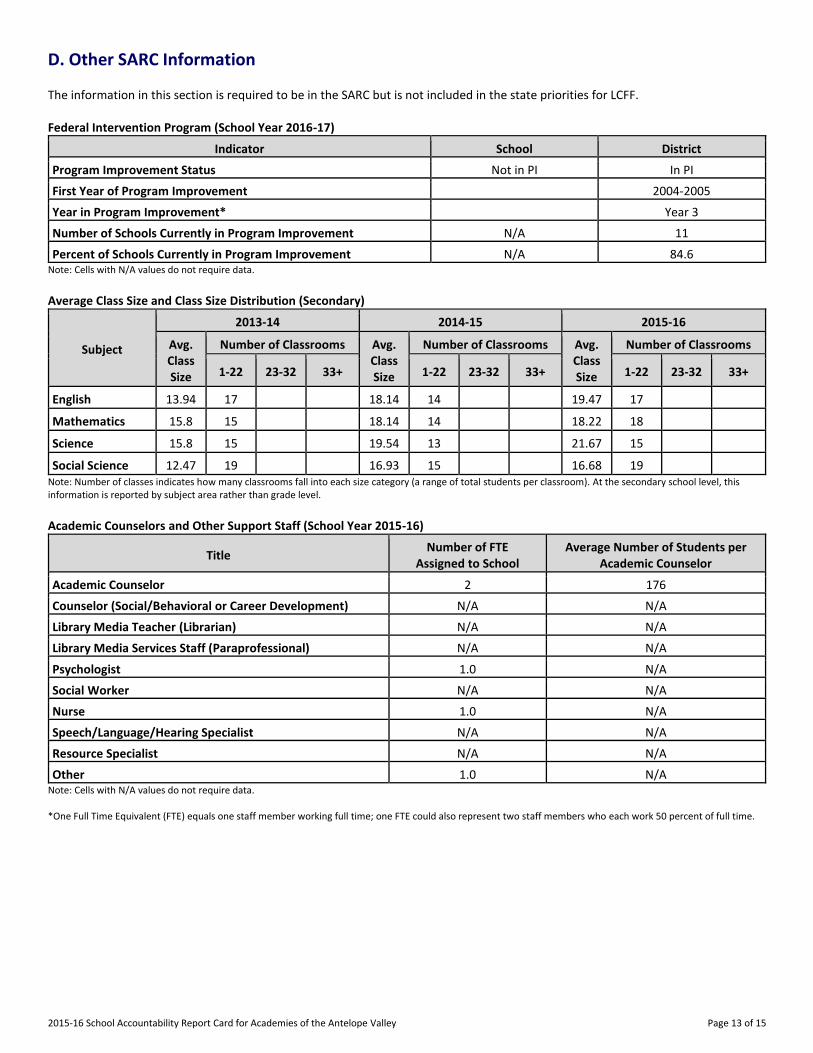
The information in this section is required to be in the SARC but is not included in the state priorities for LCFF. Federal Intervention Program (School Year 2016-17)
Indicator School District
Program Improvement Status Not in PI In PI
First Year of Program Improvement 2004-2005
Year in Program Improvement* Year 3
Number of Schools Currently in Program Improvement N/A 11
Percent of Schools Currently in Program Improvement N/A 84.6 Note: Cells with N/A values do not require data.
Average Class Size and Class Size Distribution (Secondary)
Subject
2013-14 2014-15 2015-16
Avg. Class Size
Number of Classrooms Avg. Class Size
Number of Classrooms Avg. Class Size
Number of Classrooms
1-22 23-32 33+ 1-22 23-32 33+ 1-22 23-32 33+
English------- ----------
13.94 17 18.14 14 19.47 17
Mathematics ----------
15.8 15 18.14 14 18.22 18
Science------- ----------
15.8 15 19.54 13 21.67 15
Social Science ----------
12.47 19 16.93 15 16.68 19 Note: Number of classes indicates how many classrooms fall into each size category (a range of total students per classroom). At the secondary school level, this information is reported by subject area rather than grade level. Academic Counselors and Other Support Staff (School Year 2015-16)
Title Number of FTE
Assigned to School Average Number of Students per
Academic Counselor
Academic Counselor------- 2 176
Counselor (Social/Behavioral or Career Development) N/A N/A
Library Media Teacher (Librarian) N/A N/A
Library Media Services Staff (Paraprofessional) N/A N/A
Psychologist------- 1.0 N/A
Social Worker------- N/A N/A
Nurse------- 1.0 N/A
Speech/Language/Hearing Specialist N/A N/A
Resource Specialist------- N/A N/A
Other------- 1.0 N/A Note: Cells with N/A values do not require data. *One Full Time Equivalent (FTE) equals one staff member working full time; one FTE could also represent two staff members who each work 50 percent of full time.
2015-16 School Accountability Report Card for Academies of the Antelope Valley Page 14 of 15
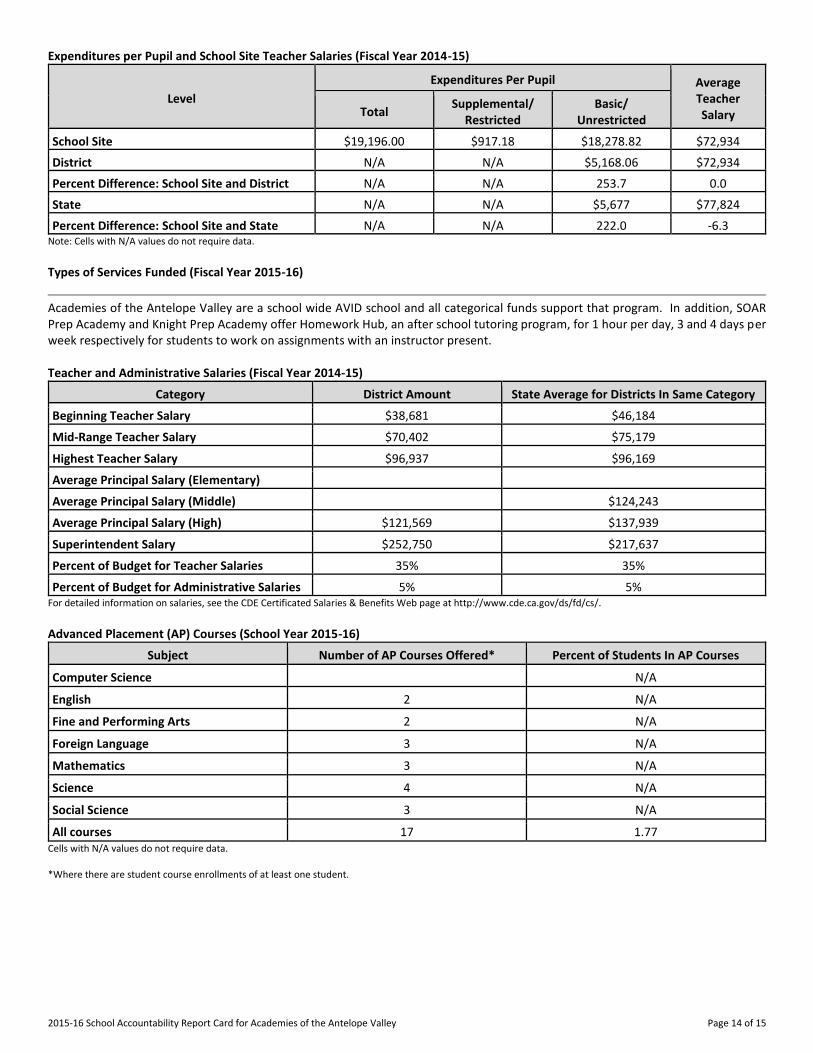
Expenditures per Pupil and School Site Teacher Salaries (Fiscal Year 2014-15)
Level
Expenditures Per Pupil Average Teacher Salary Total
Supplemental/ Restricted
Basic/ Unrestricted
School Site------- $19,196.00 $917.18 $18,278.82 $72,934
District------- N/A N/A $5,168.06 $72,934
Percent Difference: School Site and District N/A N/A 253.7 0.0
State------- N/A N/A $5,677 $77,824
Percent Difference: School Site and State N/A N/A 222.0 -6.3 Note: Cells with N/A values do not require data.
Types of Services Funded (Fiscal Year 2015-16)
Academies of the Antelope Valley are a school wide AVID school and all categorical funds support that program. In addition, SOAR Prep Academy and Knight Prep Academy offer Homework Hub, an after school tutoring program, for 1 hour per day, 3 and 4 days per week respectively for students to work on assignments with an instructor present. Teacher and Administrative Salaries (Fiscal Year 2014-15)
Category District Amount State Average for Districts In Same Category
Beginning Teacher Salary $38,681 $46,184
Mid-Range Teacher Salary $70,402 $75,179
Highest Teacher Salary $96,937 $96,169
Average Principal Salary (Elementary)
Average Principal Salary (Middle) $124,243
Average Principal Salary (High) $121,569 $137,939
Superintendent Salary $252,750 $217,637
Percent of Budget for Teacher Salaries 35% 35%
Percent of Budget for Administrative Salaries 5% 5% For detailed information on salaries, see the CDE Certificated Salaries & Benefits Web page at http://www.cde.ca.gov/ds/fd/cs/. Advanced Placement (AP) Courses (School Year 2015-16)
Subject Number of AP Courses Offered* Percent of Students In AP Courses
Computer Science N/A
English------- 2 N/A
Fine and Performing Arts 2 N/A
Foreign Language 3 N/A
Mathematics 3 N/A
Science------- 4 N/A
Social Science 3 N/A
All courses 17 1.77 Cells with N/A values do not require data. *Where there are student course enrollments of at least one student.
2015-16 School Accountability Report Card for Academies of the Antelope Valley Page 15 of 15
Professional Development (Most Recent Three Years)
As AAV continues to develop with Common Core Standards, the focus is not on the previous summative state data. Teachers are using formative assessments to drive instruction and debrief with colleagues to plan valuable lessons. The Common Core focus put teachers in the mindset of preparing all of their students for college or a career after high school. The leadership on campus has been the driving force of this objective. Using the Local Control and Accountability Plan (LCAP) that originated through student, staff and community input, is an additional driving force that helps determine professional development opportunities to better prepare students to meet the demands of college and career. A fall interim assessment was given to evaluate student progress. This information is used to modify instruction and address student needs. Results are regularly used to match students’ ability and performance. All of this information is taken into consideration when monitoring and refining the single school wide plan. AAV leadership provides opportunities for teachers to collaborate and share with one another. This meaningful collaboration is fruitful; it provides time for valuable discussion on content, students, and instructional strategies. The overall school wide learning results are always at the center of these collaboration meetings: 1. Self-directed learners, 2. Open-minded thinkers and problem solvers, and 3. Active communicators. AAV teachers are highly qualified and have met the requirements of the Elementary and Secondary Education Act. All new teachers within the AVUHSD must complete the AVTI (Antelope Valley Teacher Induction) program and are offered ongoing professional development (the main focus being Common Core Standards). AVID teachers attend summer institutes and other AVID workshops throughout the year in order to provide quality AVID experiences in the classroom. They are supported by a site coordinator and district coach. Teachers with AVID elective experience provide support to teachers who are new to the AVID program. AAV has monthly meetings, district instructional Partners, and teachers have opportunities to attend professional development workshops both on and off site. AAV has designated teachers that attend meetings focusing specifically on Common Core instruction, project based learning and AVID. Teachers and staff are encouraged to attend relevant professional development events. A team of teachers regularly attend the AVID conferences to learn and refine AVID strategies. Virtual Academy teachers participated in Leading Edge Certification in the summer of 2014 as do any newly hired teachers. They have also attended the eLearning Symposium Conference as well as iNACOL and ISTE Conferences to be current with technologically educational trends. All staff attends professional development conferences, focus groups and workshops to improve student achievement. SOAR Prep and Knight Prep Academy staff regularly attends district trainings and Ad Hoc Committee meetings.