Embed Size (px)
Citation preview

PREI®
PRUDENTIAL REAL ESTATE INVESTORS
ABU DHABI
ATLANTA
BEIJING
CHICAGO
HONG KONG
ISTANBUL
US Quarterly OutlookJULY 2012
LISBON
LONDON
LUXEMBOURG
MADISON
MADRID
MEXICO CITY
MIAMI
MILAN
MUNICH
NEW YORK
PARIS
RIO DE JANEIRO
SAN FRANCISCO
SAO PAULO
SEOUL
SINGAPORE
SYDNEY
TOKYO
Prudential Real Estate Investors7 Giralda FarmsMadison, NJ 07940 USA 973.683.1745 Phone973.734.1319 Fax
Confidential, Not For Further Distribution. REF: #PFIA – 8WJQX6
www.prei.com
PRUDENTIAL REAL ESTATE INVESTORS
Executive Summary
Macro Economic Themes
• Early year hopes for a stronger recovery have been dashed, replaced by resignation that the economy will muddle through the rest of the year.
• The seemingly never-ending European sovereign debt crisis, decelerating growth in Asia and the political stalemate in DC regarding the “fiscal cliff” create uncertainty that is not likely to be resolved any time soon.
• Businesses are flush with cash, but they are not likely to put capital at risk until volatility wanes and there is more clarity about future government policies. The shape of US public policy is likely to remain unclear until after the presidential election.
• Positive indicators include signs that the housing market has bottomed, capital flows to the US from investors who see it as a safe haven and lower oil prices that are providing a boost to consumers.
• The Federal Reserve extended Operation Twist through the end of the year and is committed to act if the economy loses steam.
Implications & Outlook for Commercial Real Estate
• A muddle-along economic scenario, the most-likely outcome going forward, should produce slow, steady improvements in commercial real estate fundamentals. Slow growth might even be the optimal long-term scenario for the sector as it will discourage development and keep interest rates low.
• Apartment fundamentals are the strongest among the sectors, and demand should remain strong for several more years. Apartments are the first sector with increased development activity, although the bulk of new supply is at least a year or two away.
• Demand is positive, but weak, for office, retail and industrial properties. Since development activity is very limited, vacancies are slowly improving. Hotel revenue is rising for the third straight year, but the rate of growth is expected to slow in the second half.
• Investor demand for commercial real estate remains strong, particularly from REITs and foreign investors. Core markets remain the top target, but volume g p y g p gis rising in secondary markets as investors seek yield. Property values are rising, though the rate of growth has slowed recently.
• Low rates are stimulating the debt markets. Most lenders are actively seeking to book mortgages, although they still prefer low-leverage, low risk deals.
• REITs continue to see strong inflows, particularly from investors looking for dividend income. REITs can raise copious amounts of capital at favorable rates, which puts them in strong position for acquisitions and development.
1

PRUDENTIAL REAL ESTATE INVESTORS
Economic Trends
Economic Outlook Swings Back to Negative1) DUKE UNIVERSITY CFO BUSINESS OUTLOOK SURVEY
Economic Outlook Swings Back to Negative
• The economic outlook turned negative in the second quarter due to weak job growth numbers, the worsening sovereign debt crisis in Europe and concerns that the “fiscal cliff” goes unresolved until after the presidential election.
• The economy added an average of 75,000 jobs per month in 2Q12, about one-third of 60
65
70
the growth rate in the first quarter, and the unemployment rate stayed flat at 8.2%.
• Despite having plenty of cash on hand and healthy balance sheets, US businesses are reluctant to increase hiring significantly due to uncertainty about the economy. Uncertainty is not likely to dissipate anytime soon, since some of the key underlying issues (European debt and US policy) will take time to resolve.
40
45
50
55
UN
-05
EC-0
5
UN
-06
EC-0
6
UN
-07
EC-0
7
UN
-08
EC-0
8
UN
-09
EC-0
9
UN
-10
EC-1
0
UN
-11
EC-1
1
UN
-12
2) POTENTIAL IMPACT OF POLICY ON GDP IS GREAT
• The outlook of corporate chief financial officers has dimmed in recent months, although the results have bounced along a narrow band for several years, according to a survey by Duke University’s CFO Magazine (CHART 1). Even so, the surveyed CFOs expect to add 2% to their workforces in the next year, potentially a positive sign for job creation.
JU D J U D J U D J U D JU D JU D JU D J U
U.S. EUROPE
3%• The “fiscal cliff” created by last year’s temporary budget agreement is hanging over
next year’s economy. If the deal is not renegotiated, the combination of tax increases, budget cuts and end of tax cuts will likely push the economy into recession (CHART 2).
• Some positive economic indicators include signs that the housing market has b tt d th t d i th i f il hi h t h i th k t f -2%
-1%
0%
1%
2%
bottomed, the recent drop in the price of oil, which puts cash in the pockets of consumers, and the fact that investors continue to see the US as a safe haven relative to other economies.
-3%
-2%
09 10 11 12 13
TAX REBATE CASH CLUNK. OTHER STIM.RECOVERY ACT PAY. TAX & UI DEBT-CEIL. DEALS&L GOVT BUSH TAX CUTS TOTAL POLICY
2
Source: Duke University, CFO Magazine, Moody’s Analytics, Prudential Real Estate Investors
S&L GOVT BUSH TAX CUTS TOTAL POLICY
PRUDENTIAL REAL ESTATE INVESTORS
Transactions and Pricing
3) CAP RATE SPREAD RISES RELATIVE TO CORPORATE BONDSDeal Activity is on the Upswing
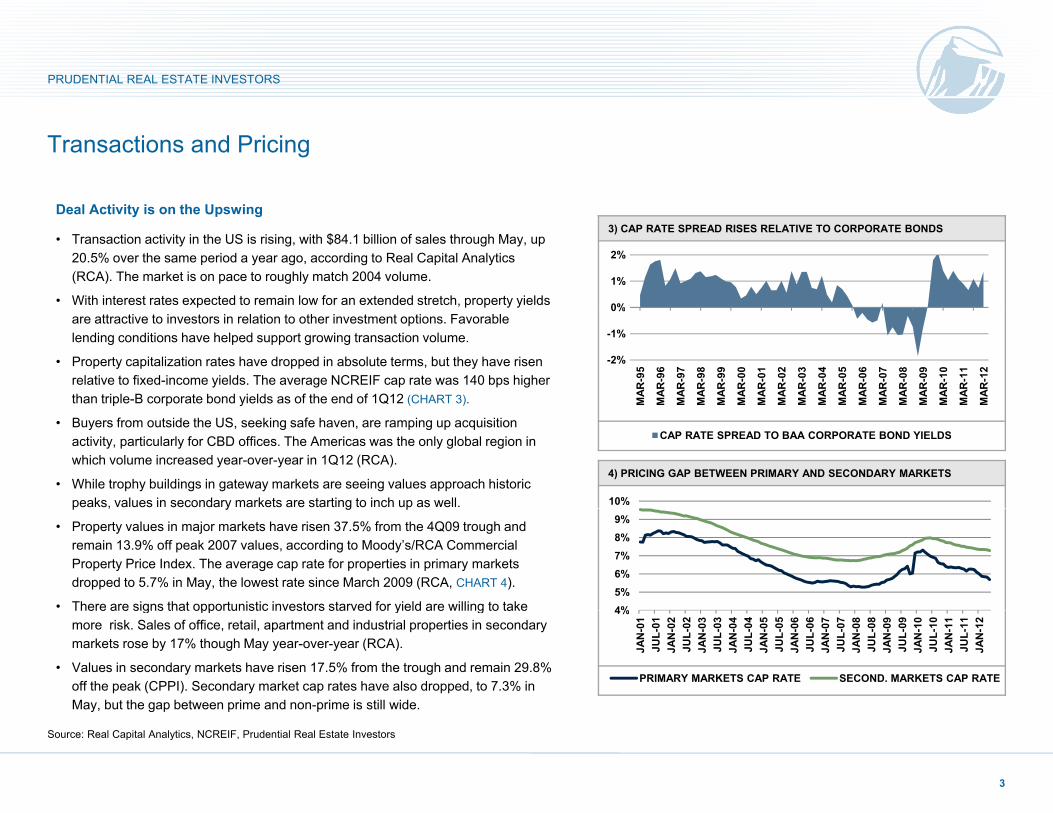
• Transaction activity in the US is rising, with $84.1 billion of sales through May, up 20.5% over the same period a year ago, according to Real Capital Analytics (RCA). The market is on pace to roughly match 2004 volume.
• With interest rates expected to remain low for an extended stretch, property yields 0%
1%
2%
p , p p y yare attractive to investors in relation to other investment options. Favorable lending conditions have helped support growing transaction volume.
• Property capitalization rates have dropped in absolute terms, but they have risen relative to fixed-income yields. The average NCREIF cap rate was 140 bps higher than triple-B corporate bond yields as of the end of 1Q12 (CHART 3).
-2%
-1%
0%
MAR
-95
MAR
-96
MAR
-97
MAR
-98
MAR
-99
MAR
-00
MAR
-01
MAR
-02
MAR
-03
MAR
-04
MAR
-05
MAR
-06
MAR
-07
MAR
-08
MAR
-09
MAR
-10
MAR
-11
MAR
-12
4) PRICING GAP BETWEEN PRIMARY AND SECONDARY MARKETS
• Buyers from outside the US, seeking safe haven, are ramping up acquisition activity, particularly for CBD offices. The Americas was the only global region in which volume increased year-over-year in 1Q12 (RCA).
• While trophy buildings in gateway markets are seeing values approach historic peaks, values in secondary markets are starting to inch up as well.
CAP RATE SPREAD TO BAA CORPORATE BOND YIELDS
10%p , y g p
• Property values in major markets have risen 37.5% from the 4Q09 trough and remain 13.9% off peak 2007 values, according to Moody’s/RCA Commercial Property Price Index. The average cap rate for properties in primary markets dropped to 5.7% in May, the lowest rate since March 2009 (RCA, CHART 4).
• There are signs that opportunistic investors starved for yield are willing to take 4%5%6%7%8%9%
There are signs that opportunistic investors starved for yield are willing to take more risk. Sales of office, retail, apartment and industrial properties in secondary markets rose by 17% though May year-over-year (RCA).
• Values in secondary markets have risen 17.5% from the trough and remain 29.8% off the peak (CPPI). Secondary market cap rates have also dropped, to 7.3% in May, but the gap between prime and non-prime is still wide.
4%
JAN
-01
JUL-
01JA
N-0
2JU
L-02
JAN
-03
JUL-
03JA
N-0
4JU
L-04
JAN
-05
JUL-
05JA
N-0
6JU
L-06
JAN
-07
JUL-
07JA
N-0
8JU
L-08
JAN
-09
JUL-
09JA
N-1
0JU
L-10
JAN
-11
JUL-
11JA
N-1
2
PRIMARY MARKETS CAP RATE SECOND. MARKETS CAP RATE
3
Source: Real Capital Analytics, NCREIF, Prudential Real Estate Investors
PRUDENTIAL REAL ESTATE INVESTORS
Debt Markets
Low Interest Rates Fueling Favorable Debt Conditions
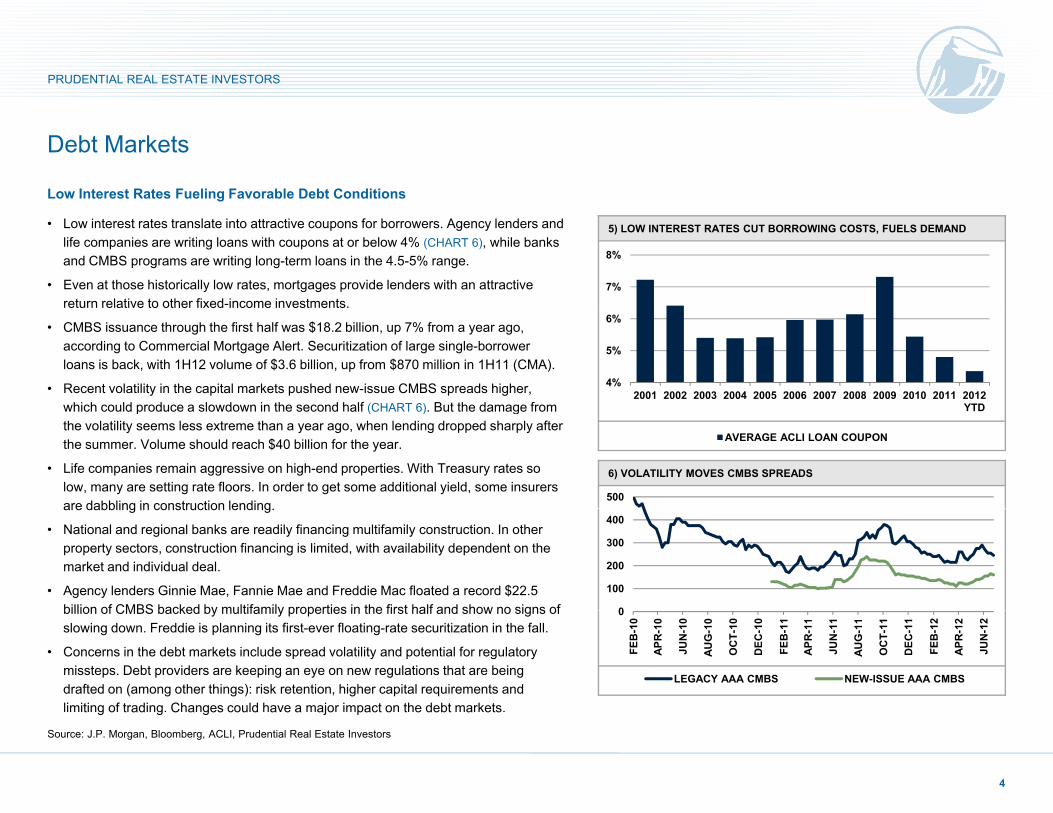
5) LOW INTEREST RATES CUT BORROWING COSTS, FUELS DEMAND• Low interest rates translate into attractive coupons for borrowers. Agency lenders and life companies are writing loans with coupons at or below 4% (CHART 6), while banks and CMBS programs are writing long-term loans in the 4.5-5% range.
• Even at those historically low rates, mortgages provide lenders with an attractive return relative to other fixed-income investments
7%
8%
return relative to other fixed income investments.
• CMBS issuance through the first half was $18.2 billion, up 7% from a year ago, according to Commercial Mortgage Alert. Securitization of large single-borrower loans is back, with 1H12 volume of $3.6 billion, up from $870 million in 1H11 (CMA).
• Recent volatility in the capital markets pushed new-issue CMBS spreads higher, which could produce a slowdown in the second half (CHART 6) But the damage from
4%
5%
6%
2001 2002 2003 2004 2005 2006 2007 2008 2009 2010 2011 2012 YTD
6) VOLATILITY MOVES CMBS SPREADS
which could produce a slowdown in the second half (CHART 6). But the damage from the volatility seems less extreme than a year ago, when lending dropped sharply after the summer. Volume should reach $40 billion for the year.
• Life companies remain aggressive on high-end properties. With Treasury rates so low, many are setting rate floors. In order to get some additional yield, some insurers are dabbling in construction lending
500
YTD
AVERAGE ACLI LOAN COUPON
are dabbling in construction lending.
• National and regional banks are readily financing multifamily construction. In other property sectors, construction financing is limited, with availability dependent on the market and individual deal.
• Agency lenders Ginnie Mae, Fannie Mae and Freddie Mac floated a record $22.5 billion of CMBS backed by multifamily properties in the first half and show no signs of 0
100
200
300
400
billion of CMBS backed by multifamily properties in the first half and show no signs of slowing down. Freddie is planning its first-ever floating-rate securitization in the fall.
• Concerns in the debt markets include spread volatility and potential for regulatory missteps. Debt providers are keeping an eye on new regulations that are being drafted on (among other things): risk retention, higher capital requirements and limiting of trading. Changes could have a major impact on the debt markets.
0
FEB
-10
APR
-10
JUN
-10
AUG
-10
OC
T-10
DEC
-10
FEB
-11
APR
-11
JUN
-11
AUG
-11
OC
T-11
DEC
-11
FEB
-12
APR
-12
JUN
-12
LEGACY AAA CMBS NEW-ISSUE AAA CMBS
4
Source: J.P. Morgan, Bloomberg, ACLI, Prudential Real Estate Investors
t g o t ad g C a ges cou d a e a ajo pact o t e debt a ets
PRUDENTIAL REAL ESTATE INVESTORS
REIT Market
7) INVESTORS TARGETING REIT FUNDSREITs Remain Attractive to Investors
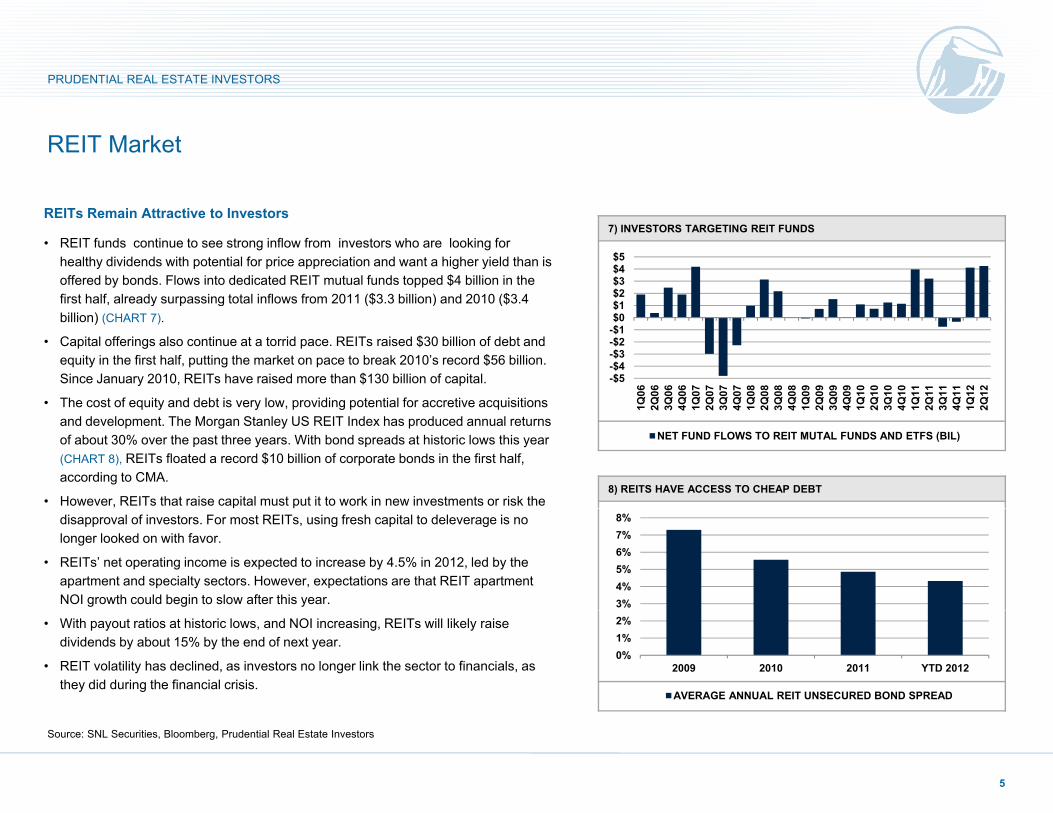
• REIT funds continue to see strong inflow from investors who are looking for healthy dividends with potential for price appreciation and want a higher yield than is offered by bonds. Flows into dedicated REIT mutual funds topped $4 billion in the first half, already surpassing total inflows from 2011 ($3.3 billion) and 2010 ($3.4 $1
$2$3$4$5
, y p g ( ) (billion) (CHART 7).
• Capital offerings also continue at a torrid pace. REITs raised $30 billion of debt and equity in the first half, putting the market on pace to break 2010’s record $56 billion. Since January 2010, REITs have raised more than $130 billion of capital.
• The cost of equity and debt is very low, providing potential for accretive acquisitions
-$5-$4-$3-$2-$1$0$1
1Q06
2Q06
3Q06
4Q06
1Q07
2Q07
3Q07
4Q07
1Q08
2Q08
3Q08
4Q08
1Q09
2Q09
3Q09
4Q09
1Q10
2Q10
3Q10
4Q10
1Q11
2Q11
3Q11
4Q11
1Q12
2Q12
The cost of equity and debt is very low, providing potential for accretive acquisitions and development. The Morgan Stanley US REIT Index has produced annual returns of about 30% over the past three years. With bond spreads at historic lows this year (CHART 8), REITs floated a record $10 billion of corporate bonds in the first half, according to CMA.
• However, REITs that raise capital must put it to work in new investments or risk the 8) REITS HAVE ACCESS TO CHEAP DEBT
1 2 3 4 1 2 3 4 1 2 3 4 1 2 3 4 1 2 3 4 1 2 3 4 1 2
NET FUND FLOWS TO REIT MUTAL FUNDS AND ETFS (BIL)
disapproval of investors. For most REITs, using fresh capital to deleverage is no longer looked on with favor.
• REITs’ net operating income is expected to increase by 4.5% in 2012, led by the apartment and specialty sectors. However, expectations are that REIT apartment NOI growth could begin to slow after this year. 3%
4%5%6%7%8%
• With payout ratios at historic lows, and NOI increasing, REITs will likely raise dividends by about 15% by the end of next year.
• REIT volatility has declined, as investors no longer link the sector to financials, as they did during the financial crisis.
0%1%2%
2009 2010 2011 YTD 2012
AVERAGE ANNUAL REIT UNSECURED BOND SPREAD
5
Source: SNL Securities, Bloomberg, Prudential Real Estate Investors
PRUDENTIAL REAL ESTATE INVESTORS
Property Markets
A t t St D d Sh ld Ab b S l i th Pi li9) APARTMENT VACANCIES TO REMAIN LOW
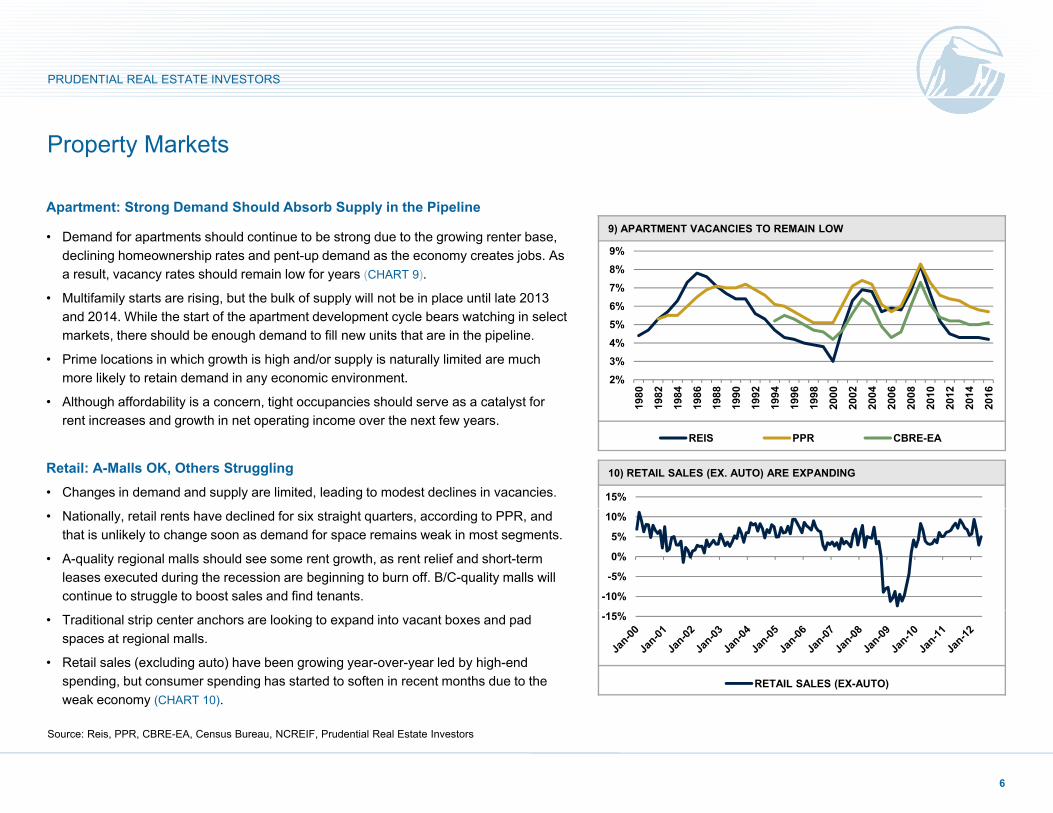
Apartment: Strong Demand Should Absorb Supply in the Pipeline
• Demand for apartments should continue to be strong due to the growing renter base, declining homeownership rates and pent-up demand as the economy creates jobs. As a result, vacancy rates should remain low for years (CHART 9).
• Multifamily starts are rising, but the bulk of supply will not be in place until late 2013 6%7%
8%9%
y g yand 2014. While the start of the apartment development cycle bears watching in select markets, there should be enough demand to fill new units that are in the pipeline.
• Prime locations in which growth is high and/or supply is naturally limited are much more likely to retain demand in any economic environment.
• Although affordability is a concern, tight occupancies should serve as a catalyst for
2%3%4%
5%6%
1980
1982
1984
1986
1988
1990
1992
1994
1996
1998
2000
2002
2004
2006
2008
2010
2012
2014
2016
10) RETAIL SALES (EX. AUTO) ARE EXPANDING
g y , g p yrent increases and growth in net operating income over the next few years.
Retail: A-Malls OK, Others Struggling• Changes in demand and supply are limited, leading to modest declines in vacancies.
1 1 1 1 1 1 1 1 1 1 2 2 2 2 2 2 2 2 2
REIS PPR CBRE-EA
15%
• Nationally, retail rents have declined for six straight quarters, according to PPR, and that is unlikely to change soon as demand for space remains weak in most segments.
• A-quality regional malls should see some rent growth, as rent relief and short-term leases executed during the recession are beginning to burn off. B/C-quality malls will continue to struggle to boost sales and find tenants. -10%
-5%
0%
5%
10%
• Traditional strip center anchors are looking to expand into vacant boxes and pad spaces at regional malls.
• Retail sales (excluding auto) have been growing year-over-year led by high-end spending, but consumer spending has started to soften in recent months due to the weak economy (CHART 10).
-15%
RETAIL SALES (EX-AUTO)
6
Source: Reis, PPR, CBRE-EA, Census Bureau, NCREIF, Prudential Real Estate Investors
PRUDENTIAL REAL ESTATE INVESTORS
Property Markets
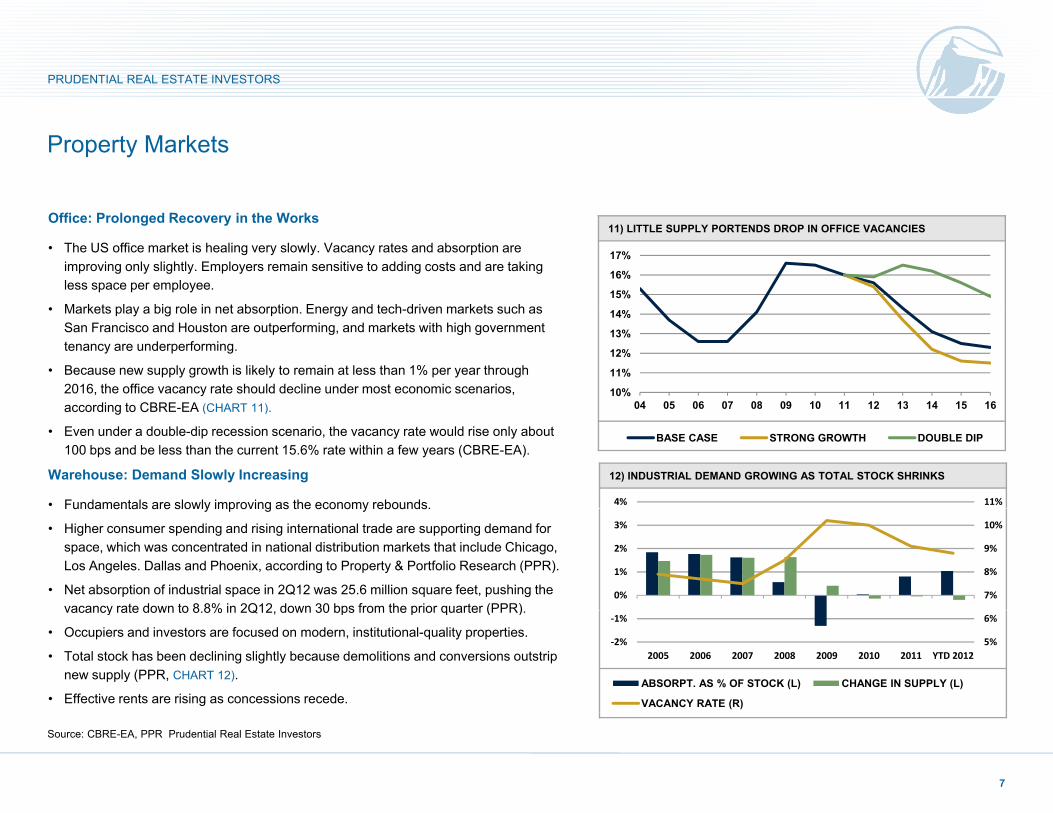
Office: Prolonged Recovery in the Works
• The US office market is healing very slowly. Vacancy rates and absorption are improving only slightly. Employers remain sensitive to adding costs and are taking less space per employee.
M k t l bi l i t b ti E d t h d i k t h
11) LITTLE SUPPLY PORTENDS DROP IN OFFICE VACANCIES
15%
16%
17%
• Markets play a big role in net absorption. Energy and tech-driven markets such as San Francisco and Houston are outperforming, and markets with high government tenancy are underperforming.
• Because new supply growth is likely to remain at less than 1% per year through 2016, the office vacancy rate should decline under most economic scenarios, according to CBRE EA (CHART 11)
10%
11%
12%
13%
14%
04 05 06 07 08 09 10 11 12 13 14 15 16
12) INDUSTRIAL DEMAND GROWING AS TOTAL STOCK SHRINKS
according to CBRE-EA (CHART 11).
• Even under a double-dip recession scenario, the vacancy rate would rise only about 100 bps and be less than the current 15.6% rate within a few years (CBRE-EA).
Warehouse: Demand Slowly Increasing
• Fundamentals are slowly improving as the economy rebounds.
04 05 06 07 08 09 10 11 12 13 14 15 16
BASE CASE STRONG GROWTH DOUBLE DIP
11%4%Fundamentals are slowly improving as the economy rebounds.
• Higher consumer spending and rising international trade are supporting demand for space, which was concentrated in national distribution markets that include Chicago, Los Angeles. Dallas and Phoenix, according to Property & Portfolio Research (PPR).
• Net absorption of industrial space in 2Q12 was 25.6 million square feet, pushing the vacancy rate down to 8 8% in 2Q12 down 30 bps from the prior quarter (PPR)
7%
8%
9%
10%
0%
1%
2%
3%
vacancy rate down to 8.8% in 2Q12, down 30 bps from the prior quarter (PPR).
• Occupiers and investors are focused on modern, institutional-quality properties.
• Total stock has been declining slightly because demolitions and conversions outstrip new supply (PPR, CHART 12).
• Effective rents are rising as concessions recede.
5%
6%
-2%
-1%
2005 2006 2007 2008 2009 2010 2011 YTD 2012
ABSORPT. AS % OF STOCK (L) CHANGE IN SUPPLY (L)
VACANCY RATE (R)
7
Source: CBRE-EA, PPR Prudential Real Estate Investors
PRUDENTIAL REAL ESTATE INVESTORS
Property Markets
C13) OCCUPANCY HAS SURGED, SUPPLY LIMITED BUT WILL RISE
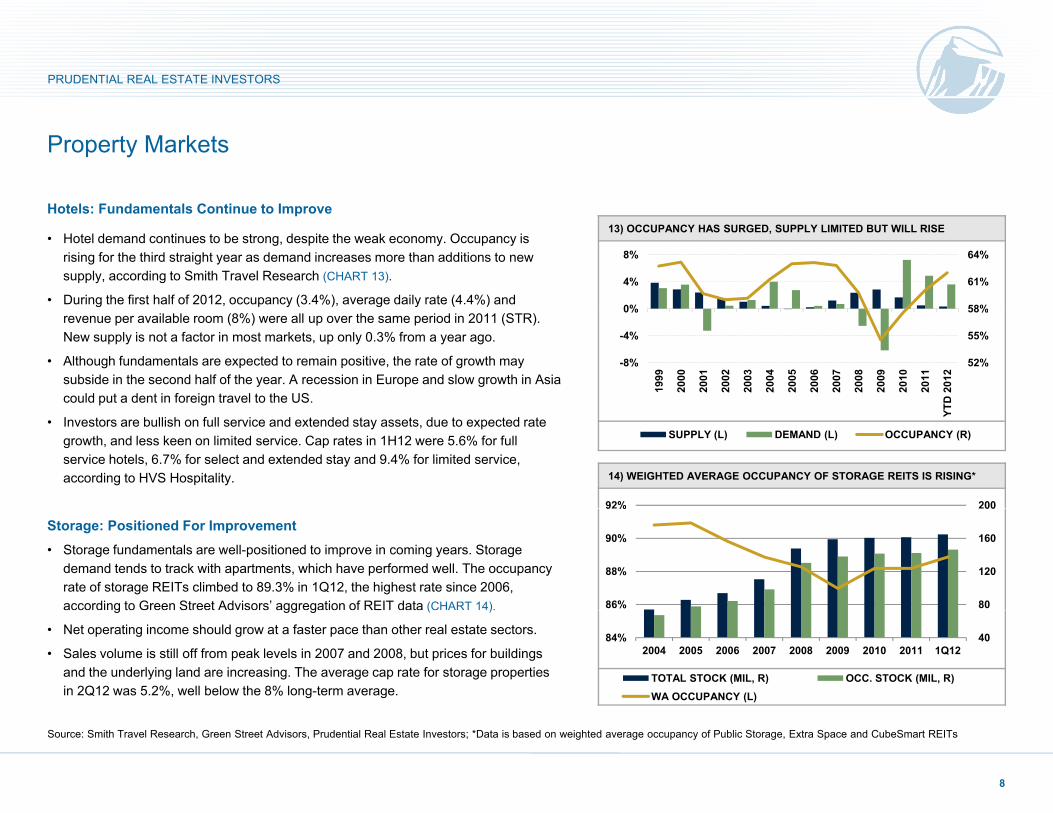
Hotels: Fundamentals Continue to Improve
• Hotel demand continues to be strong, despite the weak economy. Occupancy is rising for the third straight year as demand increases more than additions to new supply, according to Smith Travel Research (CHART 13).
• During the first half of 2012, occupancy (3.4%), average daily rate (4.4%) and 58%
61%
64%
0%
4%
8%
g , p y ( ), g y ( )revenue per available room (8%) were all up over the same period in 2011 (STR). New supply is not a factor in most markets, up only 0.3% from a year ago.
• Although fundamentals are expected to remain positive, the rate of growth may subside in the second half of the year. A recession in Europe and slow growth in Asia could put a dent in foreign travel to the US.
52%
55%
58%
-8%
-4%
0%
1999
2000
2001
2002
2003
2004
2005
2006
2007
2008
2009
2010
2011
TD 2
012
14) WEIGHTED AVERAGE OCCUPANCY OF STORAGE REITS IS RISING*
• Investors are bullish on full service and extended stay assets, due to expected rate growth, and less keen on limited service. Cap rates in 1H12 were 5.6% for full service hotels, 6.7% for select and extended stay and 9.4% for limited service, according to HVS Hospitality.
YT
SUPPLY (L) DEMAND (L) OCCUPANCY (R)
200 92%
Storage: Positioned For Improvement• Storage fundamentals are well-positioned to improve in coming years. Storage
demand tends to track with apartments, which have performed well. The occupancy rate of storage REITs climbed to 89.3% in 1Q12, the highest rate since 2006, according to Green Street Advisors’ aggregation of REIT data (CHART 14). 80
120
160
00
86%
88%
90%
9 %
g gg g ( )
• Net operating income should grow at a faster pace than other real estate sectors.
• Sales volume is still off from peak levels in 2007 and 2008, but prices for buildings and the underlying land are increasing. The average cap rate for storage properties in 2Q12 was 5.2%, well below the 8% long-term average.
40 84%2004 2005 2006 2007 2008 2009 2010 2011 1Q12
TOTAL STOCK (MIL, R) OCC. STOCK (MIL, R)WA OCCUPANCY (L)
8
Source: Smith Travel Research, Green Street Advisors, Prudential Real Estate Investors; *Data is based on weighted average occupancy of Public Storage, Extra Space and CubeSmart REITs
PRUDENTIAL REAL ESTATE INVESTORS
Investment Performance
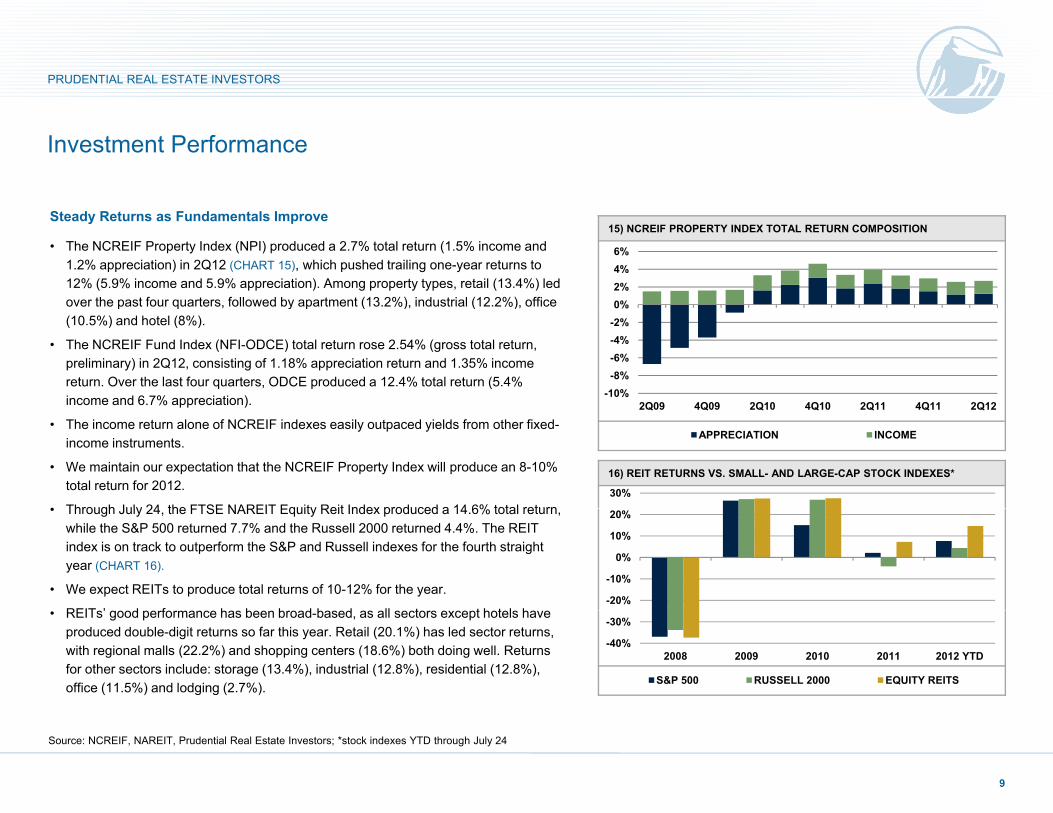
15) NCREIF PROPERTY INDEX TOTAL RETURN COMPOSITIONSteady Returns as Fundamentals Improve
• The NCREIF Property Index (NPI) produced a 2.7% total return (1.5% income and 1.2% appreciation) in 2Q12 (CHART 15), which pushed trailing one-year returns to 12% (5.9% income and 5.9% appreciation). Among property types, retail (13.4%) led over the past four quarters, followed by apartment (13.2%), industrial (12.2%), office 0%
2%4%6%
over the past four quarters, followed by apartment (13.2%), industrial (12.2%), office (10.5%) and hotel (8%).
• The NCREIF Fund Index (NFI-ODCE) total return rose 2.54% (gross total return, preliminary) in 2Q12, consisting of 1.18% appreciation return and 1.35% income return. Over the last four quarters, ODCE produced a 12.4% total return (5.4% income and 6.7% appreciation). -10%
-8%-6%-4%-2%0%
2Q09 4Q09 2Q10 4Q10 2Q11 4Q11 2Q12
16) REIT RETURNS VS. SMALL- AND LARGE-CAP STOCK INDEXES*
pp )
• The income return alone of NCREIF indexes easily outpaced yields from other fixed-income instruments.
• We maintain our expectation that the NCREIF Property Index will produce an 8-10% total return for 2012.
• Through July 24 the FTSE NAREIT Equity Reit Index produced a 14 6% total return30%
2Q09 4Q09 2Q10 4Q10 2Q11 4Q11 2Q12
APPRECIATION INCOME
• Through July 24, the FTSE NAREIT Equity Reit Index produced a 14.6% total return, while the S&P 500 returned 7.7% and the Russell 2000 returned 4.4%. The REIT index is on track to outperform the S&P and Russell indexes for the fourth straight year (CHART 16).
• We expect REITs to produce total returns of 10-12% for the year.
REIT ’ d f h b b d b d ll t t h t l h-20%
-10%
0%
10%
20%
• REITs’ good performance has been broad-based, as all sectors except hotels have produced double-digit returns so far this year. Retail (20.1%) has led sector returns, with regional malls (22.2%) and shopping centers (18.6%) both doing well. Returns for other sectors include: storage (13.4%), industrial (12.8%), residential (12.8%), office (11.5%) and lodging (2.7%).
-40%
-30%
2008 2009 2010 2011 2012 YTD
S&P 500 RUSSELL 2000 EQUITY REITS
9
Source: NCREIF, NAREIT, Prudential Real Estate Investors; *stock indexes YTD through July 24
PRUDENTIAL REAL ESTATE INVESTORS
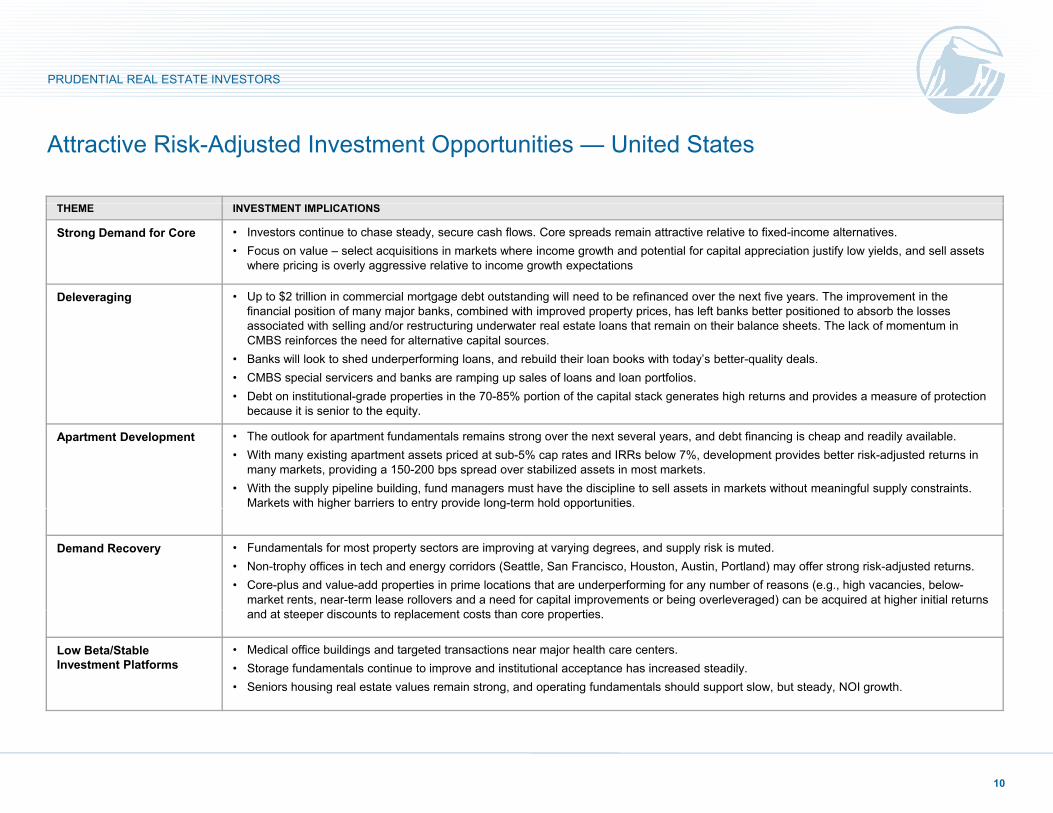
Attractive Risk-Adjusted Investment Opportunities — United States
THEME INVESTMENT IMPLICATIONS
Strong Demand for Core • Investors continue to chase steady, secure cash flows. Core spreads remain attractive relative to fixed-income alternatives.• Focus on value – select acquisitions in markets where income growth and potential for capital appreciation justify low yields, and sell assets
where pricing is overly aggressive relative to income growth expectations
Deleveraging • Up to $2 trillion in commercial mortgage debt outstanding will need to be refinanced over the next five years. The improvement in the financial position of many major banks, combined with improved property prices, has left banks better positioned to absorb the losses associated with selling and/or restructuring underwater real estate loans that remain on their balance sheets. The lack of momentum in CMBS reinforces the need for alternative capital sources.
• Banks will look to shed underperforming loans, and rebuild their loan books with today’s better-quality deals. • CMBS special servicers and banks are ramping up sales of loans and loan portfolios. • Debt on institutional-grade properties in the 70-85% portion of the capital stack generates high returns and provides a measure of protection
b it i i t th itbecause it is senior to the equity.
Apartment Development • The outlook for apartment fundamentals remains strong over the next several years, and debt financing is cheap and readily available. • With many existing apartment assets priced at sub-5% cap rates and IRRs below 7%, development provides better risk-adjusted returns in
many markets, providing a 150-200 bps spread over stabilized assets in most markets.• With the supply pipeline building, fund managers must have the discipline to sell assets in markets without meaningful supply constraints.
Markets with higher barriers to entry provide long-term hold opportunities.g y p g pp
Demand Recovery • Fundamentals for most property sectors are improving at varying degrees, and supply risk is muted. • Non-trophy offices in tech and energy corridors (Seattle, San Francisco, Houston, Austin, Portland) may offer strong risk-adjusted returns.• Core-plus and value-add properties in prime locations that are underperforming for any number of reasons (e.g., high vacancies, below-
market rents, near-term lease rollovers and a need for capital improvements or being overleveraged) can be acquired at higher initial returns d t t di t t l t t th tiand at steeper discounts to replacement costs than core properties.
Low Beta/Stable Investment Platforms
• Medical office buildings and targeted transactions near major health care centers.• Storage fundamentals continue to improve and institutional acceptance has increased steadily. • Seniors housing real estate values remain strong, and operating fundamentals should support slow, but steady, NOI growth.
10
PRUDENTIAL REAL ESTATE INVESTORS
Important Disclosure clients or prospects. For any securities or financial instruments mentioned
Disclaimer
These materials represent the views, opinions and recommendations of the author(s) regarding the economic conditions, asset classes, securities, issuers or financial instruments referenced herein. Distribution of this information to any person other than the person to whom it was originally delivered and to such person’s advisers is unauthorized, and any reproduction of these materials, in whole or in part or the divulgence of any of the contents hereof without prior
herein, the recipient(s) of this report must make its own independent decisions.
Conflicts of Interest: Key research team staff may be participating voting members of certain PREI fund and/or product investment committees with respect to decisions made on underlying investments or transactions. In addition, research personnel may receive incentive compensation based upon the overall performance of the organization itself and certain investment fundswhole or in part, or the divulgence of any of the contents hereof, without prior
consent of Prudential Real Estate Investors is prohibited. Certain information contained herein has been obtained from sources that PREI® believes to be reliable as of the date presented; however, PREI cannot guarantee the accuracy of such information, assure its completeness, or warrant such information will not be changed. The information contained herein is current as of the date of issuance (or such earlier date as referenced herein) and is
the overall performance of the organization itself and certain investment funds or products. At the date of issue, PREI and/or affiliates may be buying, selling, or holding significant positions in real estate, including publicly traded real estate securities. PREI affiliates may develop and publish research that is independent of, and different than, the recommendations contained herein. PREI personnel other than the author(s), such as sales, marketing and trading personnel, may provide oral or written market commentary or ideas to PREI’s
subject to change without notice. PREI has no obligation to update any or all of such information; nor do we make any express or implied warranties or representations as to the completeness or accuracy or accept responsibility for errors. These materials are not intended as an offer or solicitation with respect to the purchase or sale of any security or other financial instrument or any investment management services and should not be used as the basis for any investment decision Past performance is no
p , y p yclients or prospects or proprietary investment ideas that differ from the views expressed herein. Additional information regarding actual and potential conflicts of interest is available in Part II of PIM’s Form ADV.
Prudential Investment Management is the primary asset management business of Prudential Financial, Inc. Prudential Real Estate Investors is Prudential I M ’ l i d i b i dused as the basis for any investment decision. Past performance is no
guarantee or reliable indicator of future results. No liability whatsoever is accepted for any loss (whether direct, indirect, or consequential) that may arise from any use of the information contained in or derived from this report. PREI and its affiliates may make investment decisions that are inconsistent with the recommendations or views expressed herein, including for proprietary accounts of PREI or its affiliates.
Investment Management’s real estate investment advisory business and operates through Prudential Investment Management, Inc. (PIM), a registered investment advisor. Prudential, the Prudential logo and the Rock symbol are service marks of Prudential Financial, Inc. and its related entities, registered in many jurisdictions worldwide.
REF: # PFIA – 8WJQX6including for proprietary accounts of PREI or its affiliates.
The opinions and recommendations herein do not take into account individual client circumstances, objectives, or needs and are not intended as recommendations of particular securities, financial instruments or strategies to particular clients or prospects. No determination has been made regarding the suitability of any securities, financial instruments or strategies for particular
REF: # PFIA – 8WJQX6
11


![Poster Session 1 Tuesday, 17 September - 17.25-19.00 Giralda€¦ · Poster Session 1 Tuesday, 17 September - 17.25-19.00 Giralda [P1.1.1] Nutritional evaluation of gluten-free foods](https://img.dokumen.tips/doc/110x75/5eb4ca9c3eeecf0ae01fb17d/poster-session-1-tuesday-17-september-1725-1900-giralda-poster-session-1-tuesday.jpg)